
Phase Transformation Pathway of DyPO4 to 21.5 GPa

Department of Metallurgical and Materials Engineering, Colorado School of Mines, Golden, CO 80401, USA
*
Author to whom correspondence should be addressed.
Crystals 2023, 13(2), 249; https://0-doi-org.brum.beds.ac.uk/10.3390/cryst13020249
Submission received: 30 December 2022
/
Revised: 23 January 2023
/
Accepted: 27 January 2023
/
Published: 1 February 2023
(This article belongs to the Special Issue Pressure-Induced Phase Transformations (Volume II))
Abstract
:Interest in the deformation behavior and phase transformations of rare earth orthophosphates (REPO4s) spans several fields of science—from geological impact analysis to ceramic matrix composite engineering. In this study, the phase behavior of polycrystalline, xenotime DyPO4 is studied up to 21.5(16) GPa at ambient temperature using in situ diamond anvil cell synchrotron X-ray diffraction. This experiment reveals a large xenotime–monazite phase coexistence pressure range of 7.6(15) GPa and evidence for the onset of a post-monazite transformation at 13.9(10) GPa to scheelite. The identification of scheelite as the post-monazite phase of DyPO4, though not definitive, is consistent with REPO4 phase transformation pathways reported in both the experimental and the computational literature.
1. Introduction
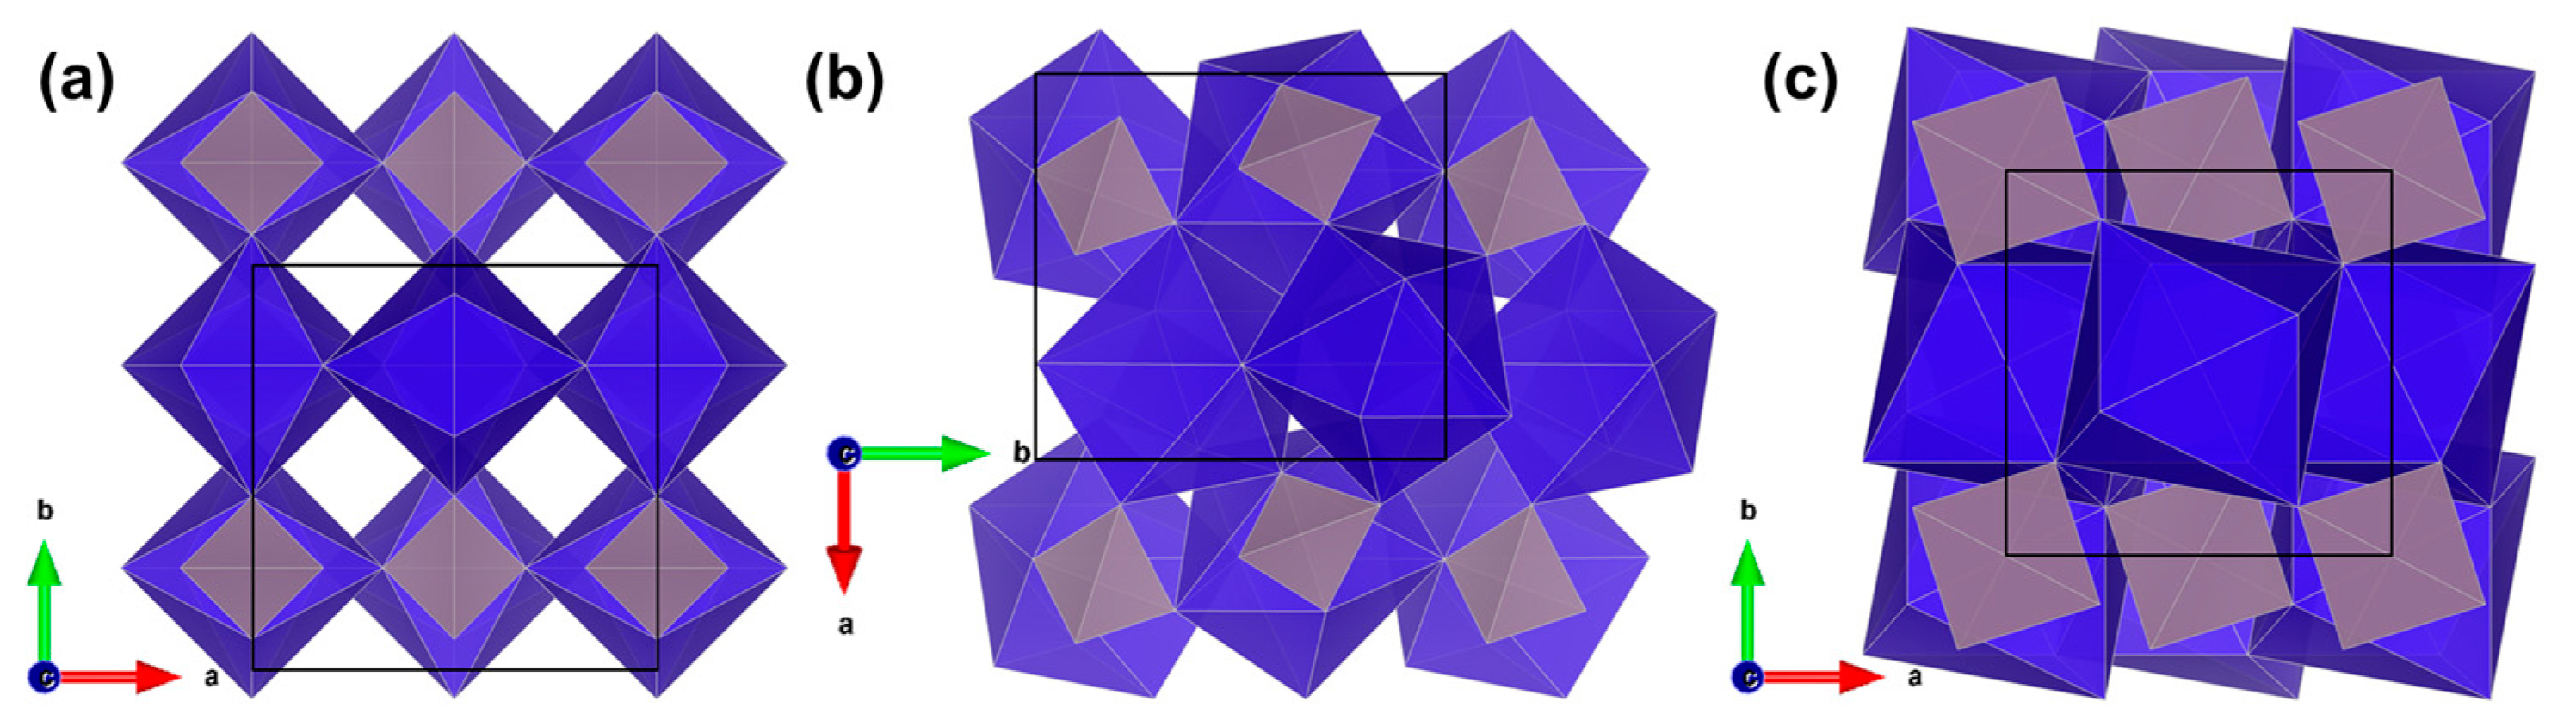
Rare earth orthophosphates (REPO4s) are highly refractory and insoluble ceramics relevant to various research areas ranging from geoscience to structural ceramics [1]. Much of the world’s rare earth element supply comes from naturally occurring xenotime and monazite minerals, whose properties and formation are of great relevance in geochronology and geothermobarometry [2,3] in addition to mineral extraction. The pressure-induced phase transformations of certain REPO4 compositions have also spurred research toward their use as fiber coatings, where they can confer additional plasticity and toughening mechanisms to oxide–oxide ceramic matrix composites [4,5,6]. At ambient pressure (~10−4 GPa), REPO4s adopt either the xenotime (tetragonal, I41/amd) or monazite (monoclinic, P21/n) structure. The xenotime structure is also referred to as “zircon” (based on ZrSiO4); however, this study employs the former name because it specifically originates from YPO4 minerals [1]. At high pressures, xenotime compositions transform into the monazite or scheelite (tetragonal, I41/a) structures (see Figure 1) [7]. The scheelite-type structure has also been observed in other ABO4 materials (e.g., tungstates, molybdates, vanadates, and arsenates) [8,9,10]. The REPO4 xenotime, monazite, and scheelite structures feature chains of alternating PO4 tetrahedra (shown in gray) and RE-O polyhedra (shown in violet) with RE-O coordination numbers of 8, 9, and 8, respectively.
Figure 1 shows that the REPO4 structure becomes increasingly compact when transforming from xenotime to monazite to scheelite. This compaction can be attributed to increasing rotation and displacement of the RE-O polyhedra and resultant changes in the phosphate chain linkages (edge-sharing → corner-sharing) [10]. Although the exact unit cell volume losses during these transformations are composition-dependent, the loss associated with the xenotime → monazite transformation is significantly lower than that of the monazite → scheelite transformation [12]. This disparity likely emerges from the fact that the former transformation involves an increase in RE-O coordination (8 → 9), while the latter involves a decrease (9 → 8) [10]. An intermediate anhydrite (orthorhombic, Amma) phase has also been reported in certain xenotime compositions prior to the emergence of monazite when the xenotime composition is subject to high deviatoric stresses (e.g., TbPO4 [13]) or has a composition that is extremely close to the 1 atm (~10−4 GPa) xenotime–monazite phase boundary (e.g., GdxTb1-xPO4 [14]).
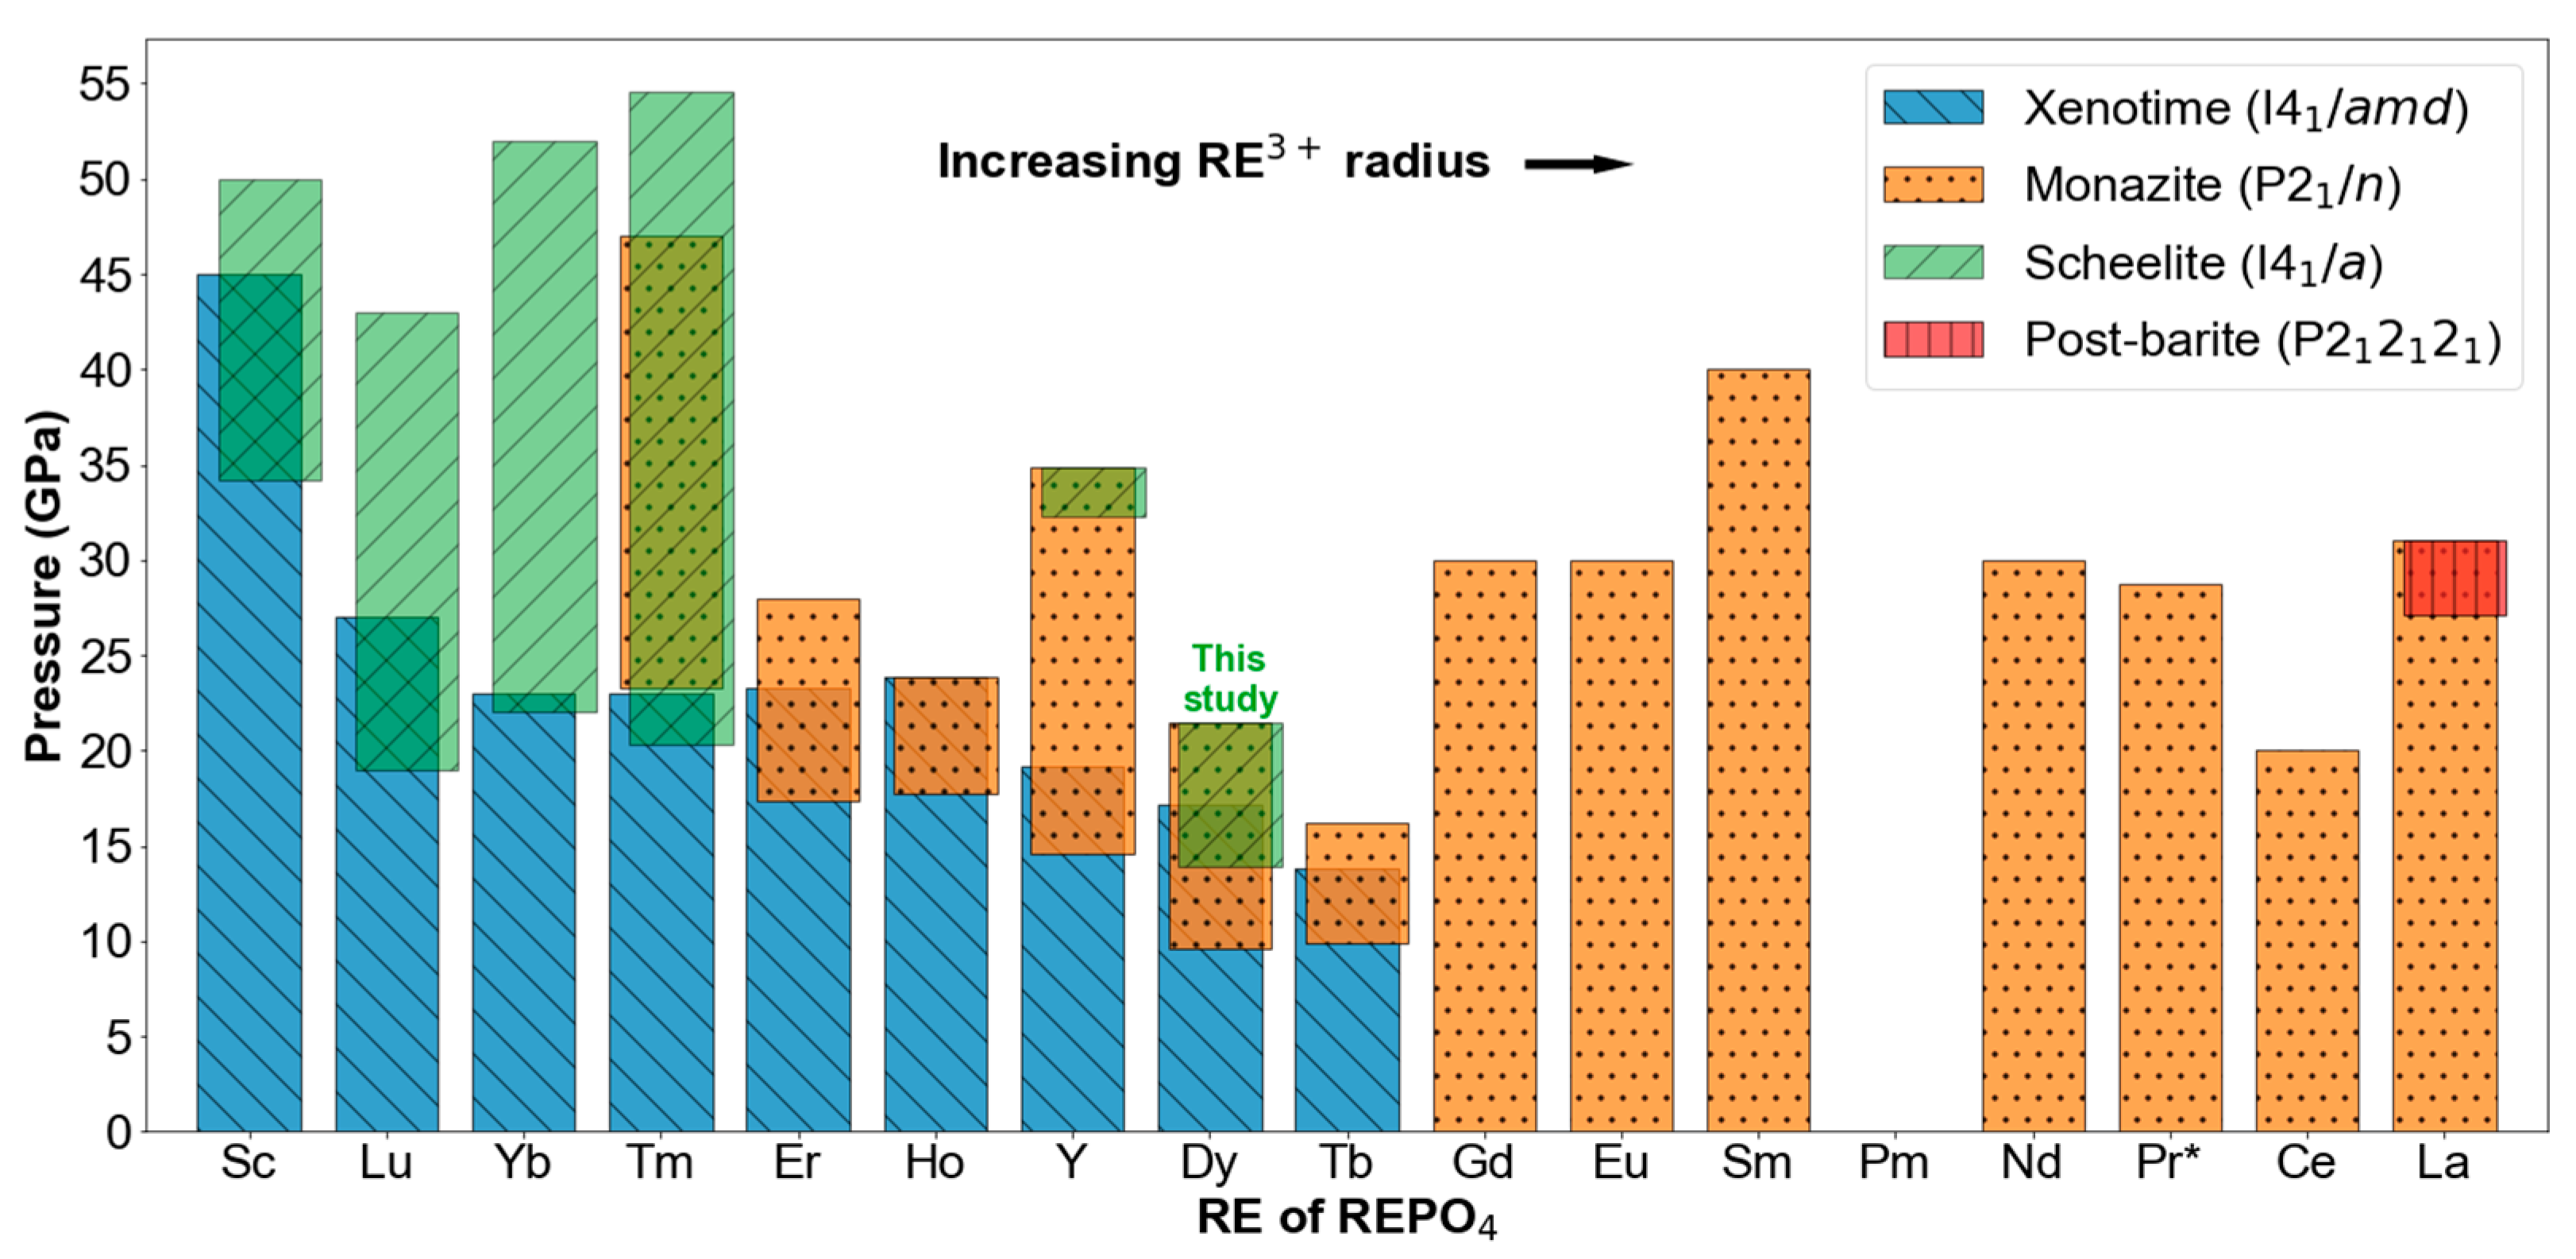
Prior studies and reviews have reported phase diagrams showing REPO4 transformation pressures based on a variety of computational and experimental techniques [5,15,16,17,18]. Recent advancements in in situ diamond anvil cell (DAC) X-ray diffraction (XRD) experiments require updating the high-pressure REPO4 phase map [12,18,19,20,21,22,23,24,25]. In contrast to Raman spectroscopy and ab initio calculations, XRD provides more direct, crystallographic proof of the existence of REPO4 phases and phase transformations. Figure 2 compiles experimentally observed phase data from DAC XRD studies for all non-radioactive, single-RE compositions except PrPO4, which has only been studied thus far using DAC Raman spectroscopy [26].
Under hydrostatic conditions, the xenotime → monazite transformation has been reported in ErPO4, HoPO4, YPO4, DyPO4, and TbPO4 with onset pressures (Ponset) of 17.3 GPa, 17.7 GPa, 14.6 GPa, 9.1(1) GPa, and 9.9 GPa, respectively [12,20,21,22,23]. We note that for any number followed by a number in parentheses, the number in parentheses represents the standard deviation of the last digit of the number before the parentheses. In the REPO4 phase transformation literature, there has long been an assumption that the xenotime → monazite Ponset varies linearly with RE3+ radius, such as many other properties of REPO4s [5]. However, the DyPO4 Ponset of 9.1(1) GPa from our 2021 study [22] disrupts this trend, suggesting instead that xenotime → monazite Ponset values fall into two clusters: a high-pressure one around ~16 GPa (ErPO4, HoPO4, and YPO4) and another that is <10 GPa (DyPO4 and TbPO4). Alloyed compositions of GdxDy(1-x)PO4 and GdxTb(1−x)PO4 also have transformation pressures that fall within the lower-pressure group, without following a trend with average RE3+ radius [5,14,27]. Neither thermodynamic properties (e.g., enthalpies of formation) nor structural properties (e.g., bond lengths and angles) show significant discontinuities between YPO4 and DyPO4, yet these compositions’ Ponset values are known to differ by at least 5.5 GPa [7,28,29,30,31].
The xenotime → monazite transformation in REPO4s has also been described as sluggish and kinetically limited due to the experimentally observed xenotime–monazite phase coexistence being inconsistent with thermodynamic expectations (i.e., Gibbs phase rule) [12,22,23]; this is shown in Figure 2 as the regions where blue and orange bars overlap. The xenotime–monazite phase coexistence ranges for ErPO4, YPO4, and TbPO4 are 6 GPa, 4.6 GPa, and 3.9 GPa, respectively [12,20,23]. In prior experiments, HoPO4 and DyPO4 were not taken to high enough pressures to capture the full xenotime–monazite coexistence range [21,22].
Other xenotime compositions with smaller RE3+ radii undergo the xenotime → scheelite transformation, which involves no change in RE-O coordination number. ScPO4, LuPO4, and YbPO4 transform directly to the scheelite structure at Ponset values of 34.2 GPa, 19 GPa, and 22 GPa, respectively [12,19]. Their respective xenotime–scheelite phase coexistence ranges (represented by overlap of green and blue bars in Figure 2) are 10.8 GPa, 8 GPa, and 1 GPa, indicating kinetic limitations similar to the xenotime → monazite transformation [12,19].
TmPO4, as described by Stavrou et al., represents a “borderline case” between xenotime compositions that transform to monazite and those that transform to scheelite [18]. In TmPO4, the xenotime → scheelite transformation begins at 20.3 GPa, and these two phases coexist over a 2.7 GPa range. Immediately after the disappearance of xenotime at 23 GPa, monazite emerges at 23.3 GPa and coexists with scheelite until 47 GPa. Then, scheelite persists through the end of the experiment. Stavrou et al. characterize monazite TmPO4 as a “metastable minority phase” and attribute the long monazite–scheelite coexistence to the stabilization of monazite grains “when embedded in a scheelite matrix” [14].
Among the compositions, which adopt the monazite structure at 1 atm (~10−4 GPa), only LaPO4 has been shown to undergo a pressure-induced phase transformation. Lacomba-Perales et al. proposed that LaPO4 transforms to barite (orthorhombic, Pnma) based on powder XRD but could not confirm the barite structure due to significant peak overlap [20]. Ruiz-Fuertes et al. used single crystal XRD and second harmonic generation analysis to confirm the post-monazite structure as non-centrosymmetric “post-barite” (orthorhombic, P212121) [32]. Post-barite first emerges at 27.1 GPa and coexists with monazite through the end of the experiment at 31 GPa. This experimental data conflicts a bit with their ab initio calculations, which show a pressure range where barite is energetically preferred before the emergence of post-barite, but the authors argue large kinetic barriers may explain the lack of barite in their LaPO4 experiments and may hinder barite formation in other monazite REPO4 compositions [32]. Ruiz-Fuertes et al. project (based on ab initio calculations) a post-barite transformation to occur at 45 GPa and 35 GPa in GdPO4 and NdPO4, respectively, with barite as a possible, but unlikely, transition phase.
Our 2021 XRD study [22] reported a DyPO4 xenotime → monazite Ponset at 9.1(1) GPa under a quasi-hydrostatic loading rate but did not go to high enough pressures to resolve the xenotime–monazite phase coexistence range [22]. This XRD study aims to identify the end of the xenotime–monazite phase coexistence range by going to higher pressures. Results reveal a xenotime–monazite phase coexistence range of 7.6(15) GPa and a previously unreported phase transformation to a post-monazite phase at 13.9(10) GPa. Comparison to the experimental and the computational literature strongly suggests this post-monazite phase adopts the scheelite (tetragonal, I41/a) structure.
2. Materials and Methods
Phase-pure xenotime DyPO4 powder was obtained via precipitation reaction involving Dy(NO3)3 · 5H2O (≥99.9% RE oxide basis, Alfa Aesar) precursor and H3PO4 (85% w/w aqueous solution, Alfa Aesar) and subsequent calcination. These two steps are detailed elsewhere [33]. The sample powder consists of sub-micron grains, which exhibit the anisotropic, elongated crystal habit expected of tetragonal materials (see the scanning electron micrograph in Figure S1, see supplementary materials). An energy-dispersive X-ray spectrum of the powder (shown in Figure S2) shows no elemental impurities. In situ DAC XRD was conducted at room temperature at beamline 16-ID-B, HPCAT, Advanced Photon Source, Argonne National Laboratory. Two-dimensional diffraction patterns were collected with the PILATUS 1M-F detector. The X-ray wavelength was 0.42459 Å, and the beam spot size (full width at half maximum) was ∼2 μm by ~4 μm. We used a Diacell Helios DAC with a membrane (both from Almax easyLab Inc., Cambridge, MA, USA) driven by a Druck PACE 6000 pressure controller [34]. DAC preparation involved successively loading DyPO4 powder, gold powder (>99.96% metals basis, Alfa Aesar, Ward Hill, MA, USA), ruby chips (Almax easyLab Inc., Cambridge, MA, USA), and 16:3:1 methanol–ethanol–water mixture (MEW) pressure medium into the hole of the 301 stainless steel gasket. The gasket hole diameter and indented thickness were 220 μm and 80 μm, respectively. For pressure marking during initial membrane engagement, ruby was used (R1 fluorescence calibration [35]), while gold was used (third order Birch-Murnaghan EoS [36]) during diffraction data collection. Data collection started at 3.1(2) GPa due to some initial compression required to confirm membrane engagement. There are no reported DyPO4 phase transitions below this starting pressure (as corroborated by our 2021 XRD study) [22]; therefore, the initial jump does not preclude any material insight.
XRD pattern integration, masking, and background subtraction were performed using Dioptas [37]. Pattern fitting was then performed using X’Pert HighScore Plus [38]. This software fits monazite using the P21/c cell setting as a default. Although both the P21/c and P21/n cell settings are valid descriptions of monazite (space group No. 14), fitted lattice parameters were converted to the P21/n cell setting to facilitate comparison to the literature. The LeBail fitting approach [39] was used instead of traditional Rietveld structural refinement to accommodate the significant preferred orientation present in all scans. This apparent preferred orientation appears due to the small spot size of the beam with respect to the grain size of the sample (effectively sampling a finite number of grains) rather than any inherent orientation of the sample grains. The atmospheric-pressure volume of xenotime DyPO4 (289.39(2) Å3) was derived from a prior synchrotron XRD pattern of a sample from the same batch as the sample in this study [22]. The following reference structures were used in this study: xenotime DyPO4 from Milligan et al. [40], monazite DyPO4 from Heuser et al. [41], gold from Couderc et al. [42], ruby from Jephcoat et al. [43], and calculated scheelite TbPO4 from López-Solano et al. [23]. Importantly, the scheelite TbPO4 structure file was not employed in LeBail fitting—only in peak position comparison. For the computation involving derived data (e.g., unit cell volume, gold-based pressure, cell setting conversion), Python was used to propagate error with an assumed covariance of zero.
3. Results
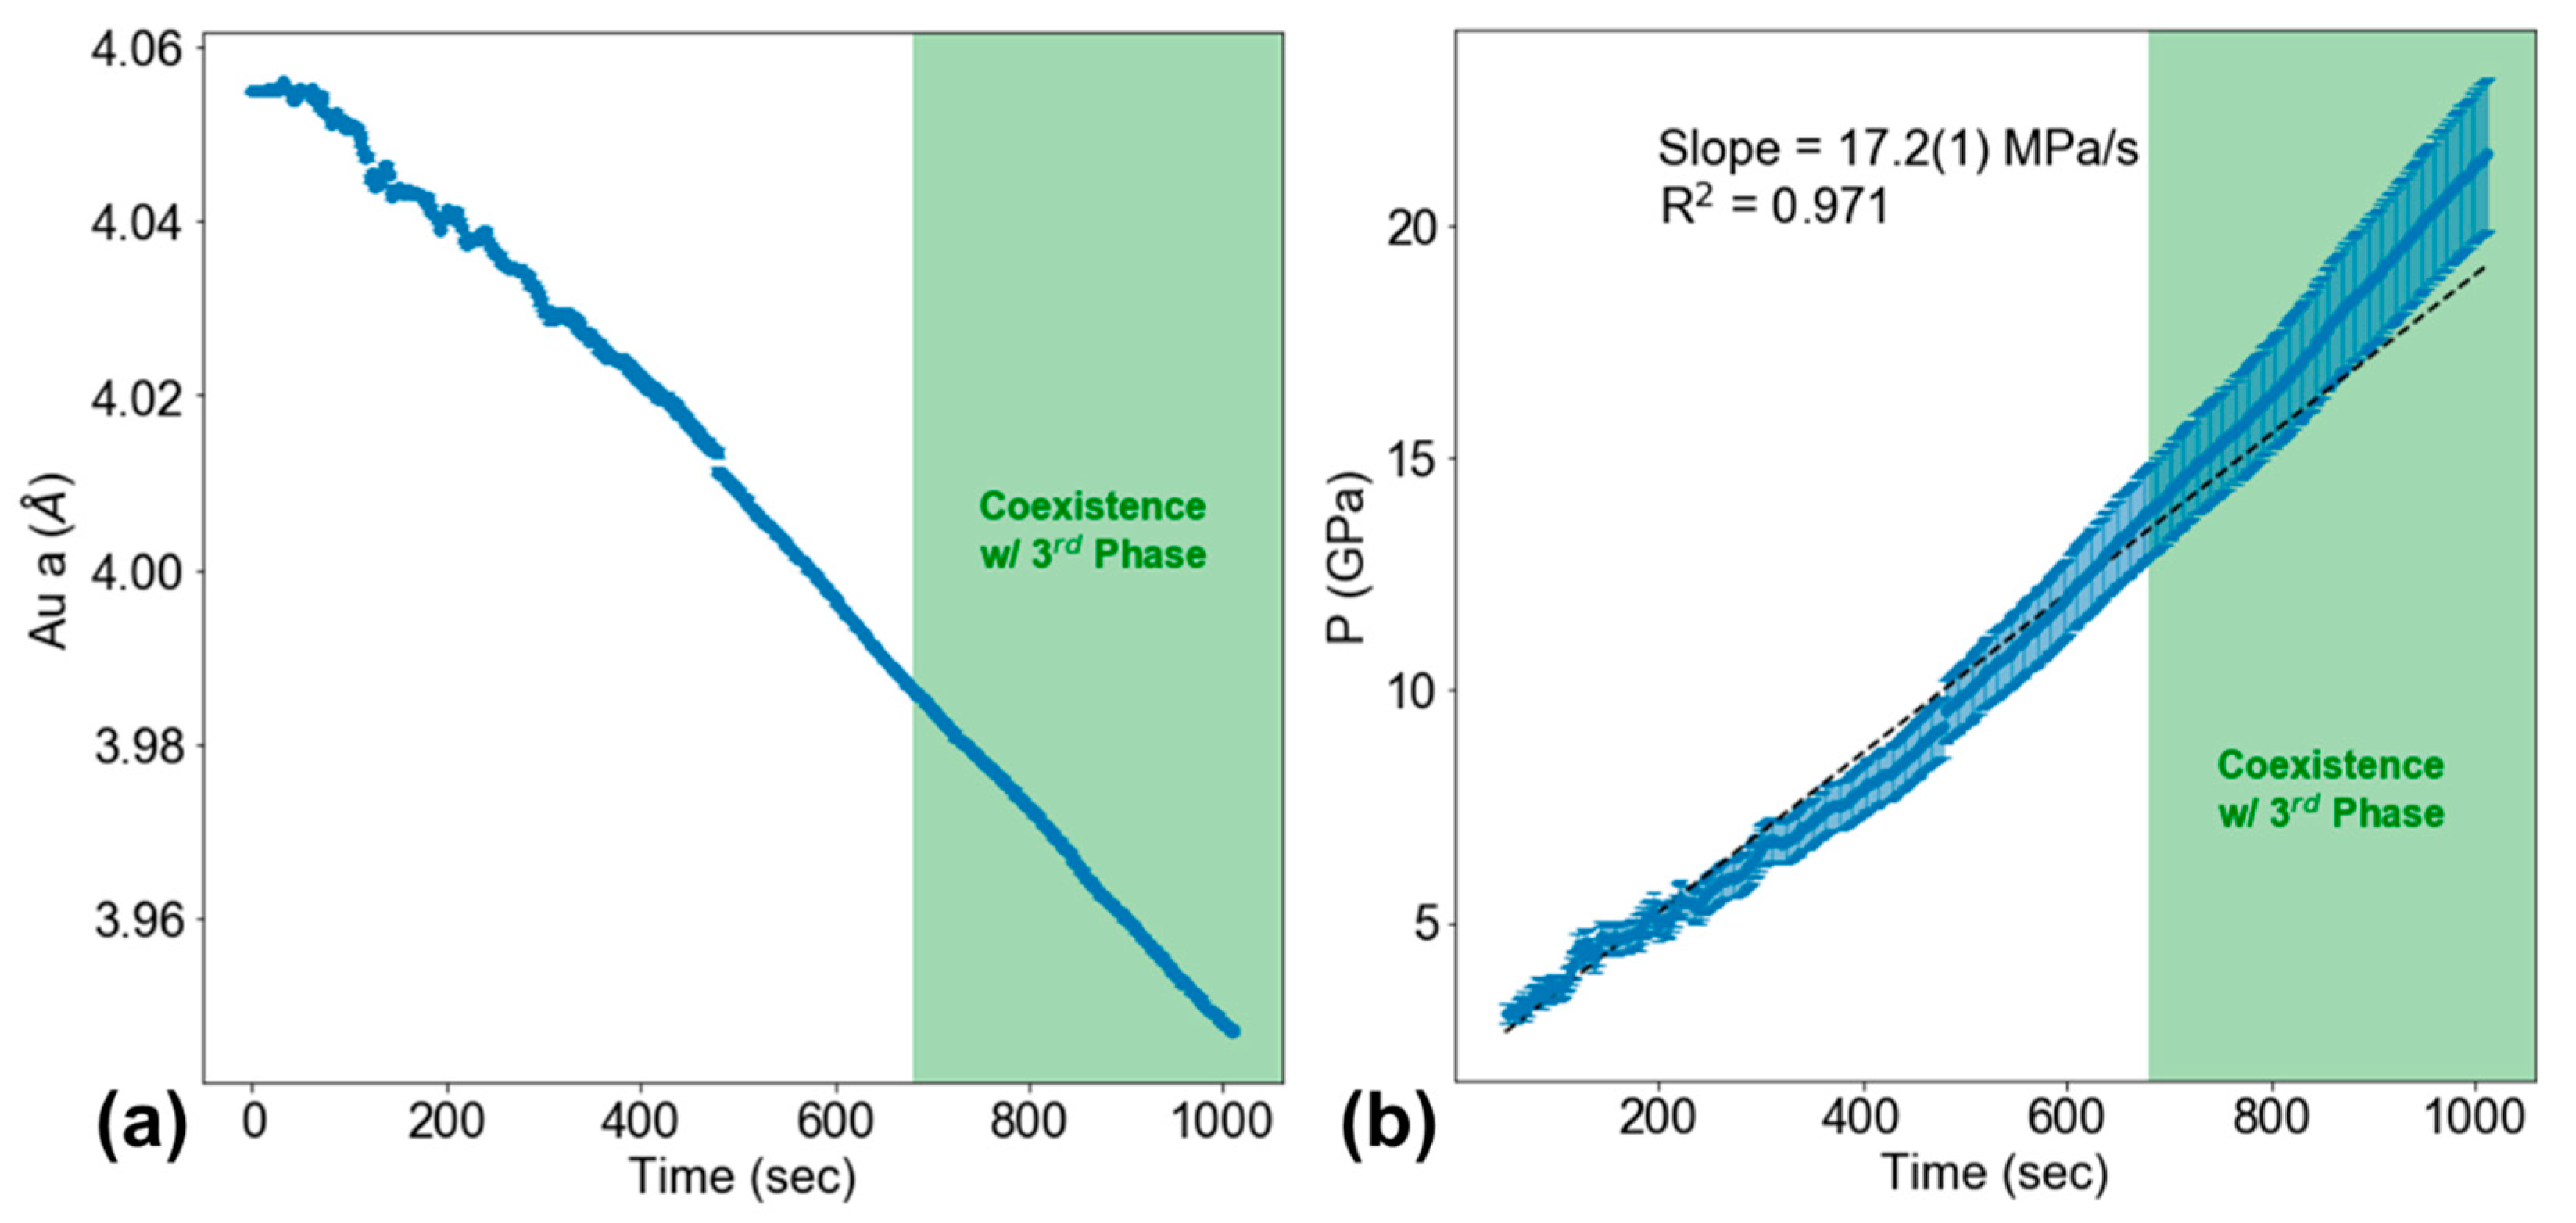
During the experiment, the gold lattice parameter decreases steadily as shown in Figure 3a. In Figure 3b, the pressure increases steadily with time and yields an effective sample loading rate of ~20 MPa/s, an order of magnitude faster than that of our 2021 XRD study [22].
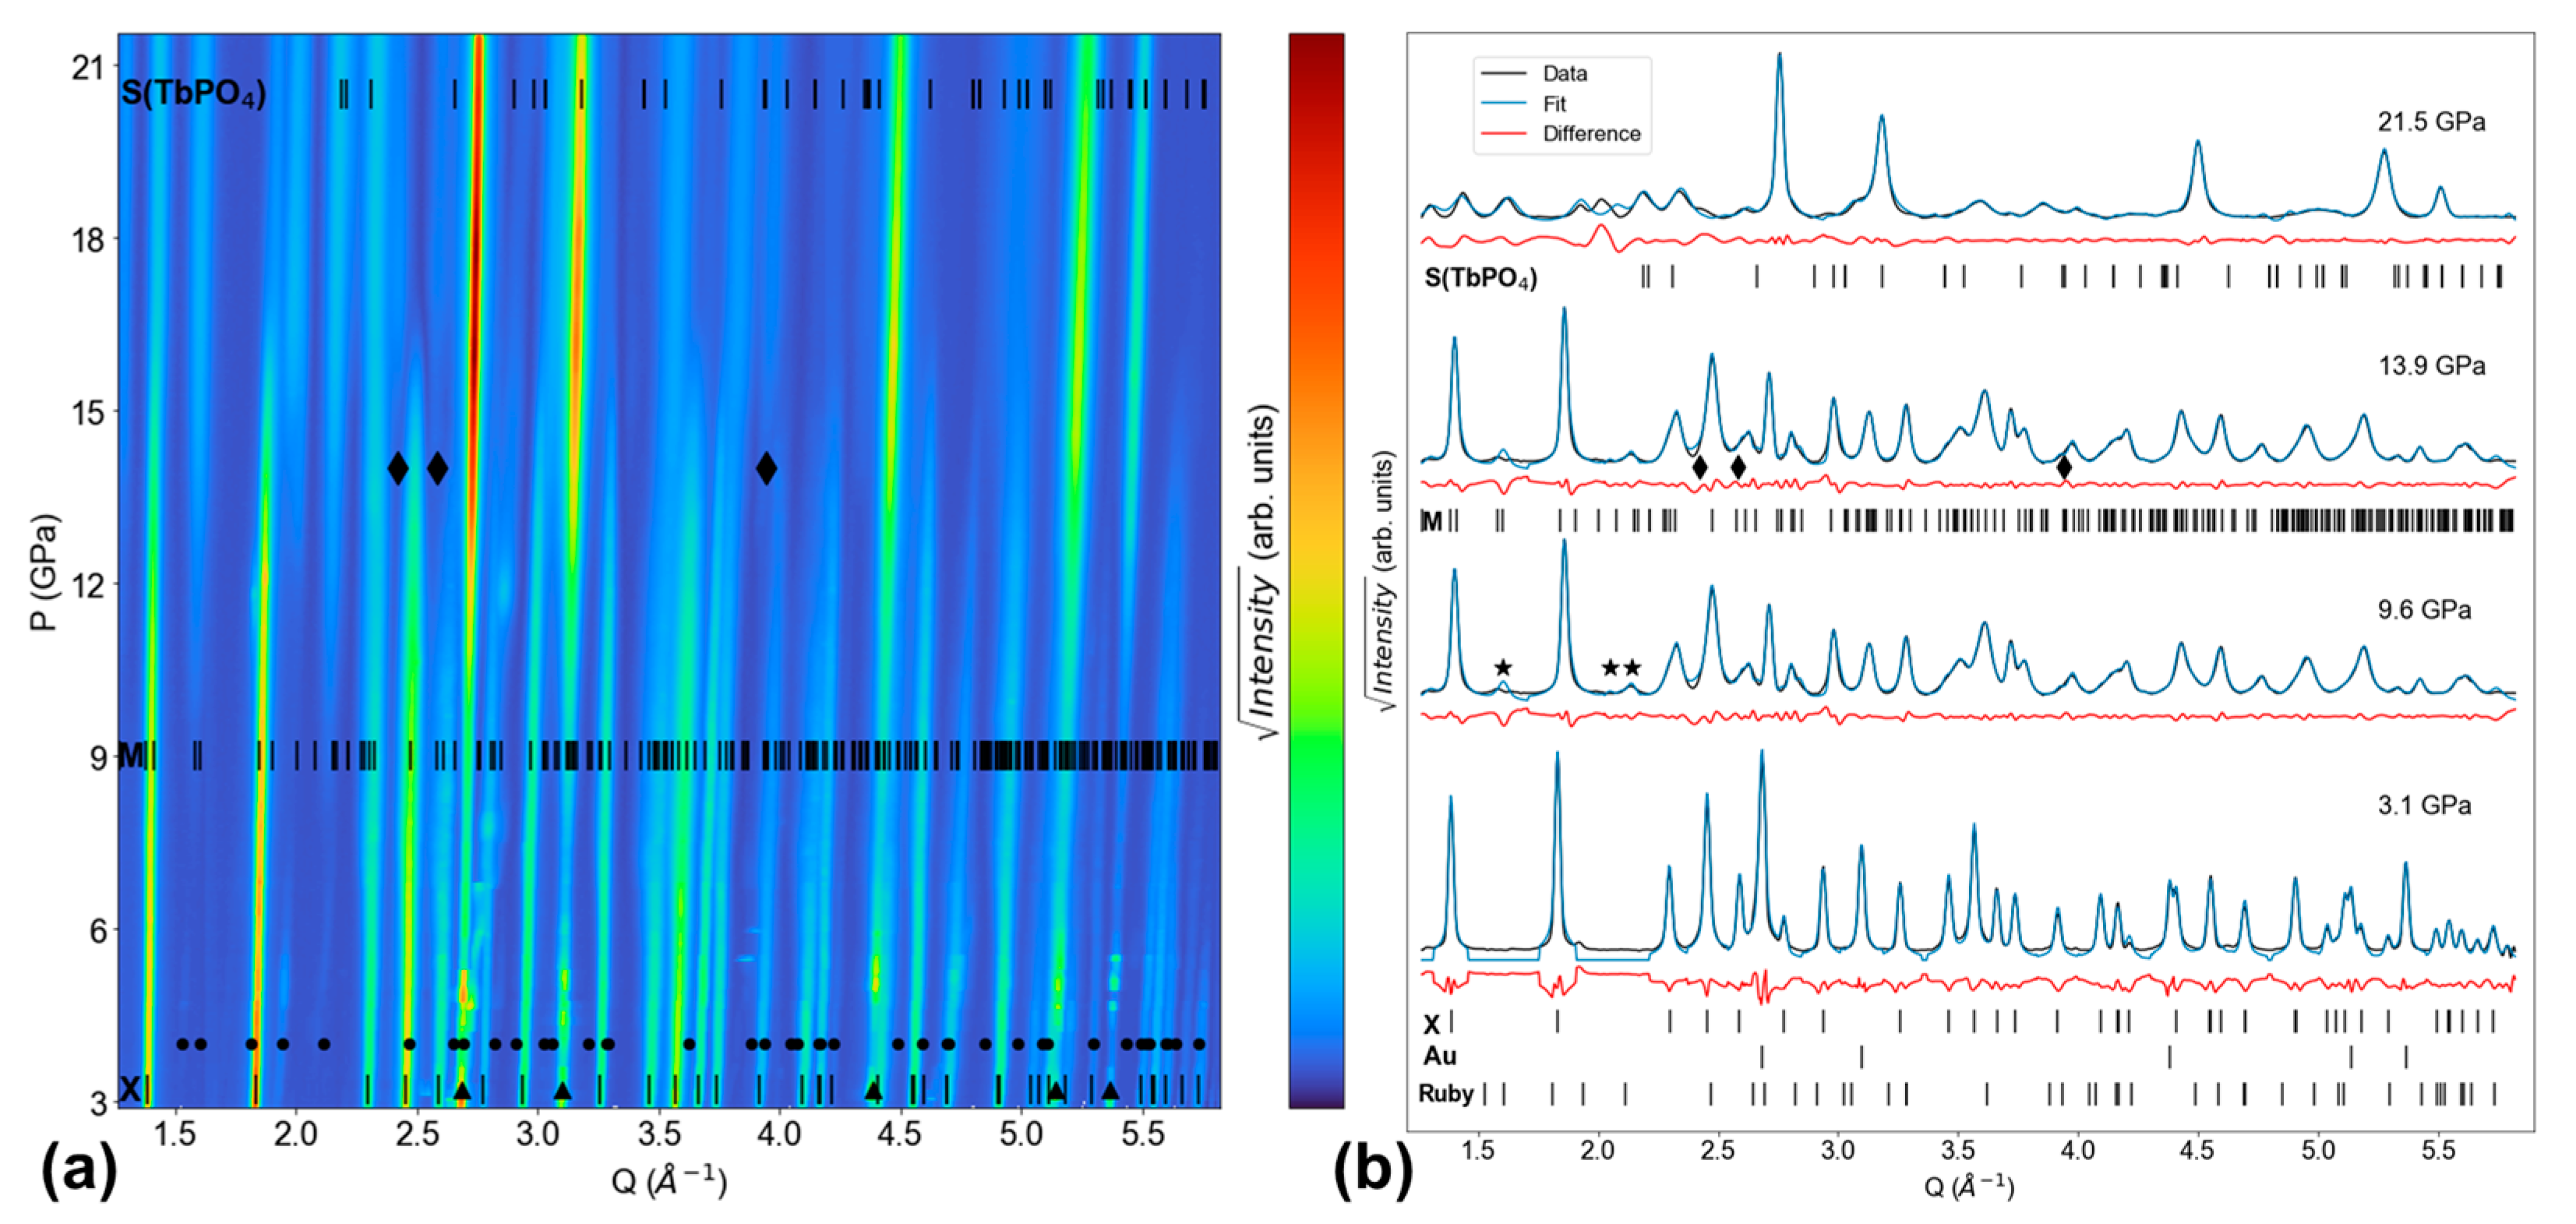
Figure 4 shows the pressure evolution of integrated background-subtracted XRD patterns. The square root of intensity is plotted against Q to show weak peaks more clearly.
In Figure 4a, sample XRD peaks drift to higher Q and broaden with increasing pressure due to uniform and non-uniform strain, respectively. The first scan shows peaks from xenotime DyPO4, gold (triangles), and ruby (circles). Figure 4 also illustrates the relative loss of sample signal compared to the strong gold signal as pressure increases. Ponset values are determined by visual inspection of individual XRD patterns as shown in Figure 4b, not by the coloring in Figure 4a. Figure 4b shows the LeBail fits of key patterns (initial scan, onset of monazite, onset of new phase, and final scan). The first discernible monazite peaks emerge at 9.6(7) GPa at Q = 1.60, 2.05, and 2.14 Å–1; these are the (110), (002), and (02) reflections. At Ponset, the monazite lattice parameters are a = 6.134(1) Å, b = 6.695(1) Å, c = 6.276(1) Å, and β = 99.79(1) °, and the unit cell volume loss during transformation is 7.90%. Although these lattice parameter uncertainties appear quite small, several checks on the LeBail fits do not change the outcome. The xenotime → monazite Ponset is below the hydrostatic limit of the MEW pressure medium (10.5(5) GPa), meaning non-hydrostatic stresses likely do not influence the onset of this transformation. At 10.5(5) GPa, MEW undergoes a glass transition into an amorphous phase that contributes no XRD peaks [44]. Above this hydrostatic limit, the sample stress state is understood to be non-hydrostatic. Starting at 17.2(13) GPa, there are no longer any peaks uniquely attributable to xenotime (based on visual inspection of individual patterns). The disappearance of xenotime peaks by this pressure is also apparent in Figure 4a and yields a xenotime–monazite phase coexistence range of 7.6(15) GPa.
Interestingly, a new set of previously unidentified XRD peaks emerge at 13.9(10) GPa at Q = 2.42, 2.58, and 3.94 Å–1 and persist as the pressure increases (see diamonds in Figure 4). These peak positions are inconsistent with xenotime, anhydrite, monazite, ruby, gasket material, gold, or even a “monazite II” phase reported in CeVO4 [45]. Peak positions for the post-monazite phase of TbPO4, scheelite (derived from ab initio calculations at 20.5 GPa), are shown in Figure 4 as there are no available structural data on any post-monazite phases of DyPO4. The final scan at 21.5(16) GPa contains peaks corresponding to monazite, gold, ruby, and the unidentified phase.
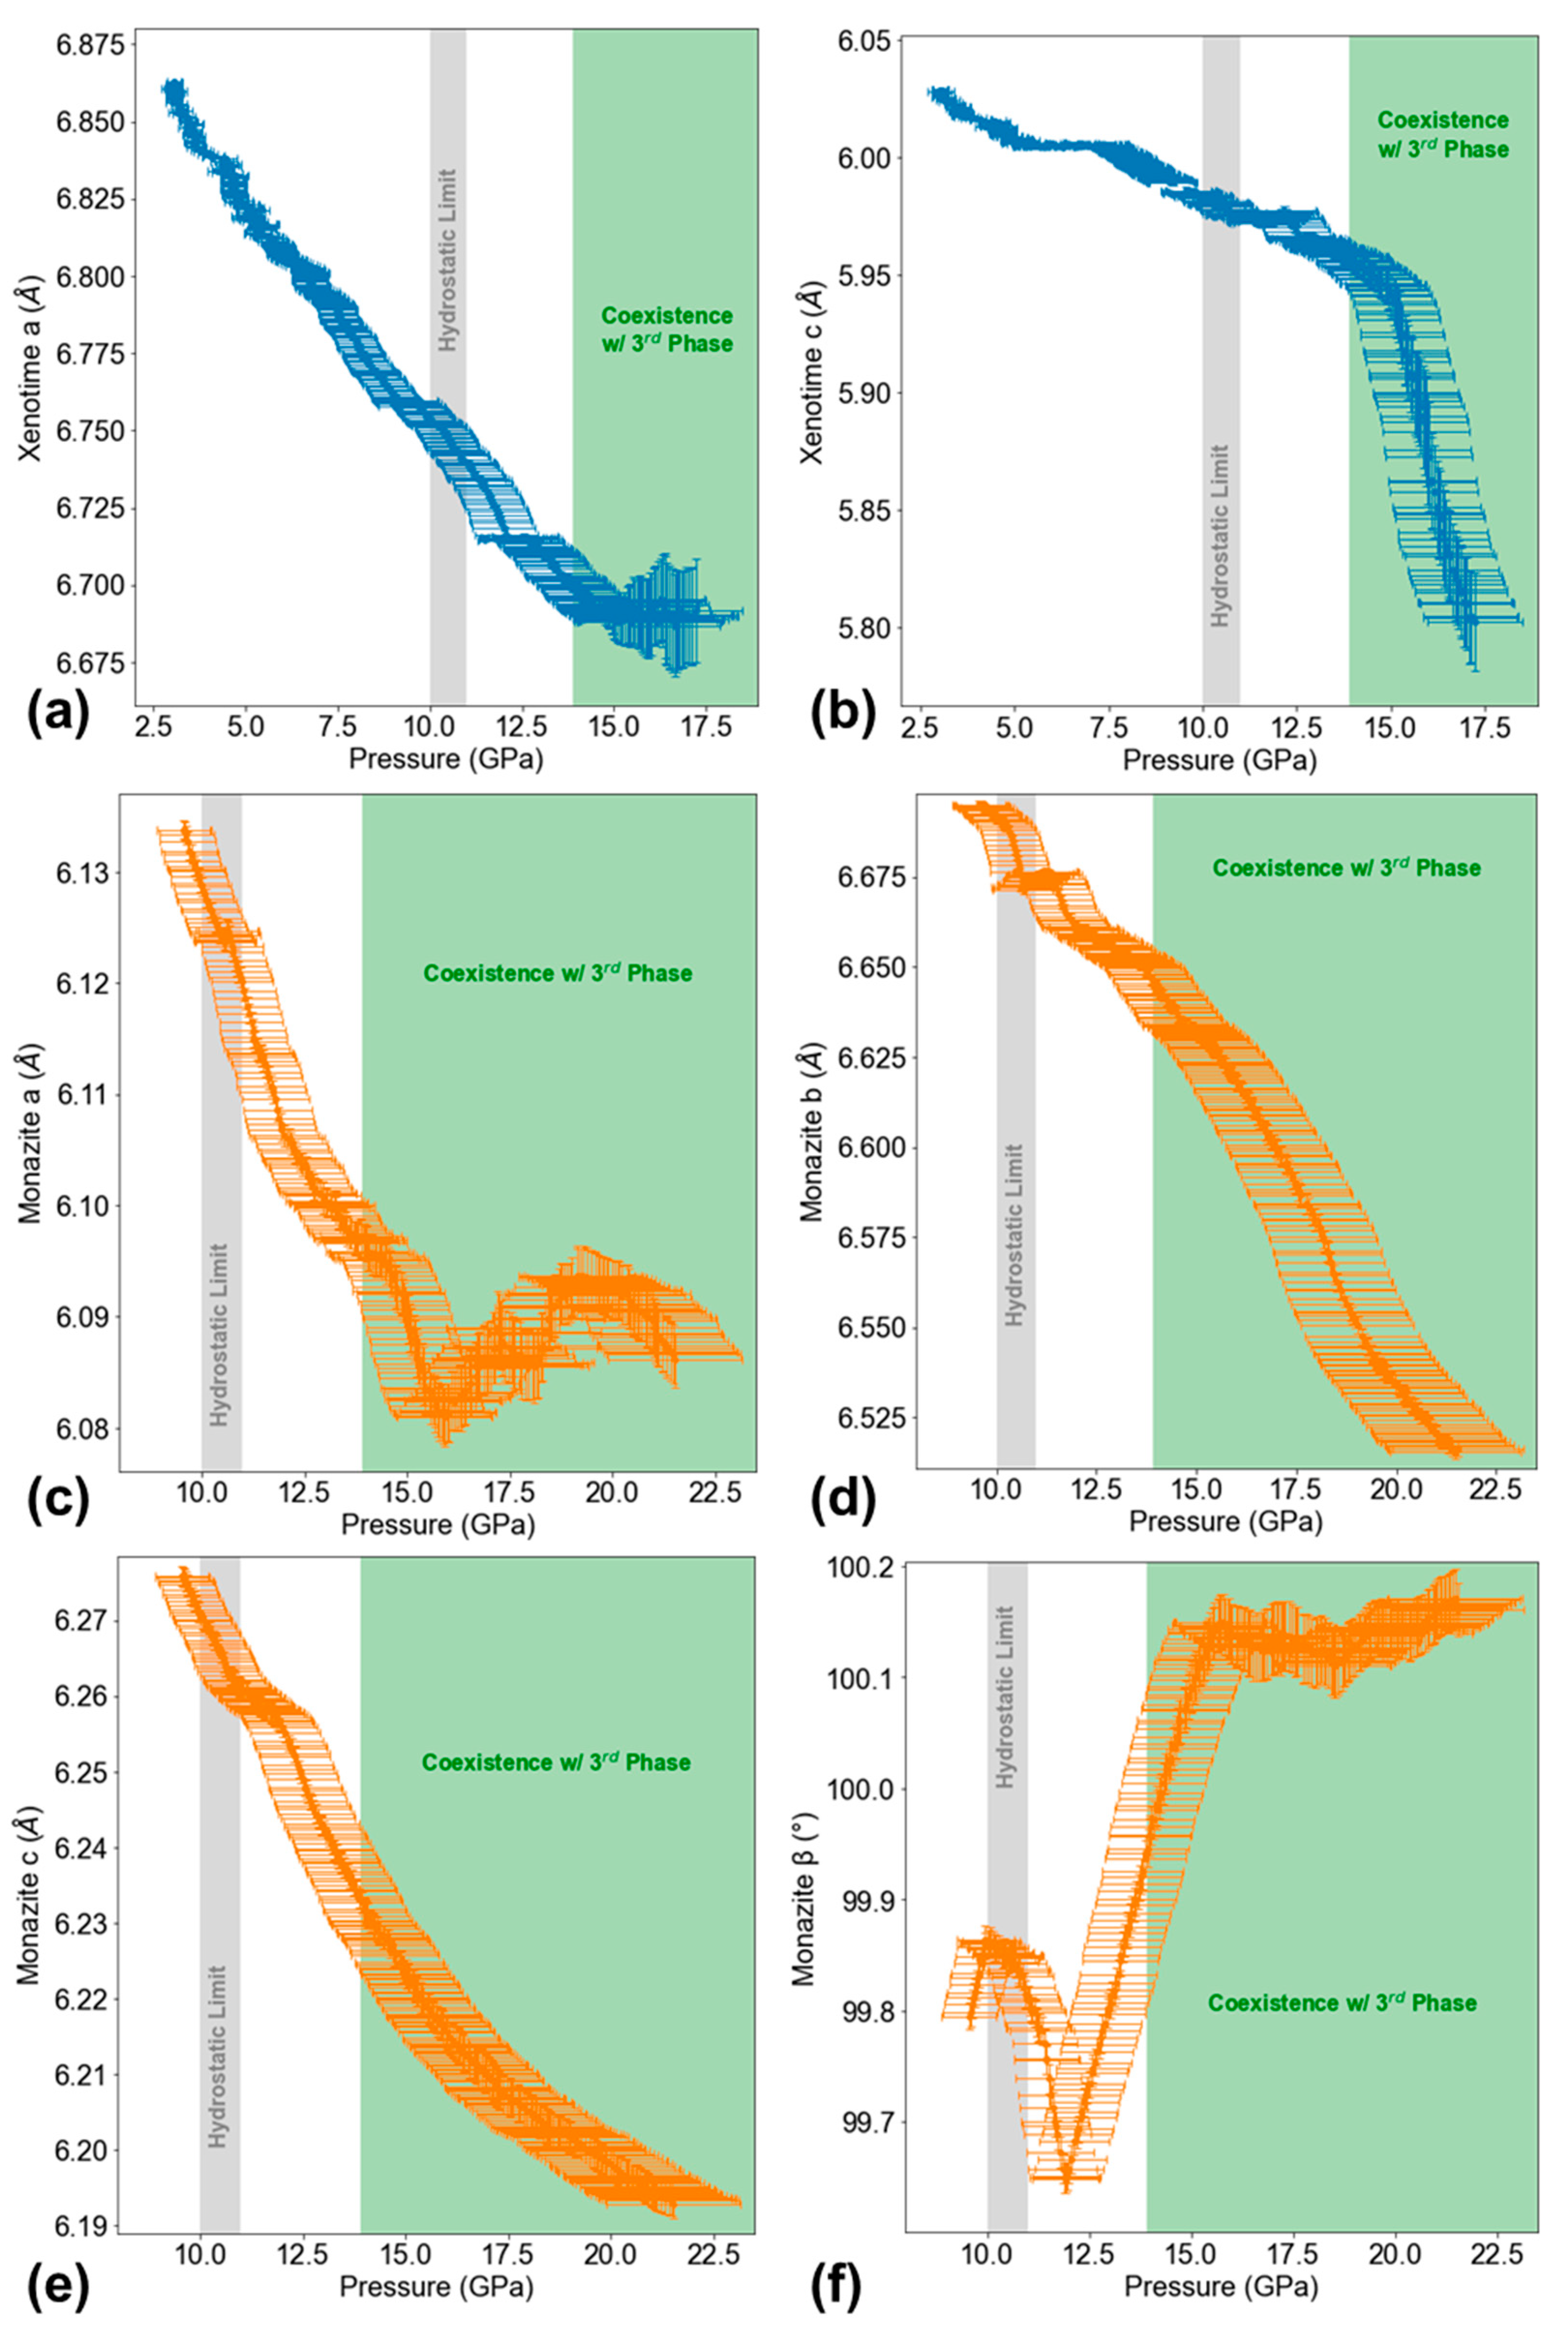
Next, we examine the pressure-dependence of lattice parameters more closely, finding consistent lattice parameter deviations around the pressure at which the post-monazite phase emerges. Figure 5 shows the pressure evolution of DyPO4 lattice parameters for the xenotime (ax and cx) and monazite (am, bm, cm, and βm) phases.
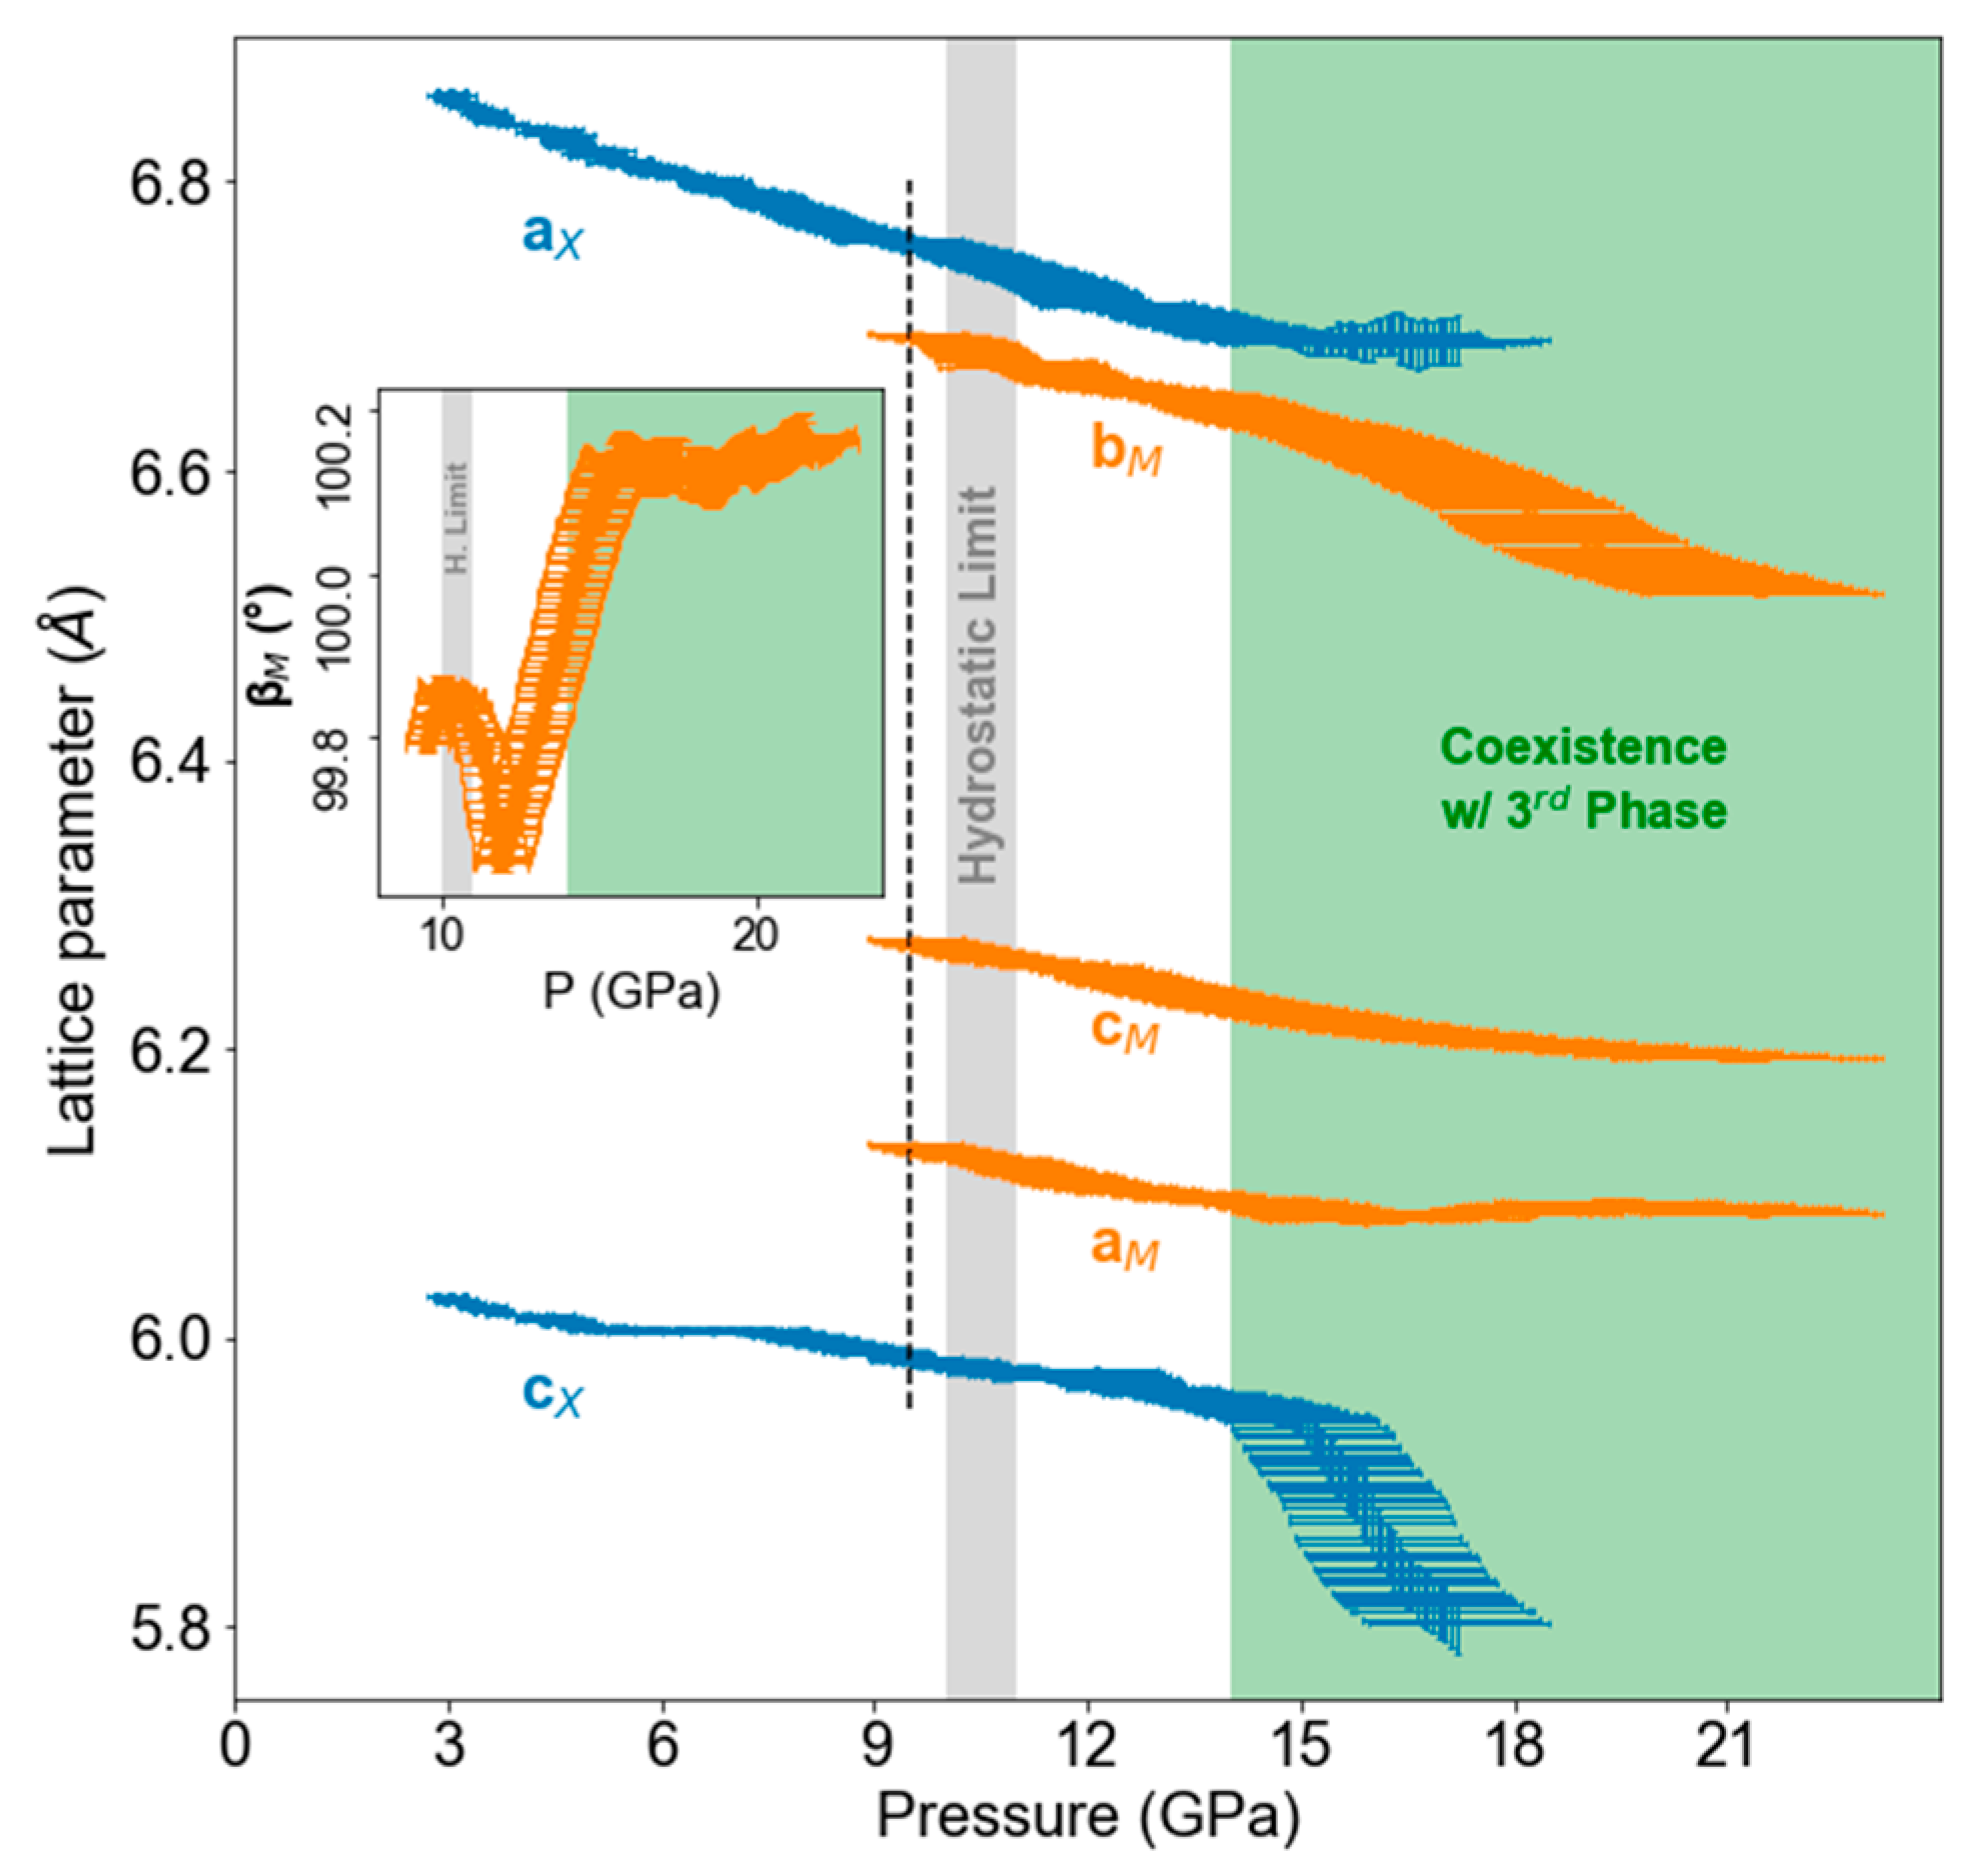
Figure 5a shows ax decreasing fairly steadily and monotonically with two slight disruptions at pressures consistent with the xenotime → monazite Ponset (9.6(7) GPa) and with the hydrostatic limit of MEW (10.5(5) GPa). Starting at ~14 GPa, however, ax stops decreasing, and the lattice parameter uncertainty expands significantly; this change in behavior coincides with the emergence of the unidentified peaks. Figure 5b shows similar behavior in cx, except this parameter starts decreasing rapidly at ~14 GPa. The axial ratio of xenotime (shown in Figure S3) also shows a dramatic trend change at ~14 GPa. Figure 5c shows am decreasing monotonically with slight disruptions at the hydrostatic limit and ~14 GPa. After ~15 GPa, am becomes non-monotonic with pressure, and its error bar expands significantly. Figure 5d,e does not show any anomalies in bm and cm around 14 or 15 GPa—only minor disruptions around the hydrostatic limit. Figure 5f shows βm changes monotonicity around the hydrostatic limit, steadily increases with smaller error bars after 12 GPa, then remains almost constant after ~15 GPa with larger error bars. Figure 6 shows all DyPO4 lattice parameters plotted together to better illustrate their relative values and relative compressibilities. The cx, am, bm, and βm parameters stand out with the most significant changes in behavior beginning at ~14 GPa, coinciding with the emergence of the third (post-monazite) phase of DyPO4.
Axial compressibilities of the xenotime and monazite phases are obtained by linearly fitting lattice parameter data from pressures below the hydrostatic limit (10.5 GPa). These values are summarized in Table 1. The monazite beta angle (βm) was not analyzed as this parameter’s non-monotonic behavior precludes a meaningful linear fit.
4. Discussion
This experiment shows the Ponset of DyPO4 xenotime → monazite phase transformation is 9.6(7) GPa when loading at ~20 MPa/s. This pressure is nominally higher than the 9.1(1) GPa Ponset observed in our 2021 DyPO4 study under quasi-static loading (~2 MPa/s) [22]; however, the magnitude of the Ponset error unfortunately precludes any conclusions regarding rate-dependence of the xenotime → monazite transformation (e.g., thermal activation, mechanism). The xenotime axial compressibilities (see Table 1) and the monazite lattice parameters at Ponset are not notably different from those reported in our 2021 DyPO4 study [22], while the monazite axial compressibilities differ significantly in their absolute and relative values. The discrepancy in compressibilities is likely due to this study having a much smaller quasi-hydrostatic pressure regime in which monazite exists (~1 GPa); therefore, there is a much smaller range and significantly fewer monazite datapoints suitable for fitting in this study than in our previous study.
This work also provides, for the first time, an estimate of the full DyPO4 xenotime–monazite phase coexistence range. Figure 4 shows that the xenotime phase is present up to 17.2(13) GPa (also reflected in Figure 2 as the upper bound of the blue bar). This value establishes that, while there is not a trend in the experimentally observed monazite Ponset with rare-earth radius, there is a general compositional trend in which the upper pressure bound of xenotime decreases with increasing RE3+ radius (see Figure 2). The DyPO4 xenotime–monazite coexistence range is then 7.6(15) GPa, which is significantly larger than that of both neighboring compositions (4.8 GPa for YPO4 and 4.6 GPa for TbPO4) and slightly larger than that of ErPO4 (6.0 GPa) [12,20,23]. Comparison to HoPO4 is precluded by incomplete xenotime phase transition [13].
Beyond characterizing the xenotime → monazite transformation, this study provides proof of the existence of a new, post-monazite phase of DyPO4. As a reminder, it is crucial to note that no DyPO4 structures other than xenotime and monazite were used during the LeBail fitting (as no other experiment-based DyPO4 structures have been reported). As a result, the fitting process attempted to accommodate the unidentified peaks at Q = 2.42, 2.58, and 3.94 Å–1 (emerging at 13.9(10) GPa as seen in Figure 4) with the xenotime and monazite structures. This accommodation explains the anomalies in ax, cx, am, and βm after 13.9(10) GPa as shown in Figure 5. The gold lattice parameter variation with time (and its corresponding pressure profile) is smooth and has no interruption at the post-monazite transition pressure (see Figure 3), showing that anomalies in xenotime and monazite lattice parameters do not result from experiment instabilities. Indexing the unidentified peaks to a certain structure or space group is extremely difficult because of a weak sample signal at pressures >14 GPa as well as monazite peaks covering most of the Q range.
Comparison to the literature strongly suggests the post-monazite phase is scheelite (tetragonal, I41/a). Based on preliminary Raman spectroscopy experiments, Stavrou et al. deduce a xenotime → monazite → scheelite transformation pathway in DyPO4 with a monazite → scheelite Ponset at ~33 GPa [18]. This Ponset value may be a significant overestimation, as the Raman spectroscopy-based xenotime → monazite Ponset has also proven to be a significant overestimation when compared to XRD work [22]. Further analysis of this Raman spectroscopy-based monazite → scheelite Ponset is complicated by the fact that the underlying Raman spectra have yet to be published. Nevertheless, the pressure-induced phase transformation pathways of other xenotime REPO4s support the existence of a monazite → scheelite transformation in DyPO4. Figure 2 shows scheelite evolves from monazite (in YPO4) or directly from xenotime (in ScPO4, LuPO4, YbPO4, and TmPO4) with increasing pressure. Experimental studies of ErPO4, HoPO4, and TbPO4 neither confirm nor deny transformation to scheelite due to limited experimental pressure ranges [20,21,23]. In the case of TbPO4, Lopez-Solano et al. point to “kinetic energy barriers” possibly hindering transformation to scheelite [23]. However, ab initio calculations performed by Bose et al. and Lopez-Solano et al. show ErPO4, HoPO4, and TbPO4 are expected to follow the xenotime → monazite → scheelite phase transformation pathway. Bose et al. predict monazite → scheelite Ponset values of ~11 GPa, ~12 GPa, and ~14 GPa for ErPO4, HoPO4, and TbPO4, respectively [17]. Lopez-Solano et al. predict a slightly higher TbPO4 monazite → scheelite Ponset of 15.5 GPa [23]. Barite and post-barite also bear consideration for the post-monazite phase, but both seem unlikely given experimental and computational data on LaPO4 put the transition for this and other compositions at pressures above 26 GPa [20,32]. Additionally, Lopez-Solano et al. found the scheelite structure to be energetically favorable to the barite structure [23]. No studies to date report a similar comparison between the scheelite and post-barite structures. Given that the unidentified XRD peaks in this study emerge at a pressure consistent with the expected monazite → scheelite transformation in neighboring compositions, it is likely that these peaks belong to a scheelite DyPO4 phase.
In the absence of scheelite unit cell data for DyPO4, we use TbPO4 for comparison. Lopez-Solano et al. predicted unit cell data of scheelite TbPO4 at 20.5 GPa, which are added to the top of Figure 4 as “S(TbPO4)” peak position ticks. Although the new peaks from DyPO4 do not exactly match these ticks in scans around 20.5 GPa, the peaks are reasonably close to the ticks given the differences in methods, RE, temperature, kinetics, and stress state, which together have confounding effects on the unit cell. If this post-monazite DyPO4 phase is further confirmed to be scheelite, 13.9(10) GPa would be the lowest pressure at which scheelite has been reported in REPO4s to date.
5. Conclusions
This work significantly extends the characterization of the high-pressure phase behavior of DyPO4, which has been limited, particularly at pressures above 15 GPa. Our 2021 XRD study reported a xenotime → monazite Ponset at ~9 GPa but did not go to high enough pressures to reveal the xenotime–monazite phase coexistence range. This XRD study goes to higher pressures, showing a xenotime–monazite phase coexistence range of 7.6(15) GPa as well as the emergence of new peaks at 13.9(10) GPa. Contextualizing these new peaks within the experimental and the computational literature provides compelling evidence that monazite DyPO4 undergoes a pressure-induced phase transformation to the scheelite structure. Our results also motivate further XRD studies of other REPO4s (e.g., ErPO4, HoPO4, and TbPO4) at higher pressures to explore possible monazite → scheelite transformations and to elucidate high-pressure phase transformation pathways more broadly.
Supplementary Materials
The following supporting information can be downloaded at: https://0-www-mdpi-com.brum.beds.ac.uk/article/10.3390/cryst13020249/s1, Figure S1: Scanning electron micrograph showing grain size and morphology of sample powder; Figure S2: Energy-dispersive X-ray spectrum of sample powder; Figure S3: Pressure dependence of the axial ratio (cx/ax) of the xenotime unit cell. A file containing XRD pattern fit data shown in Figure 4b is also included in the Supplementary Materials.
Author Contributions
Conceptualization, J.S. and C.E.P.; data curation, J.S., H.Q.A. and C.E.P.; formal analysis, J.S.; writing—original draft preparation, J.S. and H.Q.A.; writing—review and editing, J.S., H.Q.A. and C.E.P.; supervision, C.E.P. All authors have read and agreed to the published version of the manuscript.
Funding
This research was supported by the National Science Foundation under Award No. DMR-1352499. J.S. was supported by the Department of Defense through the National Defense Science & Engineering Graduate Fellowship Program. This work was performed at HPCAT (Sector 16), Advanced Photon Source, Argonne National Laboratory. HPCAT operations are supported by DOE National Nuclear Security Administration under Award No. DE-NA0001974 and DOE Office of Basic Energy Sciences (BES) under Award No. DE-FG02-99ER45775, with partial instrumentation funding by the National Science Foundation (NSF). A.P.S. is supported by DOE-BES, under Contract No. DE-AC02- 06CH11357.
Institutional Review Board Statement
Not applicable.
Informed Consent Statement
Not applicable.
Data Availability Statement
All relevant data that support the findings of this study are available from the corresponding authors upon request.
Acknowledgments
The authors thank Ivar Reimanis for lending us his Diacell Helios DAC, Matthew Musselman for synthesizing the sample used in the experiment, and Jesse Smith at HPCAT for performing initial alignment and calibration. The authors acknowledge the APS synchrotron facilities for provision of beamtime on beamline 16-ID-B.
Conflicts of Interest
The authors declare no conflict of interest.
References
- Boatner, L.A. Synthesis, Structure, and Properties of Monazite, Pretulite, and Xenotime. Rev. Mineral. Geochem. 2002, 48, 87–121. [Google Scholar] [CrossRef]
- Vielreicher, N.M.; Groves, D.I.; Fletcher, I.R.; McNaughton, N.J.; Rasmussen, B. Hydrothermal Monazite and Xenotime Geochronology: A New Direction for Precise Dating of Orogenic Gold Mineralization. SEG Discov. 2003, 70, 1–16. [Google Scholar] [CrossRef]
- Cox, M.A.; Cavosie, A.J.; Poelchau, M.; Kenkmann, T.; Bland, P.A.; Miljković, K. Shock Deformation Microstructures in Xenotime from the Spider Impact Structure, Western Australia. In Large Meteorite Impacts and Planetary Evolution VI; Geological Society of America: Boulder, CO, USA, 2021; pp. 449–464. [Google Scholar]
- Morgan, P.E.D.; Marshall, D.B. Ceramic Composites of Monazite and Alumina. J. Am. Ceram. Soc. 1995, 78, 1553–1563. [Google Scholar] [CrossRef]
- Hay, R.S.; Mogilevsky, P.; Boakye, E. Phase Transformations in Xenotime Rare-Earth Orthophosphates. Acta Mater. 2013, 61, 6933–6947. [Google Scholar] [CrossRef]
- Hay, R.S.; Boakye, E.E.; Mogilevsky, P.; Fair, G.E.; Parthasarathy, T.A.; Davis, J.E. Transformation Plasticity in (Gdx Dy1-x) PO 4 Fiber Coatings during Fiber Push Out. J. Am. Ceram. Soc. 2013, 96, 1586–1595. [Google Scholar] [CrossRef]
- Ni, Y.; Hughes, J.M.; Mariano, A.N.; Et, N.I.; Crystal, A.L. Crystal Chemistry of the Monazite and Xenotime Structures. Am. Mineral. 1995, 80, 21–26. [Google Scholar] [CrossRef]
- Errandonea, D.; Manjón, F.J. Pressure Effects on the Structural and Electronic Properties of ABX4 Scintillating Crystals. Prog. Mater. Sci. 2008, 53, 711–773. [Google Scholar] [CrossRef]
- Minakshi, M.; Mitchell, D.R.G.; Baur, C.; Chable, J.; Barlow, A.J.; Fichtner, M.; Banerjee, A.; Chakraborty, S.; Ahuja, R. Phase Evolution in Calcium Molybdate Nanoparticles as a Function of Synthesis Temperature and Its Electrochemical Effect on Energy Storage. Nanoscale Adv. 2019, 1, 565–580. [Google Scholar] [CrossRef]
- Macey, B.J. The Crystal Chemistry of MTO4 Compounds with the Zicron, Scheelite, and Monazite Structure Types; Virginia Tech: Blackburg, VA, USA, 2009. [Google Scholar]
- Momma, K.; Izumi, F. VESTA 3 for Three-Dimensional Visualization of Crystal, Volumetric and Morphology Data. J. Appl. Crystallogr. 2011, 44, 1272–1276. [Google Scholar] [CrossRef]
- Zhang, F.X.; Wang, J.W.; Lang, M.; Zhang, J.M.; Ewing, R.C.; Boatner, L.A. High-Pressure Phase Transitions of ScPO4 and YPO4. Phys. Rev. B Cover. Condens. Matter Mater. Phys. 2009, 80, 184114. [Google Scholar] [CrossRef]
- Lösch, H.; Hirsch, A.; Holthausen, J.; Peters, L.; Xiao, B.; Neumeier, S.; Schmidt, M.; Huittinen, N. A Spectroscopic Investigation of Eu3+ Incorporation in LnPO4 (Ln = Tb, Gd1-XLux, X = 0.3, 0.5, 0.7, 1) Ceramics. Front. Chem. 2019, 7, 94. [Google Scholar] [CrossRef] [PubMed]
- Tschauner, O.; Ushakov, S.V.; Navrotsky, A.; Boatner, L.A. Phase Transformations and Indications for Acoustic Mode Softening in Tb-Gd Orthophosphate. J. Phys. Condens. Matter 2016, 28, 035403. [Google Scholar] [CrossRef] [PubMed]
- Kolitsch, U.; Holtstam, D. Crystal Chemistry of REEXO4 Compounds (X = P,As, V). II. Review of REEXO4 Compounds and Their Stability Fields. Eur. J. Mineral. 2004, 16, 117–126. [Google Scholar] [CrossRef]
- Finch, R.J. Structure and Chemistry of Zircon and Zircon-Group Minerals. Rev. Mineral. Geochem. 2003, 53, 1–25. [Google Scholar] [CrossRef]
- Bose, P.P.; Mittal, R.; Chaplot, S.L.; Loong, C.K.; Boatner, L.A. Inelastic Neutron Scattering, Lattice Dynamics, and High-Pressure Phase Stability of Zircon-Structured Lanthanide Orthophosphates. Phys. Rev. B Cover. Condens. Matter Mater. Phys. 2010, 82, 094309. [Google Scholar] [CrossRef]
- Stavrou, E.; Tatsi, A.; Raptis, C.; Efthimiopoulos, I.; Syassen, K.; Muñoz, A.; Rodríguez-Hernández, P.; López-Solano, J.; Hanfland, M.; Muñoz, A.; et al. Effects of Pressure on the Structure and Lattice Dynamics of TmPO4: Experiments and Calculations. Phys. Rev. B Condens. Matter Mater. Phys. 2012, 85, 24117. [Google Scholar] [CrossRef]
- Zhang, F.X.; Lang, M.; Ewing, R.C.; Lian, J.; Wang, Z.W.; Hu, J.; Boatner, L.A. Pressure-Induced Zircon-Type to Scheelite-Type Phase Transitions in YbPO4 and LuPO4. J. Solid State Chem. 2008, 181, 2633–2638. [Google Scholar] [CrossRef]
- Lacomba-Perales, R.; Errandonea, D.; Meng, Y.; Bettinelli, M. High-Pressure Stability and Compressibility of A PO4 (A=La, Nd, Eu, Gd, Er, and Y) Orthophosphates: An X-ray Diffraction Study Using Synchrotron Radiation. Phys. Rev. B Cover. Condens. Matter Mater. Phys. 2010, 81, 064113. [Google Scholar] [CrossRef]
- Gomis, O.; Lavina, B.; Rodríguez-Hernández, P.; Muǹoz, A.; Errandonea, R.; Errandonea, D.; Bettinelli, M. High-Pressure Structural, Elastic, and Thermodynamic Properties of Zircon-Type HoPO4 and TmPO4. J. Phys. Condens. Matter 2017, 29, 095401. [Google Scholar] [CrossRef]
- Sharma, J.; Musselman, M.; Haberl, B.; Packard, C.E. In Situ Synchrotron Diffraction of Pressure-Induced Phase Transition in DyPO4 under Variable Hydrostaticity. Phys. Rev. B 2021, 103, 184105. [Google Scholar] [CrossRef]
- López-Solano, J.; Rodríguez-Hernández, P.; Muñoz, A.; Gomis, O.; Santamaría-Perez, D.; Errandonea, D.; Manjón, F.J.; Kumar, R.S.; Stavrou, E.; Raptis, C. Theoretical and Experimental Study of the Structural Stability of TbPO4 at High Pressures. Phys. Rev. B Cover. Condens. Matter Mater. Phys. 2010, 81, 144126. [Google Scholar] [CrossRef]
- Heuser, J.M.; Palomares, R.I.; Bauer, J.D.; Rodriguez, M.J.L.; Cooper, J.; Lang, M.; Scheinost, A.C.; Schlenz, H.; Winkler, B.; Bosbach, D.; et al. Journal of the European Ceramic Society Structural Characterization of (Sm, Tb) PO4 Solid Solutions and Pressure-Induced Phase Transitions. J. Eur. Ceram. Soc. 2018, 38, 4070–4081. [Google Scholar] [CrossRef]
- Huang, T.; Lee, J.S.; Kung, J.; Lin, C.M. Study of Monazite under High Pressure. Solid State Commun. 2010, 150, 1845–1850. [Google Scholar] [CrossRef]
- Errandonea, D.; Gomis, O.; Rodriguez-Hernández, P.; Munz, A.; Ruiz-Fuertes, J.; Gupta, M.; Achary, S.N.; Hirsch, A.; Manjon, F.J.; Peters, L.; et al. High-Pressure Structural and Vibrational Properties of Monazite-Type BiPO4, LaPO4, CePO4, and PrPO4. J. Phys. Condens. Matter 2018, 30, 065401. [Google Scholar] [CrossRef] [PubMed]
- Musselman, M.A.; Wilkinson, T.M.; Haberl, B.; Packard, C.E. In Situ Raman Spectroscopy of Pressure-Induced Phase Transformations in Polycrystalline TbPO4, DyPO4, and GdxDy(1−x)PO4. J. Am. Ceram. Soc. 2018, 101, 2562–2570. [Google Scholar] [CrossRef]
- Rustad, J.R. Density Functional Calculations of the Enthalpies of Formation of Rare-Earth Orthophosphates. Am. Mineral. 2012, 97, 791–799. [Google Scholar] [CrossRef]
- Kowalski, P.M.; Li, Y. Relationship between the Thermodynamic Excess Properties of Mixing and the Elastic Moduli in the Monazite-Type Ceramics. J. Eur. Ceram. Soc. 2016, 36, 2093–2096. [Google Scholar] [CrossRef]
- Ushakov, S.V.; Helean, K.B.; Navrotsky, A.; Boatner, L.A. Thermochemistry of Rare-Earth Orthophosphates. J. Mater. Res. 2001, 16, 2623–2633. [Google Scholar] [CrossRef]
- Blanca Romero, A.; Kowalski, P.M.; Beridze, G.; Schlenz, H.; Bosbach, D. Performance of DFT+U Method for Prediction of Structural and Thermodynamic Parameters of Monazite-Type Ceramics. J. Comput. Chem. 2014, 35, 1339–1346. [Google Scholar] [CrossRef]
- Ruiz-Fuertes, J.; Hirsch, A.; Friedrich, A.; Winkler, B.; Bayarjargal, L.; Morgenroth, W.; Peters, L.; Roth, G.; Milman, V. High-Pressure Phase of LaPO4 Studied by X-ray Diffraction and Second Harmonic Generation. Phys. Rev. B Cover. Condens. Matter Mater. Phys. 2016, 94, 134109. [Google Scholar] [CrossRef]
- Musselman, M.A. In Situ Raman Spectroscopy of Pressure-Induced Phase Transformations in DyPO4 and GdxDy(1-x)PO4. Master’s Thesis, Colorado School of Mines, Golden, CO, USA, 2017. [Google Scholar]
- Sinogeikin, S.V.; Smith, J.S.; Rod, E.; Lin, C.; Kenney-Benson, C.; Shen, G. Online Remote Control Systems for Static and Dynamic Compression and Decompression Using Diamond Anvil Cells. Rev. Sci. Instrum. 2015, 86, 072209. [Google Scholar] [CrossRef] [PubMed]
- Shen, G.; Wang, Y.; Dewaele, A.; Wu, C.; Fratanduono, D.E.; Eggert, J.; Klotz, S.; Dziubek, K.F.; Loubeyre, P.; Fat’yanov, O.V.; et al. Toward an International Practical Pressure Scale: A Proposal for an IPPS Ruby Gauge (IPPS-Ruby2020). High Press. Res. 2020, 40, 299–314. [Google Scholar] [CrossRef]
- Anderson, O.L.; Isaak, D.G.; Yamamoto, S. Anharmonicity and the Equation of State for Gold. J. Appl. Phys. 1989, 65, 1534–1543. [Google Scholar] [CrossRef]
- Prescher, C.; Prakapenka, V.B. DIOPTAS: A Program for Reduction of Two-Dimensional X-ray Diffraction Data and Data Exploration. High Press. Res. 2015, 35, 223–230. [Google Scholar] [CrossRef]
- Degen, T.; Sadki, M.; Bron, E.; König, U.; Nénert, G. The High Score Suite. Powder Diffr. 2014, 29, S13–S18. [Google Scholar] [CrossRef]
- Bail, A. Le Whole Powder Pattern Decomposition Methods and Applications: A Retrospection. Powder Diffr. 2005, 20, 316–326. [Google Scholar] [CrossRef]
- Milligan, W.O.; Mullica, D.F.; Beall, G.W.; Boatner, L.A. The Structures of Three Lanthanide Orthophosphates. Inorganica Chim. Acta 1983, 70, 133–136. [Google Scholar] [CrossRef]
- Heuser, J.M.; Neumeier, S.; Peters, L.; Schlenz, H.; Bosbach, D.; Deissmann, G. Structural Characterisation of Metastable Tb- and Dy-Monazites. J. Solid State Chem. 2019, 273, 45–52. [Google Scholar] [CrossRef]
- Couderc, J.J.; Garigue, G.; Lafourcade, L.; Nguyen, Q.T. Standard X-ray Diffraction Powder Patterns. Z. Met. 1959, 50, 708–716. [Google Scholar]
- Jephcoat, A.P.; Hemley, R.J.; Mao, H.K. X-ray Diffraction of Ruby (Al2O3:Cr3+) to 175 GPa. Phys. B+C 1988, 150, 115–121. [Google Scholar] [CrossRef]
- Klotz, S.; Chervin, J.-C.C.; Munsch, P.; Le Marchand, G. Hydrostatic Limits of 11 Pressure Transmitting Media. J. Phys. D Appl. Phys. 2009, 42, 075413. [Google Scholar] [CrossRef]
- Garg, A.B.; Shanavas, K.V.; Wani, B.N.; Sharma, S.M. Phase Transition and Possible Metallization in CeVO4 under Pressure. J. Solid State Chem. 2013, 203, 273–280. [Google Scholar] [CrossRef]
Figure 1.
[001] views of REPO4 structure in the (a) xenotime, (b) monazite, and (c) scheelite phases. RE-O polyhedra are shown in violet, PO4 tetrahedra are shown in grey, and the unit cell boundaries are shown as thin black boxes. The 90° rotation of monazite axes with respect to those of xenotime and scheelite is a result of the monoclinic cell setting of monazite, as shown in detailed transformation schemes reported by Hay et al. [5]. Structures are visualized using the VESTA software [11].

Figure 2.
High-pressure phase map of the experimentally observed phases of all single-RE REPO4s except PmPO4 because Pm is both radioactive and extremely rare. The legend lists the phases with their corresponding space groups. For each composition, the upper limit of the highest bar(s) represents the highest pressure at which data are reported and does not represent a phase boundary. See text for references to the sources of phase data. All phase data are compiled from XRD studies except for PrPO4, which has only been characterized via Raman spectroscopy * [26].

Figure 3.
Plots showing (a) gold lattice parameter and (b) pressure against time during the experiment. Error bars represent standard deviation. The linear fit of the pressure data yields an effective loading rate of 17.2(1) MPa/s. Green, shaded areas represent the pressure range in which a third (post-monazite) phase of DyPO4 appears in the patterns.

Figure 4.
Synchrotron XRD patterns. X, M, and S(TbPO4) ticks show Bragg reflections of xenotime DyPO4, monazite DyPO4, and scheelite TbPO4, the last based on ab initio structural data reported by Lopez-Solano et al. [23]. Star symbols mark emerging monazite peaks at 9.6(7) GPa, and diamond symbols mark emerging peaks of the unidentified phase at 13.9(10) GPa. (a) A contour plot showing all XRD patterns. Peak positions of gold and ruby are marked with triangles and circles, respectively. (b) The LeBail fits of key patterns (initial scan, onset of monazite, onset of unidentified phase, and final scan).

Figure 5.
Pressure dependence of xenotime (x) and monazite (m) DyPO4 lattice parameters. Green, shaded areas represent the pressure range in which a third (post-monazite) phase of DyPO4 exists. The thin gray shaded area represents the hydrostatic limit of the pressure medium: (a) ax; (b) cx; (c) am; (d) bm; (e) cm; (f) βm. All parameters show some irregularity around the hydrostatic limit (10.5(5) GPa). The ax, cx, am, and βm parameters exhibit notable changes in behavior after ~14 GPa.

Figure 6.
Pressure evolution of all DyPO4 lattice parameters for the xenotime (ax and cx) and monazite (am, bm, cm, and βm) phases. Error bars represent standard deviation. The vertical dashed line indicates the xenotime → monazite Ponset. Green, shaded areas represent the pressure range in which a third (post-monazite) phase of DyPO4 exists. The thin gray shaded area represents the hydrostatic limit of the pressure medium. The inset shows the monazite beta angle.


Table 1.
DyPO4 axial compressibilities derived from linear fits of lattice parameter data at pressures below the hydrostatic limit. Negative values indicate compression.
Table 1.
DyPO4 axial compressibilities derived from linear fits of lattice parameter data at pressures below the hydrostatic limit. Negative values indicate compression.
| Lattice Parameter | Axial Compressibility (Å,°/GPa) × 103 | Intercept at 0 GPa (Å,°) | R2 of Linear Fit |
|---|---|---|---|
| ax | −16.09 (12) | 6.907 (1) | 0.9871 |
| cx | −6.238 (127) | 6.045 (1) | 0.8876 |
| am | −10.67 (22) | 6.236 (2) | 0.9921 |
| bm | −11.64 (72) | 6.807 (7) | 0.9326 |
| cm | −11.10 (21) | 6.382 (2) | 0.9934 |
| βm | – | – | – |
Disclaimer/Publisher’s Note: The statements, opinions and data contained in all publications are solely those of the individual author(s) and contributor(s) and not of MDPI and/or the editor(s). MDPI and/or the editor(s) disclaim responsibility for any injury to people or property resulting from any ideas, methods, instructions or products referred to in the content. |
© 2023 by the authors. Licensee MDPI, Basel, Switzerland. This article is an open access article distributed under the terms and conditions of the Creative Commons Attribution (CC BY) license (https://creativecommons.org/licenses/by/4.0/).
Share and Cite
MDPI and ACS Style
Sharma, J.; Afful, H.Q.; Packard, C.E. Phase Transformation Pathway of DyPO4 to 21.5 GPa. Crystals 2023, 13, 249. https://0-doi-org.brum.beds.ac.uk/10.3390/cryst13020249
AMA Style
Sharma J, Afful HQ, Packard CE. Phase Transformation Pathway of DyPO4 to 21.5 GPa. Crystals. 2023; 13(2):249. https://0-doi-org.brum.beds.ac.uk/10.3390/cryst13020249
Chicago/Turabian StyleSharma, Jai, Henry Q. Afful, and Corinne E. Packard. 2023. "Phase Transformation Pathway of DyPO4 to 21.5 GPa" Crystals 13, no. 2: 249. https://0-doi-org.brum.beds.ac.uk/10.3390/cryst13020249
Note that from the first issue of 2016, this journal uses article numbers instead of page numbers. See further details here.