Article

High-Pressure Vibrational and Structural Studies of the Chemically Engineered Ferroelectric Phase of Sodium Niobate

1
Solid State Physics Division, Bhabha Atomic Research Centre, Mumbai 400085, India
2
Homi Bhabha National Institute, Anushaktinagar, Mumbai 400094, India
3
High Pressure Physics Division, Bhabha Atomic Research Centre, Mumbai 400085, India
4
Department of Condensed Matter Physics and Materials Science, Tata Institute of Fundamental Research, Mumbai 400005, India
*
Authors to whom correspondence should be addressed.
Submission received: 7 July 2023 / Revised: 26 July 2023 / Accepted: 26 July 2023 / Published: 29 July 2023
(This article belongs to the Special Issue Pressure-Induced Phase Transformations (Volume II))

Abstract

:
Pure NaNbO3 has an antiferroelectric phase at ambient pressure. The structural behaviour of the chemically engineered ferroelectric phase of sodium niobate, NNBT05: [(0.95) NaNbO3-(0.05) BaTiO3], under high-pressure has been studied using Raman scattering and angle-dispersive synchrotron X-ray diffraction techniques. At pressure > 1 GPa, noticeable changes in the Raman spectra can be seen in the low wavenumber modes (150–300 cm−1). Large changes in the positions and intensities of the Raman bands as a function of pressure provide evidence for structural phase transition. The results indicate significant changes in the bond-lengths and the orientation of the NbO6 octahedra at ~1 GPa, and a transition to the paraelectric phase at ~5 GPa, which are at lower pressures than previously found in pure NaNbO3. The powder X-ray diffraction pattern shows an appreciable change in the peak profile in terms of position and width on increasing pressure. The pressure dependences of the structural parameters show that the response of the lattice parameters to pressure is strongly anisotropic. By fitting the pressure–volume data using the Birch–Murnaghan equation of state, the isothermal bulk modulus was estimated. The experimental results suggest that on doping BaTiO3 in NaNbO3, the bulk modulus increases. The bulk modulus of NNBT05 has been estimated to be 164.5 GPa, which is fairly close to 157.5 GPa, as previously observed in NaNbO3.

1. Introduction

Materials with perovskite structures exhibit diverse crystal structures and physical properties such as (anti)ferroelectricity, relaxor, magnetic, multiferroic properties, etc., and remain pertinent in next generation applications [1,2,3,4,5,6,7,8,9,10,11,12,13,14]. The perovskite structure consists of two types of polyhedra, the octahedron surrounding the B-cation, and the A-cation, coordinated by 12 oxygen atoms forming a cuboctahedron. In the perovskite family, alkaline niobates and their derivatives have attracted a great deal of attention, and are promising candidates for eco-friendly lead-free piezoceramics [10,11,15,16,17].
The application of hydrostatic pressure strongly modifies the short-range interatomic and long-range Coulomb interactions, which are responsible for the structural stability of ferroelectric and antiferrodistortive phases. These phases are associated with the freezing of zone-centre and zone-boundary phonon instabilities. Sodium niobate (NaNbO3) has both these competing instabilities simultaneously. At ambient conditions, sodium niobate crystallizes in the antiferroelectric orthorhombic phase. Sodium niobate perovskite is a textbook example for understanding a complicated series of structural phase changes that occur with temperature and pressure [17,18,19,20,21,22,23,24,25,26,27,28]. Using high pressure Raman scattering techniques, Shiratori et al. [28] have reported transitions at around 2, 6, and 9 GPa, respectively. The pressure-dependent neutron diffraction studied showed that the antiferroelectric (Pbcm) phase transformed to a paraelectric (Pbnm) phase at 8 GPa [19]. Neutron diffraction also revealed changes in the baric behaviour of Nb-O-Nb bond angles as a result of complex reorientations of NbO6 octahedra at high pressures of ~2 GPa [19]. Recent, high pressure X-ray diffraction data suggest that the paraelectric (Pbnm) phase is stable up to 30 GPa [29].
In addition to temperature and pressure, the structure and physical properties of materials can also be tuned by chemical doping. Specific doping elements are used to produce subtle distortions in crystal structures and to regulate changes in their physical properties. For example, when doping the BaTiO3 in the NaNbO3 matrix, there is a significant enhancement in the dielectric and piezoelectric response of the material [30,31,32,33,34]. The structural, dielectric, ferroelectric and piezoelectric properties of NNBTx [(1 − x) NaNbO3 − xBaTiO3] ceramics have been investigated by various researchers [10,16,30,31,33,34,35,36]. This solid solution is similar to Kx Na1−xNbO3 (KNN), except that the KNbO3 has been replaced by BaTiO3. The main problem with KNN is the poor densification of the ceramic due to the high volatility of alkaline oxides, which significantly affects the functional performance of this ceramic [37]. As suggested by Zeng et al. [37], the problem of the poor densification of KNN can be resolved by doping BaTiO3 instead of KNbO3 in the NaNbO3 matrix, because both show similar structural phase transitions. It can also be seen that BaTiO3 based piezo-ceramics show very good electromechanical properties. Raveskii et al. [32] and other researchers have studied the various compositions in the full composition range. They have reported extensive electro-physical properties of this solid solution, with expected structures. It is reported that on increasing the BaTiO3 composition, the dielectric maximum shifts to the lower temperatures and reaches near room temperature for x = 0.25. They also found P-E hysteresis loops with good saturation for x = 0.10. For the same sample, they observed the coercive field EC (11 kV/cm), the spontaneous polarization PS (15 μC/cm2) and residual polarization PR (13 μC/cm2) at 50 Hz. However, the electromechanical properties of the NNBTx in the NaNbO3 are exceptionally remarkable. The literature contains very little information about the structural phase transition with composition and temperature. Most of the reports contain only knowledge of expected room temperature structures probed using X-ray diffraction studies. Raveskii et al. [32] have proposed the monoclinic structure of the compositions x~0.05–0.07 at room temperature.
Earlier, we reported the crystal structure and phase stability of the NNBTx system for the small doping of BaTiO3 (x = 0.0 to 0.15). We reported an orthorhombic antiferroelectric phase (space group: Pbcm) for x < 0.02, an orthorhombic ferroelectric phase (space group: Pmc21) for 0.02 < x < 0.10, and an orthorhombic ferroelectric phase (space group: Amm2) for x ≥ 0.10. We also reported the phase transitions as a function of temperature for NNBT03 and 05 using powder X-ray and neutron diffraction studies in conjunction with dielectric and Raman scattering measurements [30,31,35,36]. Apart from this, we provided evidence of the existence of a functional monoclinic phase at low temperatures. This monoclinic (Cc) phase is expected to provide easy polarization rotation at low temperatures for the compositions x = 0.03 (NNBT03) and x = 0.05 (NNBT05).
The application of pressure either distorts or symmetrises the structure and causes the alteration of the crystal symmetry with huge consequences on the physical properties. The present study gives insight into the unique pressure-dependent phase stability of chemically engineered ferroelectric NaNbO3, i.e., NNBT05, and aims to deepen the understanding of structural distortion in this material. It also helps in the understanding of the role of doping on pressure responses and the phase stability of the ferroelectric phase. The pressure dependence of the powder X-diffraction and Raman scattering experiments will be used to understand the microscopic origin of the structural and vibrational properties of the sample. At pressure > 1 GPa, noticeable changes in the Raman spectra are seen in the low wavenumber modes (150–300 cm−1). These observations are most likely associated with octahedral reorientations in the parent ferroelectric phase. A detailed analysis of the high-pressure X-ray diffraction data suggests that the response of the lattice parameters to pressure is strongly anisotropic. By fitting the pressure–volume data using the Birch–Murnaghan equation of state, the isothermal bulk modulus can be estimated. We found that on doping BaTiO3 in NaNbO3, the bulk modulus increases.

2. Materials and Methods

The solid solution NNBT05 was prepared with the solid-state reaction method. Dried powders of high purity Na2CO3, BaCO3, Nb2O5 and TiO2 were taken in the stoichiometric ratios and were mixed in a planetary ball mill for 12 h in acetone medium. The mixtures were calcined in the air at 1173 K. The phase purity of the solid solutions was confirmed with powder diffraction data. The calcined powders were then sintered at 1273 K for 6 h. The sintered pellets were crushed into fine powders and were used for the high-pressure X-ray diffraction and Raman scattering measurements.
Angle-dispersive X-ray powder diffraction patterns at high pressures up to 30 GPa and at ambient temperature were measured at the BL-11 beamline at INDUS-2 India. The diffraction images were collected with the wavelength λ = 0.79997 Å on the MAR345 detector located at a distance of 190 mm from the sample. The two-dimensional X-ray diffraction (XRD) images were converted to one-dimensional diffraction patterns using the FIT2D program. The data at each pressure level were analysed with the Rietveld refinement method using the FULLPROF program [38]. A Thompson–Cox–Hastings pseudo-Voigt with Axial divergence asymmetry function was used to model the peak profiles. The background was fitted using a Chebychev polynomial. Except for the occupancy parameters of the atoms, which were fixed corresponding to the nominal composition, all other parameters, i.e., scale factor, zero displacement, and isotropic profile parameters, lattice parameters, isotropic thermal parameters, and positional coordinates, were refined.
High pressure Raman experiments were performed using an in-house-made Mao-Bell type of diamond anvil cell. Raman spectra were recorded at increasing and decreasing pressures using a 514.5 nm excitation wavelength from a mixed gas laser (model: Stabilite 2018 from Spectra Physics) and a triple grating Raman spectrometer (T64000 from Horiba Jobin Yvon) equipped with a liquid nitrogen cooled charge coupled device. We used the holographic grating with 1800 g/mm and a 20-micron exit slit with a spectrometer focal length of 1 m, which resulted in 0.7 cm−1 optical resolution of the spectra.
High pressure X-ray diffraction and Raman experiments were carried out using a Mao Bell kind of diamond anvil cell, which was equipped with diamonds with a culet size of ~400 microns. The sample was loaded into a hole of 100 μm and drilled in a pre-indented 50 μm thick tungsten gasket. Methanol/ethanol in the ratio of 4:1, which is known to be quasi hydrostatic upto 10 GPa [39], was used as the pressure transmitting medium, and florescence peaks from ruby sphere were used to estimate the pressure inside the sample chamber of the diamond anvil cell. Care was taken to load a very tiny sample so that the environment around the sample remained quasi hydrostatic [40]. The limitations of the present Raman spectroscopic setup made it difficult to investigate Raman spectra below 150 cm−1.

3. Results and Discussion

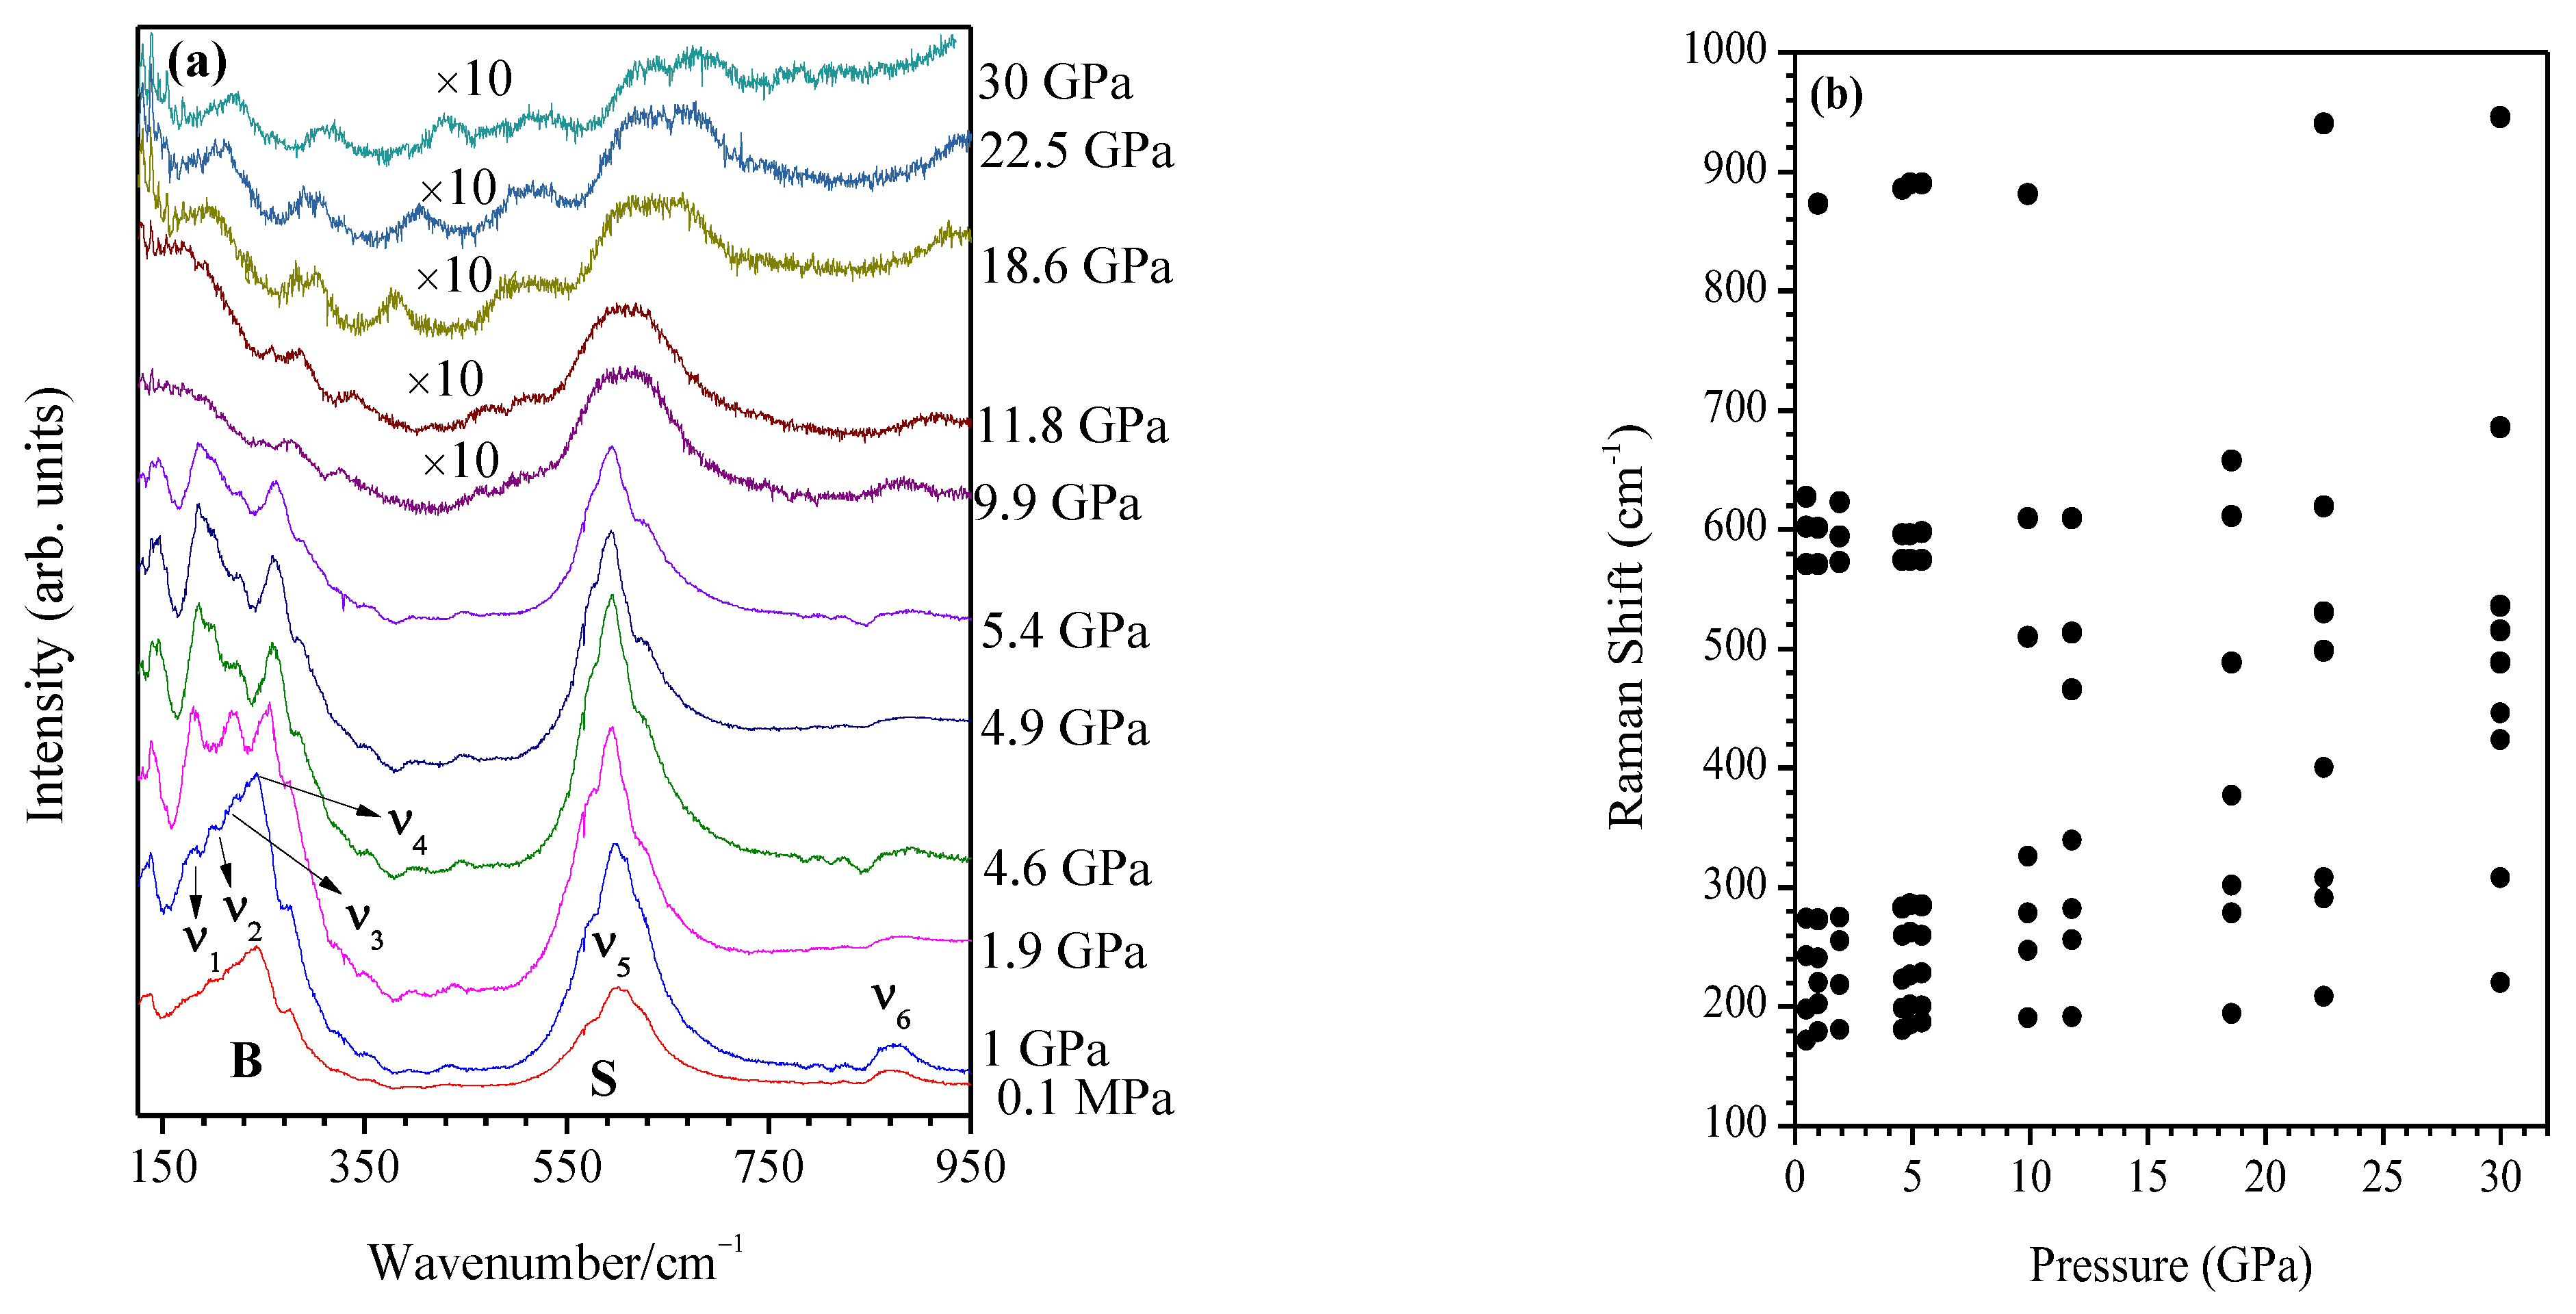
3.1. High Pressure Raman Scattering Study

The high symmetry phase of the ABO3 perovskite compound had a cubic structure. In these compounds, the condensation of different phonon instabilities led to phase transitions. The A atoms (Na/Ba) were located at the cubic structure’s eight corners, while the B atoms (Nb/Ti) were situated in the body’s centre. The oxygen (six atoms) was arranged at the face-centred site and forms an octahedron. The Raman modes, also known as translational (Tr), librational (L), bending (B), and stretching (S) modes, were produced as a result of these atoms’ vibrations. The roto-vibrational motion of the oxygen octahedra, the translational motion of the A ions against the BO6 octahedra, and the bending of the BO6 octahedra linkages gave rise to these modes. For systems of the ABO3 type, these are collectively referred to as external modes. The bending and stretching motion of the oxygen octahedra’s O-B-O bonds caused the internal modes of the octahedra, known as the bending (B) and stretching (S) modes.
As said earlier, the NNBT05 ambient phase structure had orthorhombic symmetry (space group: Pmc21; tilt system: aac+) with unit cell dimensions 2aP × √2aP × √2aP and four numbers of formula units, i.e., a total of 20 atoms (see Figure 1a), and it was ferroelectric in nature. Here, aP is the lattice constant of the parent cubic phase. The group theoretical analysis gave 57 Raman active modes, represented by ΓRaman = 16A1 + 13A2 + 12B1 + 16B2. Due to the non-centrosymmetric structure, except for the A2 mode, these Raman active modes were simultaneously IR active. The number of observed modes was lower compared to the expected number of modes due to the peaks in the experimental Raman spectrum not being properly resolved, and due to accidental degeneracy. Generally, at elevated temperatures and pressures, the cation displacements from the centre of the octahedra (which results in nonzero polarization) may become vanishingly small and the structure may transform to the centrosymmetric orthorhombic paraelectric (Pnma) phase. This phase also had similar cell dimensions to ferroelectric (Pmc21) and in total 20 atoms in the primitive cell (Figure 1b). The number of Raman active modes in this phase (in another setting of Pbnm) was 24, 7Ag + 5B2g + 7B2g + 5B3g.
Figure 2 depicts the evolution of the high-pressure Raman spectra of NNBT05 at selected pressures and room temperature. For pressure > 1 GPa, distinct changes in the low wavenumber modes (150–300 cm−1) region of the Raman spectra were observed. The peaks containing the most prominent changes were denoted ν1, ν2, ν3, and ν4 (bending mode: 150–300 cm−1) and showed drastic changes in their relative intensity in the pressure range 1 to 5.4 GPa. These observations at ~1 Gpa are most likely associated with octahedral reorientation in the parent ferroelectric phase, as has also been found earlier in pure NaNbO3. The change in Raman spectra at ~4.6 GPa may be a signature of structural phase transition from the ferroelectric phase (Pmc21) to the paraelectric phase (Pbnm). We noted that the paraelectric transition was observed in pure NaNbO3 at ~8 GPa. On further increasing the pressure above 5.4 GPa, the intensities of these peaks reduced and the stretching modes (500–750 cm−1) centred around 584 cm−1 became merged. Figure 2b shows the fitted positions of the Raman bands. In literature [41], it was shown that even the 4:1 methanol/ethanol transmitting medium had Raman active modes assigned to the C-C stretch at ~450 and 880 cm−1. However, we would like to mention here that these modes were very weak and were not discernible in the presence of relatively stronger Raman scatterers. In the Raman spectra depicted in Figure 2a, we can clearly see that there was no interference from these modes.
The frequency evolution showed a blue-shift trend with increasing pressure. It is evident from Figure 2 that the frequencies of Nb-O stretching modes at ~500–700 cm−1 increased with the pressure, implying a shortening of the Nb–O bond length. For pressure above 5.4 GPa, the Raman modes became very broad and weak, which could be due to an onset of disorder or due to a phase with a weak Raman response. In nanoporous silicon, it has been observed that though the Raman spectra showed very weak broad Raman modes and were termed a glassy phase, it actually was a crystalline phase which had very weak Raman activity, also because it was metallic [42]. At this point, we would also like to mention that even though the sample environment was quasi-hydrostatic, even up to ~10 Gpa, we cannot rule out the presence of some small pressure inhomogeneities, which could lead to the broadening of the Raman modes. However, on the release of pressure, the Raman modes of the parent phase were observed and so the broadening and reduction in the intensity of the Raman modes could be attributed to a reversible phase transition and not to the pressure inhomogeneities. To ascertain if indeed the high-pressure phase was disordered or it was a new crystalline phase, we carried out high pressure X-ray diffraction studies.

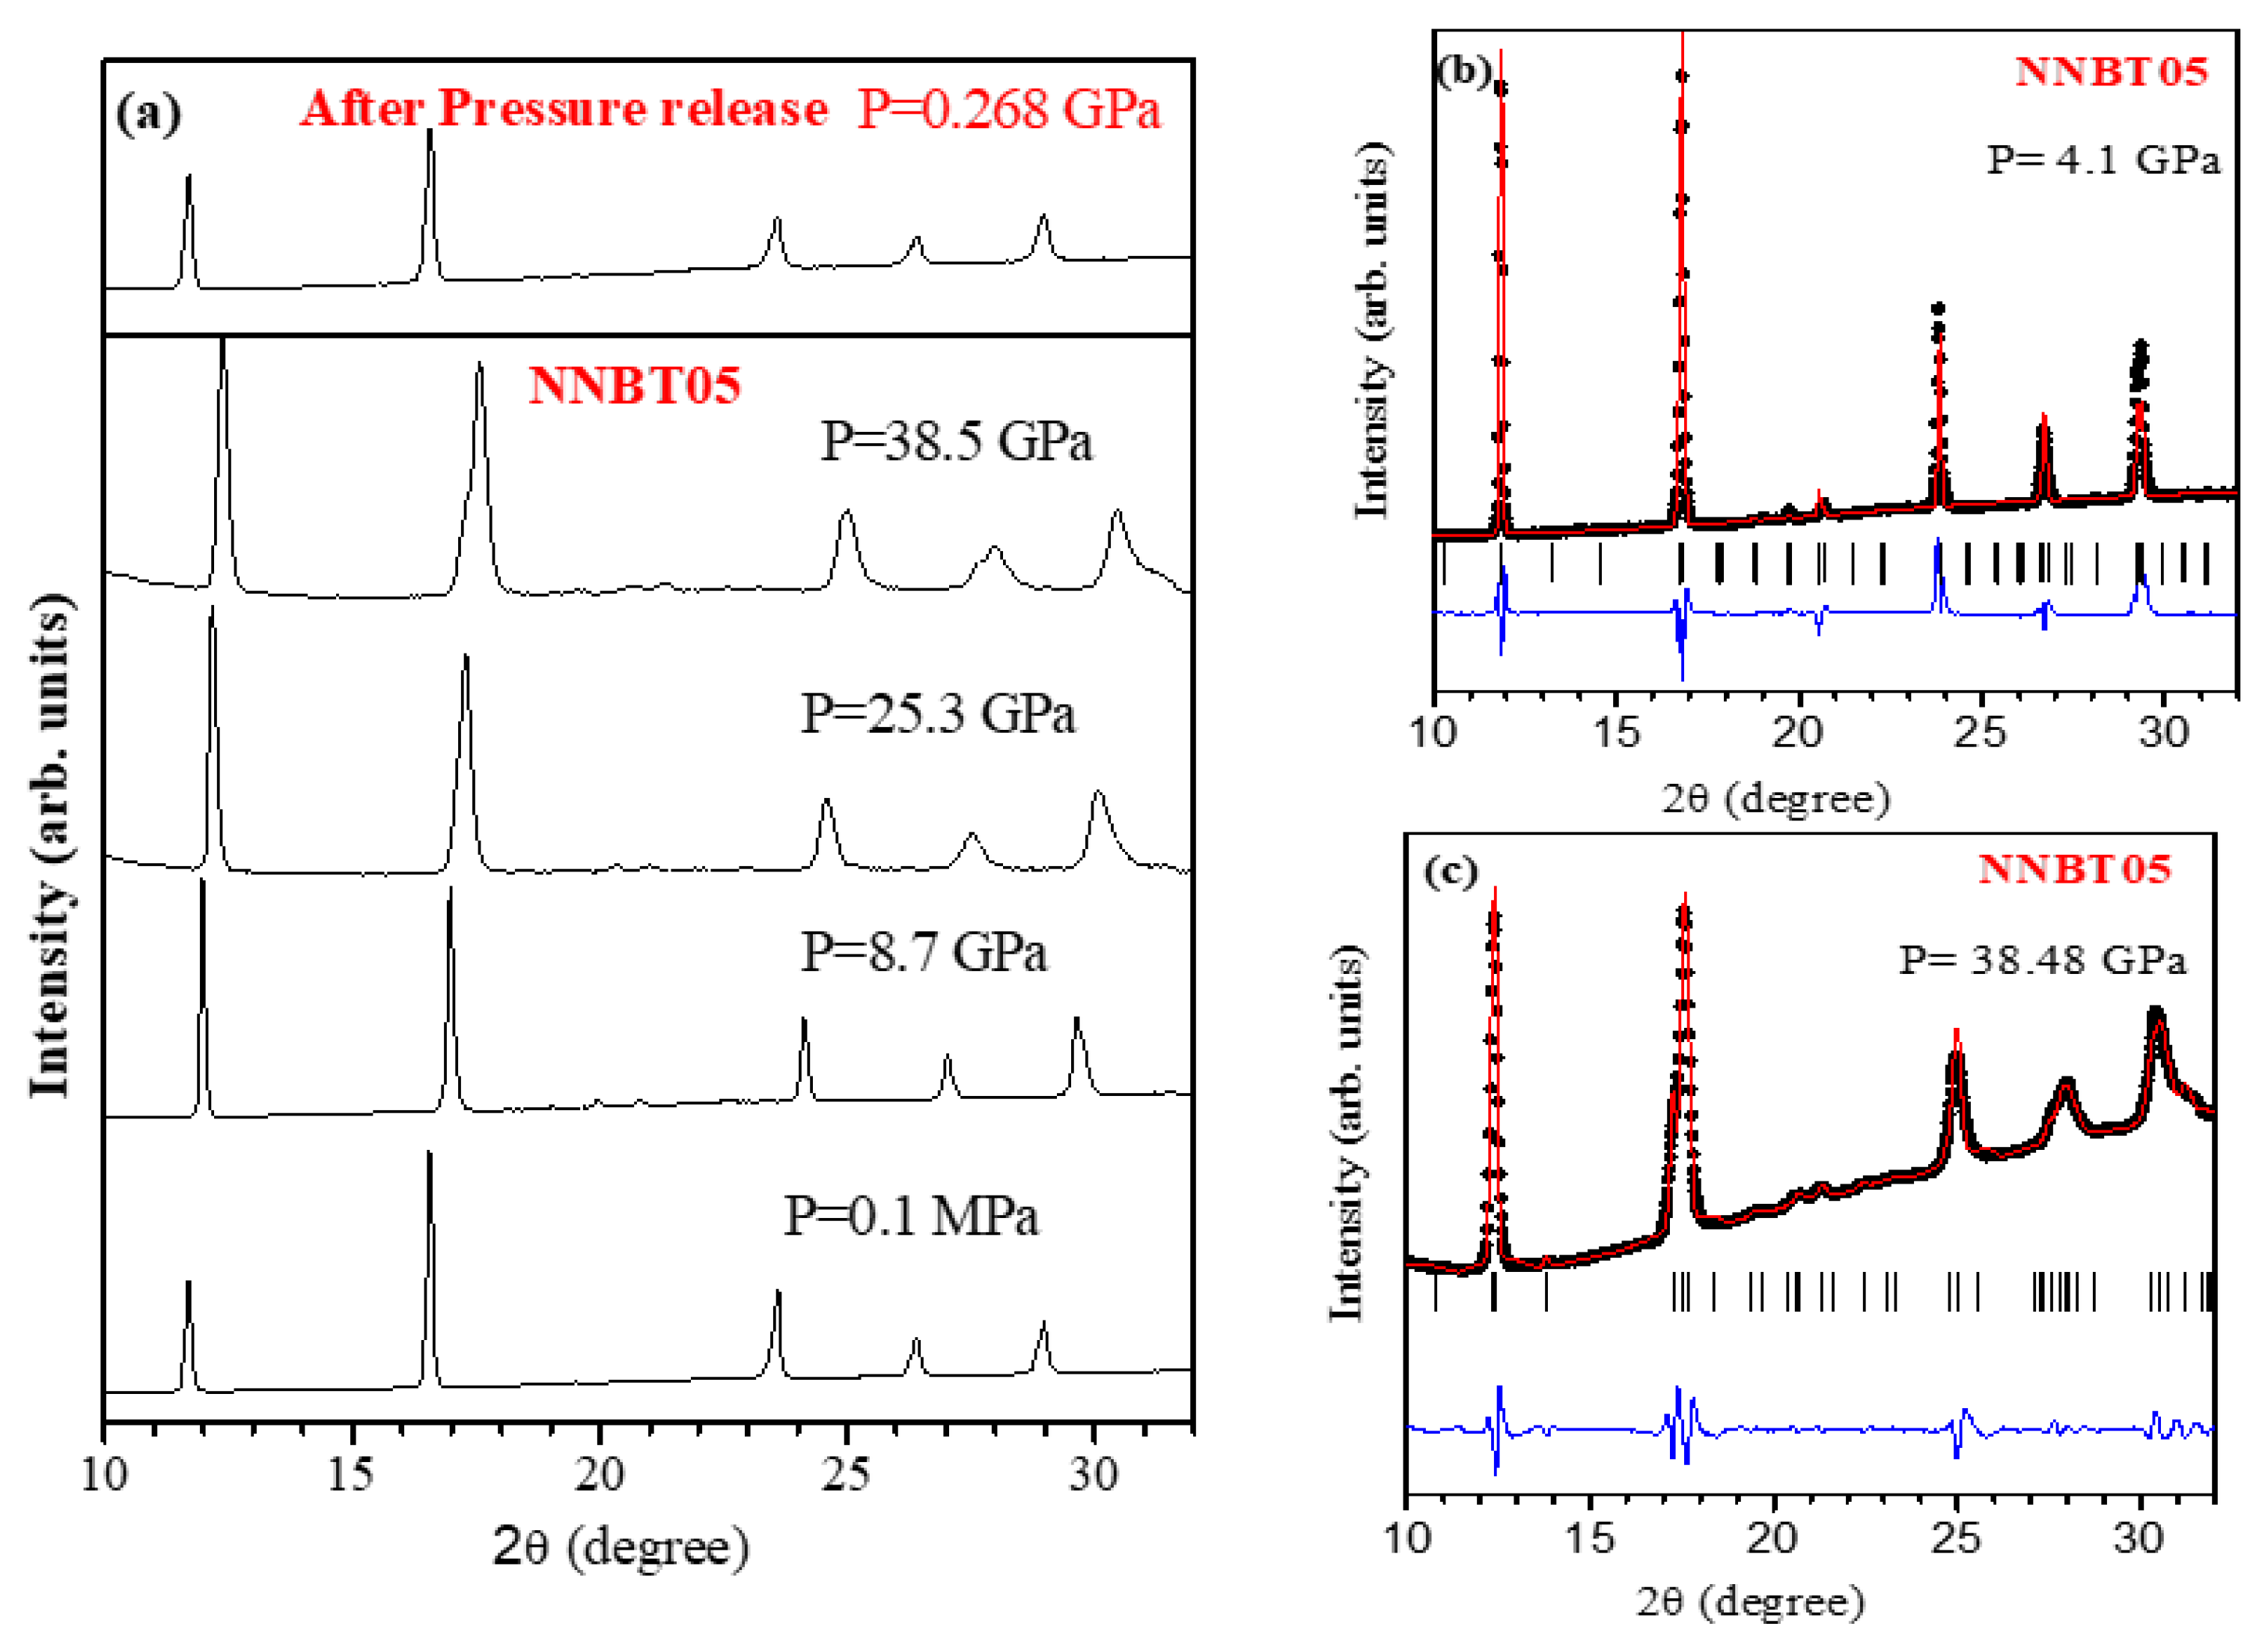
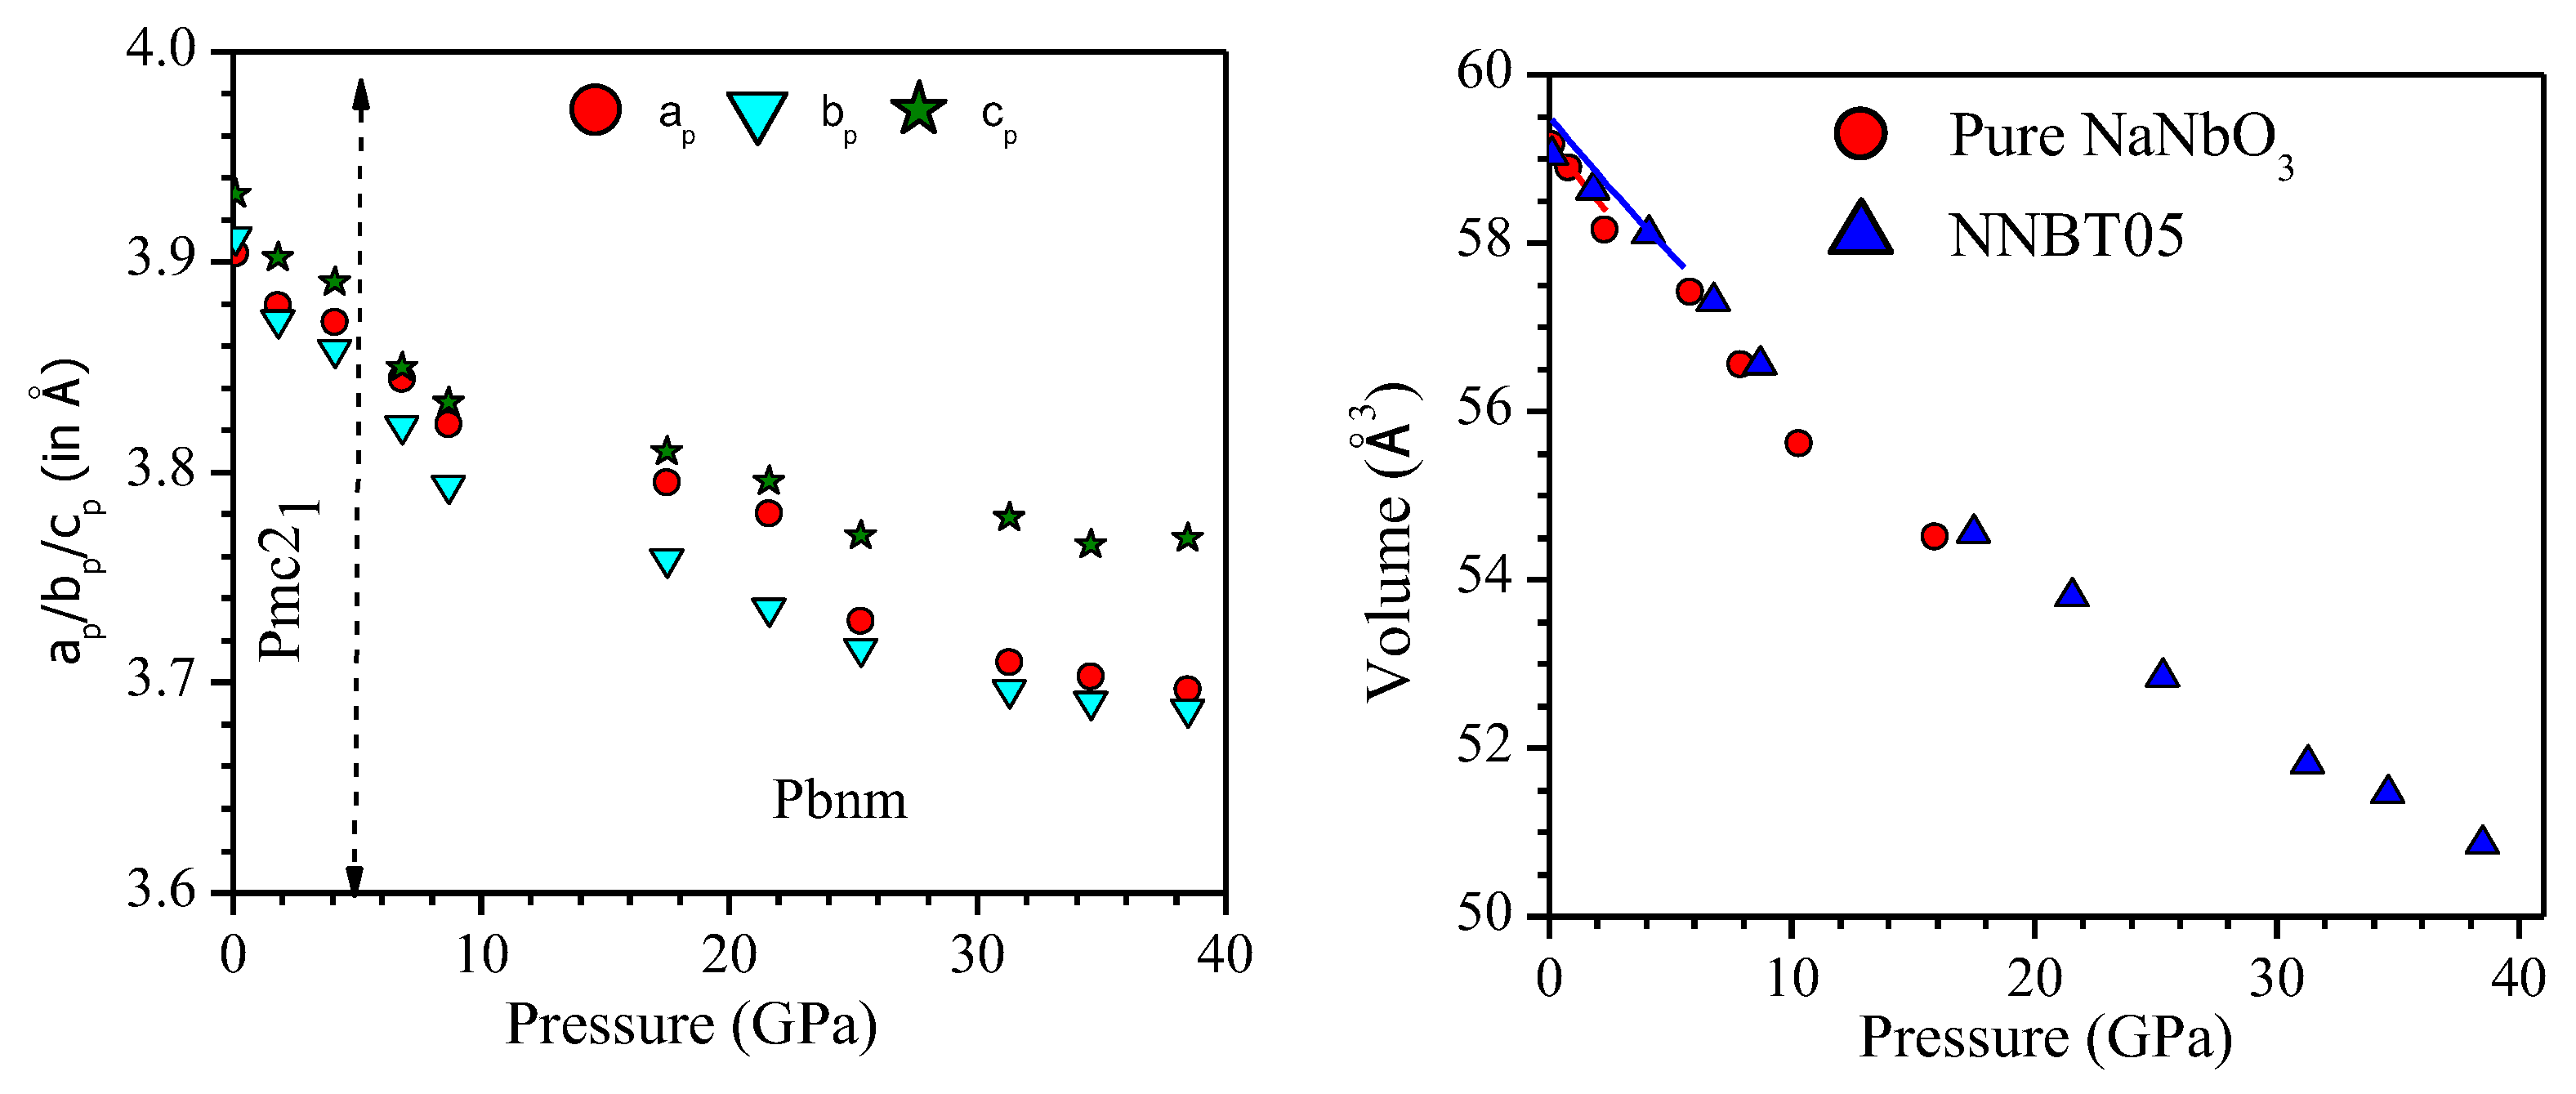
3.2. High Pressure X-ray Diffraction Study

High pressure X-ray diffraction patterns of NNBT05 were collected at 11 pressures up to 40 GPa in a pressure-increasing cycle. Figure 3 depicts the quality of the powder X-ray diffraction patterns at selected pressure levels. It is evident from this figure that on increasing the pressure, the diffraction peaks systematically shift towards higher angles, indicating the compression of the lattice parameters. To investigate the structural parameters with pressure, we carried out a detailed Rietveld analysis of the high-pressure X-ray diffraction data.
The detailed Rietveld refinement of the powder–diffraction data showed that the synchrotron powder diffraction pattern at 300 K could be indexed using the orthorhombic structure (space group Pmc21) in a low pressure range. Figure 3b shows the quality of Rietveld refinement of high-pressure powder diffraction data at 4.1 GPa. For a pressure range P > 4.1, the ferroelectric (Pmc21) structural model in the refinements gave highly correlated atomic positions.
The high pressure neutron diffraction study on pure sodium niobate clearly revealed a structural phase transition from the orthorhombic antiferroelectric to paraelectric phase (Pbnm) above 8 GPa. In view of this, we refined the high-pressure synchrotron X-ray diffraction data using the paraelectric orthorhombic phase Pbnm, which accounted for all the reflections and gave nearly similar goodness-of-fit parameters compared with the space group Pmc21. However, it should be noted that the total number of variable structural parameters for Pmc21 was doubled (20) compared to the Pbnm space group (10 parameters). Even doubling the variable parameters did not help to improve the fitting. Hence, the latter phase has been preferred over the ferroelectric (Pmc21) phase. The Rietveld refinements using the orthorhombic (Pbnm) phase proceeded smoothly, revealing a monotonic decrease in lattice constants and cell volume with the pressure increasing up to 38.5 GPa. Structural parameters obtained after the Rietveld refinement for the compound are given in Table 1. The X-ray powder diffraction results indicate that the broadening and weakening of Raman modes beyond 5.4 GPa cannot be attributed to a disordered phase. It is possible that this high-pressure phase is weakly Raman active.
The pressure dependences of the lattice parameters and unit cell volume obtained after the Rietveld refinement of high-pressure synchrotron diffraction data are shown in Figure 4. For easy comparison with Figure 2, we used pseudocubic lattice parameters for the orthorhombic phase using the relations ap = Ao/√2, bp = Bo/√2, and cp = Co/2, where ap, bp, cp, Ao, Bo, and Co are lattice parameters corresponding to the equivalent pseudocubic and orthorhombic phases, respectively. It is clear from Figure 5 that on increasing the pressure, the lattice parameters monotonically decreased in the entire range of our measurements for NNBT05. However, unlike the ‘b’ and ‘c’ lattice constants, ‘a’ showed a sudden decrease around 23 GPa. This could not be attributed to the non-hydrostatic stresses caused due to the freezing of the pressure transmitting medium. If we look at the structure of sodium niobate along the b and c axes, we can see that there was only one octahedra, whereas along the ‘a’ axes there were two corner-shared octahedra. With pressure, there is a possibility of bending of the octahedral hinge, thus drastically reducing the lattice constant along the ‘a’ axes.
From Figure 4, it can be seen that the lattice compression of the orthorhombic phase of NNBT05 was anisotropic. The compressibility of the ‘c’ parameter was smaller in comparison with those of the ‘a’ and ‘b’ parameters. Compressibility (at ambient conditions (1/l (dl/dP)) along a, b, and c was 0.0028, 0.0025 and 0.0020 GPa−1, respectively. This may be compared with the values for pure NaNbO3, which showed the compressibility along a, b, and c as 0.0027, 0.0022, and 0.0018 GPa−1, respectively. The compressibility in the high-pressure paraelectric phase in NaNbO3 was very different from that in the low-pressure phase. However, in NNBT05, we did not find any significant discontinuous change in the compressibility as a function of pressure. Fitting the pressure versus volume data with a third-order Birch–Murnaghan equation of state gave a bulk modulus B (≈164.5 ± 1.0) GPa (with B′ = 4 fixed) for the orthorhombic phase at room temperature. This experimental bulk modulus in NNBT05 was fairly close to that in NaNbO3 (B ≈ 157.5 GPa) at room temperature.
It is evident from the foregoing discussion that the doping of BaTiO3 in the NaNbO3 matrix results in reduced compressibility, because on doping the free space in the A-containing cuboctahedron reduces. It was found that in perovskites in which the A cation has a lower formal charge than the B cation, the AO12 sites are more compressible than the BO6 octahedra (see Figure 5). To reduce the unit cell volume, the tilts of the BO6 octahedra increased with increasing pressure [43]. Thus, the application of pressure drives this type of perovskite structure away from the phase transition boundary to higher-symmetry structures.
On the basis of the Raman experimental results, we can conclude that NNBT05 showed changes in the Raman spectra from 1 to 1.9 GPa, 1.9 to 4.6 GPa, and above 5.4 GPa. Below 5.4 GPa, the spectra evolved continuous changes. It can be seen that the intensity of phonons located at 150–350 cm−1 gradually changed with increasing pressure, up to 5.4 GPa. Then, these Raman peaks merged and became broad peaks as the pressure reached 9.9 GPa. Meanwhile, BO6 octahedra showed a growing distortion under higher pressure, as a result of the volume shrinkage. Hence, additional changes to the Raman spectra occurred when the pressure held at more than 10 GPa. As shown for pure NaNbO3, the observed anomalies in Raman spectra at a low pressure of ~2 GPa were mainly attributed to significant changes in Nb-O-Nb bond angles as a result of complex reorientations of NbO6 octahedra [19,29]. On the other hand, the lattice beyond 8 GPa belonged to a paraelectric orthorhombic phase with space group Pbnm. Increasing the pressure resulted in a shrinking of the polyhedral volume, and the cation was displaced towards the symmetric position to avoid over bonding. In addition to this, the ab-initio calculation of the enthalpy in the various phases of NaNbO3 [19] also supported the stabilization of the paraelectric (Pbnm) phase at high pressure. In view of this, we may conclude that on application of pressure, the ferroelectric phase of NNBT05 may transform to the paraelectric phase at a high pressure of ~5 GPa, which is lower than the transition pressure of ~8 GPa in pure NaNbO3. Since structural changes in the structure of the dodecahedra are very small due to changes in the average ionic radii in A and B positions, at 5% substitution, the lowering of pressure could be attributed to the chemical pressure introduced due to the substitution of BaTiO3.

4. Conclusions

In summary, we have investigated the effect of pressure on the crystal structure and structural phase transition behaviour in the engineered ferroelectric phase of sodium niobate using Raman scattering and powder X-ray diffraction techniques. At pressure > 1 GPa, noticeable changes in the Raman spectra were seen in the low wavenumber modes (150–300 cm−1). These observations are most likely associated with significant changes in Nb-O-Nb bond angles as result of complex reorientations of NbO6 octahedra in the parent ferroelectric phase, as in pure NaNbO3. Further changes were observed at ~4.6 GPa, which may be due to a transition to the paraelectric phase, which has a lower pressure than that of ~8 GPa in pure NaNbO3. For pressure levels greater than 5.4 GPa, the Raman spectrum became diffusive and may be associated with an increase in inhomogeneities in the crystal. We have determined the bulk modulus of NNBT05 to be 164.5 GPa, which is fairly close to that of 157.5 GPa observed in NaNbO3.

Author Contributions

S.K.M., R.M., N.G. and S.L.C. formulated the problem. N.G. carried out the high-pressure Raman and X-ray diffraction experiments. S.G. performed high-pressure Raman experiments. S.K.M. and N.G. analyzed experimental data. All the authors discussed the results and wrote the manuscript. All authors have read and agreed to the published version of the manuscript.

Funding

This research received no external funding.

Data Availability Statement

The data that support the findings of this study are available from the corresponding author upon reasonable request.

Acknowledgments

S.L.C. thanks the Indian National Science Academy for the financial support of the INSA Senior Scientist position.

Conflicts of Interest

The authors declare that they have no known competing financial interest or personal relationship that could have appeared to influence the work reported in this paper.

References

  1. Lines, M.E.; Glass, A.M. Principles and Applications of Ferroelectrics and Related Materials; Oxford University Press: Oxford, UK, 2001. [Google Scholar]
  2. Fujimoto, M. The Physics of Structural Phase Transitions; Springer: New York, NY, USA, 2005. [Google Scholar] [CrossRef]
  3. Cross, E. Lead-free at last. Nature 2004, 432, 24–25. [Google Scholar] [CrossRef] [PubMed]
  4. Xu, Y. Ferroelectric Materials and Their Applications; Sole distributors for the USA and Canada, Elsevier Science Pub. Co.: Amsterdam, The Netherlands; New York, NY, USA, 1991. [Google Scholar]
  5. Saito, Y.; Takao, H.; Tani, T.; Nonoyama, T.; Takatori, K.; Homma, T.; Nagaya, T.; Nakamura, M. Lead-free piezoceramics. Nature 2004, 432, 84–87. [Google Scholar] [CrossRef] [PubMed]
  6. Rabe, K.M.; Ahn, C.; Triscone, J.M. Physics of Ferroelectrics: A Modern Perspective; Springer: Berlin, Germany, 2007; Volume 105. [Google Scholar]
  7. Rödel, J.; Webber, K.G.; Dittmer, R.; Jo, W.; Kimura, M.; Damjanovic, D. Transferring lead-free piezoelectric ceramics into application. J. Eur. Ceram. Soc. 2015, 35, 1659–1681. [Google Scholar] [CrossRef]
  8. Scott, J.F. Applications of Modern Ferroelectrics. Science 2007, 315, 954. [Google Scholar] [CrossRef] [PubMed]
  9. Ye, Z.-G. Handbook of Advanced Dielectric, Piezoelectric and Ferroelectric Materials: Synthesis, Properties and Applications; Elsevier: Amsterdam, The Netherlands, 2008. [Google Scholar]
  10. Zheng, T.; Wu, J.; Xiao, D.; Zhu, J. Recent development in lead-free perovskite piezoelectric bulk materials. Prog. Mater. Sci. 2018, 98, 552–624. [Google Scholar] [CrossRef]
  11. Htet, C.S.; Nayak, S.; Manjón-Sanz, A.; Liu, J.; Kong, J.; Sørensen, D.R.; Marlton, F.; Jørgensen, M.R.V.; Pramanick, A. Atomic structural mechanism for ferroelectric-antiferroelectric transformation in perovskite NaNbO3. Phys. Rev. B 2022, 105, 174113. [Google Scholar] [CrossRef]
  12. Vilarinho, R.; Bouvier, P.; Guennou, M.; Peral, I.; Weber, M.C.; Tavares, P.; Mihalik, M.; Mihalik, M.; Garbarino, G.; Mezouar, M.; et al. Crossover in the pressure evolution of elementary distortions in RFe3 perovskites and its impact on their phase transition. Phys. Rev. B 2019, 99, 064109. [Google Scholar] [CrossRef] [Green Version]
  13. Xiang, H.J.; Guennou, M.; Íñiguez, J.; Kreisel, J.; Bellaiche, L. Rules and mechanisms governing octahedral tilts in perovskites under pressure. Phys. Rev. B 2017, 96, 054102. [Google Scholar] [CrossRef] [Green Version]
  14. Zhou, J.S. Structural distortions in rare-earth transition-metal oxide perovskites under high pressure. Phys. Rev. B 2020, 101, 224104. [Google Scholar] [CrossRef]
  15. Mishra, S.K.; Choudhury, N.; Chaplot, S.L.; Krishna, P.S.R.; Mittal, R. Competing antiferroelectric and ferroelectric interactions in NaNbO3 Neutron diffraction and theoretical studies. Phys. Rev. B 2007, 76, 024110. [Google Scholar] [CrossRef] [Green Version]
  16. Xie, A.; Qi, H.; Zuo, R.; Tian, A.; Chen, J.; Zhang, S. An environmentally-benign NaNbO3 based perovskite antiferroelectric alternative to traditional lead-based counterparts. J. Mater. Chem. C 2019, 7, 15153–15161. [Google Scholar] [CrossRef]
  17. Xu, Q.; Li, T.; Hao, H.; Zhang, S.; Wang, Z.; Cao, M.; Yao, Z.; Liu, H. Enhanced energy storage properties of NaNbO3 modified Bi0.5Na0.5TiO3 based ceramics. J. Eur. Ceram. Soc. 2015, 35, 545–553. [Google Scholar] [CrossRef]
  18. Mishra, S.K.; Mittal, R.; Pomjakushin, V.Y.; Chaplot, S.L. Phase stability and structural temperature dependence in sodium niobate: A high-resolution powder neutron diffraction study. Phys. Rev. B 2011, 83, 134105. [Google Scholar] [CrossRef] [Green Version]
  19. Mishra, S.K.; Gupta, M.K.; Mittal, R.; Chaplot, S.L.; Hansen, T. Suppression of antiferroelectric state in NaNbO3 at high pressure from in situ neutron diffraction. Appl. Phys. Lett. 2012, 101, 242907. [Google Scholar] [CrossRef] [Green Version]
  20. Mishra, S.K.; Gupta, M.K.; Mittal, R.; Zbiri, M.; Rols, S.; Schober, H.; Chaplot, S.L. Phonon dynamics and inelastic neutron scattering of sodium niobate. Phys. Rev. B 2014, 89, 184303. [Google Scholar] [CrossRef] [Green Version]
  21. Lanfredi, S.; Lente, M.H.; Eiras, J.A. Phase transition at low temperature in NaNbO3 ceramic. Appl. Phys. Lett. 2002, 80, 2731–2733. [Google Scholar] [CrossRef]
  22. Lima, R.J.C.; Freire, P.T.C.; Sasaki, J.M.; Ayala, A.P.; Melo, F.E.A.; Mendes Filho, J.; Serra, K.C.; Lanfredi, S.; Lente, M.H.; Eiras, J.A. Temperature-dependent Raman scattering studies in NaNbO3 ceramics. J. Raman Spectrosc. 2002, 33, 669–674. [Google Scholar] [CrossRef]
  23. Lin, S.J.; Chiang, D.P.; Chen, Y.F.; Peng, C.H.; Liu, H.T.; Mei, J.K.; Tse, W.S.; Tsai, T.R.; Chiang, H.P. Raman scattering investigations of the low-temperature phase transition of NaNbO3. J. Raman Spectrosc. 2006, 37, 1442–1446. [Google Scholar] [CrossRef]
  24. Shen, Z.X.; Wang, X.B.; Kuok, M.H.; Tang, S.H. Raman scattering investigations of the antiferroelectric–ferroelectric phase transition of NaNbO3. J. Raman Spectrosc. 1998, 29, 379–384. [Google Scholar] [CrossRef]
  25. Shen, Z.X.; Wang, X.B.; Tang, S.H.; Kuok, M.H.; Malekfar, R. High-pressure Raman study and pressure-induced phase transitions of sodium niobate NaNbO3. J. Raman Spectrosc. 2000, 31, 439–443. [Google Scholar] [CrossRef]
  26. Shiratori, Y.; Magrez, A.; Dornseiffer, J.; Haegel, F.-H.; Pithan, C.; Waser, R. Polymorphism in Micro-, Submicro-, and Nanocrystalline NaNbO3. J. Phys. Chem. B 2005, 109, 20122–20130. [Google Scholar] [CrossRef]
  27. Shiratori, Y.; Magrez, A.; Fischer, W.; Pithan, C.; Waser, R. Temperature-induced Phase Transitions in Micro-, Submicro-, and Nanocrystalline NaNbO3. J. Phys. Chem. C 2007, 111, 18493–18502. [Google Scholar] [CrossRef]
  28. Shiratori, Y.; Magrez, A.; Kato, M.; Kasezawa, K.; Pithan, C.; Waser, R. Pressure-Induced Phase Transitions in Micro-, Submicro-, and Nanocrystalline NaNbO3. J. Phys. Chem. C 2008, 112, 9610–9616. [Google Scholar] [CrossRef]
  29. Kichanov, S.E.; Kozlenko, D.P.; Belozerova, N.M.; Jabarov, S.H.; Mehdiyeva, R.Z.; Lukin, E.V.; Mammadov, A.I.; Liermann, H.P.; Morgenroth, W.; Dubrovinsky, L.S.; et al. An intermediate antipolar phase in NaNbO3 under compression. Ferroelectrics 2017, 520, 22–33. [Google Scholar] [CrossRef]
  30. Jauhari, M.; Mishra, S.K.; Mittal, R.; Sastry, P.U.; Chaplot, S.L. Effect of chemical pressure on competition and cooperation between polar and antiferrodistortive distortions in sodium niobate. Phys. Rev. Mater. 2017, 1, 074411. [Google Scholar] [CrossRef]
  31. Jauhari, M.; Mishra, S.K.; Mittal, R.; Chaplot, S.L. Probing of structural phase transitions in barium titanate modified sodium niobate using Raman scattering. J. Raman Spectrosc. 2019, 50, 1177–1185. [Google Scholar] [CrossRef] [Green Version]
  32. Raevskii, I.P.; Proskuryakova, L.M.; Reznichenko, L.A.; Zvorykina, E.K.; Shilkina, L.A. Obtaining solid solutions in the NaNbO3-BaTiO3 system and investigation of its properties. Sov. Phys. J. 1978, 21, 259–261. [Google Scholar] [CrossRef]
  33. Zuo, R.; Qi, H.; Fu, J.; Li, J.; Shi, M.; Xu, Y. Giant electrostrictive effects of NaNbO3-BaTiO3 lead-free relaxor ferroelectrics. Appl. Phys. Lett. 2016, 108, 232904. [Google Scholar] [CrossRef] [Green Version]
  34. Zuo, R.; Qi, H.; Fu, J.; Li, J.-F.; Li, L. Multiscale identification of local tetragonal distortion in NaNbO3-BaTiO3 weak relaxor ferroelectrics by Raman, synchrotron x-ray diffraction, and absorption spectra. Appl. Phys. Lett. 2017, 111, 132901. [Google Scholar] [CrossRef]
  35. Jauhari, M.; Mishra, S.K.; Poswal, H.K.; Mittal, R.; Chaplot, S.L. Evidence of low-temperature phase transition in BaTiO3-modified NaNbO3: Raman spectroscopy study. J. Raman Spectrosc. 2019, 50, 1949–1955. [Google Scholar] [CrossRef]
  36. Mishra, S.K.; Mrinal, J.; Mittal, R.; Krishna, P.S.R.; Reddy, V.R.; Chaplot, S.L. Evidence for existence of functional monoclinic phase in sodium niobate based solid solution by powder neutron diffraction. Appl. Phys. Lett. 2018, 112, 182905. [Google Scholar] [CrossRef] [Green Version]
  37. Zeng, J.T.; Kwok, K.W.; Chan, H.L.W. Ferroelectric and Piezoelectric Properties of Na1−xBaxNb1−xTixO3 Ceramics. J. Am. Ceram. Soc. 2006, 89, 2828–2832. [Google Scholar] [CrossRef]
  38. Rodríguez-Carvajal, J. Recent advances in magnetic structure determination by neutron powder diffraction. Phys. B Condens. Matter 1993, 192, 55–69. [Google Scholar] [CrossRef]
  39. Errandonea, D.; Meng, Y.; Somayazulu, M.; Häusermann, D. Pressure-induced α→ω transition in titanium metal: A systematic study of the effects of uniaxial stress. Phys. B Condens. Matter 2005, 355, 116–125. [Google Scholar] [CrossRef] [Green Version]
  40. Errandonea, D.; Muñoz, A.; Gonzalez-Platas, J. Comment on “High-pressure x-ray diffraction study of YBO3/Eu3+, GdBO3, and EuBO3: Pressure-induced amorphization in GdBO3”. J. Appl. Phys. 2014, 115, 216101. [Google Scholar] [CrossRef]
  41. Wang, X.B.; Shen, Z.X.; Tang, S.H.; Kuok, M.H. Near infrared excited micro-Raman spectra of 4:1 methanol–ethanol mixture and ruby fluorescence at high pressure. J. Appl. Phys. 1999, 85, 8011–8017. [Google Scholar] [CrossRef]
  42. Garg, N.; Pandey, K.K.; Shanavas, K.V.; Betty, C.A.; Sharma, S.M. Memory effect in low-density amorphous silicon under pressure. Phys. Rev. B 2011, 83, 115202. [Google Scholar] [CrossRef]
  43. Angel, R.J.; Zhao, J.; Ross, N.L. General Rules for Predicting Phase Transitions in Perovskites due to Octahedral Tilting. Phys. Rev. Lett. 2005, 95, 025503. [Google Scholar] [CrossRef] [Green Version]
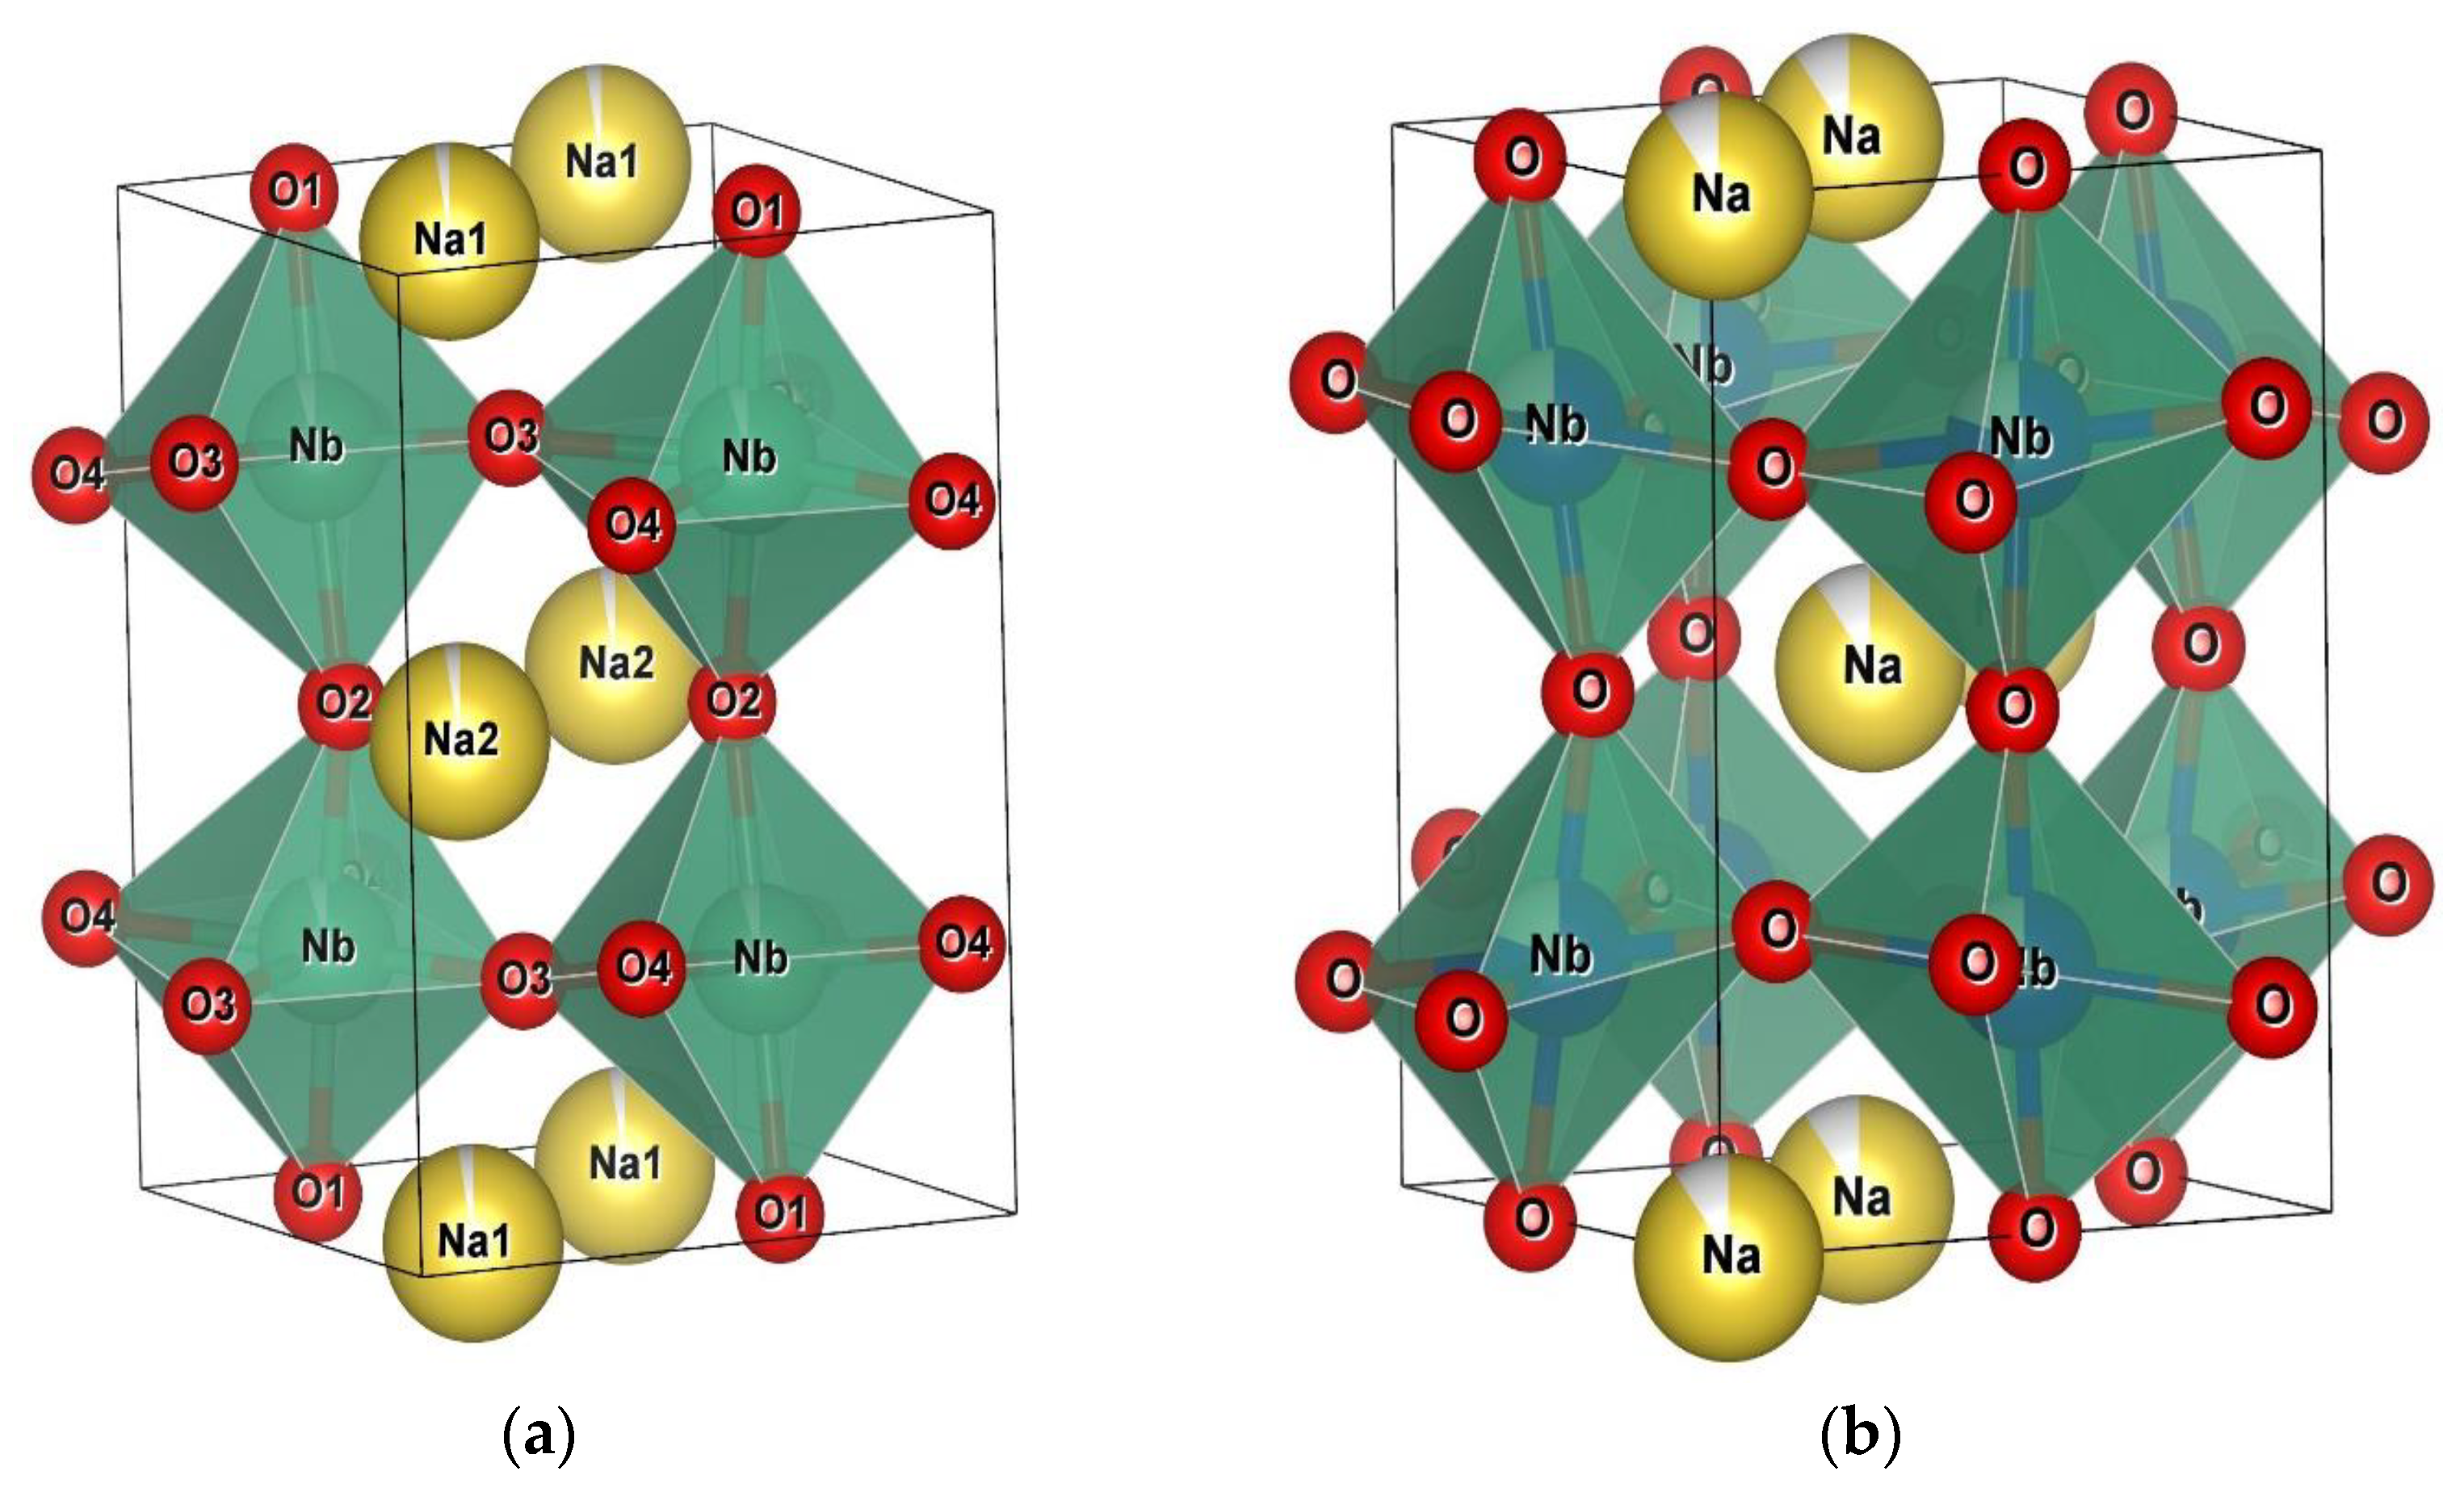
Figure 1. Crystal structure of (a) ferroelectric phase (space group: Pmc21) and (b) paraelectric phase (space group: Pbnm).
Crystals 13 01181 g001
Figure 2. (a) Evolution of the Raman spectra collected at selected pressures for NNBT05. The pressure dependencies of the vibration modes (Raman shift) are shown in (b). The error bar on the pressure is the size of symbol. The intensities of Raman spectra at higher pressure >5.4 GPa are expanded 10 times.
Crystals 13 01181 g002
Figure 3. (Colour online) (a) Evolution of the powder—X-ray diffraction patterns of NNBT05 at selected pressures. calculated (continuous red line) and difference (bottom blue line) profiles obtained from Rietveld refinement using an orthorhombic ferroelectric phase (space group: Pmc21) at 4.1 GPa (b), and paraelectric (space group: Pbnm) at 38.5 GPa (c).
Crystals 13 01181 g003
Figure 4. Evolution of lattice parameters and unit cell volume of NNBT05 as functions of pressure. For comparison, the pressure dependence of the volume of pure sodium niobate is also plotted. The solid lines are fitted to the experimental data using the Birch–Murnaghan equation of state. The error bar on the pressure is the size of the symbol.
Crystals 13 01181 g004
Figure 5. Schematic representation of A-containing cuboctahedra (left side) and BO6 octahedra (right side).
Crystals 13 01181 g005
Table 1. Structural parameters obtained through Rietveld refinement of high-pressure X-ray diffraction of NNBT05 using orthorhombic ferroelectric (space group: Pmc21) and paraelectric (space group: Pbnm).
AtomPressure = 4.1 GPa Space Group Pmc21Pressure = 38.48 GPa Space Group Pbnm
Positional CoordinatesPositional Coordinates
xyzB (Å2)xyzB (Å2)
Na1/Ba10.00000.2525(4)0.7637(7)1.98(5)−0.059(5)0.505 (5)0.25002.81(5)
Na2/Ba20.50000.2514(9)0.7691(5)0.35(7)
Nb/Ti0.7507(9)0.7480(8)0.7925(3)0.72(2)0.00000.00000.00001.30 (2)
O10.00000.2185(7)0.3217(8)1.48(1)0.010 (3)0.019 (6)0.25001.23 (5)
O20.50000.3109(9)0.2986(9)1.08(8)0.281(7)0.307 (4)0.039 (3)1.557(2)
O30.2265(8)0.4482(6)0.2140(6)2.18(8)
O40.2667(6)−0.086(5)0.6128(2)1.55(3)
Ao = 7.7425(4) Å; Bo = 5.4571(5) Å; Co = 5.5018(5) Å,
Unit cell volume (V) = 232.46(9) Å3
Rp = 3.68 Rwp = 6.61; Rexp = 5.45; χ2 = 1.22
Ao = 5.2147(7) Å; Bo = 5.3295(6) Å; Co = 7.3933(5) Å,
Unit cell volume (V) = 205.41(9) Å3
Rp = 5.68 Rwp = 8.03; Rexp = 7.65; χ2 = 1.10
Disclaimer/Publisher’s Note: The statements, opinions and data contained in all publications are solely those of the individual author(s) and contributor(s) and not of MDPI and/or the editor(s). MDPI and/or the editor(s) disclaim responsibility for any injury to people or property resulting from any ideas, methods, instructions or products referred to in the content.

