Thermal Properties and Non-Isothermal Crystallization Kinetics of Poly (δ-Valerolactone) and Poly (δ-Valerolactone)/Titanium Dioxide Nanocomposites

 ,
,  ,
,  , and
, and
Abstract
:
1. Introduction
2. Experimental
2.1. Chemicals
2.2. Synthesis of Poly (δ-Valerolactone)
2.3. Preparation of PDVL/TiO2 Nanocomposite
2.4. Characterization
3. Results and Discussion
3.1. XRD Analysis
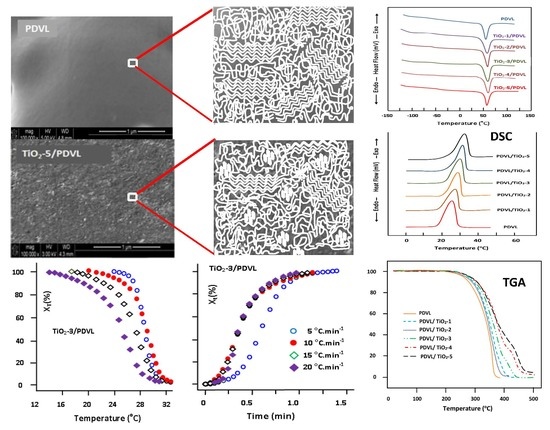
3.2. SEM Analysis
3.3. FTIR Analysis
3.4. Thermal Behavior of the PDVL/TiO2 Nanocomposite
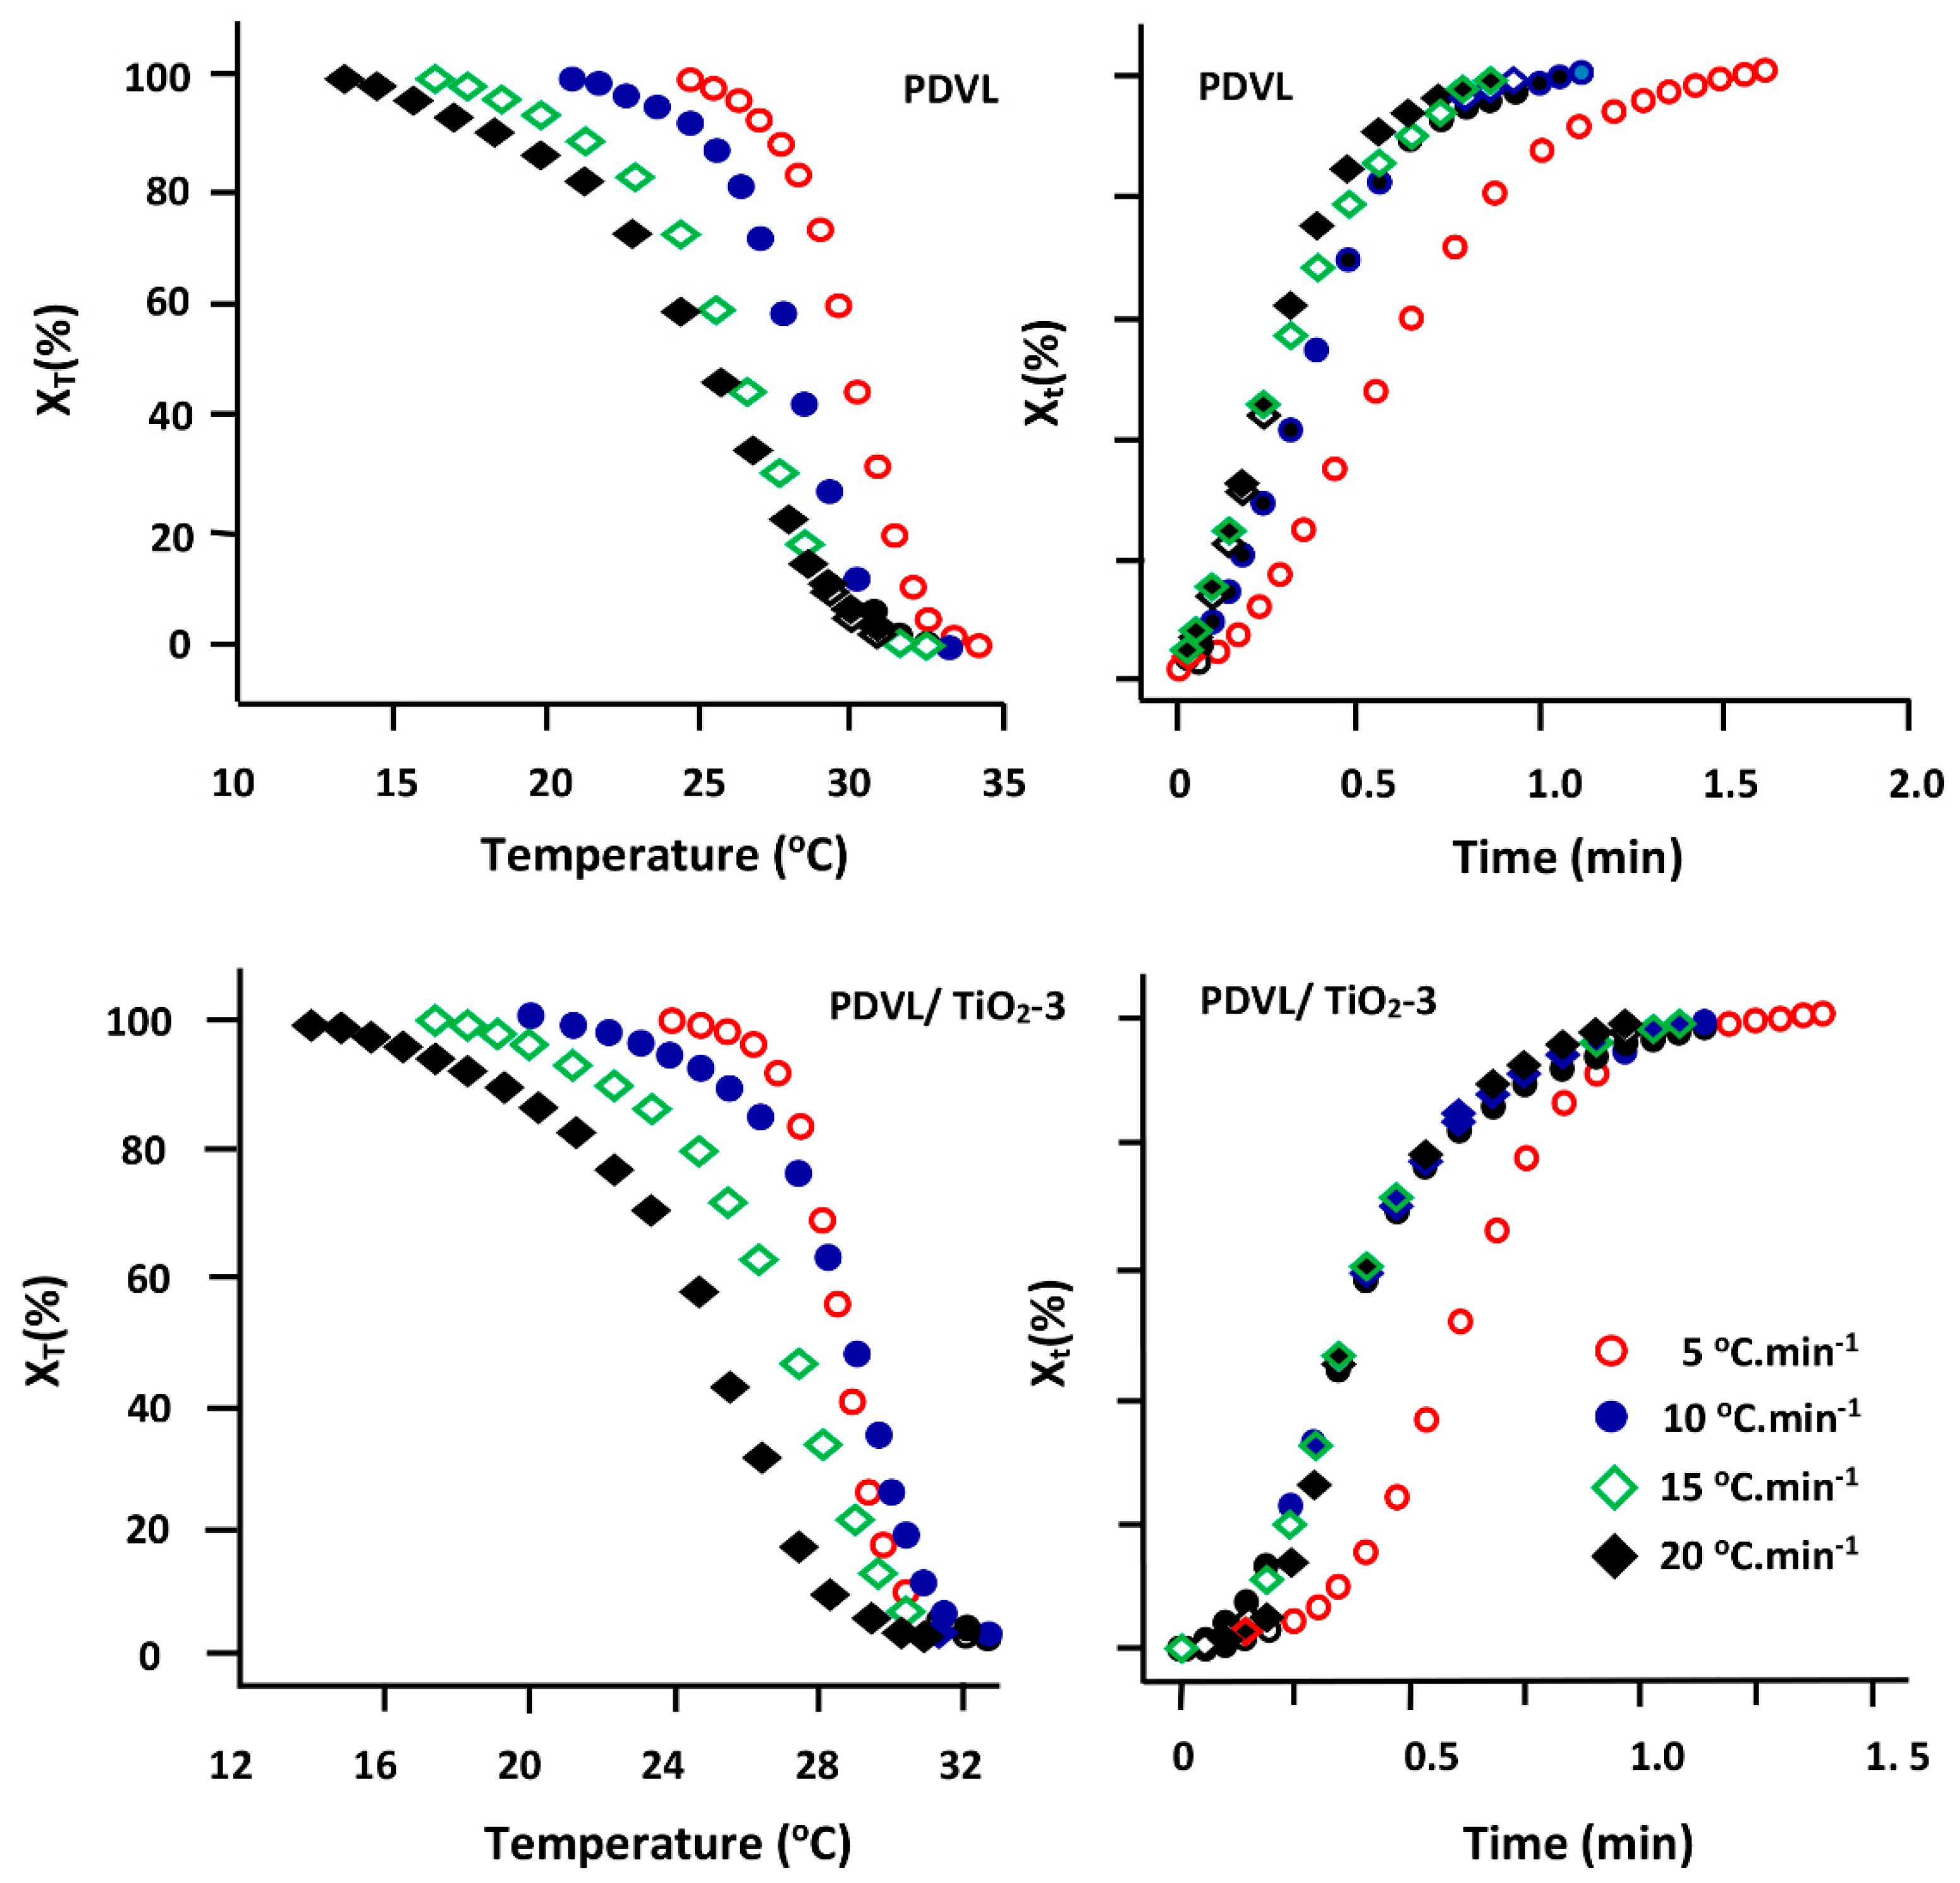
3.5. Non-Isothermal Crystallization Kinetics of PDVL and PDVL/TiO2 Nanocomposites
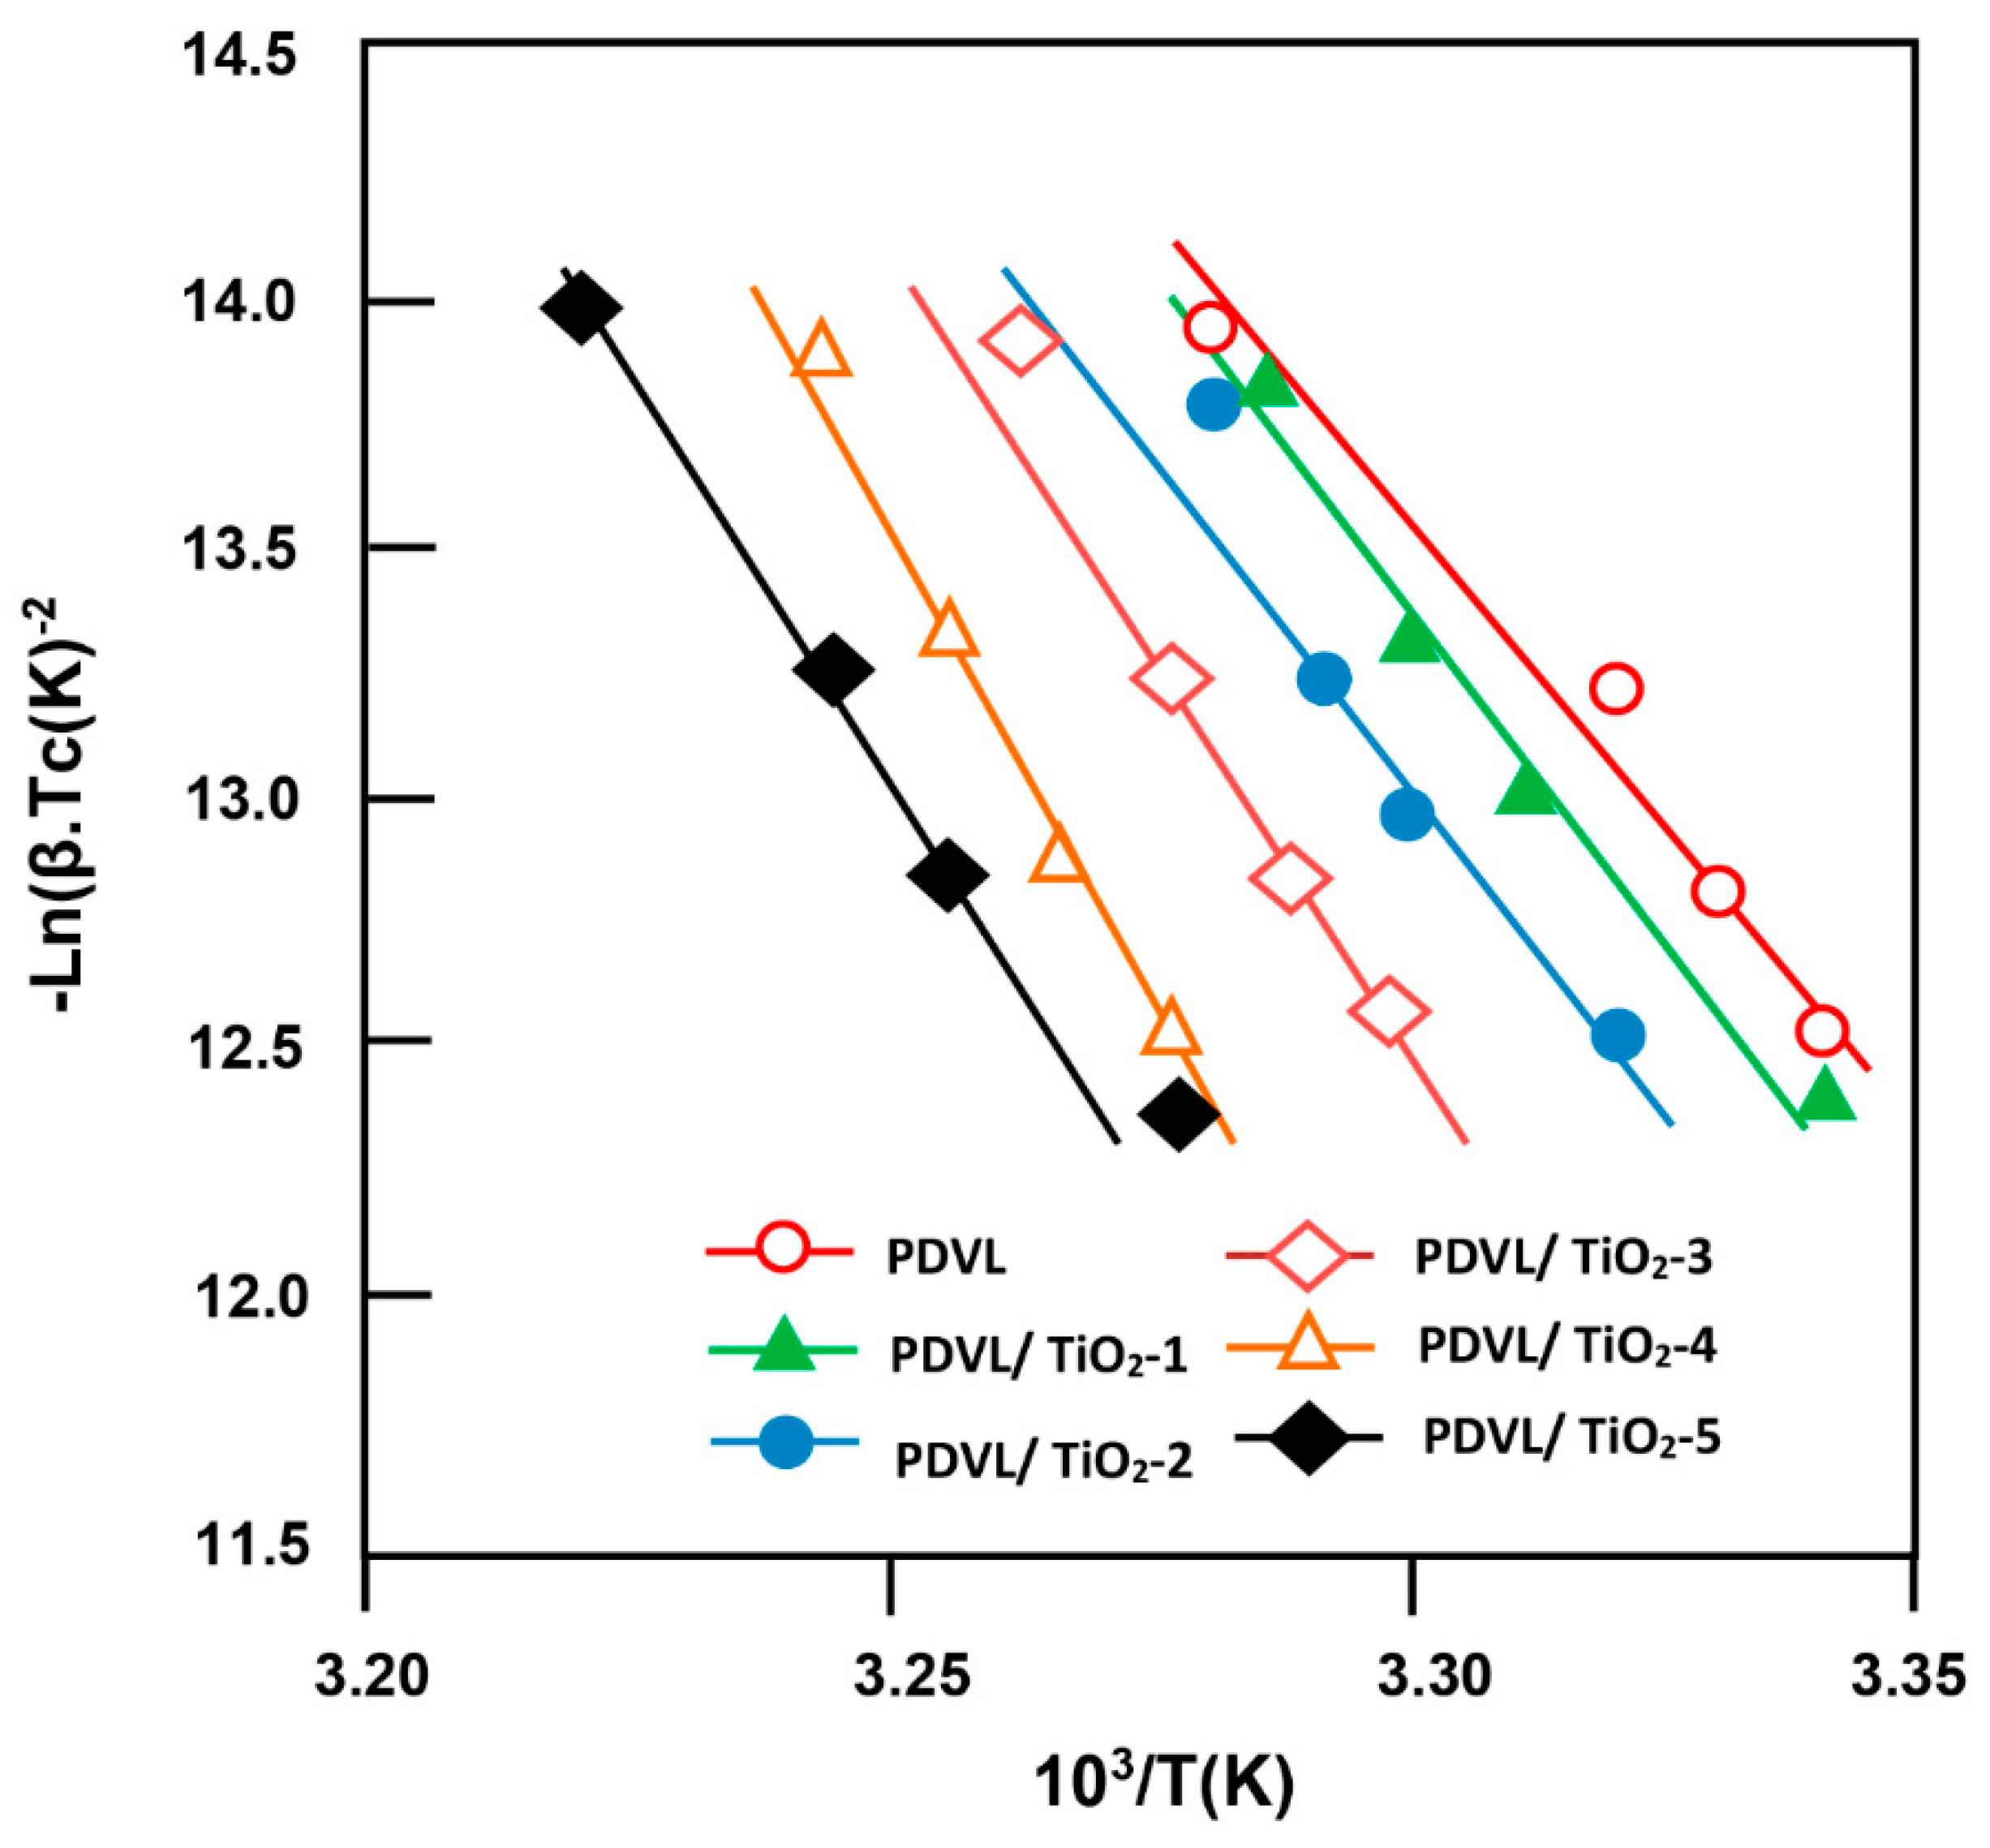
3.6. Activation Energy
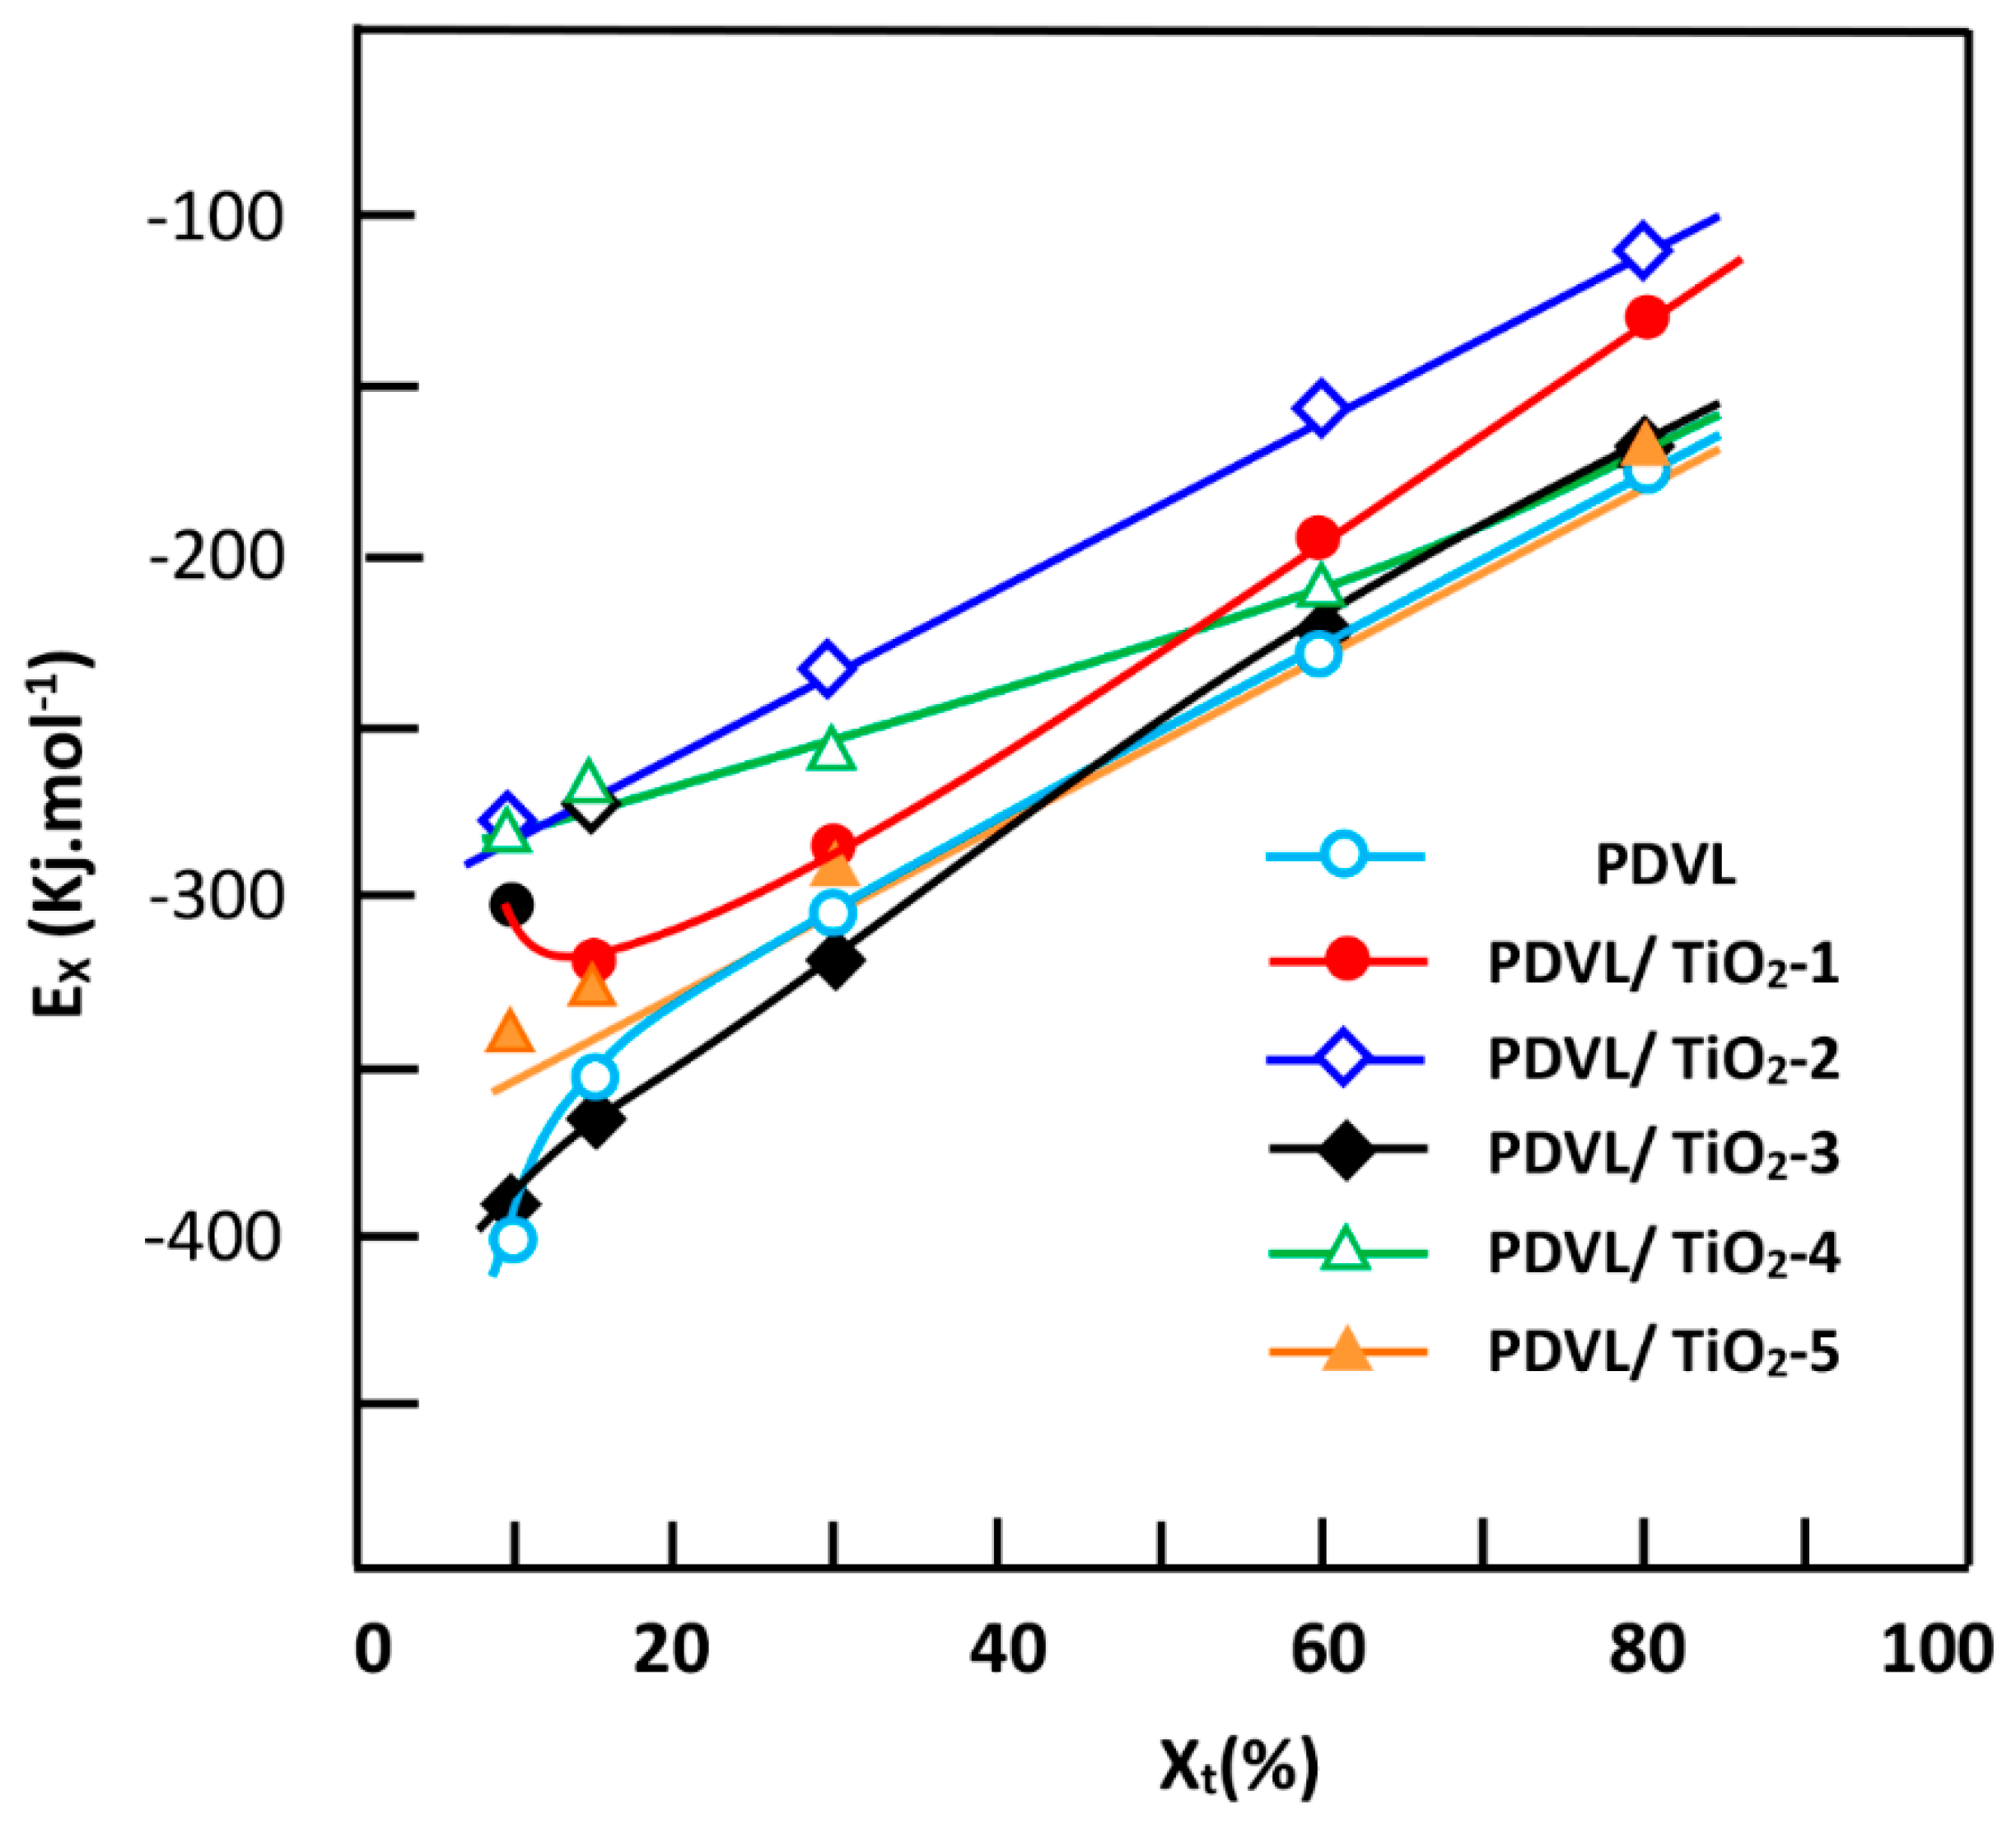
3.7. Effective Energy Barrier
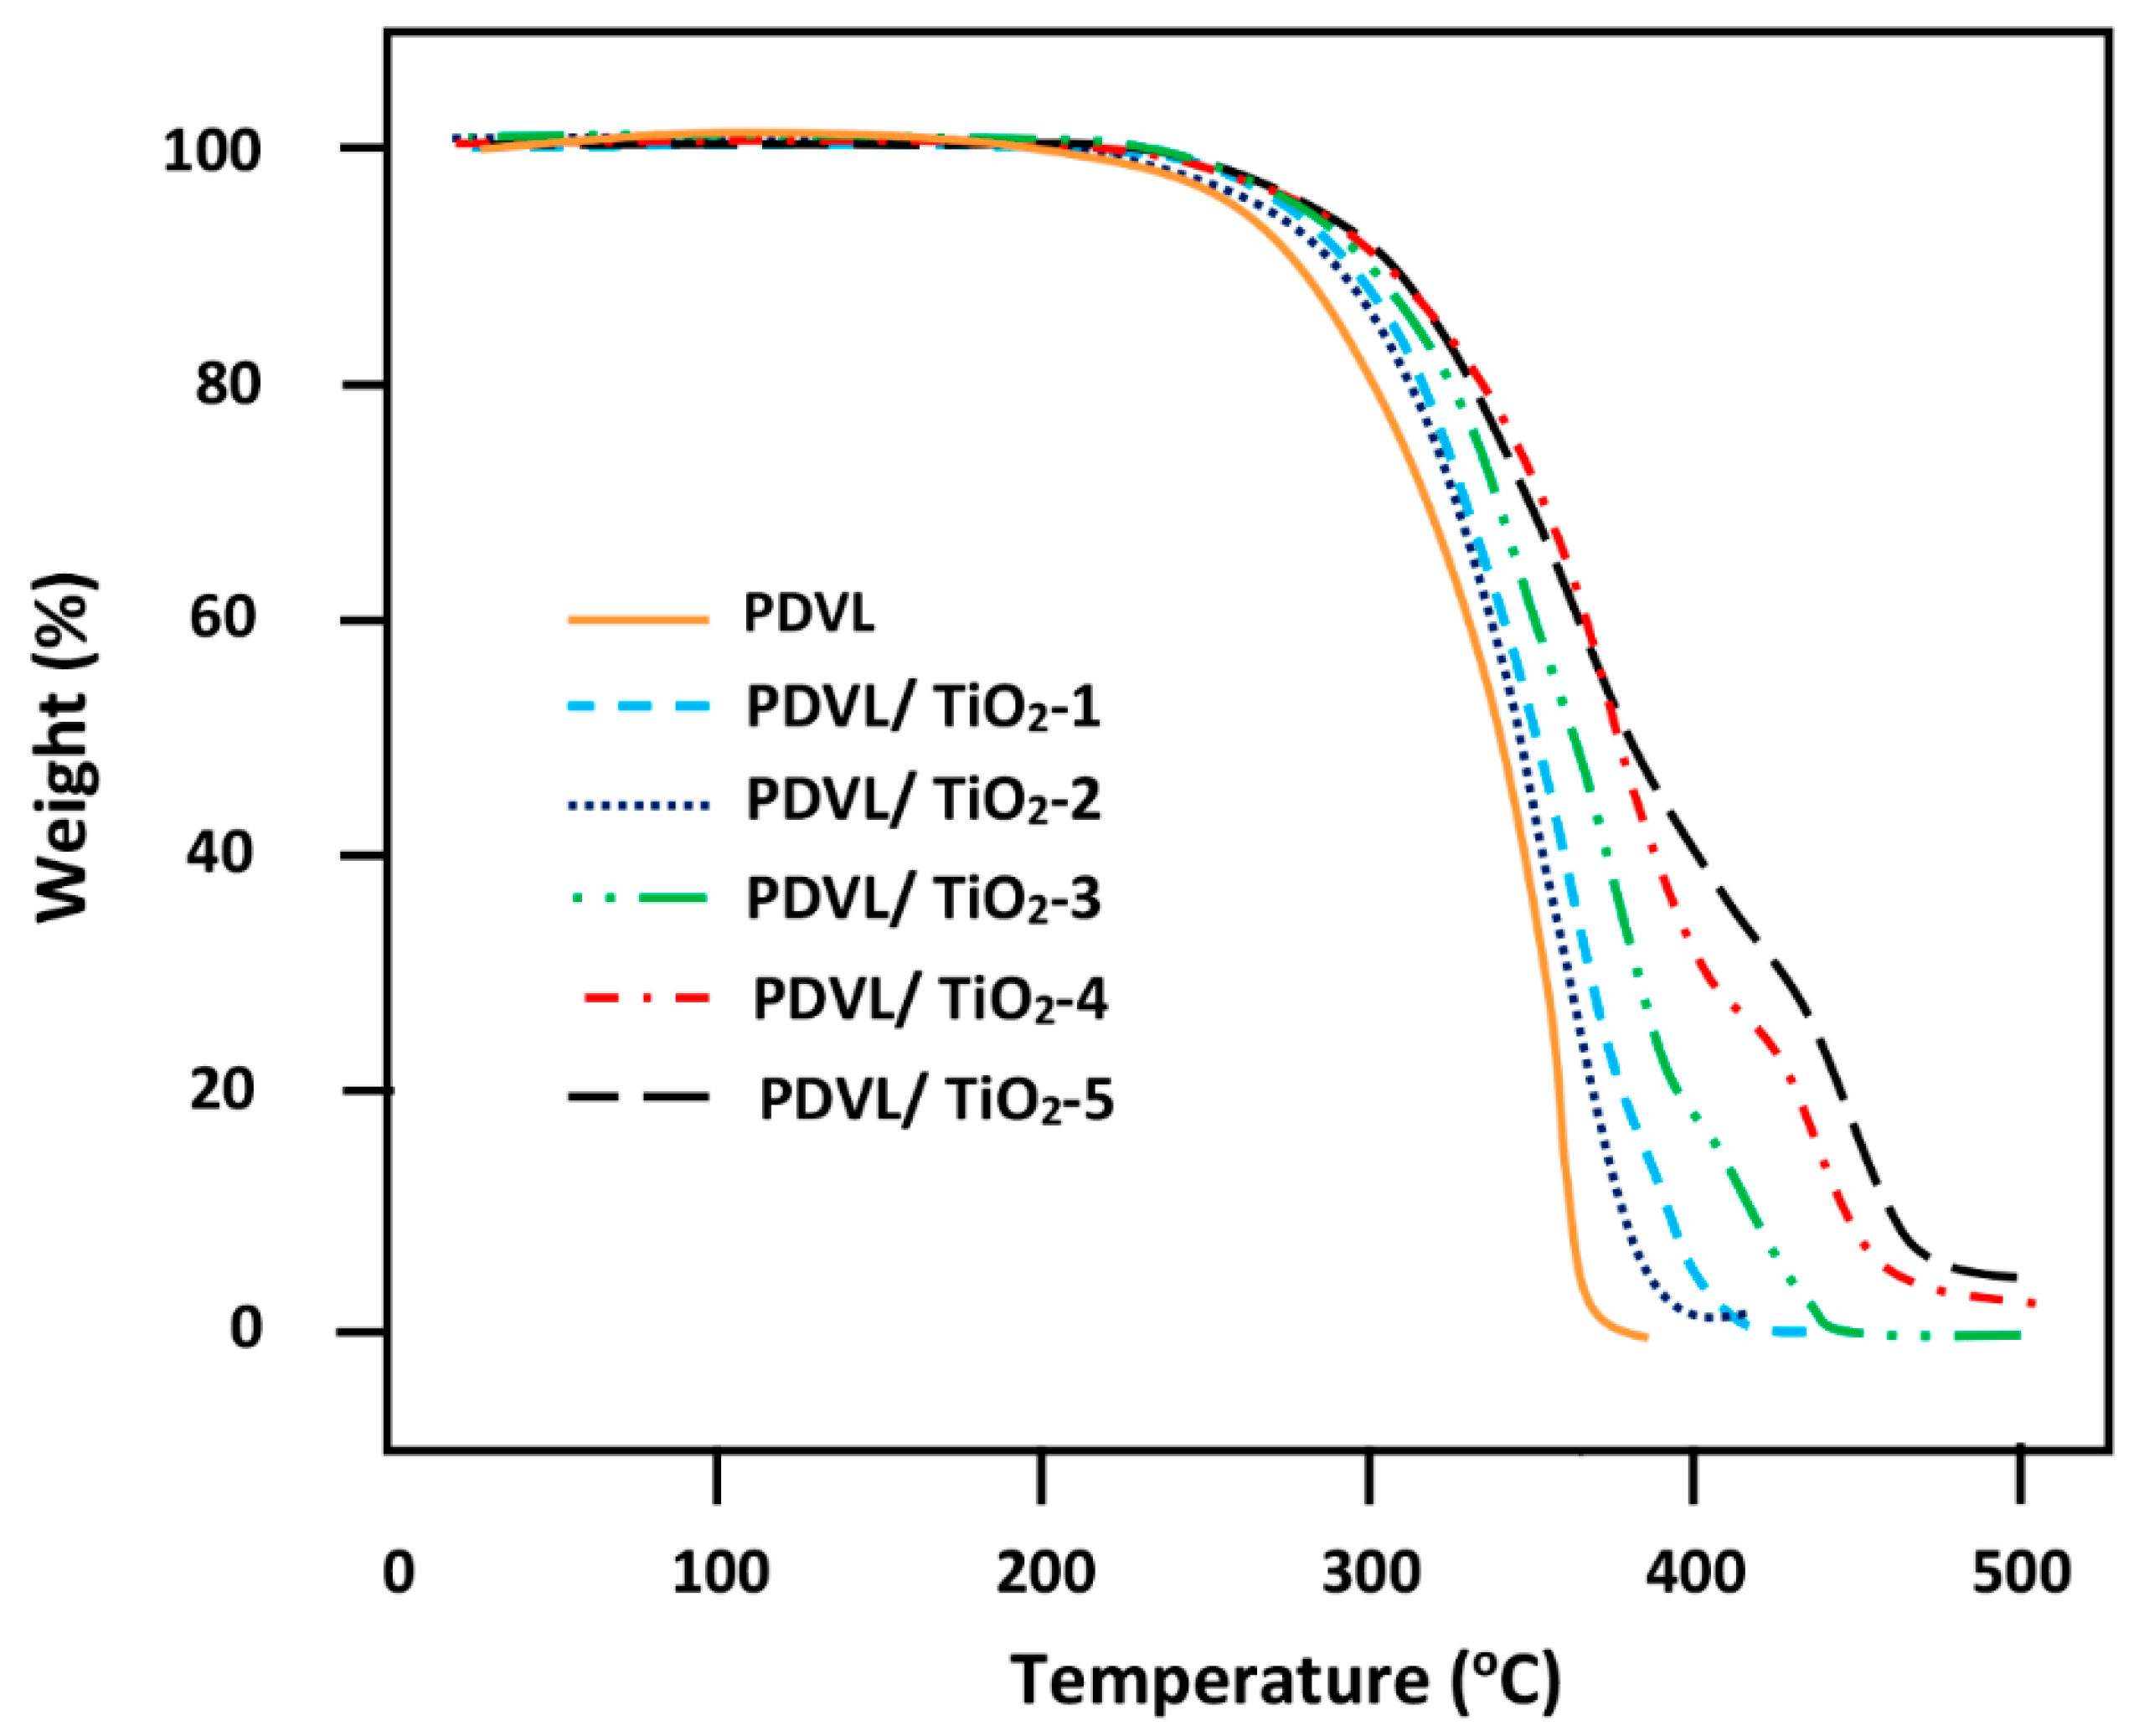
3.8. TGA Analysis
4. Conclusions
Author Contributions
Funding
Conflicts of Interest
References
- Coombes, A.; Rizzi, S.; Williamson, M.; Barralet, J.; Downes, S.; Wallace, W. Precipitation casting of polycaprolactone for applications in tissue engineering and drug delivery. Biomaterials 2004, 25, 315–325. [Google Scholar] [CrossRef]
- Woodruff, M.A.; Hutmacher, D.W. The return of a forgotten polymer—Polycaprolactone in the 21st century. Prog. Polym. Sci. 2010, 35, 1217–1256. [Google Scholar] [CrossRef] [Green Version]
- Khalil, M.I.A.-S.; Al-Deyab, S.S. Synthesis of poly (δ -valerolactone) by activated monomer polymerization, its characterization and potential medical application. Asian J. Biochem. Pharm. Res. 2015, 5, 137–147. [Google Scholar]
- Vaida, C.; Takwa, M.; Martinelle, M.; Hult, K.; Keul, H.; Möller, M. Γ-Acyloxy-ε-Caprolactones: Synthesis, Ring-Opening Polymerization vs. Rearrangement by Means of Chemical and Enzymatic Catalysis; Wiley Online Library: Hoboken, NJ, USA, 2008; pp. 28–38. [Google Scholar]
- D’auria, I.; Mazzeo, M.; Pappalardo, D.; Lamberti, M.; Pellecchia, C. Ring-opening polymerization of cyclic esters promoted by phosphido-diphosphine pincer group 3 complexes. J. Polym. Sci. Part A Polym. Chem. 2011, 49, 403–413. [Google Scholar] [CrossRef]
- Albertsson, A.-C.; Varma, I.K. Recent developments in ring opening polymerization of lactones for biomedical applications. Biomacromolecules 2003, 4, 1466–1486. [Google Scholar] [CrossRef] [PubMed]
- Grobelny, Z.; Matlengiewicz, M.; Skrzeczyna, K.; Swinarew, A.; Golba, S.; Jurek-Suliga, J.; Michalak, M.; Swinarew, B. Ring-opening polymerization of lactones initiated with metal hydroxide-activated macrocyclic ligands: Determination of mechanism and structure of polymers. Int. J. Polym. Anal. Charact. 2015, 20, 457–468. [Google Scholar] [CrossRef]
- Nair, L.; Jagadeeshan, S.; Nair, S.A.; Kumar, G.V. Evaluation of triblock copolymeric micelles of δ-valerolactone and poly (ethylene glycol) as a competent vector for doxorubicin delivery against cancer. J. Nanobiotechnol. 2011, 9, 42. [Google Scholar] [CrossRef] [PubMed]
- Kim, T.; Lee, M.; Lee, S.; Park, Y.; Jung, C.; Boo, J.-H. Development of surface coating technology of tio2 powder and improvement of photocatalytic activity by surface modification. Thin Solid Films 2005, 475, 171–177. [Google Scholar] [CrossRef]
- Brady, G.S.; Clauser, H.R.; Vaccari, J.A. Materials Handbook; McGraw-Hill: New York, NY, USA, 1956. [Google Scholar]
- Zhang, Q.; Gao, L.; Guo, J. Effect of hydrolysis conditions on morphology and crystallization of nanosized TiO2 powder. J. Eur. Ceram. Soc. 2000, 20, 2153–2158. [Google Scholar] [CrossRef]
- Sivakumar, S.; Pillai, P.K.; Mukundan, P.; Warrier, K.G.K. Sol–gel synthesis of nanosized anatase from titanyl sulfate. Mater. Lett. 2002, 57, 330–335. [Google Scholar] [CrossRef]
- Devi, M.; Panigrahiand, M.R.; Singh, U.P. Synthesis of TiO2 nanocrystalline powder prepared by sol-gel technique using TiO2 powder reagent. Adv. Appl. Sci. Res. 2014, 5, 140–145. [Google Scholar]
- Pusit, P.; Sukon, P. Titanium dioxide powder prepared by a sol-gel method. J. Ceram. Process. Res. 2009, 10, 167–170. [Google Scholar]
- Santana-Aranda, M.A.; Morán-Pineda, M.; Hernández, J.; Castillo, S. Physical properties of TiO2 prepared by sol-gel under different pH conditions for photocatalysis. Superficies y Vacío 2005, 18, 46–49. [Google Scholar]
- Mishra, A.; Kumar, S.B.; Roy, D. Development of Nano-TiO2 by Mechanical Milling. Int. J. Sci. Eng. Res. 2015, 4, 2347–3878. [Google Scholar]
- Park, S.D.; Cho, Y.H.; Kim, W.W.; Kim, S.J. Understanding of Homogeneous Spontaneous Precipitation for Monodispersed TiO2 Ultrafine Powders with Rutile Phase around Room Temperature. Solid State Chem. 1999, 146, 230–238. [Google Scholar] [CrossRef]
- Yin, H.; Wada, Y.; Kitamura, T.; Kambe, S.; Murasawa, S.; Mori, H.; Sakata, T.; Yanagida, S. Hydrothermal synthesis of nanosized anatase and rutile TiO2 using amorphous phase TiO2. J. Mater. Chem. 2001, 11, 1694–1703. [Google Scholar] [CrossRef]
- McCormick, J.R.; Zhao, B.; Rykov, A.; Wang, H.; Chen, J.G. Thermal Stability of Flame-Synthesized Anatase TiO2 Nanoparticles. J. Phys. Chem. B 2004, 108, 17398–17402. [Google Scholar] [CrossRef]
- Docters, T.; Chovelon, J.M.; Herrmann, J.M.; Deloume, J.P. Syntheses of TiO2 photocatalysts by the molten salts method: Application to the photocatalytic degradation of Prosulfuron ®. Appl. Catal. B Environ. 2004, 50, 219–226. [Google Scholar] [CrossRef]
- Avvakumov, E.; Senna, M.; Kosova, N. Soft Mechanochemical Synthesis: A Basis for New Chemical Technologies; Kluwer Academic Publishers: Dordrecht, The Netherlands, 2001; p. 2. [Google Scholar]
- Billik, P.; Plesch, G. Mechanochemical synthesis of anatase and rutile nanopowders from TiOSO4. Mater. Lett. 2007, 61, 1183–1186. [Google Scholar] [CrossRef]
- Li, B.; Wang, X.; Yan, M.; Li, L. Preparation and characterization of nano-TiO2 powder. Mater. Chem. Phys. 2003, 78, 184–188. [Google Scholar] [CrossRef]
- Cornelius, C.J.; Marand, E. Hybrid inorganic–organic materials based on a 6FDA–6FpDA–DABA polyimide and silica: Physical characterization studies. Polymer 2002, 43, 2385–2400. [Google Scholar] [CrossRef]
- Kasseh, A.; Ait-Kadi, A.; Riedl, B.; Pierson, J. Organic/inorganic hybrid composites prepared by polymerization compounding and controlled free radical polymerization. Polymer 2003, 44, 1367–1375. [Google Scholar] [CrossRef]
- West, J.; Hench, L. The sol-gel process. Chem. Rev. 1990, 90, 33–72. [Google Scholar]
- Tien, Y.; Wei, K. High-tensile-property layered silicates/polyurethane nanocomposites by using reactive silicates as pseudo chain extenders. Macromolecules 2001, 34, 9045–9052. [Google Scholar] [CrossRef]
- Gonzalez-Oliver, C.; James, P.F.; Rawson, H. Silica and silica-titania glasses prepared by the sol-gel process. J. Non-Cryst. Solids 1982, 48, 129–152. [Google Scholar] [CrossRef]
- Wang, K.H.; Chung, I.J.; Jang, M.C.; Keum, J.K.; Song, H.H. Deformation behavior of polyethylene/silicate nanocomposites as studied by real-time wide-angle x-ray scattering. Macromolecules 2002, 35, 5529–5535. [Google Scholar] [CrossRef]
- Mendoza-Serna, R.; Bosch, P.; Padilla, J.; Lara, V.; Méndez-Vivar, J. Homogeneous Si-Ti and Si-Ti-Zr polymeric systems obtained from monomeric precursors. Non-Cryst. Solids 1997, 217, 30–40. [Google Scholar] [CrossRef]
- Ganguli, S.; Dean, D.; Jordan, K.; Price, G.; Vaia, R. Mechanical properties of intercalated cyanate ester–layered silicate nanocomposites. Polymer 2003, 44, 1315–1319. [Google Scholar] [CrossRef]
- Que, W.; Sun, Z.; Zhou, Y.; Lam, Y.; Chan, Y.; Kam, C. Optical and mechanical properties of tio2/sio2/organically modified silane composite films prepared by sol–gel processing. Thin Solid Films 2000, 359, 177–183. [Google Scholar] [CrossRef]
- Chiang, C.L.; Ma, C.C.M.; Wu, D.L.; Kuan, H.C. Preparation, characterization, and properties of novolac-type phenolic/sio2 hybrid organic–inorganic nanocomposite materials by sol–gel method. J. Polym. Sci. Part A Polym. Chem. 2003, 41, 905–913. [Google Scholar] [CrossRef]
- Méndez-Vivar, J.; Mendoza-Serna, R.; Bosch, P.; Lara, V. Influence of isoeugenol as a chelating agent on the structure of Si–Ti polymeric systems obtained from alkoxides. J. Non-Cryst. Solids 1999, 248, 147–158. [Google Scholar] [CrossRef]
- Lu, S.; Melo, M.M.; Zhao, J.; Pearce, E.M.; Kwei, T. Organic-inorganic polymeric hybrids involving novel poly (hydroxymethylsiloxane). Macromolecules 1995, 28, 4908–4913. [Google Scholar] [CrossRef]
- Yu, Y.-Y.; Chen, C.-Y.; Chen, W.-C. Synthesis and characterization of organic–inorganic hybrid thin films from poly (acrylic) and monodispersed colloidal silica. Polymer 2003, 44, 593–601. [Google Scholar] [CrossRef]
- Oh, W.; Hwang, Y.; Park, Y.; Ree, M.; Chu, S.-H.; Char, K.; Lee, J.; Kim, S.Y. Optical, dielectric and thermal properties of nanoscaled films of polyalkylsilsesquioxane composites with star-shaped poly (ε-caprolactone) and their derived nanoporous analogues. Polymer 2003, 44, 2519–2527. [Google Scholar] [CrossRef]
- Hu, Q.; Marand, E. In situ formation of nanosized TiO2 domains within poly (amide–imide) by a sol–gel process. Polymer 1999, 40, 4833–4843. [Google Scholar] [CrossRef]
- Zhang, J.; Wang, B.-J.; Ju, X.; Liu, T.; Hu, T.-D. New observations on the optical properties of PPV/TiO2 nanocomposites. Polymer 2001, 42, 3697–3702. [Google Scholar] [CrossRef]
- Gupta, K.K.; Kundan, A.; Mishra, P.K.; Srivastava, P.; Mohanty, S.; Singh, N.K.; Mishrad, A.P.; Maiti, P. Polycaprolactone composites with TiO2 for potential nanobiomaterials: tunable properties using different phases. Phys. Chem. Chem. Phys. 2012, 14, 12844–12853. [Google Scholar] [CrossRef] [PubMed]
- Thamaphat, K.; Limsuwan, P.; Ngotawornchai, B. Phase characterization of TiO2 powder XRD and TEM. Nat. Sci. 2008, 42, 357–361. [Google Scholar]
- Scherrer, P. Bestimmung der inneren struktur und der größe von kolloidteilchen mittels röntgenstrahlen. In Kolloidchemie ein lehrbuch; Springer: Berlin/Heidelberg, Germany, 1912; pp. 387–409. [Google Scholar]
- Patterson, A. The scherrer formula for x-ray particle size determination. Phys. Rev. 1939, 56, 978–982. [Google Scholar] [CrossRef]
- Ren, Y.; Wei, Z.; Wu, T.; Bian, Y.; Leng, X.; Zhou, C.; Li, Y. Synthesis of highly branched poly (δ-valerolactone) s: A comparative study between comb and linear analogues. RSC Adv. 2016, 6, 45791–45801. [Google Scholar] [CrossRef]
- Furuhashi, Y.; Sikorski, P.; Atkins, E.; Iwata, T.; Doi, Y. Structure and morphology of the aliphatic polyester poly (δ-valerolactone) in solution-grown, chain-folded lamellar crystals. J. Polym. Sci. Part B Polym. Phys. 2001, 39, 2622–2634. [Google Scholar] [CrossRef]
- Kiran, A.; Kumar, T.; Sanghavi, R.; Doble, M.; Ramakrishna, S. Antibacterial and bioactive surface modifications of titanium implants by PCL/TiO2 nanocomposite coatings. Nanomaterials 2018, 8, 860. [Google Scholar] [CrossRef] [PubMed]
- Coates, J. Interpretation of infrared spectra, a practical approach. Encycl. Anal. Chem. 2000, 12, 10815–10837. [Google Scholar]
- Aubin, M.; Prud’homme, R.E. Preparation and properties of poly (valerolactone). Polymer 1981, 22, 1223–1226. [Google Scholar] [CrossRef]
- Kasyapi, N.; Bhowmick, A.K. Nanolamellar triblock of poly-d, l-lactide–δ-valerolactone–d, l-lactide with tuneable glass transition temperature and crystallinity for use as a drug-delivery vesicle. RSC Adv. 2014, 4, 27439–27451. [Google Scholar] [CrossRef]
- He, D.; Hu, Y.; Tao, J.; Zheng, X.; Liu, H.; Jing, G.; Lu, H.; Guan, H.; Yu, J.; Zhang, J. Micro fiber with cladding of titanium dioxide (TiO2) nanoparticles and its violet light sensing. Opt. Mater. Express 2017, 7, 264–272. [Google Scholar] [CrossRef]
- Oyama, H.T. Super-tough poly (lactic acid) materials: Reactive blending with ethylene copolymer. Polymer 2009, 50, 747–751. [Google Scholar] [CrossRef]
- Liu, H.; Chen, F.; Liu, B.; Estep, G.; Zhang, J. Super toughened poly (lactic acid) ternary blends by simultaneous dynamic vulcanization and interfacial compatibilization. Macromolecules 2010, 43, 6058–6066. [Google Scholar] [CrossRef]
- Liu, H.; Song, W.; Chen, F.; Guo, L.; Zhang, J. Interaction of microstructure and interfacial adhesion on impact performance of polylactide (pla) ternary blends. Macromolecules 2011, 44, 1513–1522. [Google Scholar] [CrossRef]
- Wunderlich, B. Thermal Analysis of Polymeric Materials; Springer: Berlin/Heidelberg, Germany, 2005. [Google Scholar]
- Jiang, S.; Ji, X.; An, L.; Jiang, B. Crystallization behavior of PCL in hybrid confined environment. Polymer 2001, 42, 3901–3907. [Google Scholar] [CrossRef]
- Wang, G.; Chen, G.; Wei, Z.; Yu, T.; Liu, L.; Wang, P.; Chang, Y.; Qi, M. A Comparative Study of TiO2 and Surface-Treated TiO2 Nanoparticles on Thermal and Mechanical Properties of Poly(e-caprolactone) Nanocomposites. J. Appl. Polym. Sci. 2012. [Google Scholar] [CrossRef]
- Jeziorny, A. Parameters characterizing the kinetics of the non-isothermal crystallization of poly (ethylene terephthalate) determined by DSC. Polymer 1978, 19, 1142–1144. [Google Scholar] [CrossRef]
- Ziabicki, A. Crystallization of polymers in variable external conditions. Colloid Polym. Sci. 1996, 274, 705–716. [Google Scholar] [CrossRef]
- Ozawa, T. Kinetics of non-isothermal crystallization. Polymer 1971, 12, 150–158. [Google Scholar] [CrossRef]
- Avrami, M. Kinetics of phase change. I general theory. J. Chem. Phys. 1939, 7, 1103–1112. [Google Scholar] [CrossRef]
- Francis, A. Non-isothermal crystallization kinetics of a blast furnace slag glass. J. Am. Ceram. Soc. 2005, 88, 1859–1863. [Google Scholar] [CrossRef]
- Reinsch, V.E.; Rebenfeld, L. Crystallization processes in poly (ethylene terephthalate) as modified by polymer additives and fiber reinforcement. J. Appl. Polym. Sci. 1994, 52, 649–662. [Google Scholar] [CrossRef]
- Di Lorenzo, M.; Silvestre, C. Non-isothermal crystallization of polymers. Prog. Polym. Sci. 1999, 24, 917–950. [Google Scholar] [CrossRef]
- Desio, G.P.; Rebenfeld, L. Crystallization of fiber-reinforced poly (phenylene sulfide) composites. II. Modeling the crystallization kinetics. J. Appl. Polym. Sci. 1992, 45, 2005–2020. [Google Scholar] [CrossRef]
- Wei, Z.; Wang, G.; Wang, P.; Liu, L.; Qi, M. Crystallization behavior of poly (ϵ-caprolactone)/TiO2 nanocomposites obtained by in situ polymerization. Polym. Eng. Sci. 2012, 52, 1047–1057. [Google Scholar] [CrossRef]
- Kissinger, H.E. Variation of peak temperature with heating rate in differential thermal analysis. J. Res. Natl. Bur. Stand. 1956, 57, 217–221. [Google Scholar] [CrossRef]
- Yang, Y.; Yu, Y.; Zhang, Y.; Liu, C.; Shi, W.; Li, Q. Lipase/esterase-catalyzed ring-opening polymerization: A green polyester synthesis technique. Process. Biochem. 2011, 46, 1900–1908. [Google Scholar] [CrossRef]
- Vyazovkin, S.; Sbirrazzuoli, N. Isoconversional analysis of the nonisothermal crystallization of a polymer melt. Macromol. Rapid Commun. 2002, 23, 766–770. [Google Scholar] [CrossRef]
- Friedman, H.L. Kinetics of thermal degradation of char-forming plastics from thermogravimetry. Application to a phenolic plastic. J. Polym. Sci. Part C 1964, 6, 183–195. [Google Scholar] [CrossRef]
- Papageorgiou, G.Z.; Achilias, D.S.; Bikiaris, D.N.; Karayannidis, G.P. Crystallization kinetics and nucleation activity of filler in polypropylene/surface-treated sio2 nanocomposites. Thermochim. Acta 2005, 427, 117–128. [Google Scholar] [CrossRef]
- Garozzo, D.; Giuffrida, M.; Montaudo, G. Primary thermal decomposition processes in aliphatic polyesters investigated by chemical ionization mass spectrometry. Macromolecules 1986, 19, 1643–1649. [Google Scholar] [CrossRef]
- Kricheldorf, H.R.; Lüderwald, I. Strukturuntersuchung von polyestern durch direkten abbau im massenspektrometer, 3. Poly-β-propiolacton, poly-β-pivalolacton und poly-δ-valerolacton. Die Makromol. Chemie Macromol. Chem. Phys. 1978, 179, 421–427. [Google Scholar] [CrossRef]
- Abe, H. Thermal degradation of environmentally degradable poly (hydroxyalkanoic acid) s. Macromol. Biosci. 2006, 6, 469–486. [Google Scholar] [CrossRef]
- Broido, A. A simple, sensitive graphical method of treating thermogravimetric analysis data. J. Polym. Sci. Part B Polym. Phys. 1969, 7, 1761–1773. [Google Scholar] [CrossRef]


| System | TiO2 (g) | PDVL (g) | TiO2 (wt %) |
|---|---|---|---|
| PDVL/TiO2-1 | 0.005 | 0.495 | 1.0 |
| PDVL/TiO2-2 | 0.010 | 0.490 | 2.0 |
| PDVL/TiO2-3 | 0.015 | 0.485 | 3.0 |
| PDVL/TiO2-4 | 0.020 | 0.480 | 4.0 |
| PDVL/TiO2-5 | 0.025 | 0.475 | 5.0 |
| System | Tg (°C) | Tm (°C) | ∆Hm (J·g−1) | Tc (°C) | ∆Hc (J·g−1) | Xc (%) |
|---|---|---|---|---|---|---|
| PDVL | −63 | 58 | 63.0 | 26 | 54.3 | 46.3 |
| PDVL/TiO2-1 | −60 | 58 | 59.7 | 28 | 52.2 | 40.0 |
| PDVL/TiO2-2 | −57 | 58 | 57.4 | 29 | 51.0 | 34.7 |
| PDVL/TiO2-3 | −54 | 59 | 56.0 | 30 | 50.0 | 33.0 |
| PDVL/TiO2-4 | −49 | 60 | 53.8 | 31 | 48.2 | 30.0 |
| PDVL/TiO2-5 | −47 | 56 | 52.5 | 32 | 47.3 | 29.0 |
| Sample | Tc (°C) | n | −ln kT | Eac (kJ·mol−1) |
|---|---|---|---|---|
| PDVL | 26 27 28 29 | 1.93 2.00 2.16 2.00 | 5.03 4.93 4.80 3.70 | −214.10 |
| PDVL/TiO2-1 | 26 27 28 29 | 1.60 2.00 2.12 2.20 | 3.48 4.15 3.67 3.56 | −228.40 |
| PDVL/TiO2-2 | 26 27 28 29 | 2.20 2.20 2.44 2.80 | 7.32 3.91 6.60 5.42 | −266.05 |
| PDVL/TiO2-3 | 26 27 28 29 | 2.14 2.36 2.76 3.10 | 5.73 5.87 6.35 6.50 | −377.13 |
| PDVL/TiO2-4 | 26 27 28 29 | 1.70 1.94 1.96 2.02 | 4.37 4.56 4.18 4.08 | −324.13 |
| PDVL/TiO2-5 | 26 27 28 29 | 1.66 2.04 2.20 2.30 | 3.32 4.76 4.73 4.60 | −277.13 |
© 2018 by the authors. Licensee MDPI, Basel, Switzerland. This article is an open access article distributed under the terms and conditions of the Creative Commons Attribution (CC BY) license (http://creativecommons.org/licenses/by/4.0/).
Share and Cite
Saeed, W.S.; Al-Odayni, A.-B.; Alghamdi, A.A.; Alrahlah, A.; Aouak, T. Thermal Properties and Non-Isothermal Crystallization Kinetics of Poly (δ-Valerolactone) and Poly (δ-Valerolactone)/Titanium Dioxide Nanocomposites. Crystals 2018, 8, 452. https://0-doi-org.brum.beds.ac.uk/10.3390/cryst8120452
Saeed WS, Al-Odayni A-B, Alghamdi AA, Alrahlah A, Aouak T. Thermal Properties and Non-Isothermal Crystallization Kinetics of Poly (δ-Valerolactone) and Poly (δ-Valerolactone)/Titanium Dioxide Nanocomposites. Crystals. 2018; 8(12):452. https://0-doi-org.brum.beds.ac.uk/10.3390/cryst8120452
Chicago/Turabian StyleSaeed, Waseem Sharaf, Abdel-Basit Al-Odayni, Abdulaziz Ali Alghamdi, Ali Alrahlah, and Taieb Aouak. 2018. "Thermal Properties and Non-Isothermal Crystallization Kinetics of Poly (δ-Valerolactone) and Poly (δ-Valerolactone)/Titanium Dioxide Nanocomposites" Crystals 8, no. 12: 452. https://0-doi-org.brum.beds.ac.uk/10.3390/cryst8120452