Copper(II) Complexes Based on Aminohydroxamic Acids: Synthesis, Structures, In Vitro Cytotoxicities and DNA/BSA Interactions

Shandong Provincial Key Laboratory of Chemical Energy Storage and Novel Cell Technology, School of Chemistry and Chemical Engineering, Liaocheng University, Liaocheng 252059, China
*
Authors to whom correspondence should be addressed.
Crystals 2018, 8(5), 201; https://0-doi-org.brum.beds.ac.uk/10.3390/cryst8050201
Submission received: 29 March 2018
/
Revised: 26 April 2018
/
Accepted: 27 April 2018
/
Published: 3 May 2018
(This article belongs to the Section Biomolecular Crystals)
Abstract
:Four complexes, [Cu2(glyha)(bpy)2(H2O)]·2ClO4·H2O (1), [Cu2(glyha)(phen)2]·2ClO4 (2), [Cu2(alaha)(bpy)2Cl]·Cl·4H2O (3), and [{Cu2(alaha)(phen)2}{Cu2(alaha)(phen)2(NO3)}]·3NO3 (4) (glyha2− = dianion glycinehydroxamic acid, alaha2− = dianion alaninehydroxamic acid, bpy = 2,2′-bipyridine, phen = 1,10-phenanthroline) have been successfully synthesized and characterized by X-ray single crystal diffraction. The interactions of these complexes with calf thymus DNA (CT-DNA) were studied through UV spectroscopy, fluorescence spectroscopy, and circular dichroism. The results revealed that complexes 1–4 could interact with CT-DNA through intercalation. Interactions of all complexes with bovine serum albumin (BSA) were confirmed by the docking study to quench the intrinsic fluorescence of BSA in a static quenching process. Furthermore, the in vitro cytotoxic effect of the complexes was also examined on four tumor cell lines, including human lung carcinoma cell line (A549), human colon carcinoma cell line (HCT-116), human promyelocytic leukemia cell (HL-60) and cervical cancer cell line (HeLa). All complexes exhibited different antitumor activities.
1. Introduction
Cancer, a bad disease, affects modern life and has a high mortality rate. Many of complexes have been found to be active in the restrained reproduction of cancer cells [1,2,3,4,5], and some of them have been used in clinical treatments. Metal complexes with high anticancer activity and non-covalent DNA or protein binding properties have played an important role in antitumor chemotherapy and developed an active research area in metal-based drugs [6]. DNA is the most important target for antitumorals because of its central role in replication and transcription. Bovine serum albumin (BSA) has an irreplaceable role in the transcription and translation of DNA. Therefore, considerable attempts are being made to research the interaction of copper(II) complexes with DNA and BSA [7]. In the studied metal complexes, copper(II) complexes have attracted more and more attention for their properties, such as pharmic value, antitumor activity, and biological activity [8]. On one hand, copper plays a very important role as the microelement in several biological processes. On the other, copper complexes can be reacted with DNA by non-covalent binding methods [9]. They also exhibited the most potent antitumor activities, and have more effective than cisplatin in vitro tests in some cases [8]. For example, some complexes involving aminohydroxamic acid ligands also show interesting bioactivity [10,11].
Based on the studies of copper complexes, we synthesized four copper complexes and obtained their structures through X-ray single crystal diffraction. Besides, the interaction of complexes 14 with DNA and BSA were investigated through spectroscopy, fluorescence spectroscopy, and circular dichroism. Furthermore, in vitro cytotoxic studies were also explored against four cancer cell lines (HeLa, HCT-116, HL-60, A549) in detail.
2. Materials and Methods
2.1. Materials
Glycine hydroxamic acid (H2glyha) and Alanine hydroxamic acid (H2alaha) were synthesized as previously reported in Reference [12]. Ethidium bromide (EB) and calf thymus DNA (CT-DNA) were purchased from Sigma (Shanghai, China). Tris-HCl/NaCl buffer solution was prepared using double-distilled water. All other reagents were analytical grade as purchased from commercial sources and used without further purification.
Elemental analyses of C, H, and N were determined using an Elemental Vario EL analyzer. IR spectra (400–4000 cm−1) were recorded on a PerkinElmer spectrophotometer (ThermoNicolet Corporation, Madison, WI, USA) with samples prepared as KBr disks. Thermogravimetric analyses (TGA) were performed using a V5.1A Dupont 2100 (NETZSCH, Bavaria, Germany). UV-vis spectra were performed on a UV2550 ultraviolet spectrophotometer (Shimadzu, Kyoto, Japan). Fluorescence spectra were obtained on an F-7000 FL Spectrophotometer (Hitachi Limited, Tokyo, Japan). Circular dichroism (CD) spectra measurements were measured on a Jasco J-810 spectropolarimeter (JASCO Corporation, Tokyo, Japan).
2.2. X-ray Crystallography
X-ray diffraction single-crystal data for the complexes were obtained on a Bruker Smart 1000 CCD diffractometer (Bruker-AXS, Saarbrucken, Germany) at 298(2) K(graphite monochromatized Mo or Cu Kα radiation, λMo = 0.71073 Å, λCu = 1.54184 Å). All data were corrected using the SADABS method and the final refinement was performed by full matrix least-square methods with anisotropic thermal parameters for non-hydrogen atoms on F2 using the SHELX97 program [13]. The hydrogen atoms were added theoretically.
2.3. Synthesis of Complexes
2.3.1. [Cu2(glyha)(bpy)2(H2O)]·2ClO4·H2O (1)
H2glyha 0.045 g (0.5 mmol) was dissolved in H2O (15 mL), followed by the addition of Cu(ClO4)2·6H2O 0.186 g (0.5 mmol). After 30 min, Nd(NO3)3·6H2O 0.045 g (0.1 mmol) was added. The color changed from dark green to navy blue immediately. After stirring for about 3 h at room temperature, 2,2′-bipyridine 0.031 g (0.2 mmol) was added to the above solution. Then the reaction solution was stirred for about 3 h. The crystals were obtained through slow evaporation of the solvent with the yield of 45.8%. Elem. Anal. Calcd (%) for C22H24Cl2Cu2N6O12 (Mr = 762.45): C 34.63; H 3.15; N 11.02. Found (%): C 34.37; H 3.04; N 10.96. The TGA curves show that the first stage ranging from 25 °C to 250 °C is due to the evolution of the residual solvent and the second stage is attributed to complex structure decomposition (Figure S1). Cyclic voltammetry (CV) of Complex 1 in PBS (phosphate buffer solution) saturated with N2 is illustrated in Figure S2. It was noticed that the redox peaks at 0.51 V and 0.66 V were similar to those of the standard electrode potential of Cu+/Cu2+ [14]. Selected IR (KBr pellet, cm−1): 3462 (vs, vO-H), 1640 (m, vC=N(bipy)), 1580 (vs, C=N), 1252 (m, vC-O), 1090 (vs, vN-O), 732 (s, vC-H).
2.3.2. [Cu2(glyha)(phen)2]·2ClO4 (2)
Synthesis of complex 2 was similar to complex 1 with 0.040 g (0.2 mmol) 1,10-phenanthroline substituting 2,2′-bipyridine 0.031 g (0.2 mmol). Yield 55.0%. Elem. Anal. Calcd (%) for C52H40Cl4Cu4N12O20 (Mr = 1548.92): C 40.29; H 2.58; N 10.85. Found (%): C 40.55; H 2.45; N 10.53. The TGA curves show that the first stage ranging from 25 °C to 104 °C is due to the evolution of the residual solvent and the second stage is attributed to complex structure decomposition (Figure S1). CV of Complex 2 in PBS saturated with N2 are illustrated in Figure S1. It was noticed that the redox peaks at 0.45 V and 0.77 V were similar to those of the standard electrode potential of Cu+/Cu2+. Selected IR (KBr pellet, cm−1): 3418 (vs, vO-H), 1628 (m, vC=N(phen)), 1569 (vs, vC=N), 1226 (m, vC-O), 1111 (vs, vN-O), 723 (vs, vC-H).
2.3.3. [Cu2(alaha)(bpy)2Cl]·Cl·4H2O (3)
H2alaha 0.052 g (0.5 mmol) was dissolved in H2O (15 mL), followed by the addition of CuCl2·2H2O 0.085 g (0.5 mmol). After 30 min, Nd(NO3)3·6H2O 0.045 g (0.1 mmol) was added. The color changed from dark green to navy blue immediately. After stirring for about 3 h at room temperature, 2,2′-bipyridine 0.031 g (0.2 mmol) was added to the above solution. Then the reaction solution was stired for about 3 h. The crystals were obtained through slow evaporation of the solvent with the yield 51.5%. Elem. Anal. Calcd (%) for C46H56Cl4Cu4N12O11 (Mr = 1348.99): C 40.92; H 4.15; N 12.45. Found (%): C 40.51; H 4.03; N 12.16. The TGA curves show that the first stage ranging from 25 °C to 250 °C is due to the evolution of the residual solvent and the second stage is attributed to complex structure decomposition (Figure S1). CV of Complex 3 in PBS saturated with N2 are illustrated in Figure S1. It was noticed that the redox peaks at 0.48 V and 0.69 V were similar to those of the standard electrode potential of Cu+/Cu2+. Selected IR (KBr pellet, cm−1): 3423 (vs, vO-H), 1602 (vs, vC=N(bipy)), 1565 (vs, vC=N), 1252 (m, vC-O), 1088 (vs, vN-O), 738 (s, vC-H).
2.3.4. [{Cu2(alaha)(phen)2}{Cu2(alaha)(phen)2(NO3)}]·3NO3 (4)
Synthesis of complex 4 was similar to complex 3 with Cu(NO3)2·3H2O 0.121 g (0.5 mmol) substituting CuCl2·2H2O 0.085 g (0.5 mmol) and 1,10-phenanthroline 0.040 g (0.2 mmol) substituting 2,2′-bipyridine 0.031 g (0.2 mmol). Yield 42.3%. Elem. Anal. Calcd (%) for C54H42Cu4N16O16 (Mr = 1425.24): C 45.47; H 2.95; N 15.72. Found (%): C 45.75; H 2.73; N 15.59. The TGA curves show that the first stage ranging from 25 °C to 250 °C is due to the evolution of the residual solvent and the second stage is attributed to complex structure decomposition (Figure S1). CV of Complex 4 in PBS saturated with N2 are illustrated in Figure S1. It was noticed that the redox peaks at 0.48 V and 0.66 V were similar to those of the standard electrode potential of Cu+/Cu2+. Selected IR (KBr pellet, cm−1): 3431 (vs, vO-H), 1627 (m, vC=N(phen)), 1567 (s, vC=N), 1225 (m, vC-O), 1106 (m, vN-O), 779 (m, vC-H).
2.4. DNA-Binding and Protein Binding Experiments
The CT-DNA concentration was determined by UV-vis absorption spectroscopy at 260 nm using a molar absorption coefficient of 6600 L·mol−1cm−1. All the complexes were dissolved in double-distilled water with a concentration of 2 mM. The interactions with DNA-binding and BSA-binding were studied in Tris-HCl (pH = 7.2) buffer solution. In UV-Vis absorbance, we performed by keeping the concentration of the copper(II) complex (10 μM) constant while varying the CT-DNA concentrations from 0 to 100 μM. For the fluorescence quenching experiments, a certain volume of each complex starting solution was gradually added to the DNA-EB solution, containing CT-DNA (25 µM) and EB (3 µM). Fluorescence emission spectra were recorded at 550–700 nm with all complexes excited at 258 nm and scan speed of 300 nm·min−1. CD spectra of DNA (100 µM) in the absence or presence of complexes (3 µM) were recorded on a Jasco J-810 spectropolarimeter with a scanning speed of 100 nm·min−1 with a scope of 230–330 nm at room temperature.
The BSA-binding experiments with copper(II) complexes were studied using the fluorescence spectra though keeping the concentration of BSA constant (0.2 μM) while varying the complexes concentration from 0 to 8 μM at room temperature. Fluorescence spectra were carried out at a scan speed of 150 nm/min and a slit width of 5 nm.
We used the AutoDock 4.2 program to study the binding site between complexes 1–4 and BSA by applying the Lamarckian genetic algorithm (LGA) for minimization using default parameters. Random starting positions on the entire protein surface and random orientations were used for complexes.
2.5. In Vitro Cytotoxicity
The cell lines, human lung carcinoma cell line (A549), human colon carcinoma cell line (HCT-116), human promyelocytic leukemia cell (HL-60), and cervical cancer cell line (HeLa) were used for screening. All cells were seeded into a 96-well plate at cell densities of 3000–5000 cells/well, respectively, in 100 μL of growth medium and were incubated for 24 h. Then removed the medium, the samples (copper complexes) were added and further incubation was carried out at 37 °C for 48 h. Then, the medium was removed, added 100 μL of a 0.5 mg/mL solution of MTT in medium, and the plate was incubated for an additional 4 h. The medium/MTT mixture was aspirated, and 100 μL of DMSO was added to dissolve the insoluble blue formazan precipitates produced by MTT reduction. For ensure complete dissolution, the plate was shaken for 10 min on a plate shaker. The absorbance of the plates was read at 490 nm using ELx808 Absorbance Microplate Reader (Bio-Tek Co., Winooski, VT, USA). IC50 values were extrapolated from the resulting curves. The reported IC50 values are the averages from at least three independent experiments, each of which consisted of three replicates per concentration level.
3. Discussion
3.1. Crystal Structures of the Complexes
The complexes 1–4 are synthesized by a similar procedure. The complex 1 is obtained by using glycine hydroxamic acid and 2,2′-bipyridine, while complex 2 is an analog of 1 by the replacement of 2,2′-bipyridine by 1,10-phenanthroline. Different from complexes 1 and 2 using glycine hydroxamic acid, the complexes 3 and 4 are both synthesized from alanine hydroxamic acid. The crystal data, selected bond distances, and angles of 1–4 are listed in Tables S1 and S2, respectively.
The asymmetric unit of complex 1 consists of two Cu2+, two 2,2′-bipyridine, one deprotonated glyha2−, one coordinated H2O molecule, as well as two free ClO4− anions and one H2O molecule. As shown in Figure 1, the basic structural motif of 1 is a dinuclear Cu coordination unit bridged by glyha2−. The Cu(1) atom has a four-coordinated planar square geometry with the equatorial positions occupied by O(1) and O(2) from carbonyl oxygen and oxime oxygen atom of the glyha2− ligand, and N(5) and N(6) from 2,2′-bipyridine. Cu(2) adopts a 5-coordinated square-pyramidal conformation, and the equatorial positions are occupied by N(3) and N(4) from amino nitrogen and oxime nitrogen of the glyha2− ligand, as well as N(1) and N(2) from the second 2,2′-bipyridine molecule. The apical coordination atom is supplied by O(12) of the coordinated water molecule. The Cu–N(bpy) bond lengths of 1.977(6)–2.023(7) Å are in agreement with that in the previously reported copper(II) complexes [15]. The distance of Cu(2)-O(12) is 2.319(6) Å, longer than that of the equatorial Cu–O average bond length of 1.910(5) Å. The Cu1 and Cu2 ions are bridged by glyha2− via two 5-membered chelating rings (Cu1-O1-C12-N4-O2; Cu2-N3-N4-C11-C12). The positive charges of the dinuclear Cu unit are balanced by ClO4−. There exist two types of hydrogen bonding interactions (N3-H3a··O6, O12-H12c··O6) between the dinuclear Cu unit and ClO4−. The neighboring dinuclear Cu units are further linked via such hydrogen bonds to form a one-dimensional supramolecular chain structure (Figure S3). Further, these 1D chains are stacked via π-π stacking between the pyridine ring and pyridine ring to afford a three-dimensional network (Figure S4). Complex 2 has a similar dinuclear Cu coordination unit except for the replacement of 2,2′-bipyridine by 1,10-phenanthroline (as shown in Figure 1). However, the packing of 2 is different from that of 1. In complex 2, the neighboring dinuclear Cu units are packed together via π-π stacking between the phenanthroline ring and phenanthroline ring to afford a positive three-dimensional supramolecular network. The ClO4− anions acting as counteranions lie in the small cavities of the 3D network (Figure S4).
Complex 3 and complex 4 are synthesized by alanine hydroxamic acid. The asymmetric unit of complex 3 consists of two Cu2+, two 2,2′-bipyridine, one deprotonated alaha2−, as well as two Cl− anions and four H2O. In the complex 3, Cu1 and Cu2, are in {N4} square-planar and {N2O2Cl} square-pyramidal coordination environments, respectively. In the axial position, Cu(1) coordinates with Cl(1). The distance of Cu(2)-Cl(1) is 2.690 Å. The Cu–N(bpy) bond lengths of 1.995(5)–2.037(5) Å are in agreement with that in the previously reported copper(II) complexes [15]. Each copper ion can form two five-membered rings with bipyridyl and alaha2−. In complex 3 a chloro as bridge forms a two-dimensional layer (Figure S3). There exist two types of hydrogen bonding interactions (O1-H4c··O4, N1-H1a··O4) between dinuclear Cu unit forms a one-dimensional supramolecular chain structure. Further, these 1D chains are stacked via π-π stacking to afford a three-dimensional network as shown in Figure S4. The positive charges of the dinuclear Cu unit are balanced by Cl−. However, complex 4 consists of two independent molecular structures. Each structure includes two 1,10-phenanthroline, one alaha2−, and two Cu2+. The difference between the two structures is that Cu in one structure coordinates with O(6) of NO3− in the axial direction and in the other structure the axial position of Cu is not occupied. The average distances of Cu(II) ion with 1,10-phenanthroline nitrogen is 2.015(3) Å, noticeably longer than that of Cu–N(amino) 2.013(6) Å and Cu–N(oxime) 1.930(1) Å. The average distances of Cu–O(oxime) and Cu–O(carbonyl) are 1.898(1) and 1.917(6) Å, respectively. The alaha2− connects two copper ions through carbonyl oxygen, oxime oxygen, amino nitrogen, and oxime nitrogen. Each copper ion can form two five-membered rings with phenanthroline and alaha2−. A three-dimensional network structure is formed by π-π stacking (Figure S4).
3.2. DNA Binding Studies
In pharmacology, DNA is usually chosen to function with newly synthesized complexes to evaluating their antitumor property. Therefore, the mechanism of interaction between synthesized complexes and DNA becomes important. To understand the mechanism of metal complexes with DNA, we investigated the mode and the propensity for binding of the higher cytotoxicities of the four complexes with DNA through UV-Vis absorption, fluorescence, and circular dichroism (CD) techniques.
3.2.1. UV-Vis Spectra
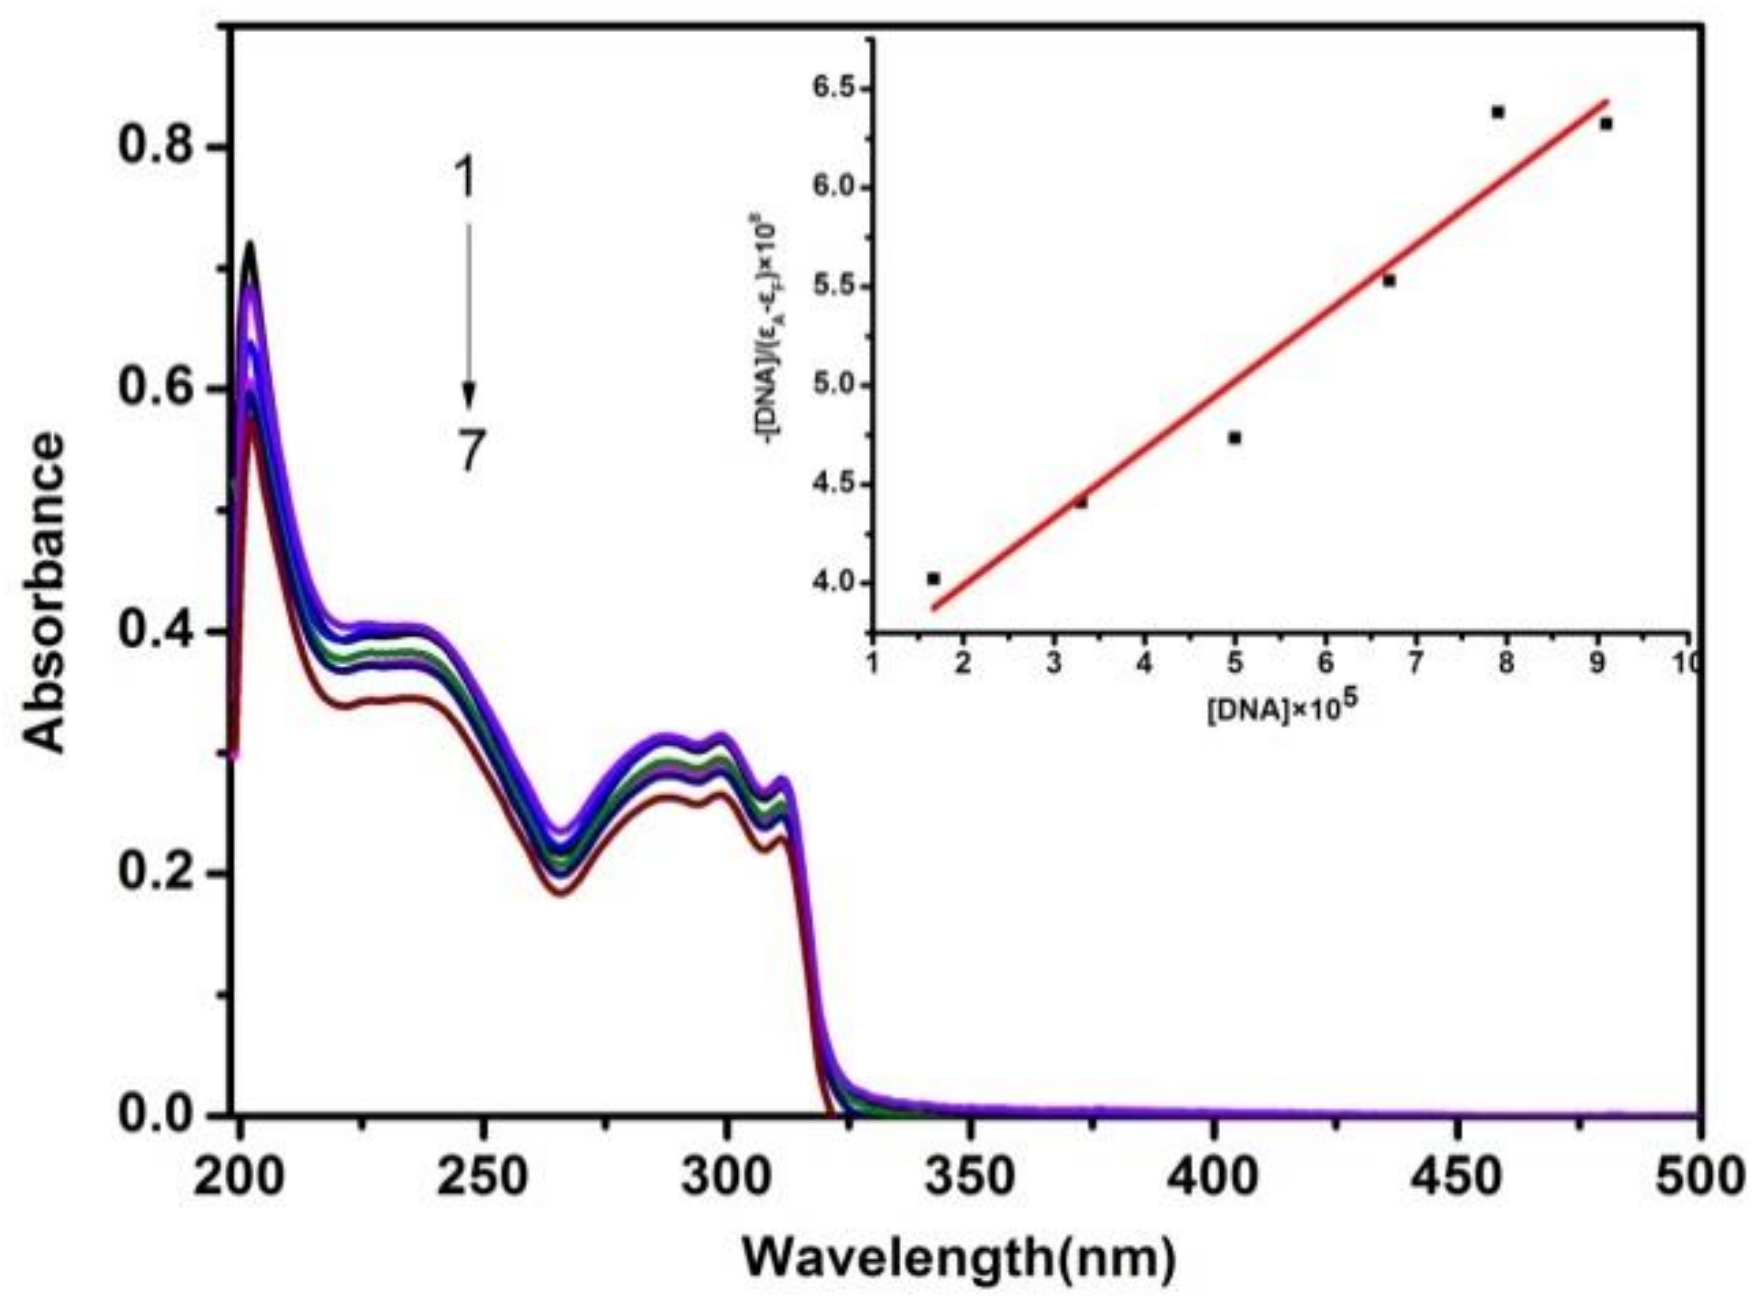
The stability of the four complexes in Tris were determined by UV-Vis spectra (Figure S5). The absorption spectra of complexes 1–4 in the absence and presence of CT-DNA are shown in Figure 2 and Figures S6–S8, respectively. From these figures, we can see that, as the increase of DNA concentration, the absorption of complex 1 at 200 nm is obviously subtractive and has a slight redshift, which may be attributed to the intercalative between complex 1 and DNA. Because the change in hypochromism and strong bathochromic shift usually are related to the intercalative binding, which can be explicated as the function of the aromatic chromophore and DNA base pairs [15]. In order to quantitatively measure the binding strength of complexes with DNA, the binding constants Kb can be obtained by using the following formula [16]:
[DNA]/(εA − εF) = [DNA]/(εB − εF) + 1/Kb(εB − εF)
The Kb values were calculated using the above equation and the values are given in Table 1. The binding constant Kb indicates the medium binding strength of the complexes with CT-DNA. These values are comparable to those reported metal complexes (ranging from 102 to 105 M−1) [15]. The value indicates a stronger interaction between complex 4 and DNA than other titled complexes.
3.2.2. Fluorescence Spectra
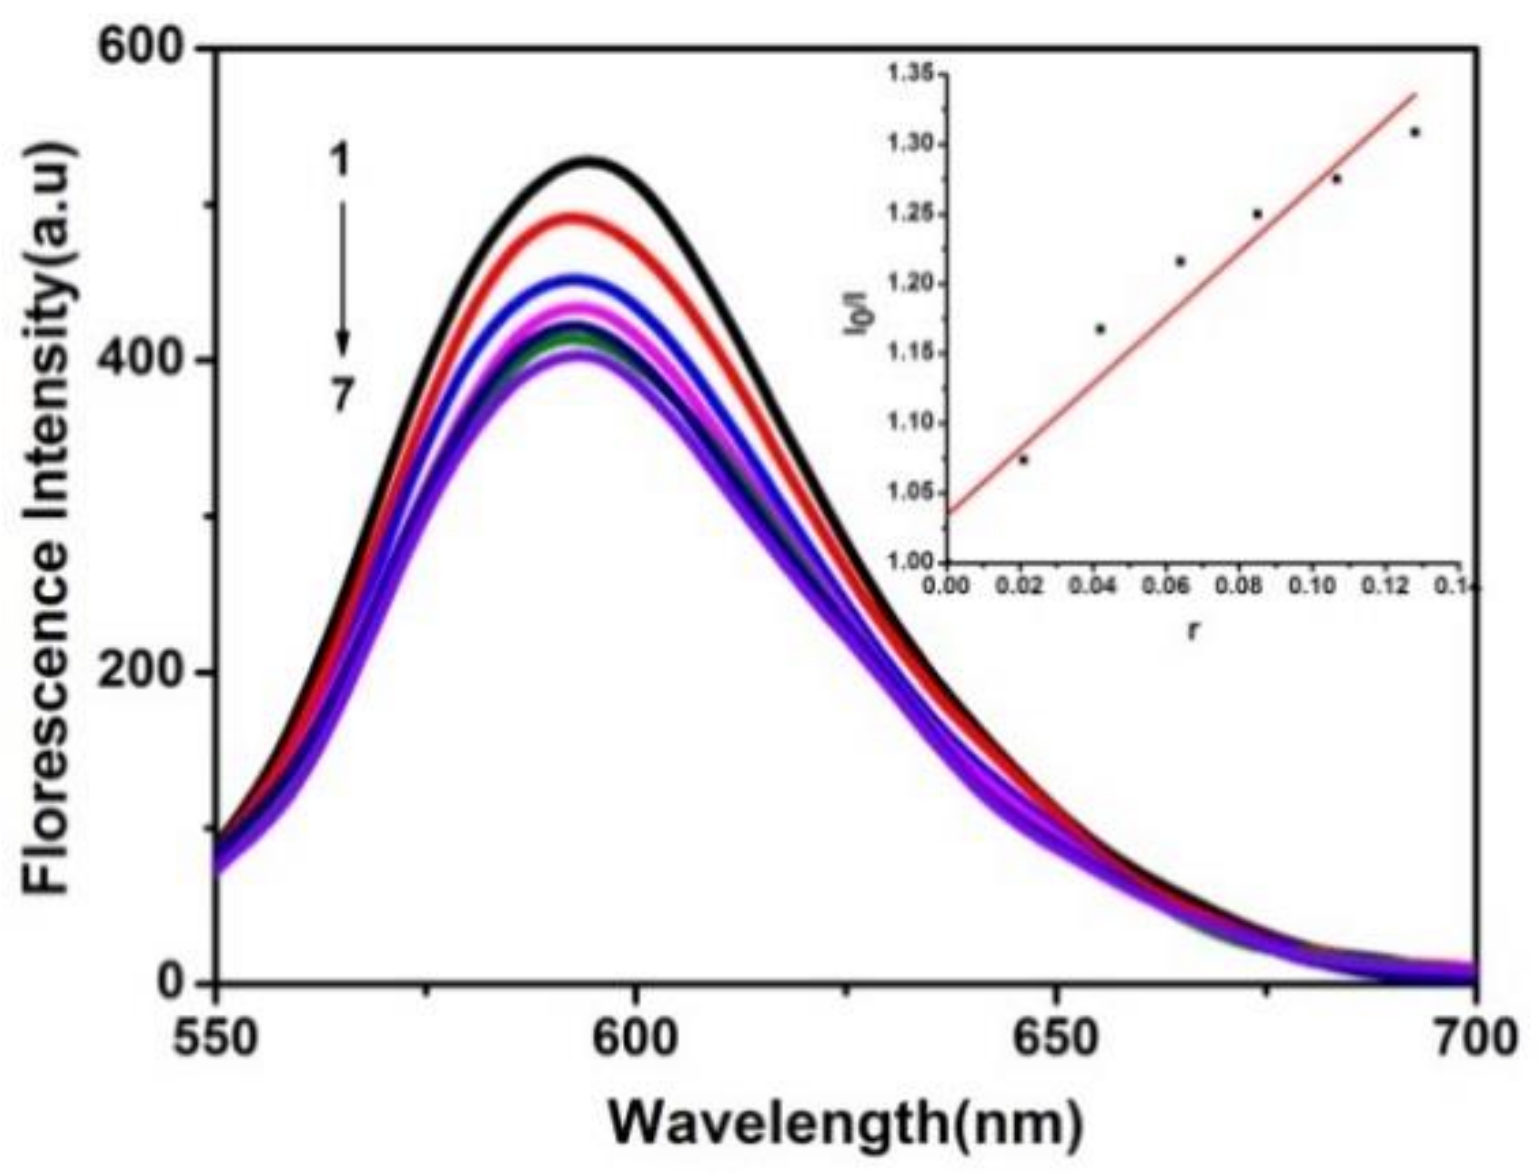
Fluorescence spectroscopy is a common and fast spectroscopic study of the interaction of complexes with DNA. DNA and ethidium bromide (EB) molecules are weakly fluorescent. In order to investigate the interaction between the titled complexes and DNA, EB was used as a probe. In the presence of DNA, the emission intensity of EB can be greatly enhanced because of its strong intercalation among the adjacent DNA base pairs. However, due to the addition of another molecule, the enhanced fluorescence could quench or decrease [17]. So the fluorescence quenching assays of EB bound DNA is used to differentiate the intercalating and non-intercalative interaction. The solutions of complexes 1–4 (0–3.2 μM) were added to pretreated EB-DNA and the intensity of emission was measured with the figures as shown in Figure 3 and Figures S9–S11. The results show that the addition of the complexes into the DNA resulted in a decrease of the fluorescence curve. It can be inferred that the titled complexes bind to CT-DNA with an intercalative mode [18]. The quenching of EB bound to DNA with the observed linearity in the plot is in good agreement with the linear Stern-Volmer equation [19] given below:
where I0 and I represent the fluorescence intensities in the absence and presence of the sample, respectively; r is the concentration ratio of the sample to DNA and Ksq is the linear Stern-Volmer constant. From the embedded graph, I0/I and r have a good linear relationship, indicating that the interaction between the complexes and DNA. The Ksq values can be obtained from the slope of the linear plot of I0/I versus r. The values of Ksq for complexes 1–4 are given in Table 1 and the higher value of complex 4 indicates a stronger interaction between complex 4 and DNA than that in the other complexes. These Ksq values are higher than those for some other complexes [20].
I0/I = 1 + Ksqr
3.2.3. Circular Dichroism (CD) Spectroscopy
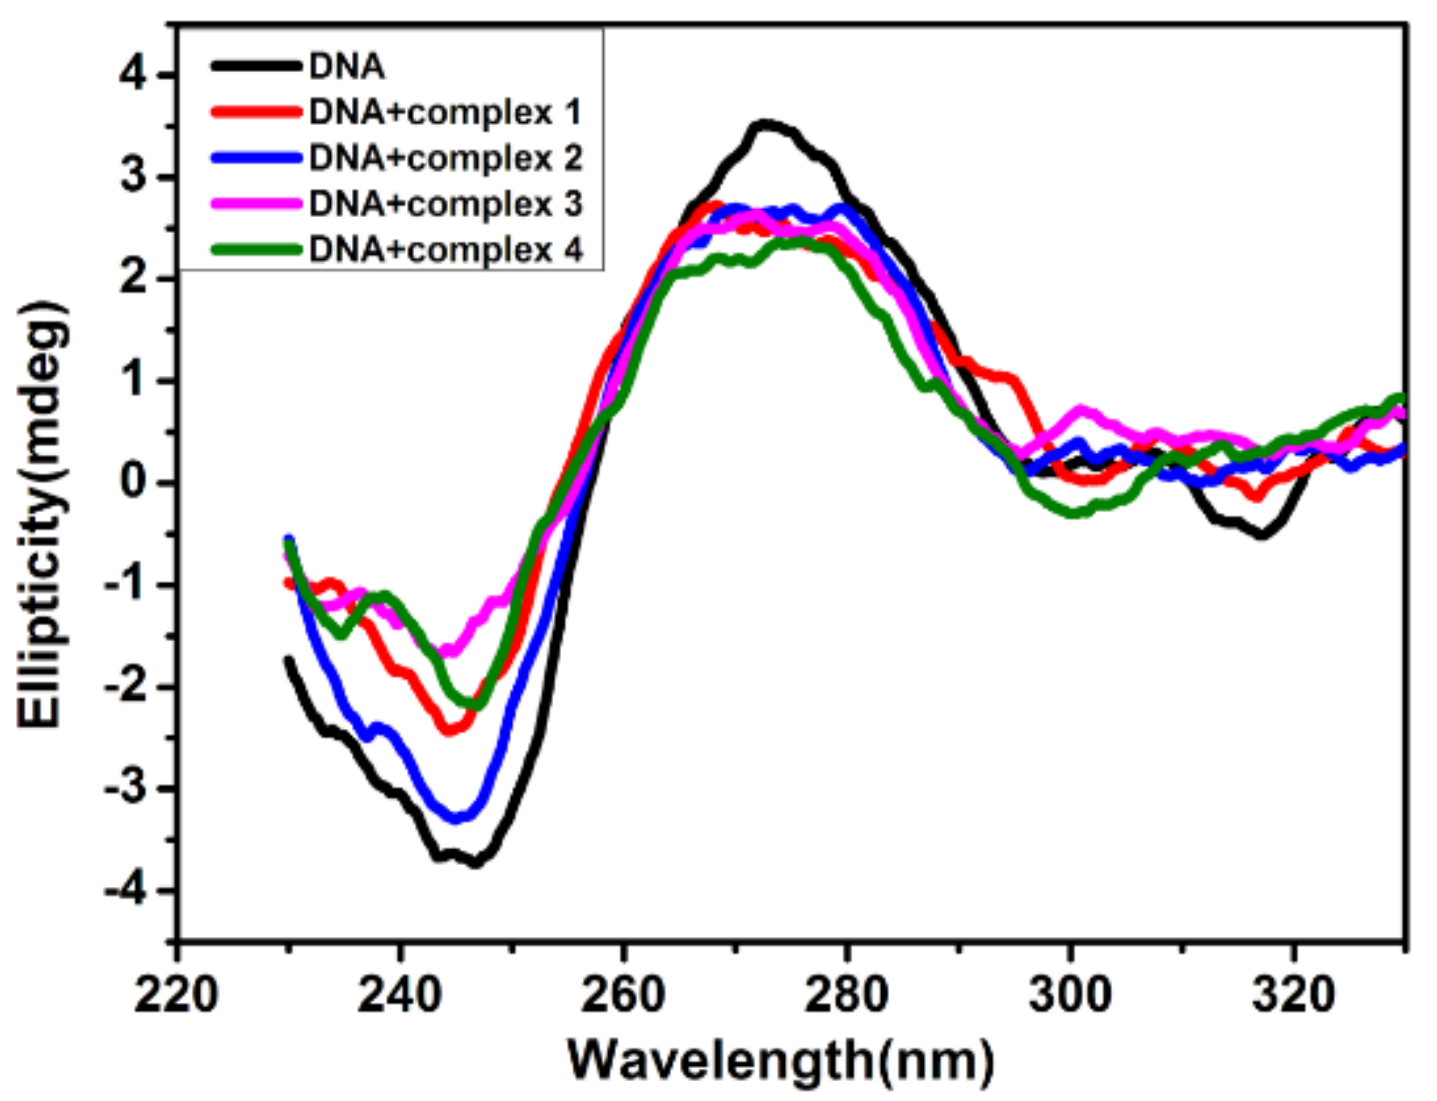
CD spectrum is an important method for the determination of optical activity of chiral complexes and is sensitive to the conformation transition of DNA molecules. CD spectrum is used to study the effect of metal complexes on DNA conformation. When the metal complex and DNA are combined by non-covalent means, through trench bonding and electrostatic binding, which do not affect the DNA secondary structure, the CD spectrum does not change significantly. If a metal-binding molecule binds to DNA by insertion, it changes the secondary structure of the DNA and the circular dichroism changes dramatically [21]. The observed CD spectra of CT-DNA in the absence and presence of complexes 1–4 are shown in Figure 4. From the figures, we can see that the positive (ca. 278 nm) and negative (ca. 246 nm) peaks decreased in intensity, which is characteristic of intercalation between complexes 1–4 and CT-DNA [22]. This indicates the change in the base stacking without destroying the DNA helix conformation. The result is also consistent with the UV-visible and fluorescence spectra.
3.3. Protein Binding Studies
3.3.1. Fluorescence Quenching Studies of BSA
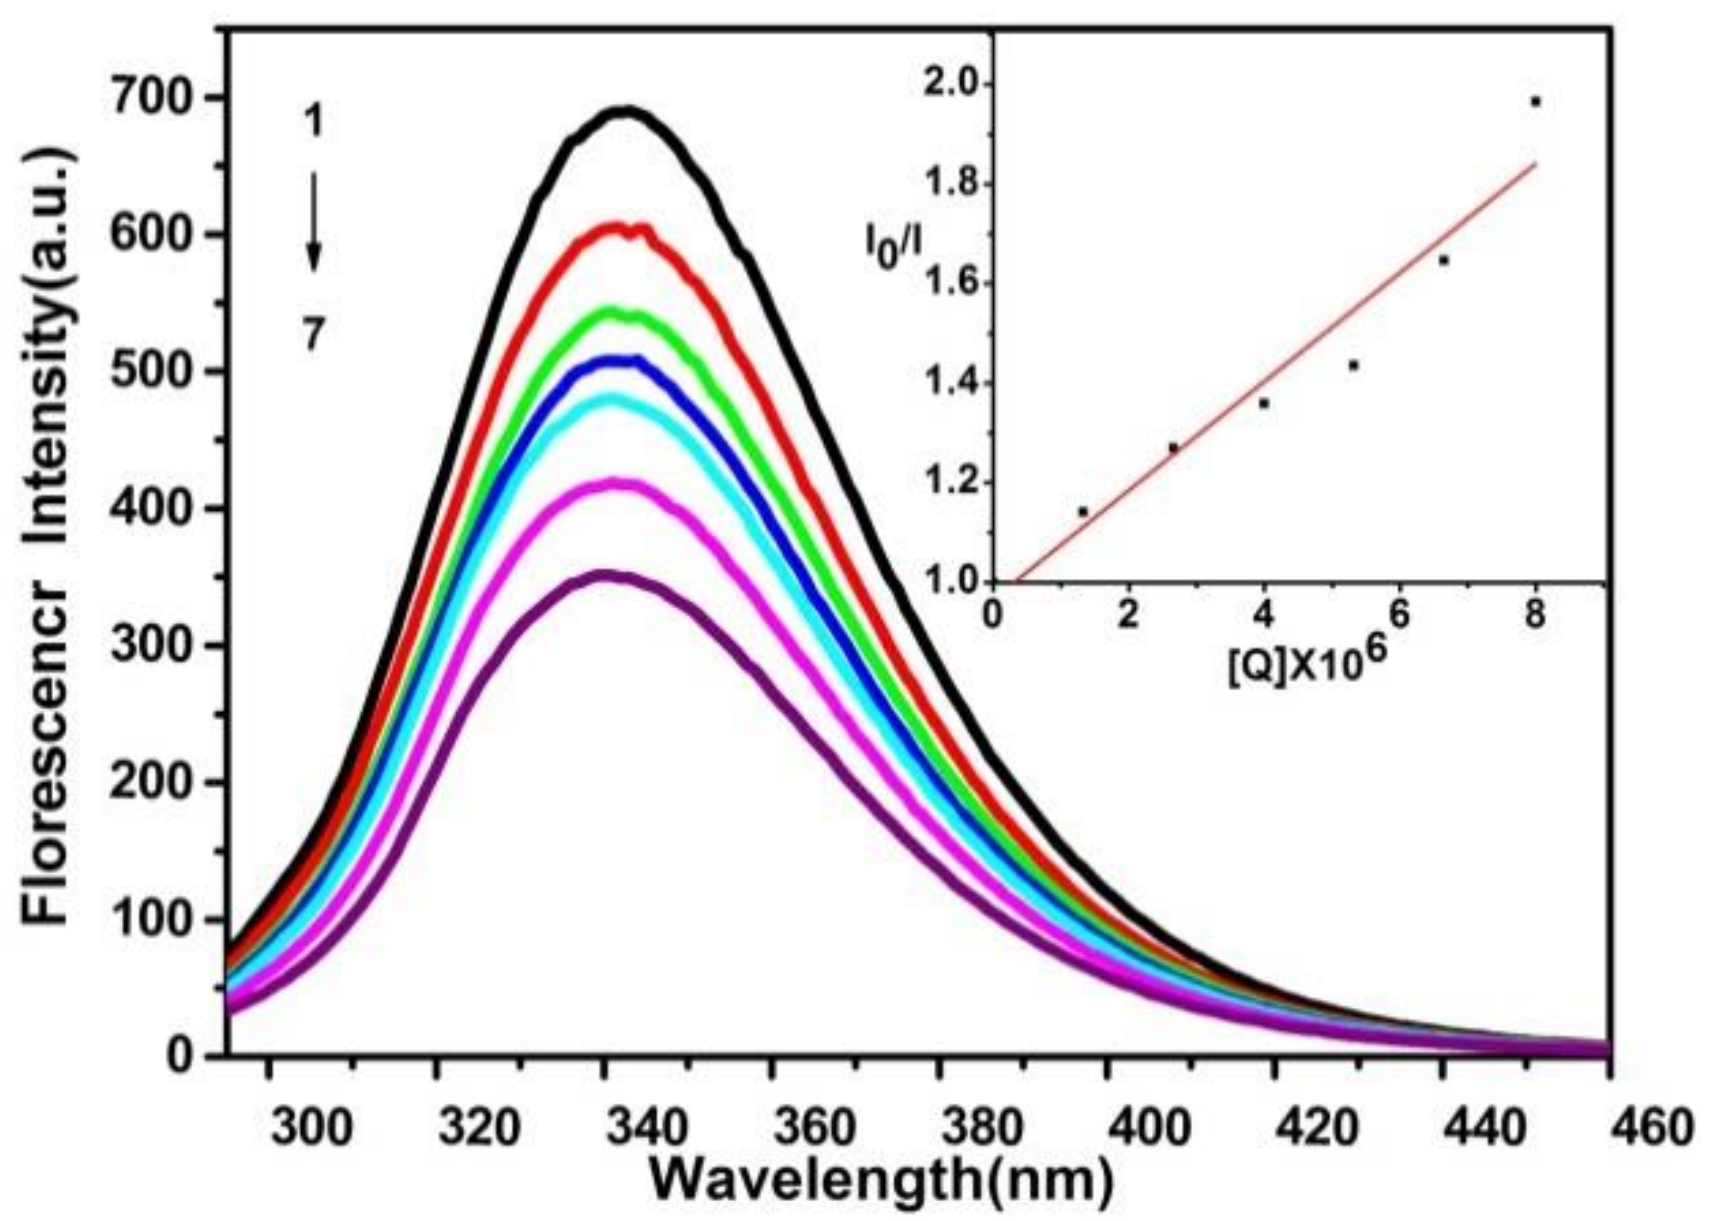
BSA with its available and affordable properties and similarity with human serum albumin (HSA) as well as the tryptophan, tyrosine, and phenylalanine residues, is used to study the fluorescence properties [23]. In order to study the binding mechanism of the complexes with BSA, we studied the interaction of Cu complexes with BSA by fluorescence spectroscopy. Figure 5 shows a fluorescence quenching of the interaction of the complex 1 with BSA, while the correlated spectra of complexes 2–4 are presented in Figures S12–S14. According to figures, the maximum emission of BSA is 340 nm. The increasing concentration of the copper(II) complexes resulted in a significant decrease of the fluorescence intensity of BSA. The data are analyzed using the Stern–Volmer equation [24]:
where I0 and I represent fluorescence intensities in the absence and presence of the sample, respectively; τ0 is the fluorescence lifetime of the fluorescent substance in the absence of a quencher, generally 10−8 s; [Q] is the quencher concentration; and Kq is the quenching constant of biomolecules. Ksv = Kqτ0 represents the Stern–Volmer quenching constant. The Ksv value can be obtained from the slope of the linear plot of I0/I versus [Q] (Table 1). The Kq are 1.09 × 10¹³, 1.20 × 10¹³, 1.04 × 10¹³, 2.11 × 10¹³, respectively. The Kq of the complexes 1–4 is larger than the maximum value (2 × 10¹⁰ mol·L−1·s−1) for the diffusion-controlled quenching of biological macromolecules. Maybe this suggested that the quenching mechanism has been caused by a specific interaction between BSA and the complexes, a static quenching mechanism [25].
I0/I = 1 + Kqτ0[Q] = 1+ Ksv[Q]
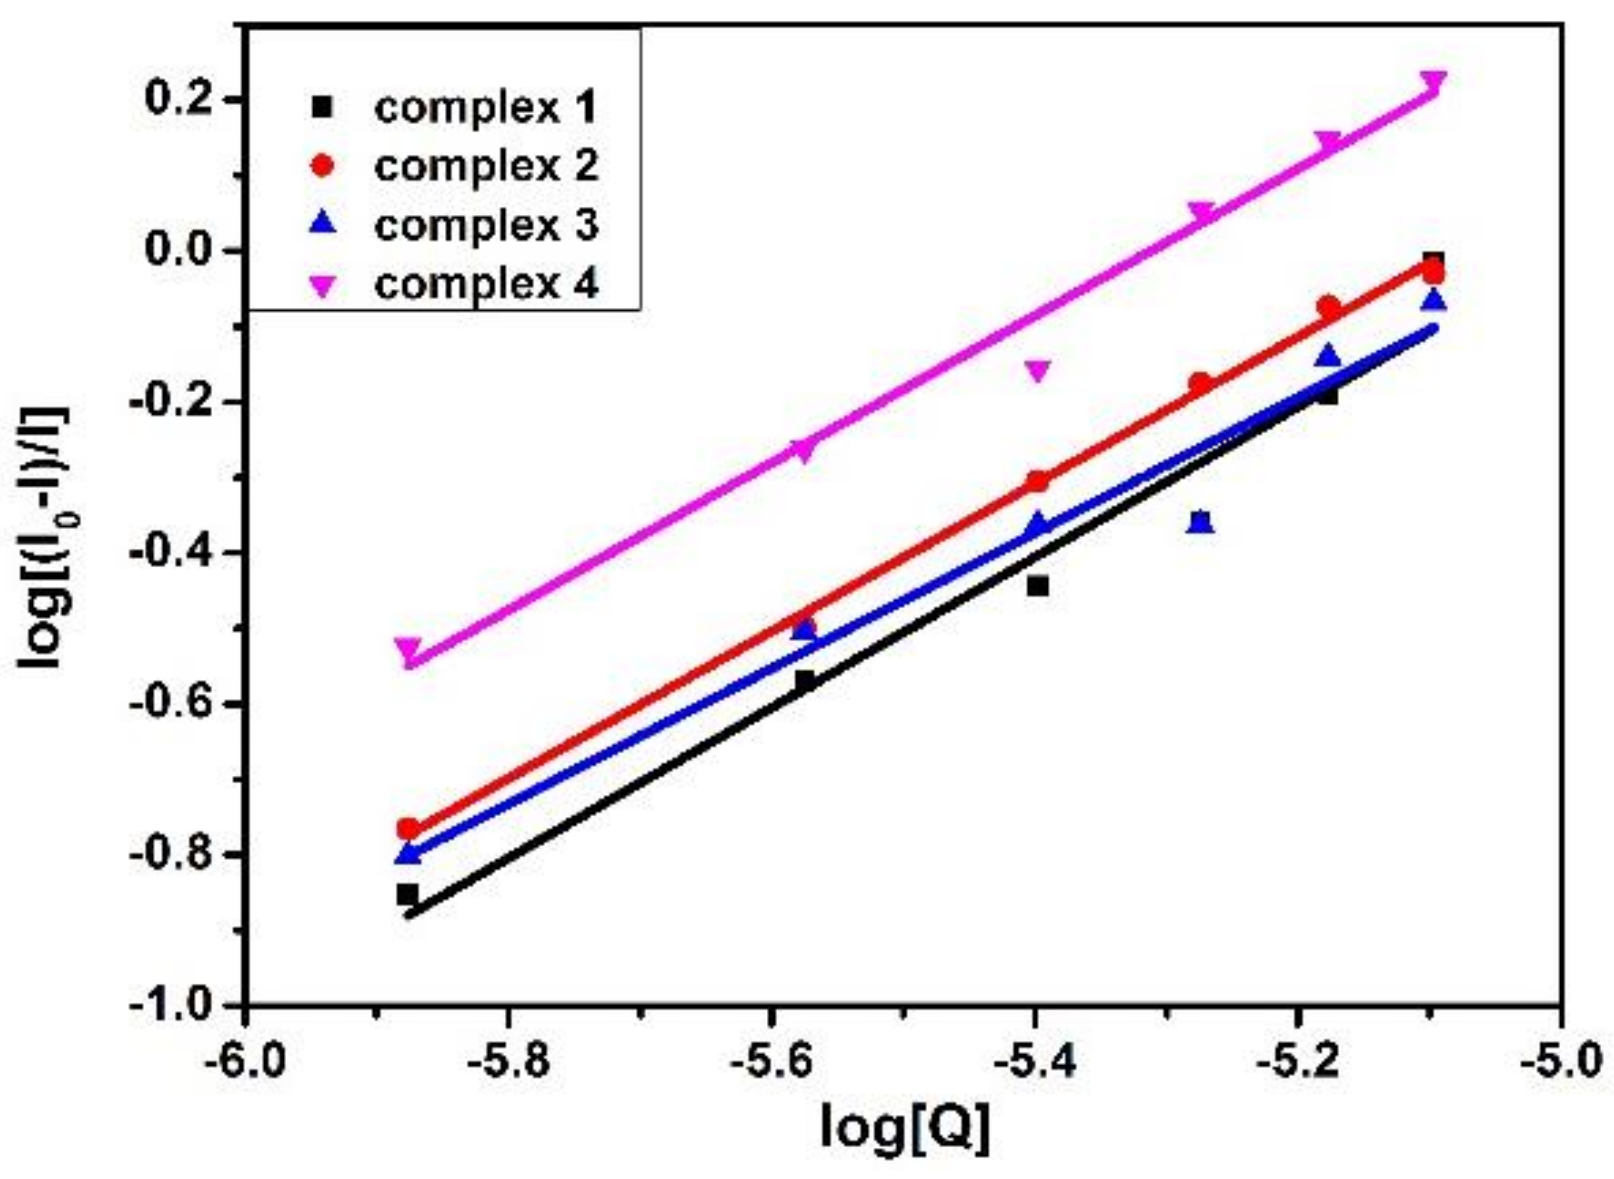
For static quenching interaction, the fluorescence intensity data can also be used to analyze the apparent binding constant (Kb) and the number of binding sites (n) for the complex and BSA system by the following equation [24]:
log((I0 − I)/I) = logKb + nlog[Q]
Kb and n are calculated from the intercept and slope in Figure 6 log((I0 − I)/I) versus log[Q]. The calculated Kb and n values are given in Table 1. These values of n are approximately equal to 1, suggesting that there is only one binding site for these complexes on the BSA molecule.
Based on the above analysis (UV-visible, fluorescence, and circular dichroism spectra), we can get the DNA and BSA binding results (Table 1). It is clear that copper(II) complexes 1–4 could bind to CT-DNA in the intercalation mode. Both the binding constant obtained by UV-vis and fluorescence phenomenon reveals the stronger DNA-binding for complex 4 than other complexes, which is in accordance with that in vitro cytotoxicities.
3.3.2. Molecular Docking Studies
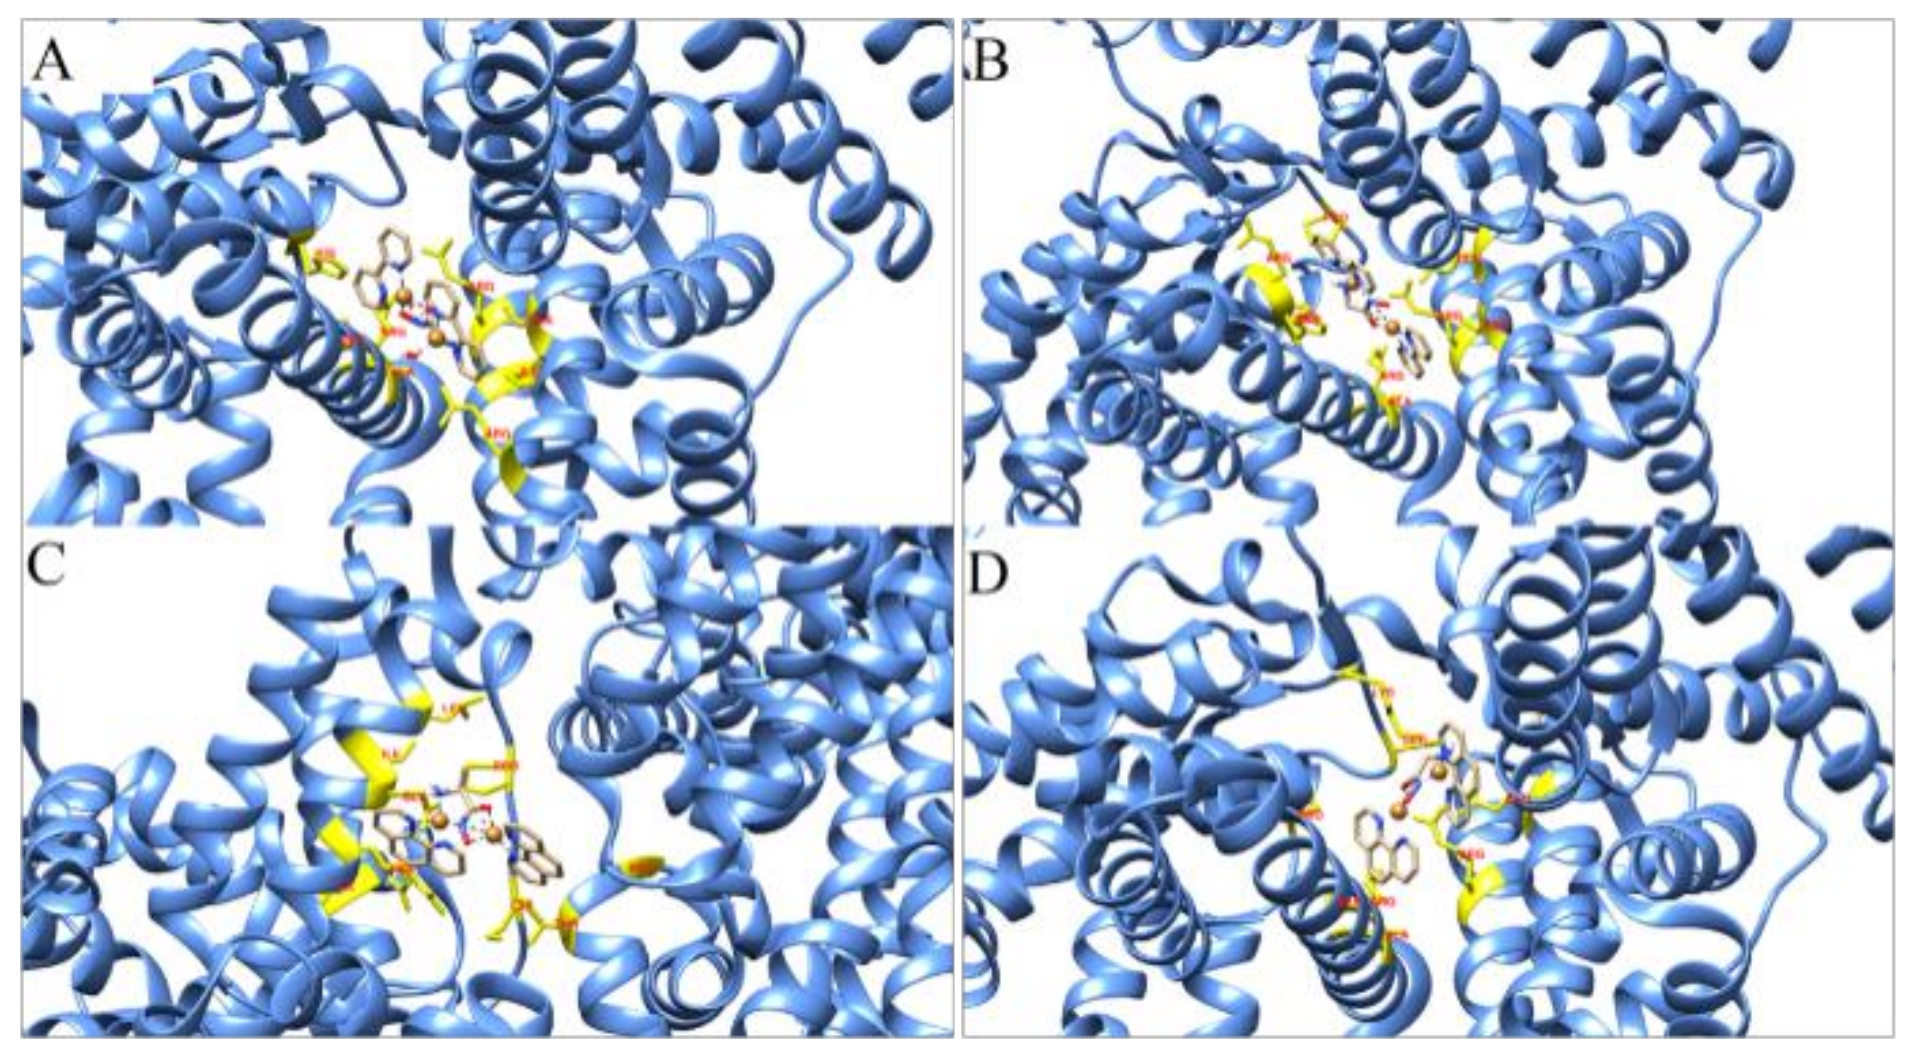
Molecular study was employed as a complementary method to identify the principal binding site of the copper(II) complexes to BSA and to help deepen understanding of the drug–biomacromolecule interaction [26]. The nearby amino acid residues of complexes 1–4, and the microenvironment of complexes are shown in Figure 7. As observed from Figure 7A, the complex 1 is indeed buried in the hydrophobic pocket and the docking results also show that the presence of Arg, His, and Ile (with hydropathies of 4.5, 3.2, and 4.5, respectively) around complex 1. As shown in Figure 7B, Pro, Arg, Ser (with hydropathies of 1.6, 4.5, and 0.8, respectively) around complex 2 may donate hydrophobic forces. The enlarged views of the binding sites of complex 3 and 4 are shown in Figure 7C,D and we can see that the complexes mainly interact with charged amino acid residues such as Arg and Glu. However, hydrophobic forces take priority among all the forces between the two substances. It is important to note that the free energy obtained from the docking results (Table 1) is rather consistent with the previous study.
3.4. Anticancer Activity Studies
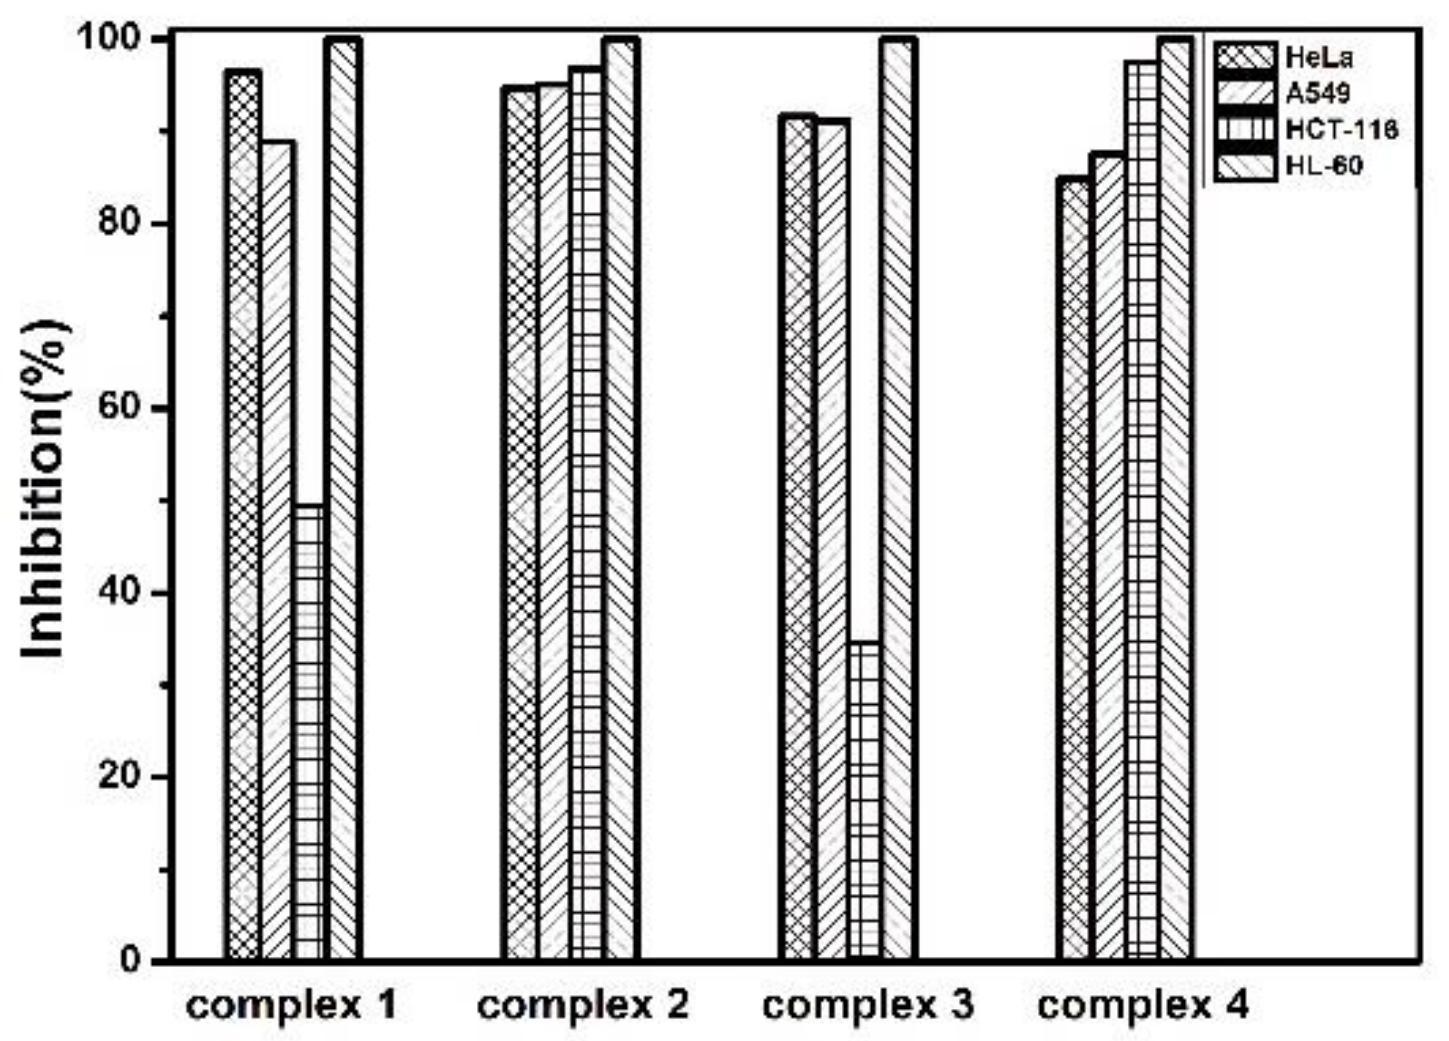
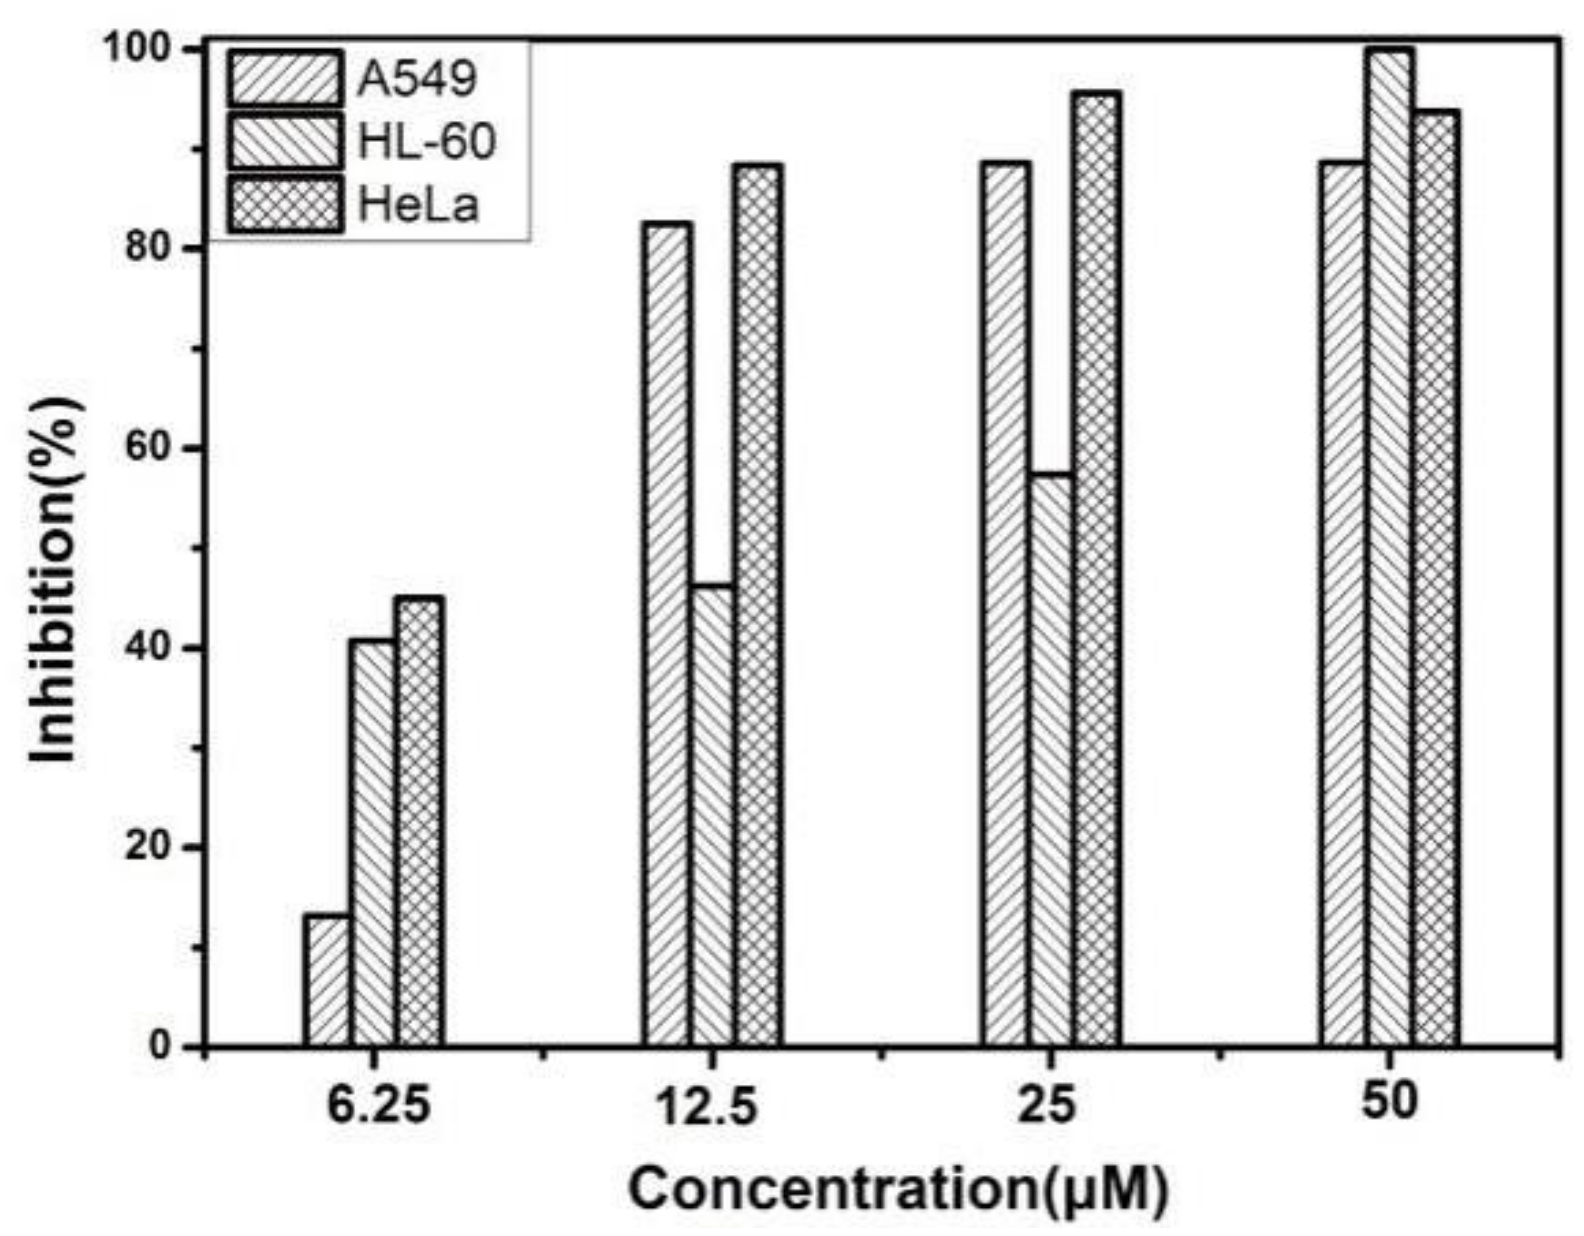
In order to obtain information on the antiproliferative activity, the in vitro antitumor activities of complexes 1–4 were determined by MTT-based assays. The possible structure–activity relationship was also primarily discussed. For the screening of the complexes, a high concentration (50 µΜ) was selected to calculate the inhibition rate of the tumor cells (Figure 8). If the inhibition rate of the complex is more than 65%, it is selected for further evaluation in low concentration, and the IC50 is calculated. The inhibition effects of all complexes on the four cell lines at different concentration are shown in Figure 9 and Figures S15–S17. The IC50 values, calculated from the dose-survival number, obtained after 48 h of drug treatment in the MTT test, are summarized in Table 2.
From the MTT assay results, it is conspicuously evident that complexes 2 and 4 exhibit good antitumor activity on the tumor cell lines (A549, HCT-116, HL-60, and HeLa) tested in micromolar concentration range after 72 h of exposure to increasing concentrations of complexes. From the results of in vitro cytotoxic effects of the test complexes, we can see that all texted copper complexes showed strong concentration-dependent antiproliferative activities against the four tumor cell lines, the percentage inhibition grows with the increase of the concentration of copper(II) complexes. Complex 4 exhibits a greater activity than complexes 1–3 against four examined cancer cells. The IC50 values of complexes 1–4 follow the trend 3 > 1 > 2 > 4 for all cell lines. Complex 2 and complex 4 have higher inhibition effects than cisplatin. Also, the data analysis reveals that different complexes demonstrate different anticancer activities against the same cell line, and the inhibitory potencies of the same complex against four different tumor cells exhibit a high selectivity. For example, complex 3 demonstrates significant activities for tumor cells A549, HL-60, and HeLa, while exhibiting no activity for tumor cell HCT-116.
The organic groups that combine with copper atoms have a great influence on the growth suppression activity of copper complexes on tumor cells. The Cu complexes attached to the 1,10-phenanthroline group exhibits rather low IC50 values than 2,2′-bipyridine ones which are probably due to the higher rigidity of 1,10-phenanthroline than the 2,2′-bipyridine. The structures of complexes 2 and 4 are not easily deformed when the complex reacts with the DNA. Complex 4 with higher in vitro cytotoxicity reveals the stronger DNA-binding, according to both the binding constant obtained by UV-vis and fluorescence phenomenon. All complexes exhibited antitumor activities to some extent. Complex 4 effectively inhibited the proliferation of the tested cells lines at low concentration with IC50 values lower than 1 μM. As for the highest activity of compound 4, it may be due to the better solubility of 1,10-phenanthroline than 2,2′-bipyridine. Also alanine hydroxamic acid has one more methyl group than glycine hydroxamic acid, which results in complex 4 showing higher lipophilicity. Therefore, the complex 4 is more likely to cross the cell membrane and enter the cell interior. The results show higher inhabited than the positive reference drug cisplatin. The title copper complexes are of much potential for further investigation as antitumor agents.
4. Conclusions
Four new copper(II) complexes from two different aminohydroxamic acids have been synthesized and characterized. The interaction of complexes with calf thymus DNA (CT-DNA) was studied by UV spectroscopy, fluorescence spectroscopy, and circular dichroism, and the result revealed that complexes 1–4 interacted with CT-DNA through intercalation. The binding constant obtained by UV-vis and fluorescence phenomenon revealed the stronger DNA-binding for complex 4 than that for 1–3. BSA-binding investigations revealed that all complexes quench the intrinsic fluorescence of BSA in a static quenching process and complex 4 exhibits higher BSA-binding ability. These results provide a valuable tool for understanding the interactions between protein/DNA and copper complexes. In vitro cytotoxicity studies against four cancer cell lines reveal that complexes 2 and 4 exhibit higher cytotoxic activities than cisplatin, promising anticancer agents in cisplatin-resistant cell lines.
Supplementary Materials
The following are available online at https://0-www-mdpi-com.brum.beds.ac.uk/2073-4352/8/5/201/s1, Figure S1: TGA curves of the complexes 1–4, Table S1: Crystal data and structure refinement for complexes 1–4.
Author Contributions
J.Z., J.D. and D.L. conceived and designed the experiments; J.Z. performed the experiments; J.Z. and H.Y. analyzed the data; J.Z. wrote the paper.
Acknowledgments
This work was supported by the National Natural Science Foundation of China (No. 21671093 and 21271097), the Tai-Shan Scholar Research Fund of Shan-dong Provience and Liaocheng University.
Conflicts of Interest
The authors declare no conflict of interest.
References
- Mendoza, Z.; Lorenzo-Luis, P.; Serrano-Ruiz, M.; Martín-Batista, E.; Padrón, J.M.; Scalambra, F.; Romerosa, A. Synthesis and Antiproliferative Activity of [RuCp(PPh3)2(HdmoPTA)](OSO2CF3)2 (HdmoPTA = 3,7-H-3,7-Dimethyl-1,3,7-triaza-5-phosphabicyclo[3.3.1]nonane). Inorg. Chem. 2016, 55, 7820–7822. [Google Scholar] [CrossRef] [PubMed]
- Mendoza, Z.; Lorenzo-Luis, P.; Scalambra, F.; Padrón, J.M.; Romerosa, A. Enhancement of the antiproliferative activity of [RuCp(PPh3)2(dmoPTA-1κP)]+via its coordination to one {CoCl2} unit: Synthesis, crystal structure and properties of [RuCp(PPh3)2-μ-dmoPTA-1κP:2κ2N,N′-CoCl2](OTf)·0.25H2O. Dalton Trans. 2017, 46, 8009–8012. [Google Scholar] [CrossRef] [PubMed]
- Mena-Cruz, A.; Lorenzo-Luis, P.; Romerosa, A.; Saoud, M.; Serrano-Ruiz, M. Synthesis of the Water Soluble Ligands dmPTA and dmoPTA and the Complex [RuClCp(HdmoPTA)(PPh3)](OSO2CF3) (dmPTA = N,N′-Dimethyl-1,3,5-triaza-7-phosphaadamantane, dmoPTA = 3,7-Dimethyl-1,3,7-triaza-5-phosphabicyclo[3.3.1]nonane, HdmoPTA = 3,7-H-3,7-Dimethyl-1,3,7-triaza-5-phosphabicyclo[3.3.1] nonane). Inorg. Chem. 2007, 46, 6120–6128. [Google Scholar] [PubMed]
- Mena-Cruz, A.; Lorenzo-Luis, P.; Romerosa, A. Water-Soluble 3,7-Dimethyl-1,3,7-triaza-5-phosphabicyclo [3.3.1]nonane (dmoPTA) as a Polydentate Ligand: Synthesis of [RuClCp(PPh3)-μ-dmoPTA-1κP:2κ2N,N′-Co(acac-κ2O,O′)2]·H2O. Inorg. Chem. 2008, 47, 2246–2248. [Google Scholar] [CrossRef] [PubMed]
- Mena-Cruz, A.; Lorenzo-Luis, P.; Passarely, V.; Romerosa, A.; Serrano-Ruiz, M. Comparative study of [RuClCp(HdmoPTA-κP)(PPh3)][CF3SO3] and the heterobimetallic complexes [RuClCp(PPh3)-μ-dmoPTA-1κP:2κ2N,N′-M(acac-κ2O,O′)2] (M = Co, Ni, Zn; dmoPTA = 3,7-dimethyl-1,3,7-triaza-5-phosphabicyclo [3.3.1]nonane). Dalton Trans. 2011, 40, 3237–3244. [Google Scholar] [CrossRef] [PubMed]
- Wani, W.A.; Prashar, S.; Shreaz, S.; Santiago, G.R. Nanostructured materials functionalized with metal complexes: In search of alternatives for administering anticancer metallodrugs. Coord. Chem. Rev. 2016, 312, 67–98. [Google Scholar] [CrossRef]
- Zheng, K.; Liu, F.; Li, Y.T.; Wu, Z.Y.; Yan, C.W. Synthesis and structure elucidation of new μ-oxamido-bridged dicopper(II) complexes showing in vitro anticancer activity: Evaluation of DNA/protein-binding properties by experiment and molecular docking. J. Inorg. Biochem. 2016, 156, 75–88. [Google Scholar] [CrossRef] [PubMed]
- Jadeja, R.N.; Vyas, K.M.; Upadhyay, K.K.; Devkar, R.V. In vitro apoptosis-inducing effect and gene expression profiles of mixed ligand Cu(II) complexes derived from 4-acyl pyrazolones on human lung cancer cells. RSC Adv. 2017, 7, 17107–17116. [Google Scholar] [CrossRef]
- Maharramov, A.M.; Mahmudov, K.T.; Kopylovich, M.N.; Pombeiro, A.J.L. (Eds.) Non Covalent Interactions in the Synthesis and Design of New Compounds; John Wiley & Sons, Inc.: Hoboken, NJ, USA, 2016; Volume 2, pp. 85–101. ISBN 978-1-119-10989-1. [Google Scholar]
- Meng, Y.X.; Yang, H.; Li, D.C.; Zeng, S.Y.; Chen, G.F.; Li, S.L.; Dou, J.M. Synthesis, crystal structure, DNA-binding and magnetism of copper 15-metallacrown-5 complexes based on glycinehydroxamic acid ligand. RSC Adv. 2016, 6, 47196–47202. [Google Scholar] [CrossRef]
- Tegoni, M.; Remelli, M. Metallacrowns of copper(II) and aminohydroxamates: Thermodynamics of self assembly and host–guest equilibria. Coord. Chem. Rev. 2012, 256, 289–315. [Google Scholar] [CrossRef]
- Dallavalle, F.; Remelli, M.; Sansone, F.; Bacco, D.; Tegoni, M. Thermodynamics of Self-Assembly of Copper(II) 15-Metallacrown-5 of Eu(III) or Gd(III) with (S)-α-Alaninehydroxamic Acid in Aqueous Solution. Inorg. Chem. 2010, 49, 1761–1772. [Google Scholar] [CrossRef] [PubMed]
- Schraml, J. Derivatives of hydroxamic acids. Appl. Organomet. Chem. 2000, 14, 604–610. [Google Scholar] [CrossRef]
- Ma, Z.; Chu, Y.; Fu, C.G.; Du, H.M.; Huang, X.Q.; Zhao, J.S. The Effects of Coordinated Molecules of Two Gly-Schiff Base Copper Complexes on Their Oxygen Reduction Reaction Performance. Crystals 2018, 8, 156. [Google Scholar]
- Loganathan, R.; Ganeshpandian, M.; Bhuvanesh, N.S.P.; Palaniandavar, M.; Muruganantham, A.; Ghosh, S.K.; Riyasdeen, A.; Akbarsha, M.A. DNA and protein binding, double-strand DNA cleavage and cytotoxicity of mixed ligand copper(II) complexes of the antibacterial drug nalidixic acid. J. Inorg. Biochem. 2017, 174, 1–13. [Google Scholar] [CrossRef] [PubMed]
- Krishnamoorthy, P.; Sathyadevi, P.; Butorac, R.R.; Cowley, A.H.; Bhuvanesh, N.S.P.; Dharmaraj, N. Copper(I) and nickel(II) complexes with 1:1 vs. 1:2 coordination of ferrocenyl hydrazone ligands: Do the geometry and composition of complexes affect DNA binding/cleavage, protein binding, antioxidant and cytotoxic activities? Dalton Trans. 2012, 41, 4423–4436. [Google Scholar] [CrossRef] [PubMed]
- Feng, X.X.; Liu, J.C. DNA binding and in vitro anticarcinogenic activity of a series of newfashioned Cu(II)-complexes based on tricationic metalloporphyrin salicyloylhydrazone ligands. J. Inorg. Biochem. 2018, 178, 1–8. [Google Scholar] [CrossRef] [PubMed]
- Perdisatt, L.; Moqadasi, S.; O’Neill, L.; Hessman, G.; Ghion, A.; Warraich, M.Q.M.; Casey, A.; O’Connor, C. Synthesis, characterisation and DNA intercalation studies of regioisomers of ruthenium (II) polypyridyl complexes. J. Inorg. Biochem. 2018, 182, 71–82. [Google Scholar] [CrossRef] [PubMed]
- Narváez-Pita, X.; Ortega-Zuniga, C.; Acevedo-Morantes, C.Y.; Pastrana, B.; Olivero-Verbel, J.; Maldonado-Rojas, W.; Ramírez-Vick, J.E.; Meléndez, E. Water soluble molybdenocene complexes: Synthesis, cytotoxic activity and binding studies to ubiquitin by fluorescence spectroscopy, circular dichroism and molecular modeling. J. Inorg. Biochem. 2014, 132, 77–91. [Google Scholar] [CrossRef] [PubMed]
- Wang, F.; Yin, H.D.; Yue, C.H.; Cheng, S.; Hong, M. Syntheses, structural characterization, in vitro cytotoxicities and DNA-binding properties of triphenylantimony di(N-oxy phthalimide) and di(N-oxy succinimide) complexes. J. Organomet. Chem. 2013, 738, 35–40. [Google Scholar] [CrossRef]
- Manna, A.; Chakravorti, S. Modification of a Styryl Dye Binding Mode with Calf Thymus DNA in Vesicular Medium: From Minor Groove to Intercalative. J. Phys. Chem. B 2012, 116, 5226–5233. [Google Scholar] [CrossRef] [PubMed]
- Hong, M.; Geng, H.L.; Niu, M.J.; Wang, F.; Li, D.C.; Liu, J.F.; Yin, H.D. Organotin(IV) complexes derived from Schiff base N′-[(1E)-(2-hydroxy-3-methoxyphenyl)methylidene]pyridine-4-carbohydrazone: Synthesis, in vitro cytotoxicities and DNA/BSA interaction. Eur. J. Med. Chem. 2014, 86, 550–561. [Google Scholar] [CrossRef] [PubMed]
- Ćoćić, D.; Jovanović, S.; Nišavić, M.; Baskić, D.; Todorović, D.; Popović, S.; Bugarčić, Ž.D.; Petrović, B. New dinuclear palladium(II) complexes: Studies of the nucleophilic substitution reactions, DNA/BSA interactions and cytotoxic activity. J. Inorg. Biochem. 2017, 175, 67–79. [Google Scholar] [CrossRef] [PubMed]
- Dash, S.P.; Panda, A.K.; Pasayat, S.; Majumder, S.; Biswas, A.; Kaminsky, W.; Mukhopadhyay, S.; Bhutia, S.K.; Dinda, R. Evaluation of the cell cytotoxicity and DNA/BSA binding and cleavage activity of some dioxidovanadium(V) complexes containing aroylhydrazones. J. Inorg. Biochem. 2015, 144, 1–12. [Google Scholar] [CrossRef] [PubMed]
- Silva, J.G.D.; Despaigne, A.A.R.; Louro, S.R.W.; Bandeira, C.C.; Souza-Fagundes, E.M.; Beraldo, H. Cytotoxic activity, albumin and DNA binding of new copper(II) complexes with chalcone-derived thiosemicarbazones. Eur. J. Med. Chem. 2013, 65, 415–426. [Google Scholar] [CrossRef] [PubMed]
- Hong, M.; Chang, G.L.; Li, R.; Niu, M.J. Anti-proliferative activity and DNA/BSA interactions of five mono-or di-organotin(IV) compounds derived from 2-hydroxy-N′-[(2-hydroxy-3-methoxyphenyl) methylidene]-benzohydrazone. New J. Chem. 2016, 40, 7889–7900. [Google Scholar] [CrossRef]
Figure 1.
The molecular structure of complexes 1–4 (all hydrogen atoms and free anions are omitted for clarity).
Figure 1.
The molecular structure of complexes 1–4 (all hydrogen atoms and free anions are omitted for clarity).

Figure 2.
The UV–vis absorption spectra of complex 1 (10 μM) in the absence and presence of CT-DNA. [DNA] = 0, 15, 33, 55, 100 μM. Arrows show the decrease in absorbance as the increase of DNA concentration; Inset: plot between −[DNA]/(εA − εF) versus [DNA], for obtaining the value of Kb).
Figure 2.
The UV–vis absorption spectra of complex 1 (10 μM) in the absence and presence of CT-DNA. [DNA] = 0, 15, 33, 55, 100 μM. Arrows show the decrease in absorbance as the increase of DNA concentration; Inset: plot between −[DNA]/(εA − εF) versus [DNA], for obtaining the value of Kb).

Figure 3.
The effects of complex 1 on the fluorescence spectra of an EB-DNA system. [DNA] = 25 μM, [EB] = 3 μM, from 1 to 7 [complex]/[DNA] = 0, 0.0212, 0.0424, 0.0636, 0.0848, 0.106, 0.128, respectively; inset plot of I0/I versus r (r = [complex]/[DNA]). λex = 258 nm.
Figure 3.
The effects of complex 1 on the fluorescence spectra of an EB-DNA system. [DNA] = 25 μM, [EB] = 3 μM, from 1 to 7 [complex]/[DNA] = 0, 0.0212, 0.0424, 0.0636, 0.0848, 0.106, 0.128, respectively; inset plot of I0/I versus r (r = [complex]/[DNA]). λex = 258 nm.

Figure 4.
The circular dichroism spectra of CT-DNA (100 μM) in the absence and presence of complexes 1–4 (3 μM).
Figure 4.
The circular dichroism spectra of CT-DNA (100 μM) in the absence and presence of complexes 1–4 (3 μM).

Figure 5.
The effects of complex 1 on the fluorescence spectra of BSA system. [BSA] = 0.2 μM, from 1 to 7 [complex] = 0, 1.33, 2.66, 4.00, 5.32, 6.65, 8.00 μM, respectively; inset plot of I0/I versus [Q] × 106. λex = 280 nm.
Figure 5.
The effects of complex 1 on the fluorescence spectra of BSA system. [BSA] = 0.2 μM, from 1 to 7 [complex] = 0, 1.33, 2.66, 4.00, 5.32, 6.65, 8.00 μM, respectively; inset plot of I0/I versus [Q] × 106. λex = 280 nm.

Figure 6.
The plot of log[(I0 − I)/I] versus log [Q].

Figure 7.
The docking results of BSA and complexes 1–4 are A–D.

Figure 8.
The inhibitory effects of complexes 1–4 against four cancer cell lines at the concentration of 50 μM.
Figure 8.
The inhibitory effects of complexes 1–4 against four cancer cell lines at the concentration of 50 μM.

Figure 9.
The inhibition effects of complex 1 on the three cell lines at different concentration (6.25, 12.5, 25, and 50 μM).
Figure 9.
The inhibition effects of complex 1 on the three cell lines at different concentration (6.25, 12.5, 25, and 50 μM).


Table 1.
The comparison of the interaction study results between complexes 1–4 on CT-DNA and protein.
Table 1.
The comparison of the interaction study results between complexes 1–4 on CT-DNA and protein.
| Complex | DNA Binding | Protein Binding | ||||
|---|---|---|---|---|---|---|
| Ksq | Kb (M−1) | Ksv (M−1) | Kb (M−1) | n | ΔG (J/mol) | |
| 1 | 2.36 | 1.04 × 10⁴ | 1.09 × 10⁵ | 9.46 × 10⁴ | 0.9965 | −3.64 × 10⁴ |
| 2 | 3.18 | 1.18 × 10⁴ | 1.20 × 10⁵ | 9.05 × 10⁴ | 0.9750 | −3.80 × 10⁴ |
| 3 | 3.20 | 1.01 × 10⁴ | 1.04 × 10⁵ | 2.98 × 10⁴ | 0.8977 | −3.88 × 10⁴ |
| 4 | 4.58 | 1.69 × 10⁴ | 2.11 × 10⁵ | 1.49 × 10⁵ | 0.9740 | −4.00 × 10⁴ |
Table 2.
The IC50 values of the complexes on cancer cells.
| Complex | IC50 (μM) | |||
|---|---|---|---|---|
| A549 | HCT-116 | HL-60 | HeLa | |
| 1 | 9.50 | >50 | 5.46 | 4.35 |
| 2 | 2.23 | 2.23 | 1.62 | 1.29 |
| 3 | 21.77 | >50 | 14.52 | >50 |
| 4 | 0.81 | 0.92 | 0.54 | 0.61 |
| Cis-platin | 7.4 | 8.3 | 4.5 | 5.6 |
© 2018 by the authors. Licensee MDPI, Basel, Switzerland. This article is an open access article distributed under the terms and conditions of the Creative Commons Attribution (CC BY) license (http://creativecommons.org/licenses/by/4.0/).
Share and Cite
MDPI and ACS Style
Zhang, J.; Yang, H.; Li, D.; Dou, J. Copper(II) Complexes Based on Aminohydroxamic Acids: Synthesis, Structures, In Vitro Cytotoxicities and DNA/BSA Interactions. Crystals 2018, 8, 201. https://0-doi-org.brum.beds.ac.uk/10.3390/cryst8050201
AMA Style
Zhang J, Yang H, Li D, Dou J. Copper(II) Complexes Based on Aminohydroxamic Acids: Synthesis, Structures, In Vitro Cytotoxicities and DNA/BSA Interactions. Crystals. 2018; 8(5):201. https://0-doi-org.brum.beds.ac.uk/10.3390/cryst8050201
Chicago/Turabian StyleZhang, Jia, Hua Yang, Dacheng Li, and Jianmin Dou. 2018. "Copper(II) Complexes Based on Aminohydroxamic Acids: Synthesis, Structures, In Vitro Cytotoxicities and DNA/BSA Interactions" Crystals 8, no. 5: 201. https://0-doi-org.brum.beds.ac.uk/10.3390/cryst8050201
Note that from the first issue of 2016, this journal uses article numbers instead of page numbers. See further details here.