1. Introduction
Transmittance-control devices allow users to control the intensity of transmitted light through the absorption of incident light. Electrochromic devices (ECD) [
1,
2,
3,
4], suspended particle devices (SPD) [
5,
6], and liquid crystal (LC) devices [
7,
8,
9,
10,
11,
12,
13] have been studied to control the transmittance of eyewear, smart windows, and automotive applications. ECD and SPD have been widely used because of their low transmittance in the opaque state. Although they have been studied extensively, they are not able to demonstrate color neutrality, adequate durability, a low manufacturing cost, and a fast switching speed at the same time, which limits their practical application. In particular, they may be inadequate for applications requiring a fast switching speed for safety because of their long response times, which range from several minutes to several hours. LC devices can be used for such applications because they have a fast response time of several tens of milliseconds.
A guest-host LC (GHLC) cell consists of host LCs and guest dichroic dyes, which are convenient for the switching of dichroic dyes [
14,
15,
16,
17,
18,
19]. Dichroic dyes can be easily aligned along the alignment direction of the LC molecules [
20,
21]. Owing to their dichroism, dye molecules strongly (weakly) absorb the incident light polarized parallel (perpendicular) to their absorption axis. The transmittance of a GHLC cell is dependent on the alignment of the dye molecules, the absorption coefficient of the dye, cell gap, and dye concentration. By increasing the cell gap or dye concentration, the transmittance in the opaque state can be lowered, but that in the transparent state is also lowered. Moreover, the response time and the driving voltage of a GHLC cell are dependent on the cell gap and dye concentration, and the solubility of the dye molecule can be an issue [
22,
23,
24]. Therefore, it is necessary to find the condition that gives the maximum transmittance difference between the transparent and opaque states while satisfying the desired performance, such as the response time and driving voltage, and without the solubility issue.
In this study, we present a systematic approach to finding the condition for the desired transmittance difference in a GHLC device. We calculated the transmittance difference as we varied the cell gap and dye concentration. The transmittance is dependent on the alignment of LC and dye molecules in a GHLC cell. Thus far, the trial-and-error method has been used to find the condition for the desired GHLC cell. In the proposed process, however, we can determine the conditions of the cell gap and dye concentration with the desired performance, such as the transmittance in the transparent state, transmittance difference, driving voltage, and response time. Therefore, by using the proposed process, we can systematically obtain the condition for the desired GHLC cell before cell fabrication. We expect that the proposed approach will offer an effective method for the fabrication of a GHLC cell that can be used to control transmittance.
2. Experimental and Calculation Conditions
The LC parameters used for the experiments and calculations are as follows: the birefringence Δn = 0.1169; the dielectric anisotropy Δε = 7; the elastic constants K11 = 13.1 pN, K22 = 5.95 pN, and K33 = 13.6 pN; and the rotational viscosity γ1 = 61 mPa·s. To achieve the absorption of the incident light, the LCs were mixed with a black dichroic dye X12 (BASF, Ludwigshafen, Germany). The measured absorption coefficients α‖ and α⊥ were 27.28 μm−1 and 3.560 μm−1 at 550 nm, respectively, and the dichroic ratio was 7.663 at 550 nm. α‖ and α⊥ represent the absorption coefficients of the dye for polarization parallel and perpendicular to the absorption axis of the dye molecules, respectively. The absorption coefficient of the dye was measured at room temperature with a GHLC cell with the cell gap of 10 μm and the dye concentration of 1 wt %. The saturation concentration is the maximum concentration of the solution (dye) that can be dissolved in a solvent (LC). The saturation concentration of the dye X12 in the used LC was about 3.5 wt %.
To fabricate electrically controlled birefringence (ECB) and cholesteric LC (ChLC) cells, we used the homogeneous alignment layer (PIA-X610-33C, JNC Corporation, Tokyo, Japan), and the substrates were baked for 1 h at 220 °C. For the ChLC cell, the chiral dopant (S811, Merck, Darmstadt, Germany) were mixed additionally. To prevent waveguiding and Bragg reflection in the visible region, the pitch was set to 1.3 μm and the amount of chiral dopant was chosen to form a pitch of 1.3 μm [
25].
3. The Transmittance of Guest-Host Liquid Crystal Cells
The transmittance of a homogeneously-aligned LC cell for polarization parallel and perpendicular to the absorption axis of the dye molecules can be described as
where
T‖ and
T⊥ are the transmittances of a GHLC cell for polarization parallel and perpendicular to the absorption axis of the dye molecules, respectively.
T0 is the transmittance of a homogeneously aligned LC cell without a dye. c is the dye concentration and d is the cell gap [
26,
27].
In the homeotropic state, the dye molecules are aligned perpendicular to the substrates so that this state is transparent. In the twisted state, the dye molecules absorb incident light regardless of the polarization direction. The transmittance in the homeotropic, homogeneous, and twisted states can be expressed as
where
Thomeo,
Thomo, and
Ttwist represent the transmittances of the homeotropic, homogeneous, and twisted states, respectively.
We first calculated the transmittance of each state using Equation (2) as we varied the cell gap and dye concentration. To compare the measured results with the calculated ones, we fabricated ECB and ChLC cells. To determine the effect of the dye concentration, the dye concentration was changed from 0 to 6 wt % at a fixed cell gap of 10 μm. To confirm the effect of the cell gap, the cell gap was changed from 0.5 to 30 μm at a fixed dye concentration of 1 wt %. The transmittance of the LC cell in the homeotropic, homogeneous, and twisted states decreases as the dye concentration or cell gap is increased, as shown in
Figure 1. The twisted state shows a lower transmittance than the homogeneous state because twisted LC and dye molecules absorb the incident light regardless of the polarization direction. The measured transmittance values tend to match the calculated values, which means that the calculated results are reliable. However, the measured results are different from the calculated ones when the dye concentration is higher than 4 wt %, as shown in
Figure 1a. This is due to the saturation of the dye molecules, as all of them do not dissolve when the concentration is higher than the saturation concentration.
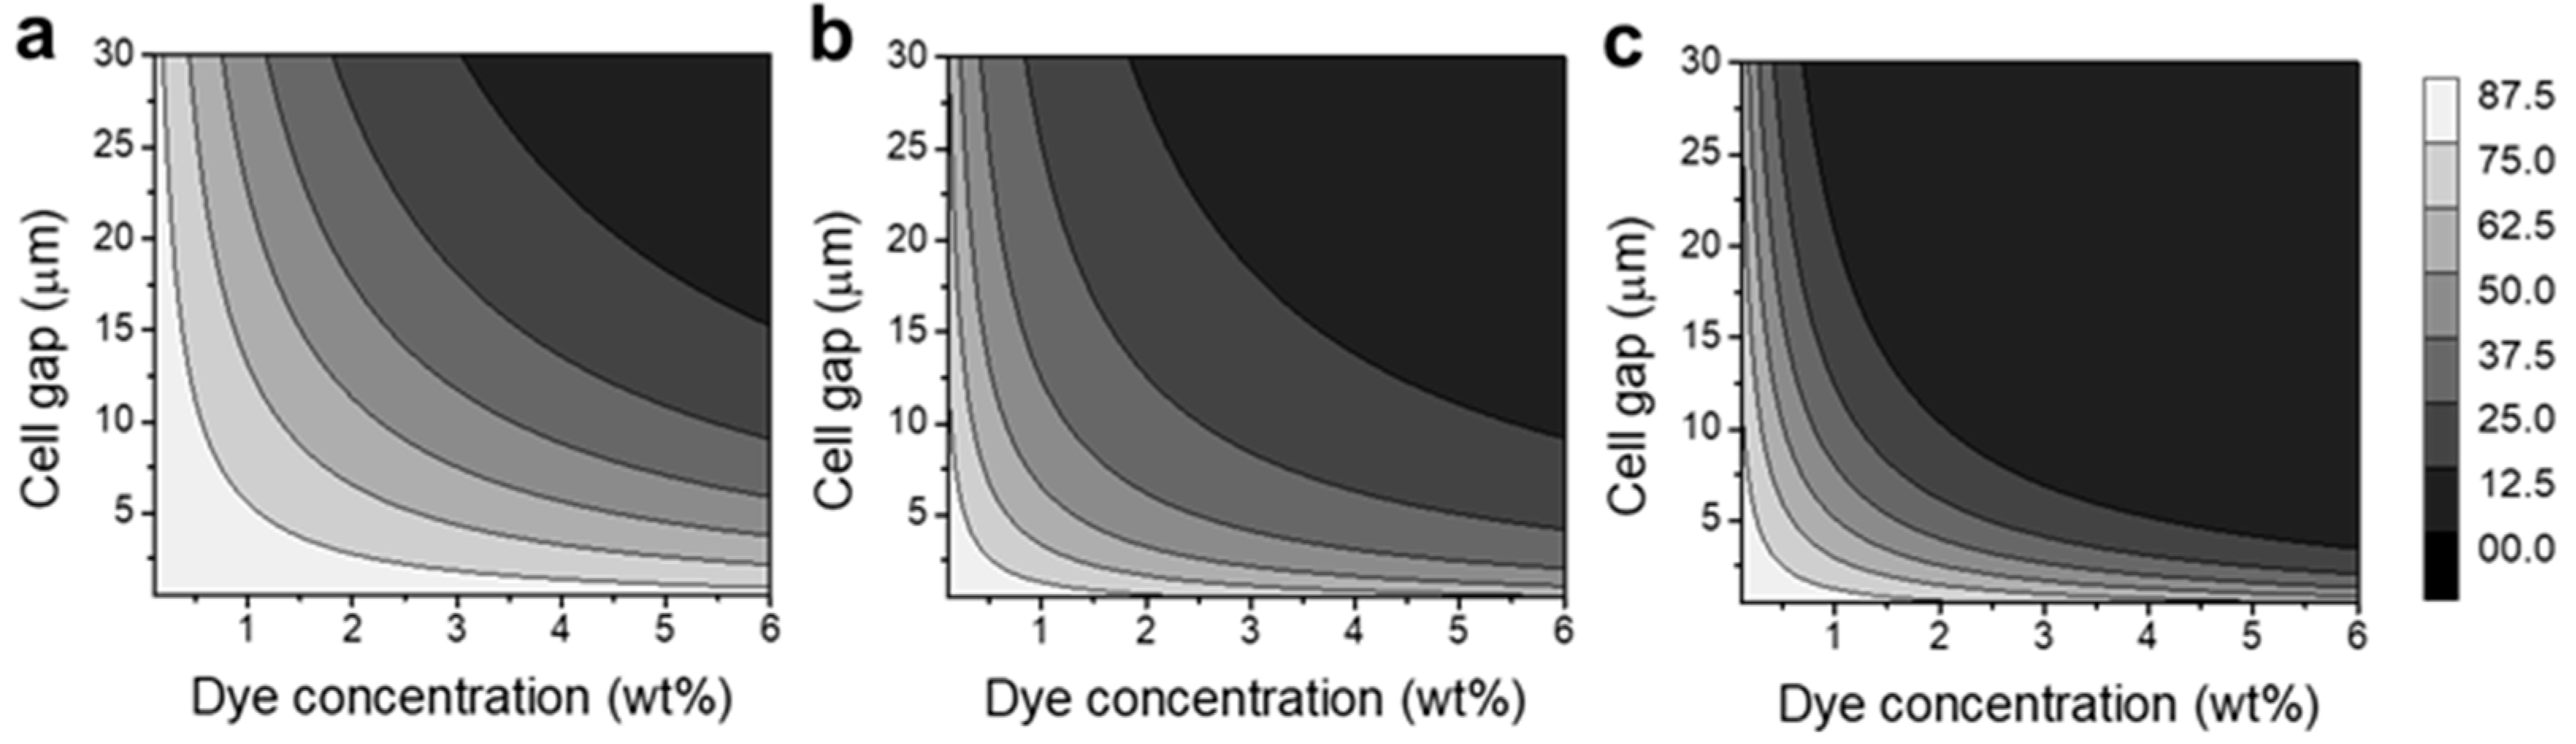
We plotted the constant-transmittance contour maps of an LC cell in each state on the parameter space of the cell gap and dye concentration.
Figure 2 shows the constant-transmittance contour maps of LC cells in the homeotropic, homogeneous, and twisted states. For applications requiring a high transmittance in the transparent state, a low dye concentration and thin cell gap should be selected within the desired region. For applications requiring a low transmittance in the opaque state, a high dye concentration and thick cell gap should be selected within the desired region. These results can be useful for designing a GHLC cell when there is a requirement for the minimum allowable transmittance of the transparent state or the maximum allowable transmittance of the opaque state.
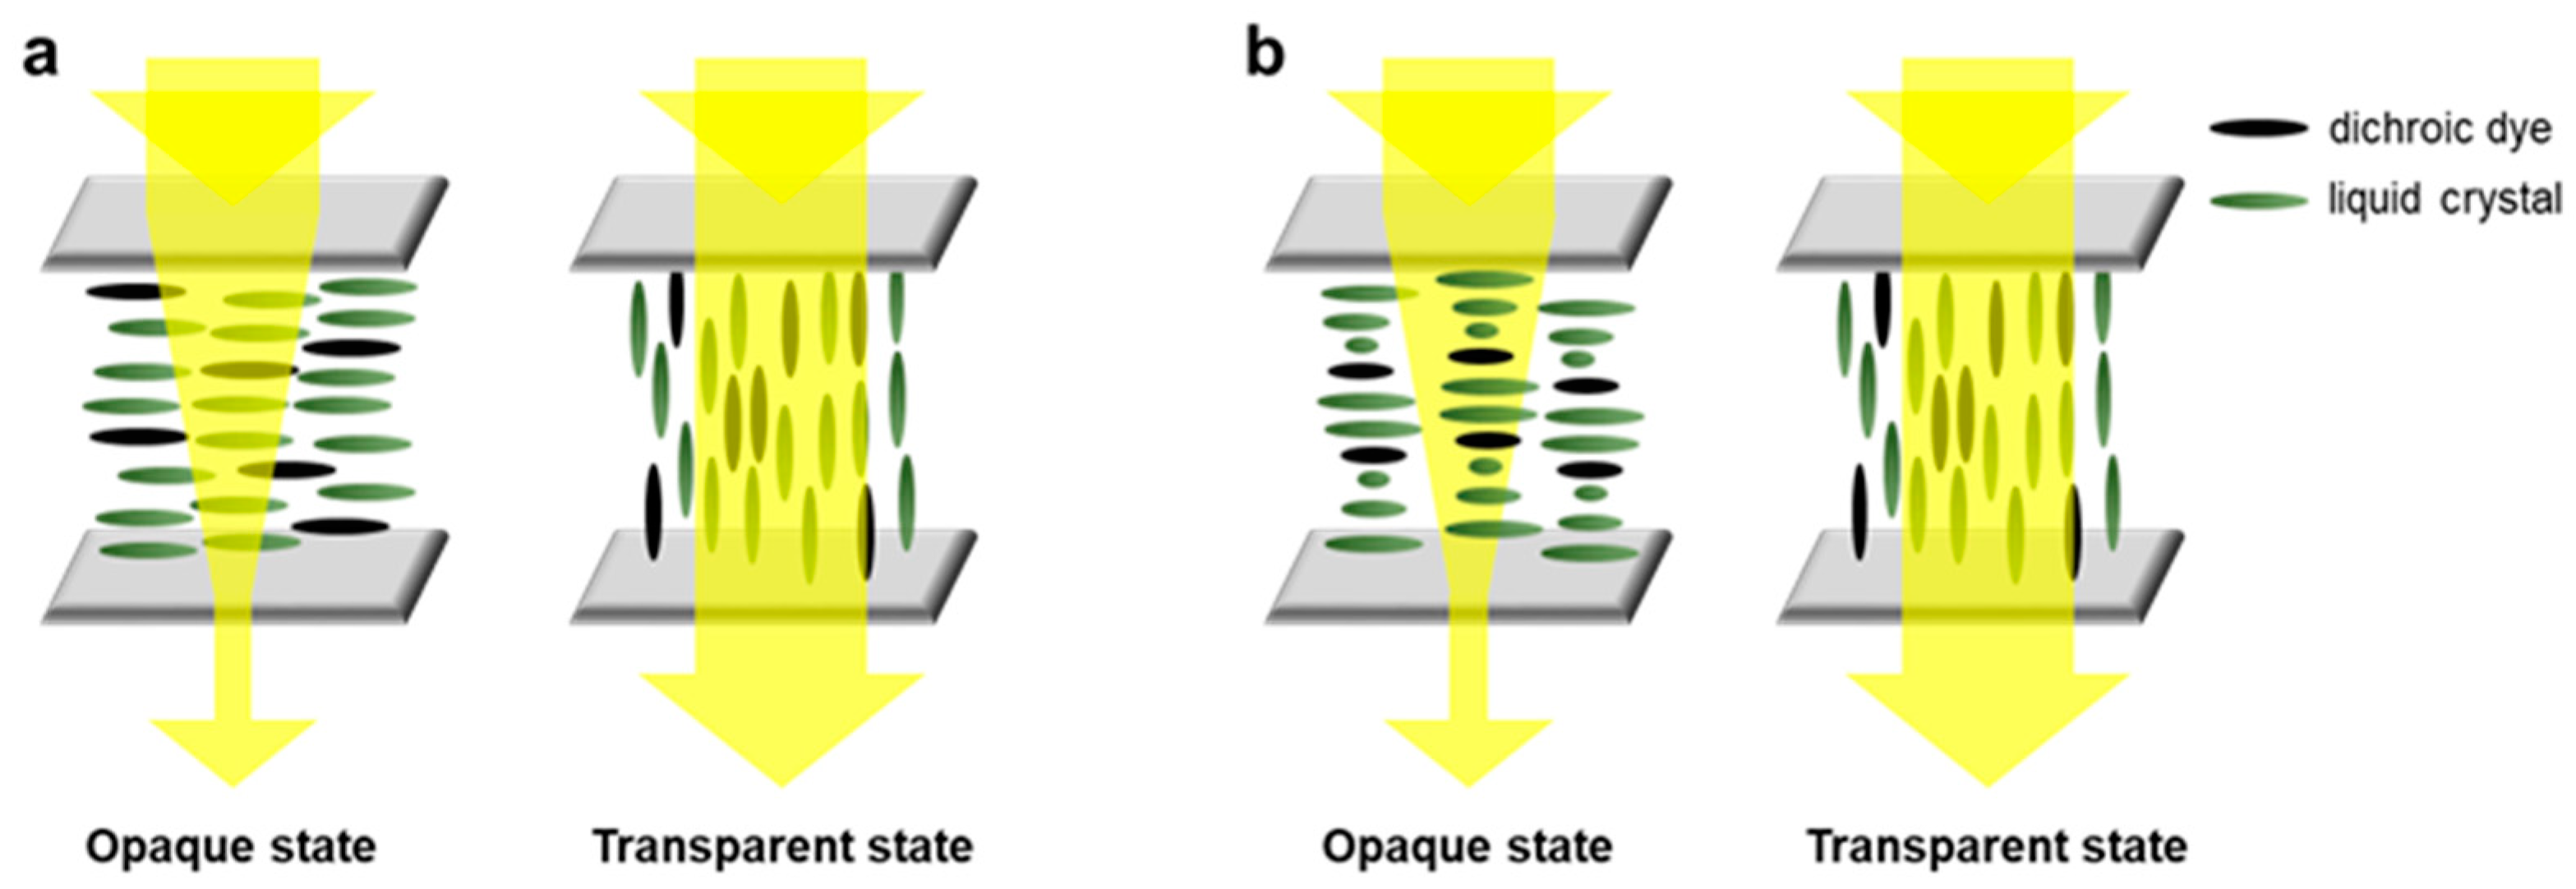
An ECB cell uses the homeotropic and homogeneous states as the transparent and opaque states, respectively, as shown in
Figure 3a. In a ChLC cell, the homeotropic state is used as a transparent state, while the twisted state is used as an opaque state, as shown in
Figure 3b. The transmittance difference of ECB and ChLC cells can be expressed as follows by using Equation (2):
where
and
represent the transmittance differences of ECB and ChLC cells, respectively.
represents the difference between the absorption coefficients in the directions parallel and perpendicular to the absorption axis of dye molecules, that is,
.
Using Equation (3), we calculated the transmittance difference between the transparent and opaque states as a function of dye concentration and cell gap. The maximum transmittance difference of a ChLC cell is higher than that of an ECB cell because of its lower transmittance in an opaque state, as shown in
Figure 4. The condition for achieving the maximum transmittance difference is dependent on the LC mode. The dye concentrations (cell gap) for the ECB and ChLC cells were around 1.2 wt % and 1.7 wt % (12 μm and 17 μm), respectively. For a dye concentration of over 4 wt %, the measured transmittance difference was higher than the calculated value because the dye molecules were not dissolved completely in the LC, as shown in
Figure 4a. These insoluble dye molecules may crystallize in the cell and can cause stability issues [
24].
We plotted the constant transmittance-difference contour maps of each LC mode on the parameter space of the cell gap and dye concentration, as shown in
Figure 5. Because the transmittance difference increases and then decreases as the cell gap or dye concentration increases, we can find the region in which the transmittance difference of a GHLC cell is higher than the desired value. An ECB cell cannot provide a transmittance difference higher than 30%, while a ChLC cell can provide a transmittance difference of up to 42%. Although our results show that a ChLC cell has a higher transmittance difference than an ECB cell, we should note that the choice of the LC mode depends on the application. A ChLC cell can have drawbacks such as a complicated drive scheme, high driving voltage, and slow response [
25,
28,
29]. Moreover, when designing a ChLC cell, the optimization of dye concentration is required because a ChLC cell fabricated with a commercial black dye has a color issue [
30]. Therefore, we should carefully choose the mode for an application to achieve the desired performance.
4. Design and Fabrication Process
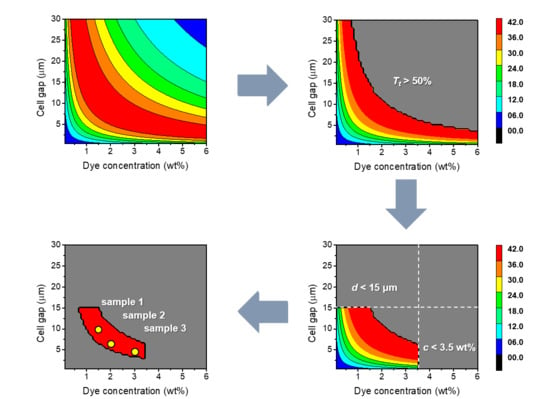
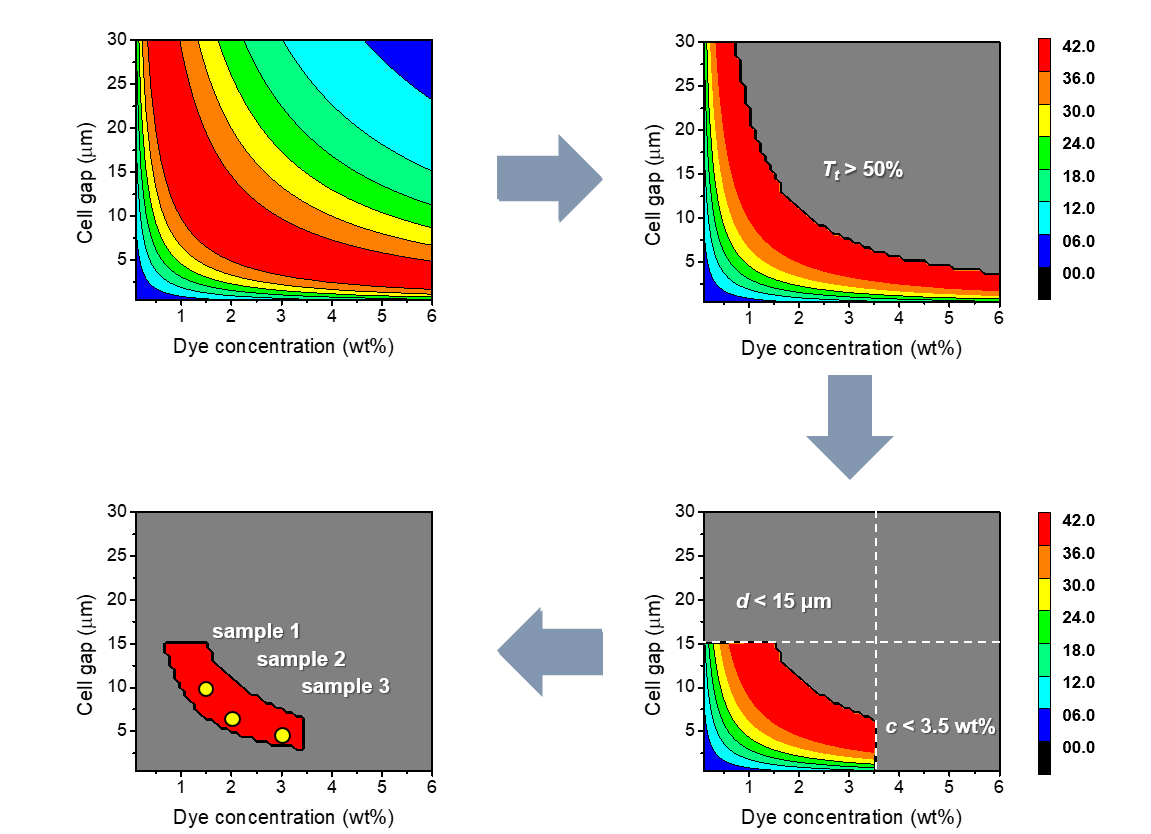
In this chapter, we introduce how to design and fabricate a GHLC cell. The design and fabrication process is as follows: i) Choose the appropriate LC mode considering the application; ii) exclude the conditions that cannot satisfy the minimum transmittance in the transparent state; iii) determine the maximum cell gap considering the response time or driving voltage and the maximum dye concentration, considering the saturation concentration of the dye to be mixed with the used LCs; and iv) select the condition for the maximum transmittance difference in a constant transmittance-difference contour map.
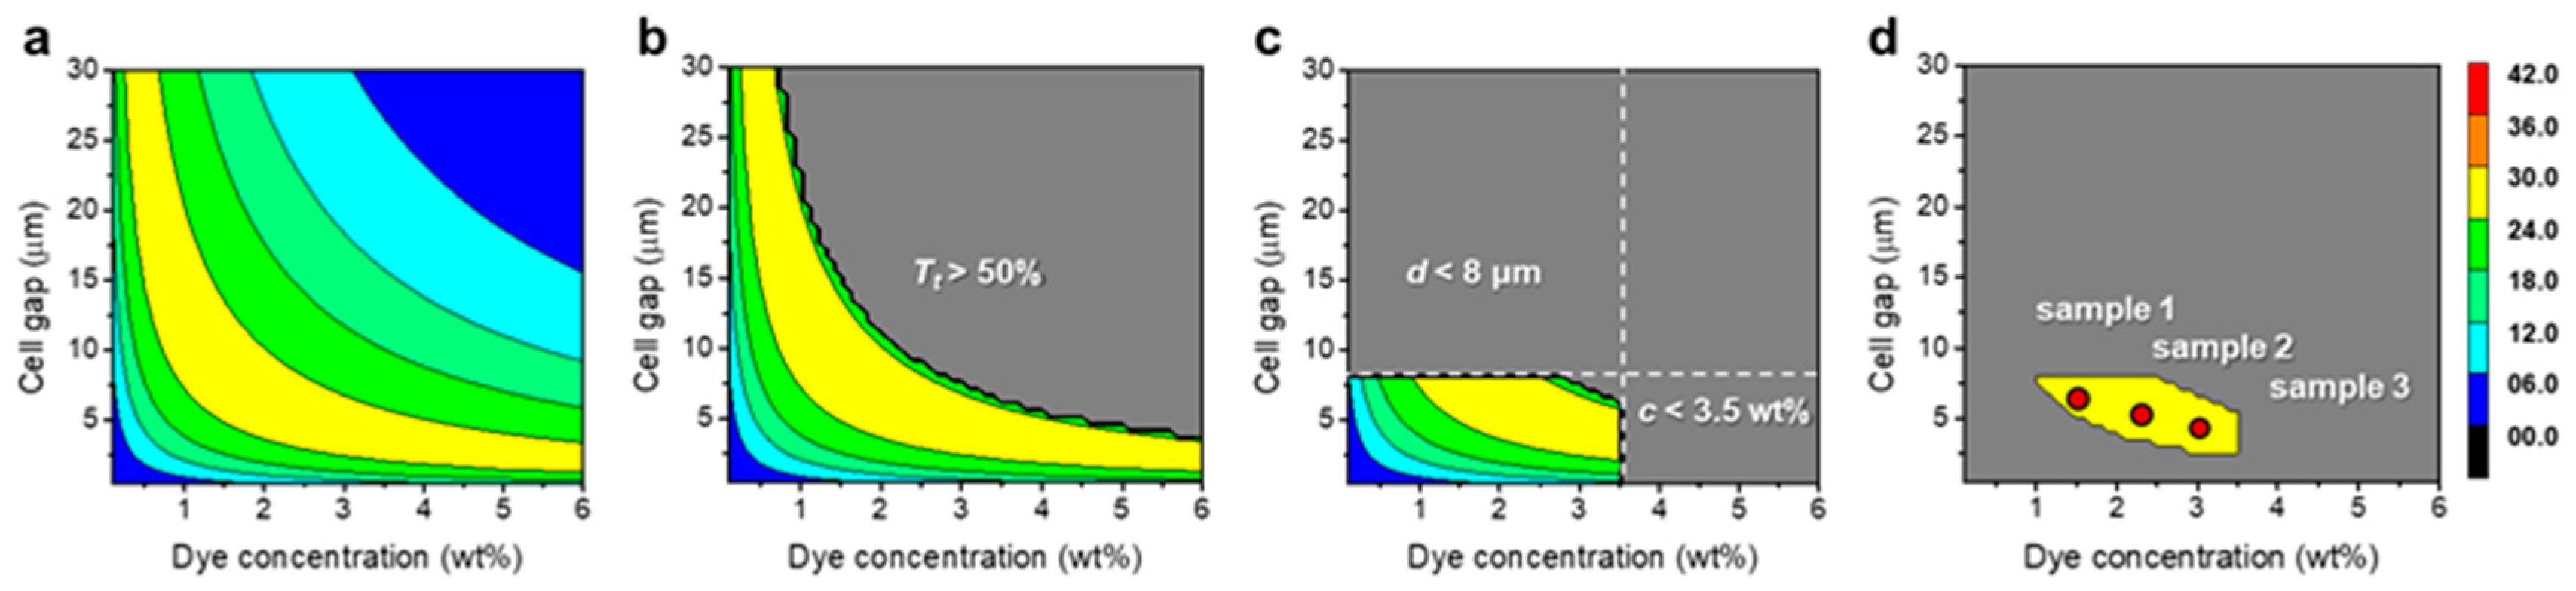
For a better understanding of the above process, we designed and fabricated GHLC cells with a decay time of less than 30 ms and a transmittance in the transparent state of higher than 50%. For short response times, we chose the ECB mode for a GHLC cell. We plotted a constant transmittance-difference contour map of an ECB cell for the design process, as shown in
Figure 6a. Next, we excluded the condition that the transmittance in the transparent state is lower than 50% in the contour map, as shown in
Figure 6b. We excluded the condition that the dye concentration is higher than 3.5 wt % and the cell gap is higher than 8 μm because the saturation concentration of the dye is 3.5 wt % and the cell gap should be lower than 8 μm for a decay time [
τd = (
γ1 /
K11)·(
d/
π)
2] shorter than 30 ms, as shown in
Figure 6c [
31]. Finally, we chose one of the conditions in the yellow-colored region of
Figure 6d, where the transmittance difference is higher than 24%. To ensure that the fabricated ECB cells can provide the desired performance, three samples were fabricated under the different conditions within the yellow-colored region of
Figure 6d. The dye concentration and cell gap of each sample were
c = 1.5 wt % and
d = 6.5 μm for sample 1;
c = 2.25 wt % and
d = 5.5 μm for sample 2; and
c = 3 wt % and
d = 4.5 μm for sample 3.
The transmittance difference (Δ
T), transmittance in the transparent state (
Tt), decay time (
τd), rise time (
τr), and driving voltage (
Vd) of the fabricated ECB cells are summarized in
Table 1. For all three samples, the results satisfied the desired performance. The transmittance difference of all the samples was higher than 24%, the transmittance in a transparent state was higher than 50%, and the decay time was less than 30 ms. The response time increased as the cell gap was increased. However, there was no dependence of the response time on the dye concentration.
As another example, we also designed and fabricated a GHLC cell with a driving voltage lower than 40 V and a transmittance in the transparent state higher than 50%. For a high transmittance difference, we chose a ChLC cell that had the lowest transmittance in the opaque state. We plotted a constant transmittance-difference contour map of a ChLC cell for the design process, as shown in
Figure 7a. We then excluded the condition in which the transmittance in the transparent state is less than 50% in the contour map, as shown in
Figure 7b. We excluded the condition where the dye concentration is higher than 3.5 wt % and the cell gap is higher than 15 μm because the saturation concentration of the dye is 3.5 wt %, yet the cell gap should be less than 15 μm for a driving voltage lower than 40 V [
28,
29], as shown in
Figure 7c. Finally, we chose one of the conditions in the red-colored region of
Figure 7d, where the transmittance difference is higher than 36%. To make sure that a GHLC cell with the desired performance could be fabricated, three samples were fabricated under the different conditions within the red-colored region of
Figure 7d. The dye concentration and cell gap of each sample were as follows:
c = 1.5 wt % and
d = 10 μm for sample 1;
c = 2 wt % and
d = 6.5 μm for sample 2; and
c = 3 wt % and
d = 4.5 μm for sample 3.
The transmittance difference(Δ
T), transmittance in the transparent state (
Tt), decay time (
τd), rise time (
τr), and driving voltage (
Vd) of the fabricated ChLC cells are summarized in
Table 2. For all the three samples, the measured results satisfied the desired performance. The transmittance difference was higher than 36%, the transmittance in the transparent state was higher than more than 50%, and the driving voltage was lower than 40 V. The decay times of the ChLC cells are too slow to be used for applications requiring a fast response time.
We confirmed that all the fabricated GHLC cells satisfy the desired performance, such as fast response and high transmittance difference. We could systematically design a GHLC cell with the desired parameters through the proposed process.
5. Conclusions
In this study, we demonstrated a systematic approach for designing GHLC cells with the desired performance, such as a specific transmittance difference, transmittance in the transparent state, driving voltage, and response time. Once the parameters of LCs and dyes are given, the design of a GHLC cell with the desired performance can be easily achieved by confining regions in a constant transmittance-difference contour map. For the confirmation of the proposed approach, we fabricated GHLC cells with a specific condition, and we found that the experimental results satisfied the desired performance.

 ,
, 


