Elucidation of the Crystal Structures and Dehydration Behaviors of Ondansetron Salts


1
Department of Chemistry and Materials Science, Tokyo Institute of Technology, Ookayama 2-12-1, Meguro-ku, Tokyo 152-8551, Japan
2
Analytical Research Laboratories, Astellas Pharma Incorporation, 180, Ozumi, Yaizu-shi, Shizuoka 425-0072, Japan
*
Author to whom correspondence should be addressed.
Crystals 2019, 9(3), 180; https://0-doi-org.brum.beds.ac.uk/10.3390/cryst9030180
Submission received: 7 March 2019
/
Revised: 24 March 2019
/
Accepted: 25 March 2019
/
Published: 26 March 2019
(This article belongs to the Special Issue Pharmaceutical Crystals)
Abstract
:In drug development, it is extremely important to evaluate the solubility and stability of solid states and to immediately determine the potential for development. Salt screening is a standard and useful method for obtaining drug candidates with good solid state properties. Ondansetron is marketed as a hydrochloride dihydrate, and its dehydration behavior was previously reported to transition to an anhydrate via a hemihydrate as an intermediate by heating. Here, we synthesized ondansetron hydrobromide and hydroiodide and examined their dehydration behaviors. Single-crystal structure analysis confirmed that like ondansetron hydrochloride, ondansetron hydrobromide formed a dihydrate. Moreover, the crystal lattice parameters and hydrogen bonding networks were similar and isomorphic. While single-crystal structure analysis showed that ondansetron hydroiodide also formed a dihydrate, the crystal lattice parameters and hydrogen bonding networks were different to those of ondansetron hydrobromide and hydrochloride. Additionally, the dehydration behavior of ondansetron hydrobromide differed from that of the hydrochloride, with no hemihydrate intermediate forming from the hydrobromide, despite similar anhydrate structures. Given that it is difficult to predict how a crystal structure will form and the resulting physical properties, a large amount of data is needed for the rational design of salt optimization.
1. Introduction
In drug discovery, salt screening is a general tool used to develop a solid form of a compound with improved physicochemical properties [1,2]. The counter acids or bases used in salt selection can be selected if the pka values are used as a reference [3,4]. Salt formation is expected to improve the compound’s solubility, an important physicochemical property in drug development [5,6].
Salt formation is also expected to improve physicochemical properties other than solubility. For example, salt formation reportedly improved the hygroscopicity of the ethambutol dihydrochloride salt [7]. The improved salt was an oxalate. Penetration of water was inhibited because the packing efficiency of the oxalate crystals was improved compared to that in the dihydrochloride.
Salt optimization is selecting the counter ion, as the salt form has the most proper physicochemical properties as an active pharmaceutical ingredient (API). Although salt optimization is widely known in the pharmaceuticals field, few studies have reported the rational design for such optimization. Instead of a rational design, many screening methods have been developed [8,9]. Salt screening generally requires large amounts of drugs and time. Given that the amount of drugs and the time for research are limited in the early stages of drug discovery, new technology is needed to solve these problems. One answer may be to use rational design approaches for salt formation.
Rational design approaches require a working knowledge of the crystal structure of salts and aim to improve understanding of the relationship between the crystal structure and physicochemical properties. The final purpose of rational design is to control the physicochemical properties of salts by changing the salt-forming compounds. This requires predicting how changing the salt-forming compounds will affect the crystal structure and how the crystal structure represents the physicochemical properties.
Changing a solid state can lead to expected or unexpected changes in physiochemical properties. Unexpected changes to a solid state are sometimes observed in the manufacturing process or under various storage conditions [10,11]. For example, the hydrate form of a compound is sometimes observed unexpectedly as physical changes in hydrates occur due to changes in humidity or temperature [12,13]. Therefore, it is necessary to predict the occurrence of hydration or dehydration and how they change the physicochemical properties of a compound.
Understanding the mechanism of dehydration will enable the consideration of physicochemical properties before and after dehydration. A number of reports have examined the mechanism of dehydration of hydrates from crystal structures [14,15,16], including our previous reports [17,18]. For example, the mechanism of two-step dehydration of the dihydrate phase of lisinopril was clearly established from the crystal structures [19].
In this paper, we used ondansetron as a model compound. Ondansetron, also known as Zofran, was launched in the USA in 1991. Ondansetron is a competitive serotonin type 3 receptor antagonist and is effective for the treatment of nausea and vomiting caused by cytotoxic chemotherapeutic drugs [20]. The crystal structure of ondansetron hydrochloride dihydrate has been reported (CSD refcode: YILGAB) [21]. A previous study reported the dehydration reaction of ondansetron hydrochloride dihydrate [22], showing that it transformed into a hemihydrate intermediate prior to an anhydrate.
In the drug discovery, salt optimization will be conducted, and it would be interesting to evaluate whether the rare dehydration reaction of ondansetron hydrochloride dihydrate is observed in the formation of other salts. Here, we report the synthesis of ondansetron hydrobromide and ondansetron hydroiodide and evaluate their crystal structures and dehydration reactions.
2. Materials and Methods
2.1. Materials
Ondansetron hydrochloride dihydrate was purchased from Sigma Aldrich (St. Louis, MO, USA). Solvents for the synthesis reactions and the hydrobromide solution were purchased from Kanto Kagaku (Tokyo, Japan). Hydroiodide solution was purchased from Wako Junyaku (Tokyo, Japan).
Characterization was performed using samples pulverized with an agate mortar.
2.2. Synthesis
Ondansetron HBr salt was synthesized by dissolving ondansetron HCl dihydrate in methanol containing an equal molar quantity of sodium hydroxide. Subsequently, an equal molar quantity of hydrobromide in methanol solution was added to the methanol solution containing ondansetron and the solvent was removed under dry N2 gas. After drying, acetone/water (9:1) was added and the sample was stirred overnight. The resulting powder was filtered and recrystallized using ethanol/H2O to obtain the bulk sample. In addition, single crystals were also obtained under a different recrystallization condition. Ondansetron HBr anhydrate B was obtained from a slurry suspension using ethyl acetate or acetonitrile instead of acetone/water.
Ondansetron HI salt was synthesized by dissolving ondansetron HCl dihydrate in methanol containing an equal molar quantity of sodium hydroxide. Subsequently, an equal molar quantity of hydroiodide in methanol solution was added to the methanol solution containing ondansetron and the solvent was removed under dry N2 gas. 2-propanol/water (1:1) was added and bulk samples were recrystallized. In addition, single crystals were also obtained by recrystallization in 2-propanol/water (1:1). In addition, ondansetron HI anhydrate B was obtained using ethanol/water (9:1) instead of 2-propanol/water (1:1).
Samples were heated in a Fine Oven DF42 (Yamato Science, Tokyo, Japan).
2.3. Single Crystal Structure Analysis
All diffraction experiments were performed in a Rigaku XtaLAB P200 diffractometer using multi-layer mirror monochromated CuKα (λ = 1.54184 Å) irradiation. The data were collected from a crystal at 93 K under a nitrogen stream. The initial structure was determined by the direct method using SHELXT [23], and intensity data were corrected using the Lorentz factor, polarization factor, and absorption correction. Non-hydrogen atoms were refined anisotropically. Hydrogen atoms, except for those of H2O, were generated geometrically and refined using the riding model. Hydrogen atoms of H2O were located using difference Fourier synthesis, and refined isotropically. The obtained structure was refined using full-matrix least-squares refinement (w = 1/[σ2(Fo2) + (0.0999·P)2 + 0.0818·P], P = (Max(Fo2,0) + 2Fc2)/3)) to minimize Σw(Fo2-Fc2)2.
The void volume was calculated with Mercury 3.10 (The Cambridge Crystallographic Data Centre (CCDC), Cambridge, United Kingdom) using default parameters.
2.4. Structure Determination from Powder Diffraction Data (SDPD)
The crystal structures of both the hemihydrate and anhydrate were determined from powder X-ray diffraction (PXRD) data measured using SPring-8 BL19B2. Crystal structure analysis was performed using the Powder Solve module of Materials Studio (BIOVIA, Tokyo, Japan). After selecting the peaks set, indexing was conducted in the X-CELL module to introduce the unit cell and appropriate space group [24]. The unit cell was refined using Pawley refinement and optimized.
The initial chemical structures of ondansetron and the water molecules were introduced using the Forcite module with COMPASS II as the force field [25]. The initial crystal structure was introduced using the Powder Solve module and the simulated-annealing approach, and optimized by Rietveld refinement [26]. Pareto optimization, a Rietveld refinement method that considers the energy of the structure calculated by a force field [27], was performed in the final optimization step.
2.5. Thermal Analysis: Differential Scanning Calorimetry (DSC)
Thermal analysis was performed using a TA Q2000 DSC instrument, which included a refrigerated cooling system (TA Instruments, New Castle, DE, USA). Temperature calibrations were performed using the indium metal standard supplied with the instrument. Samples were weighed (about 3 mg) in aluminum pans and analyzed from 25 °C to 300 °C at a heating rate of 10 °C/min using a similar empty pan as a reference. An inert atmosphere was maintained in the calorimeter by purging with nitrogen gas at a flow rate of 50 mL/min.
2.6. Thermal Analysis: Thermogravimetric Analysis (TGA)
Thermogravimetric analysis (TGA) was performed using a TA Q500 TGA instrument (TA Instruments). Approximately 4 mg of sample was loaded into a platinum pan and heated to 300 °C at a rate of 10 °C/min. Measurements were conducted under a nitrogen purge at a flow rate of 100 mL/min. Temperature calibration was performed using standard nickel.
2.7. Powder X-ray Diffraction
PXRD measurements were performed on TTR II (Rigaku, Tokyo, Japan) with Cu Kα radiation at 1.54184 Å, a voltage of 50 kV and current of 300 mA. Data were collected at a scan rate of 4°/min over a 2θ range from 2.5° to 40°. In variable temperature PXRD measurements (VT-XRD), simultaneous measurement of powder X-ray diffraction data and differential scanning calorimetry (XRD-DSC) was performed on a SmartLab system (Rigaku, Tokyo, Japan) using Cu Kα radiation at 1.54184 Å, a voltage of 45 kV and current of 200 mA, with a DSC attachment and a D/Tex Ultra detector. Samples were weighed (1.5–2.5 mg) in aluminum pans and analyzed at a heating rate of 2 °C/min using a similar but empty pan as a reference.
For the synchrotron X-ray measurements using SPring-8, the powder samples were enclosed in a 0.3-mm Lindemann glass capillary. The X-ray powder diffraction data were collected using SPring-8 BL19B2, which was equipped with a high-resolution type Debye–Scherrer camera and a curved imaging-plate detector [28]. The wavelength was set at 1.0000 Å. For the variable temperature measurements, it took one minute to set each temperature. Each temperature was then maintained for 4 min to ensure that equilibrium was reached before the measurements were taken. Data were collected for 5 min. During data collection, the sample was maintained at the set temperature and rotated at 1 r/min to reduce potential preferential orientation effects.
2.8. Water Vapor Sorption and Desorption Studies
Dynamic vapor sorption experiments were performed using VTI SGA 100 (VTI Corporation, Hialeah, FL, USA). Samples (about 10 mg) were studied over a selected humidity range (absorption process: from 5% relative humidity (RH) to 95% RH; desorption process: from 95% RH to 5% RH) at 25 °C. For each humidity step, the equilibration was set to dm/dt 0.03%/min on a 5-min time frame (maximum hold time 180 min).
3. Results
3.1. Elucidation of the Crystal Structure of Ondansetron Salts
Crystal graphic parameters of the ondansetron HCl salt, HBr salt and HI salt are summarized in Table 1. A list of interactions observed in each crystal are shown in the Supporting Information (Table S1).
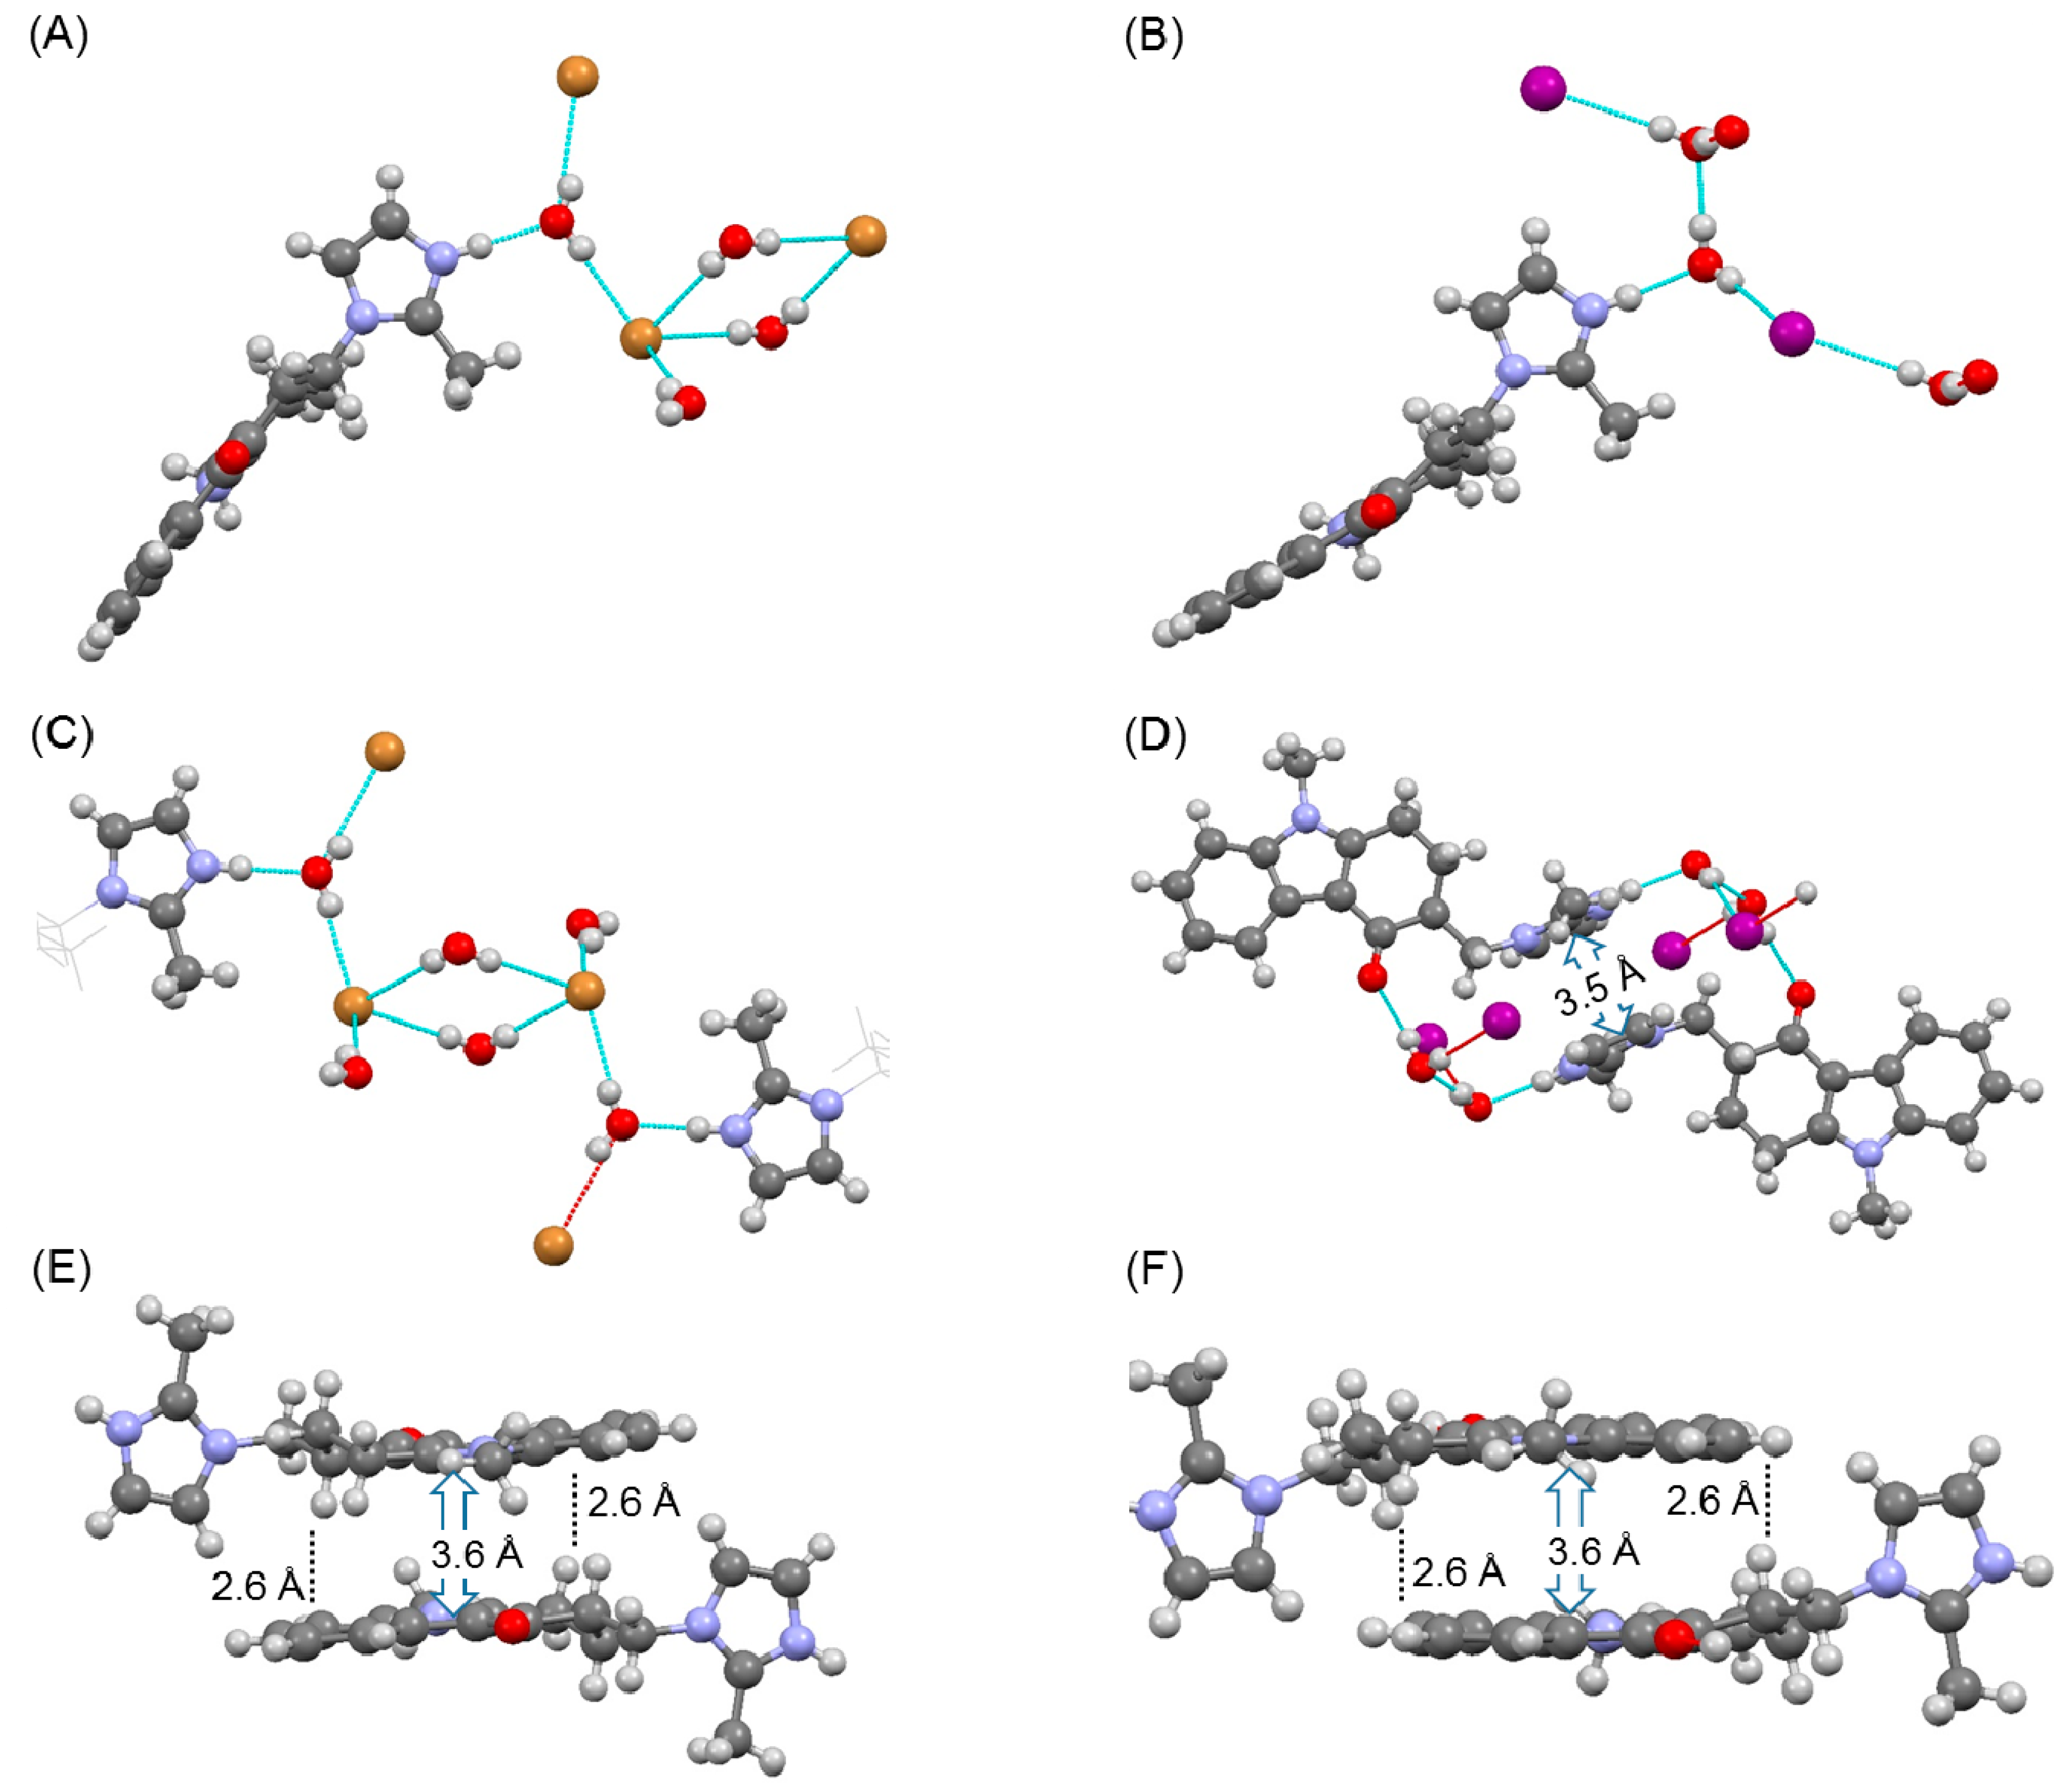
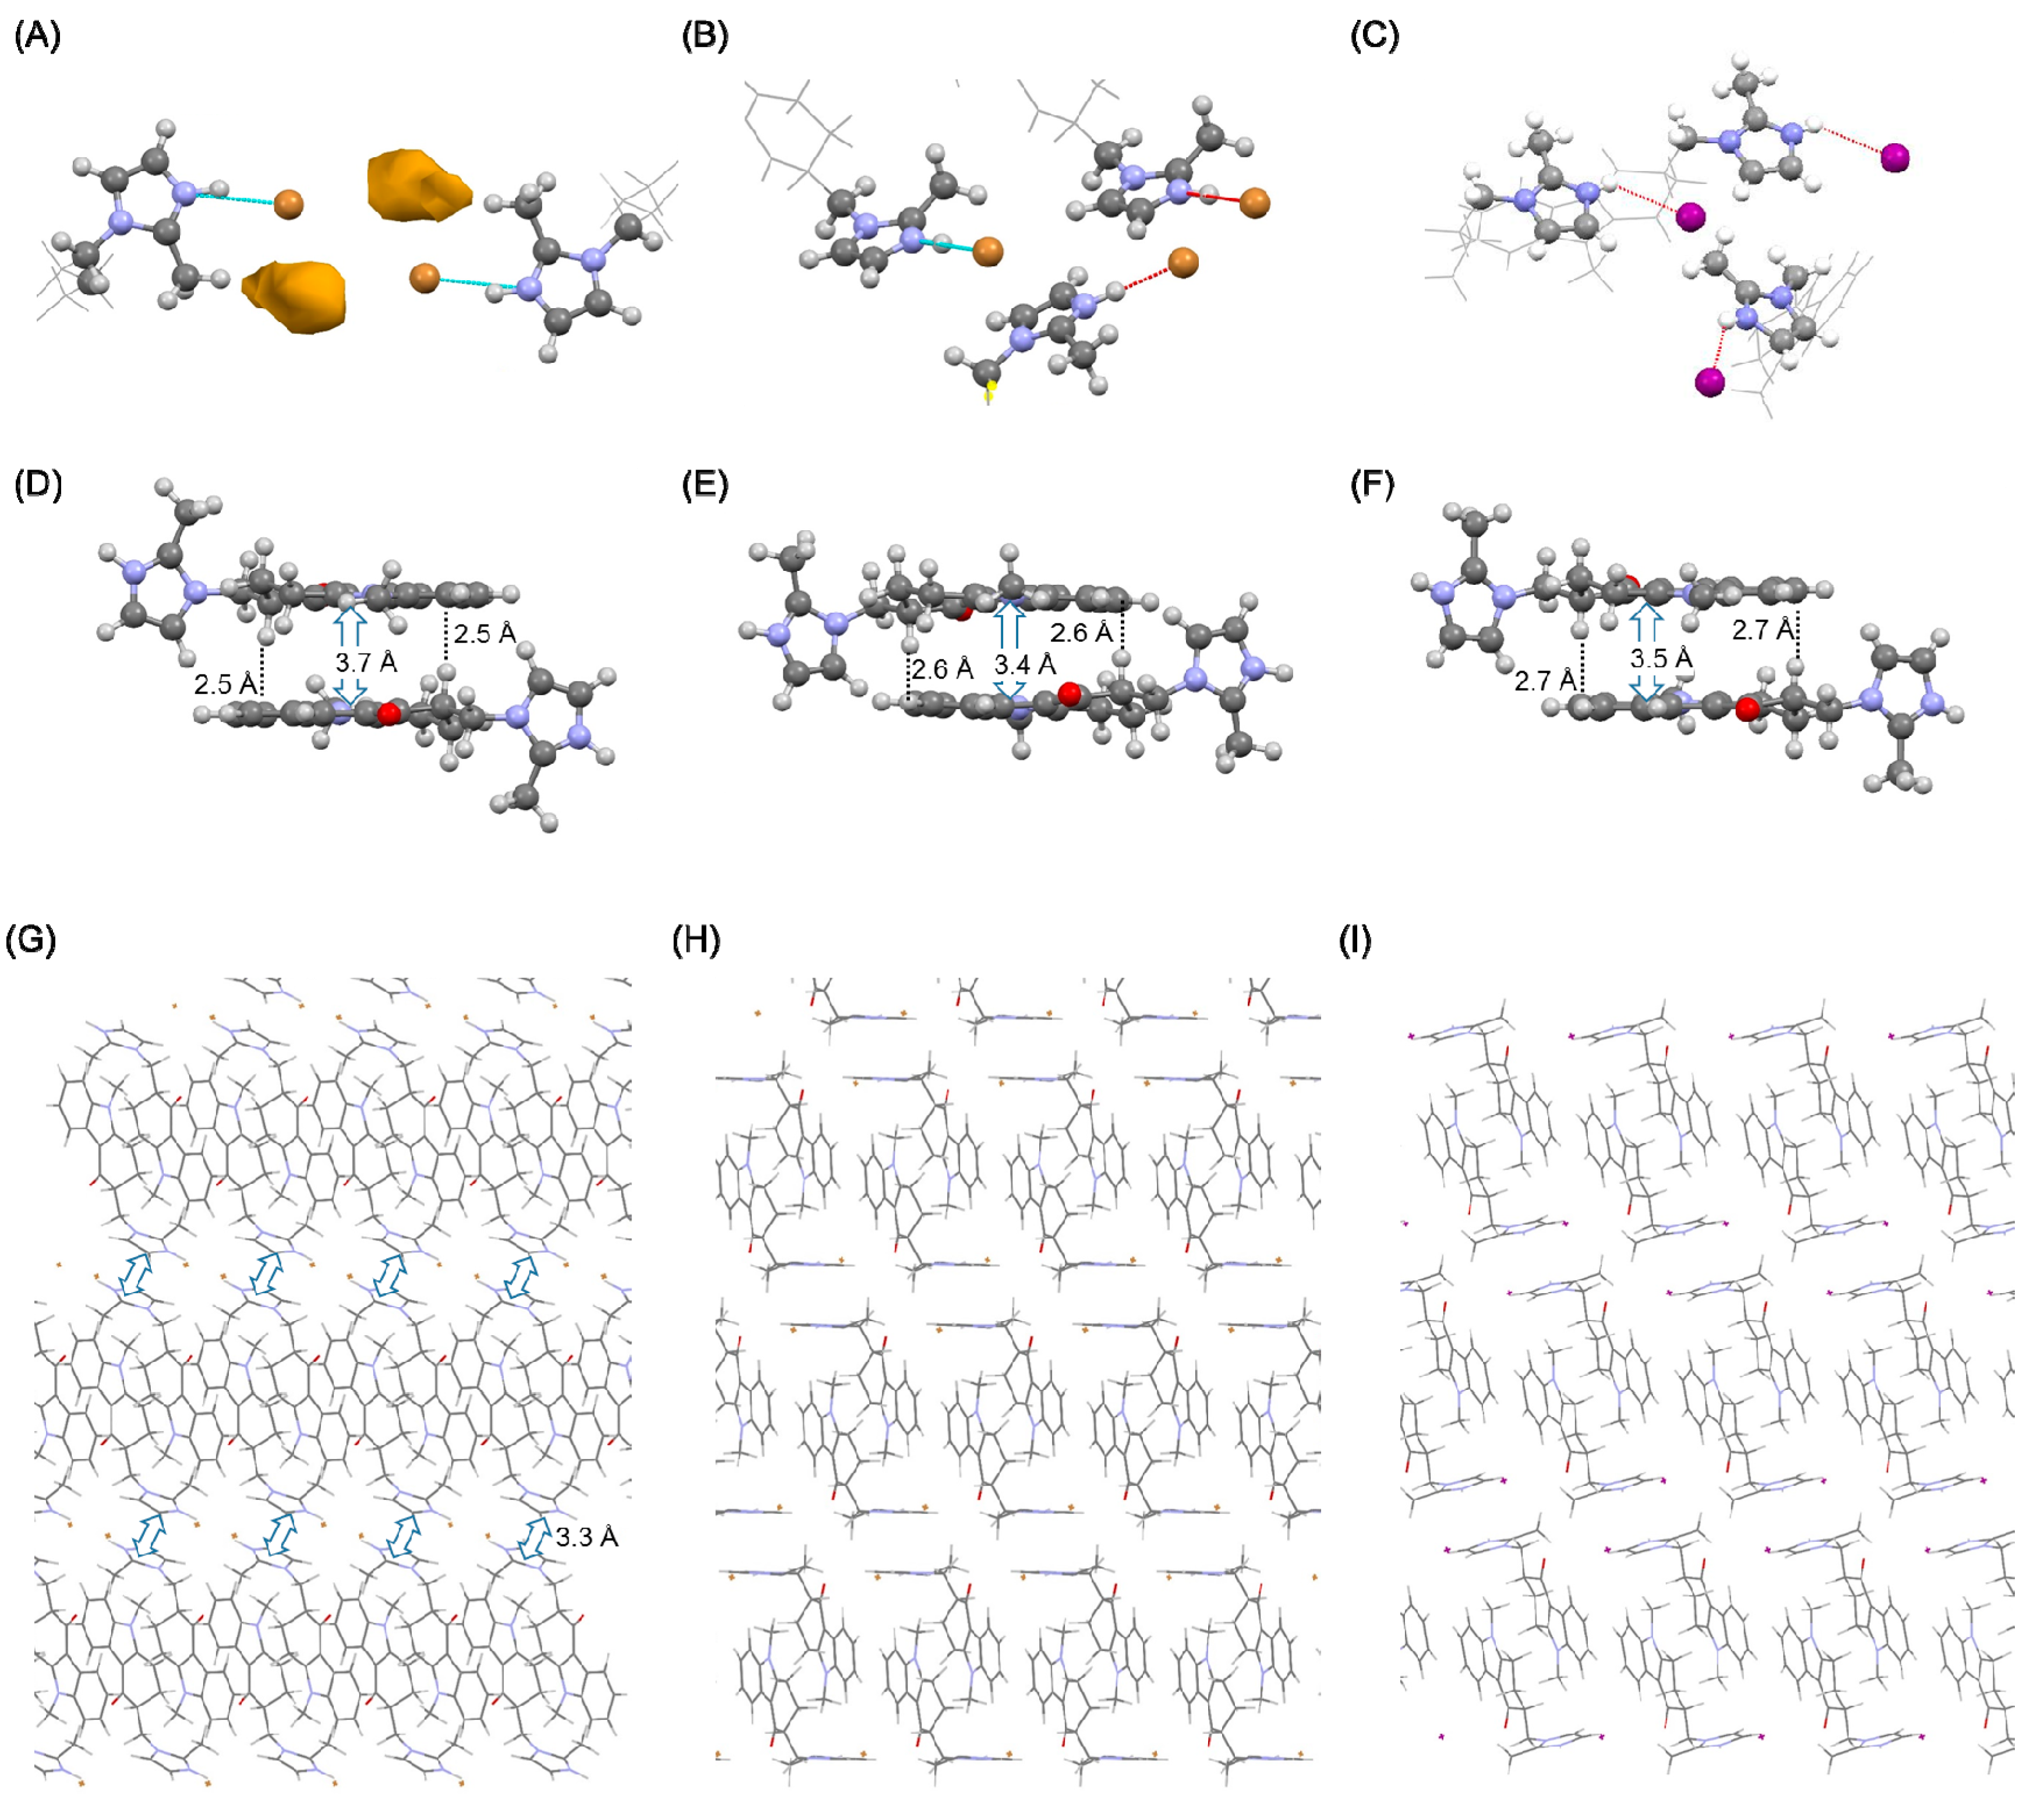
The results of single crystal structure analysis of ondansetron salts dihydrate are shown in Figure 1.
Single crystal structure analysis confirmed that ondansetron HBr formed a dihydrate. Ondansetron HBr had a similar crystal structure to ondansetron HCl [21]. These crystals structures were isomorphous, as evidenced by the unit cell parameters and hydrogen bonding networks. In particular, the water molecules were in direct contact with the imidazole cation, and the bromide anion interacted with the water molecules. Moreover, there were other water molecules between the two bromide anions. A π-π stacking interaction and CH-π were observed between the tricyclic groups of ondansetron (Figure 1E), which we speculate act to stabilize the crystal structure.
The crystal structure of ondansetron HI also confirmed that it formed a dihydrate. In the dihydrate structure, the imidazole cation interacted with the water molecule, but the iodide anion did not directly interact with the imidazole cation. The diamond-shaped hydrogen bonding network observed in the crystal structures of HCl and HBr salts was not formed. Instead, a hydrogen bond formed between the water molecules. In contrast, π-π stacking interaction and CH-π interactions between the tricyclic groups were maintained (Figure 1F). However, a new stacking interaction was observed between the imidazole rings in the HI salt dihydrate (Figure 1D).
Comparison of unit cell parameters indicated that the HCl salt and HBr salt were isomorphous. In contrast, the HI dihydrate salt did not exhibit isomorphism because the unit cell of the HI salt was markedly different such that the space group was P-1, as shown in Table 1.
3.2. Dehydration Behaviors of Nndansetron HBr and HI Dihydrates
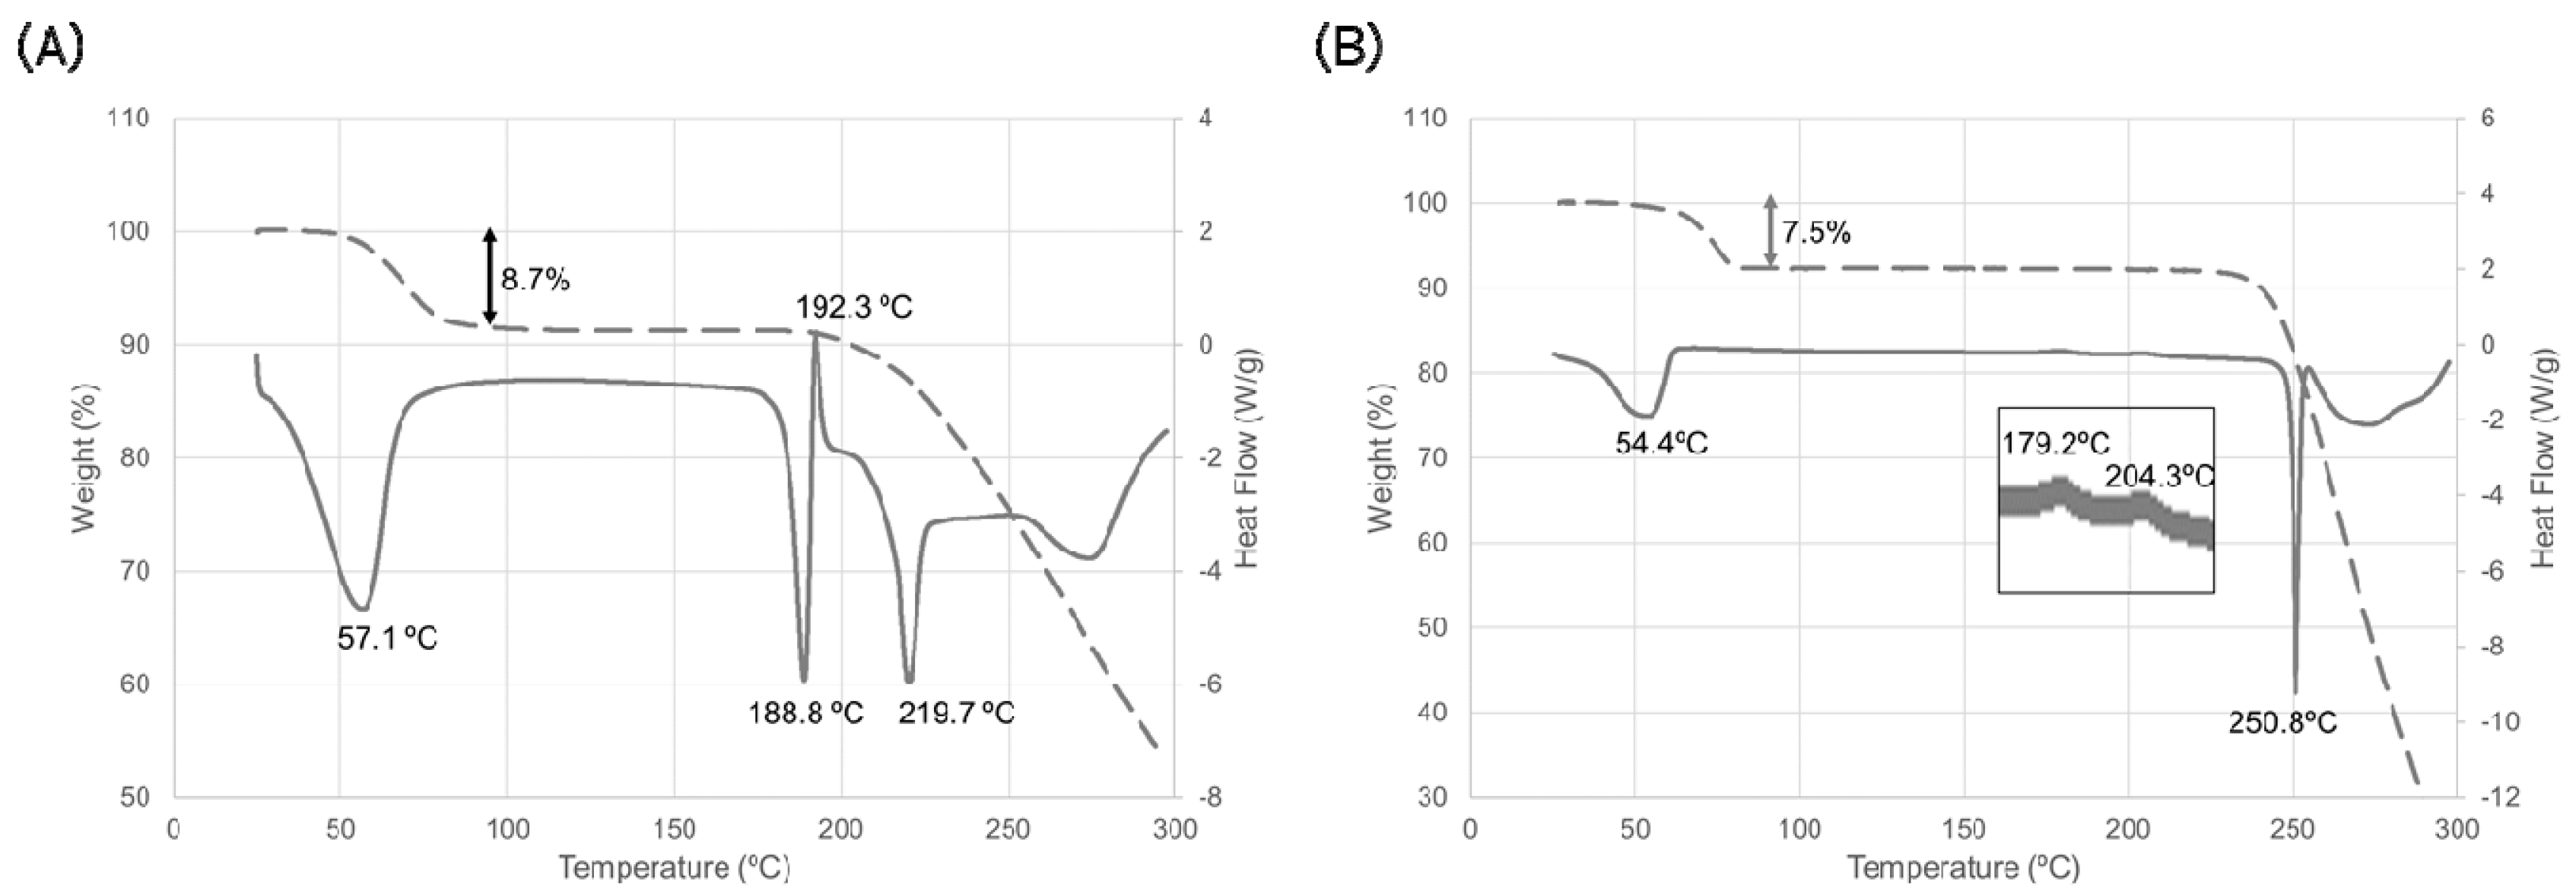
Dehydration properties were examined using the crystalline powder of ondansetron HBr dihydrate and HI dihydrate. The results of thermal analysis of HBr dihydrate are shown in Figure 2A.
A broad endothermic peak associated with decreasing weight was observed at around room temperature and was hypothesized to correspond to the dehydration of water molecules. Given that the magnitude of weight decrease was equal to the theoretical weight of the water of a dihydrate, this suggested that the dehydration reaction was complete, and the thermal behavior of an anhydrate should be observed at more than 100 °C. An endothermic peak and an exothermic peak were observed around 190° C. These peaks indicated the melting temperature of ondansetron HBr anhydrate (anhydrate A) and crystallization of another form, respectively. Finally, an endothermic peak was observed around 220 °C. This peak indicated the melting temperature of another ondansetron HBr anhydrate (anhydrate B).
Dehydration properties were examined using the crystalline powder of ondansetron HI dihydrate. The results of the thermal analysis are shown in Figure 2B. The endothermic peak associated with the decrease in weight was observed at around room temperature. The magnitude of the weight decrease was equal to the theoretical weight of the water in ondansetron HI dihydrate. This indicates that dehydration of the dihydrate form occurred at relatively low temperature. The endothermic peak at around 250 °C indicates the melting temperature of the anhydrate appeared after dehydration.
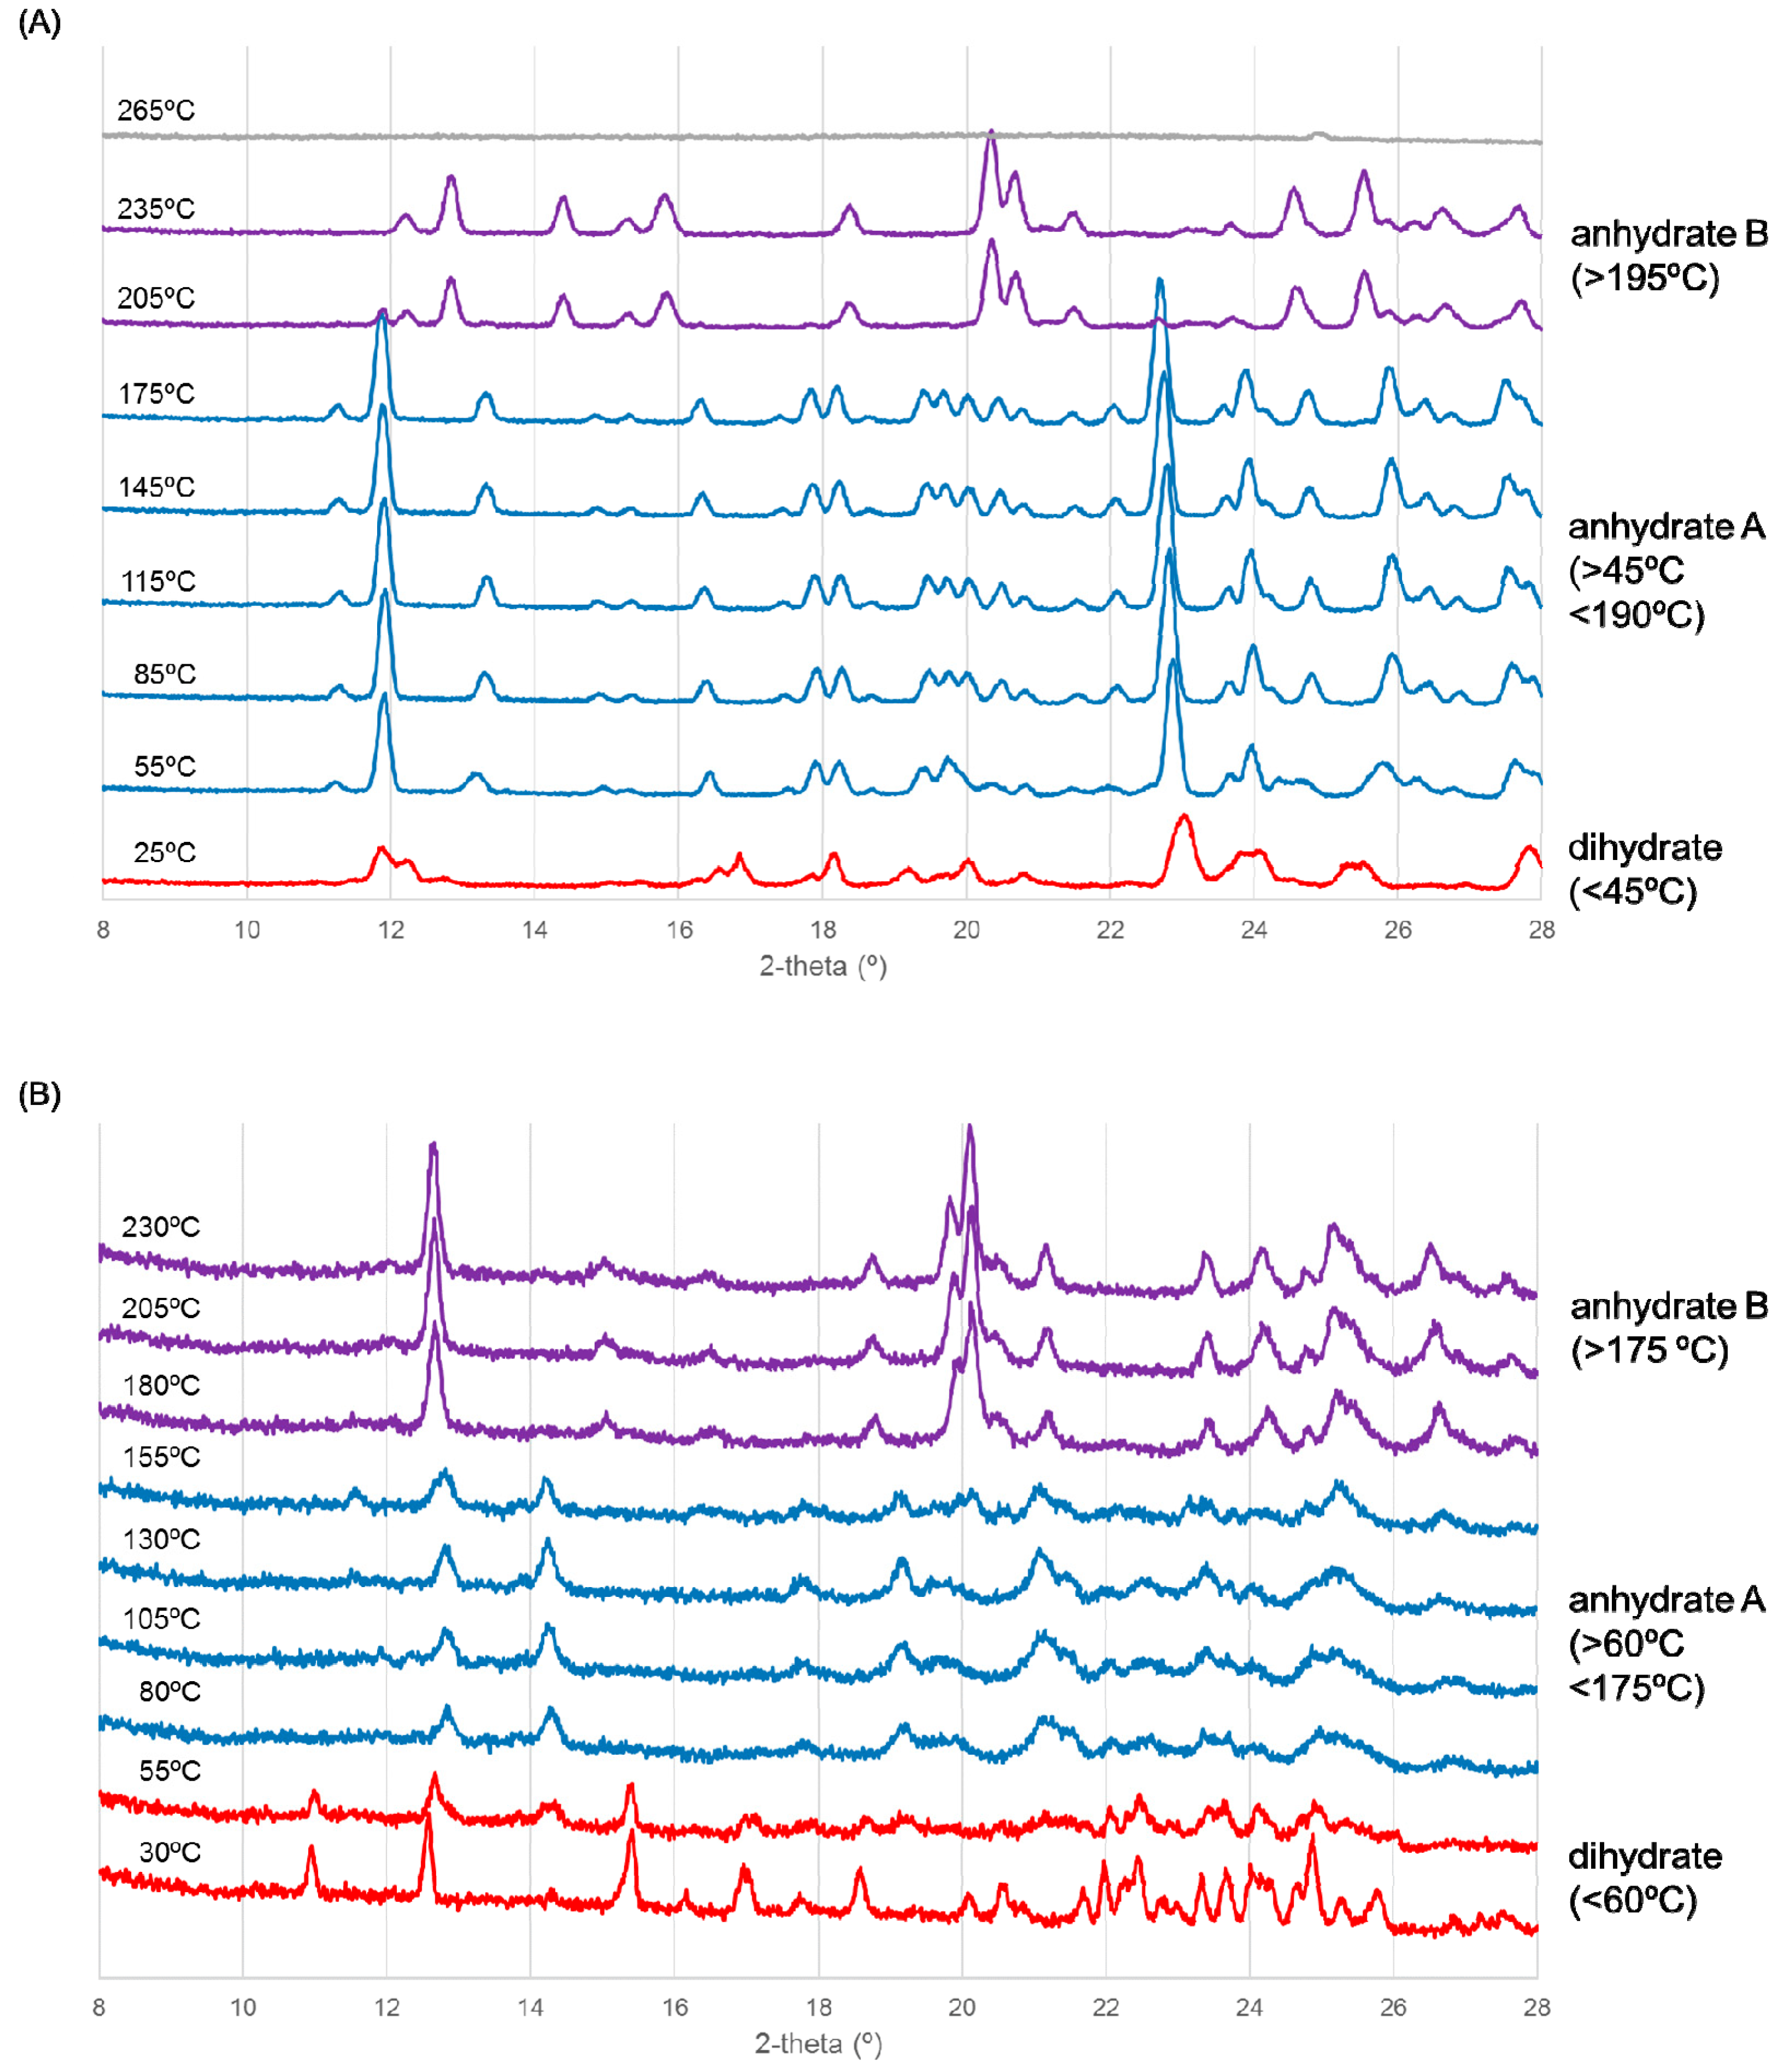
VT-XRD experiments were performed to gain a deeper understanding of the relationship between the thermal behavior and crystal form transition.
The XRD pattern was different from that of the dihydrate from the start of the experiment, as shown in Figure 3A, indicating that dehydration had already begun when the sample was being dried under dry N2 gas. The blue pattern in Figure 3A corresponds to that of an anhydrate because dehydration was observed in TGA (Figure 2A). In addition, the transition to another crystal form occurred at around 190 °C. This temperature corresponds to the thermal event observed in DSC (Figure 2A). In summary, ondansetron HBr dihydrate transformed to anhydrate A and then to an anhydrate B with heating.
As shown in Figure 3B, HI dihydrate transformed to anhydrate A at around 60 °C. The blue pattern in Figure 3B corresponds to that of an anhydrate because dehydration was observed in TGA (Figure 2B). Moreover, transition to another crystal form occurred around 170 °C. The temperature and transition may correspond to the minute exothermal peak observed in DSC (Figure 2B). In summary, ondansetron HI dihydrate likewise transformed to anhydrate A and then to an anhydrate B with heating.
3.3. Isolation of HBr and HI Anhydrates
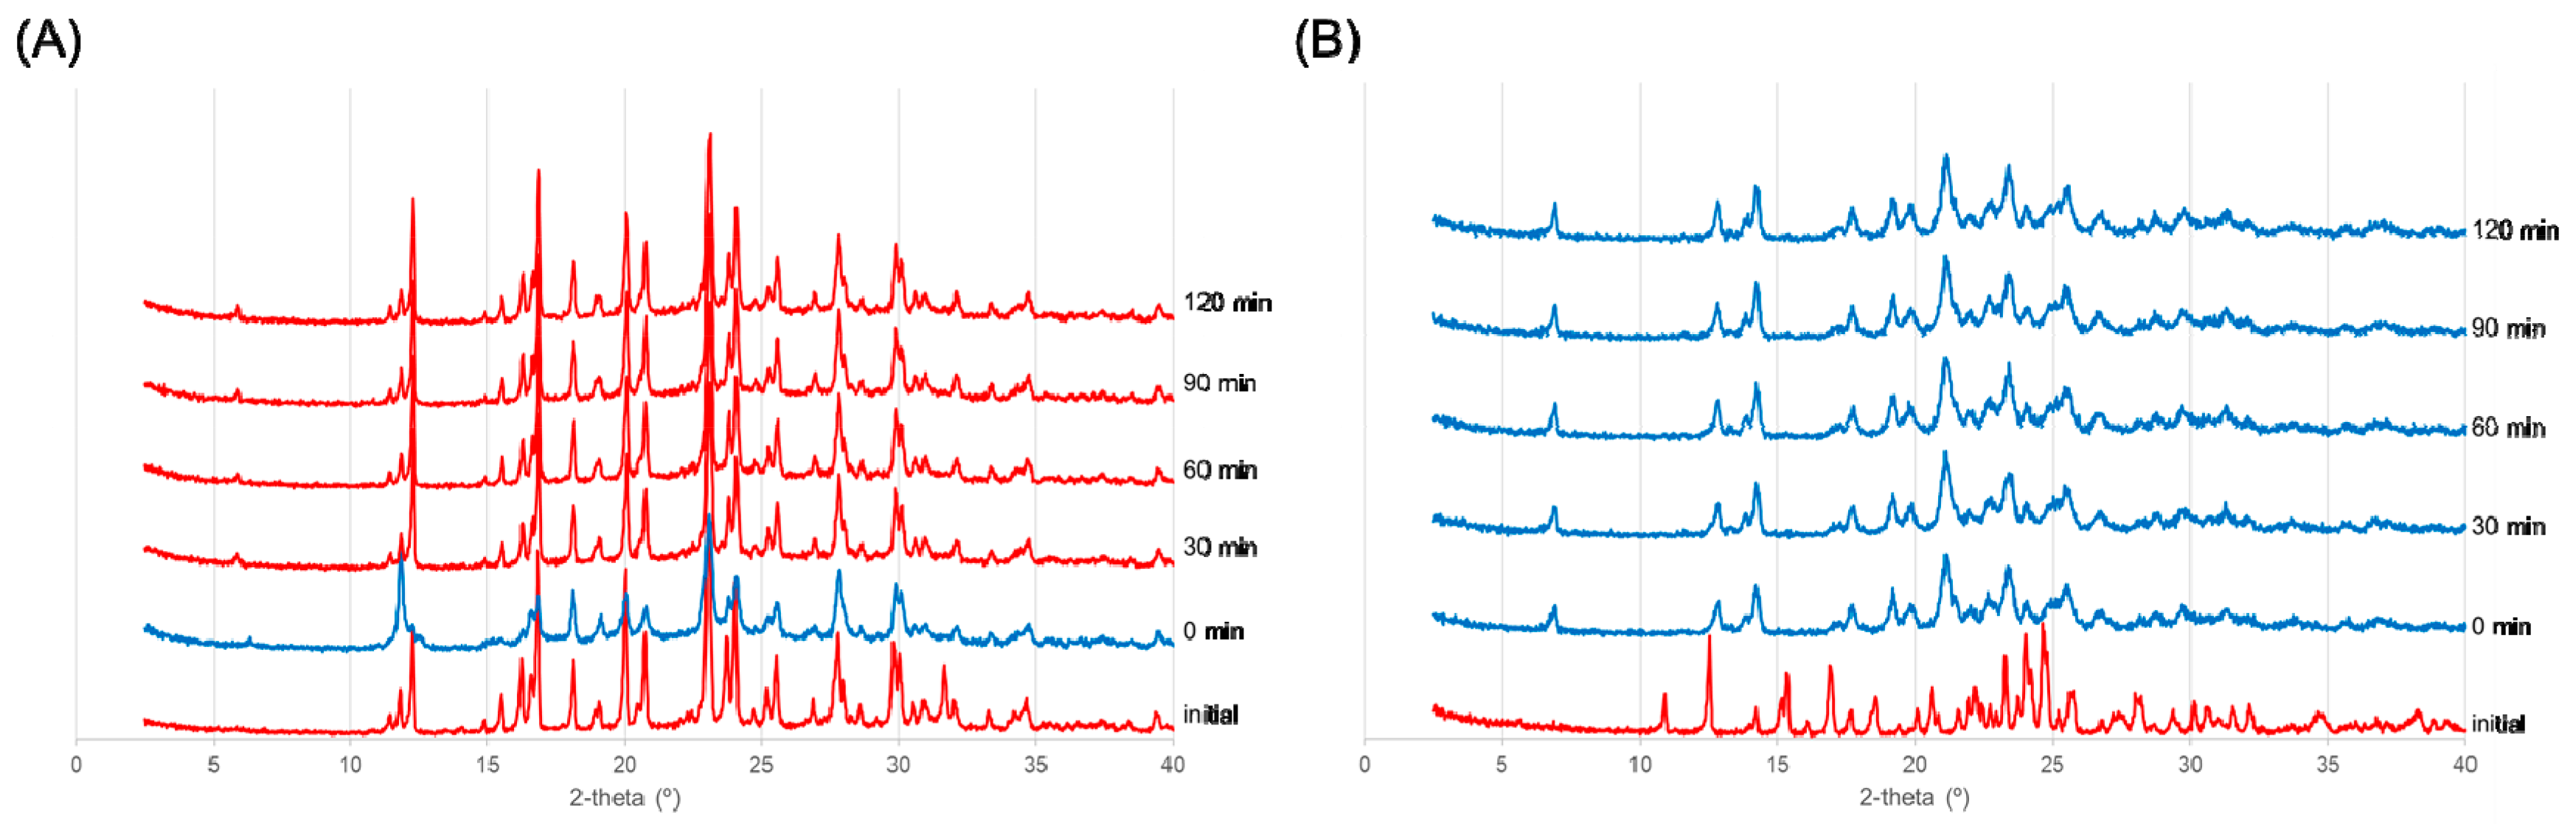
We attempted to isolate the anhydrate A of the HBr salt and HI salt with heating. For both salts, the dihydrate form was heated to 80 °C for 30 min to form the anhydrate A. The samples were then left under ambient conditions for varying periods of time, after which PXRD patterns were measured over time.
As shown in Figure 4A, although the XRD pattern measured immediately after heating was different from the initial pattern, it reverted back to the initial pattern after 30 minutes at room temperature. Therefore, it was difficult to isolate the anhydrate A of an HBr salt at room environment. In contrast, as shown in Figure 4B, the anhydrate A of the HI salt was maintained for 4 h after heating. Heating caused the test materials to change slightly from white to pale brownish yellow. Therefore, the anhydrate A of an HI salt can be isolated at room environment.
3.4. Crystal Structure Analysis of the Anhydrates of HBr and HI Salts
To examine the mechanism governing the dehydration of ondansetron HBr dihydrate and HI dihydrate, we conducted crystal structure analysis of the PXRD patterns of anhydrate A and B. For crystal structure analysis of PXRD, XRD with heating was conducted using SPring-8 BL19B2. The results are shown in Figures S5 and S6.
Similar pattern changes to those shown in Figure 3 were observed in the SPring-8 BL19B2 experiments. For the HBr salt, crystal structure analysis was performed using the PXRD pattern at 140 or 25 °C cooling (in Figure S5) for anhydrate A and B, respectively. We attempted to isolate anhydrate B. Isolation was difficult with heating at around 200 °C due to the occurrence of melting and degradation. We therefore expect that strict temperature control is needed. However, isolation was possible from a slurry suspension of the dihydrate in ethyl acetate at 50 °C. While anhydrate B of the HBr salt could be isolated, single crystals could not be obtained. For the HI salt, although a crystal form transition was observed with heating, XRD patterns of anhydrate A and B were unclear, making it difficult to resolve the crystal structure using PXRD. Nevertheless, anhydrate B of the HI salt was isolated, as was the single crystal form (see the experimental section).
The crystal structures of two anhydrates of the HBr salt and one anhydrate of the HI salt were obtained. The structures of anhydrate A and B of the HBr salt and anhydrate B of the HI salt are shown in Figure 5.
According to the crystal structure of anhydrate A of HBr, the tricyclic groups of ondansetron were oriented in anti-parallel. This motif was also observed in the dihydrate, in which the imidazole cation did not directly interact with the bromide anion and the water molecule was intercepted. However, in anhydrate A, the absence of the water molecule indicates that a cation was in direct interaction with an anion. The space produced by dehydration was filled by translation of the imidazole ring, and new stacking interactions between the imidazole rings were formed (Figure 5G). These changes in interactions are similar to those observed in dehydration of the HCl salt.
In anhydrate B of HBr, the dimer structure formed by the tricyclic groups was likewise maintained. Direct interaction between the imidazole cation and bromide anion was also observed. Stacking interaction between the imidazole rings however was not observed. The void structure was likewise not observed, which may underlie the relative stability of anhydrate B at room environment. As anhydrate B also transformed to a dihydrate under higher humidity conditions, the dihydrate was the most stable form in high water activity environments.
In anhydrate B of HI, an ionic bond was formed between the imidazole cation and iodide anion. The stacking interaction and CH-π that were observed in all crystal phases of ondansetron were also maintained in anhydrate B. The stacking interaction between the imidazole rings however was not observed. The space group was P21/c, differing from that of the dihydrate.
3.5. Hygroscopicity
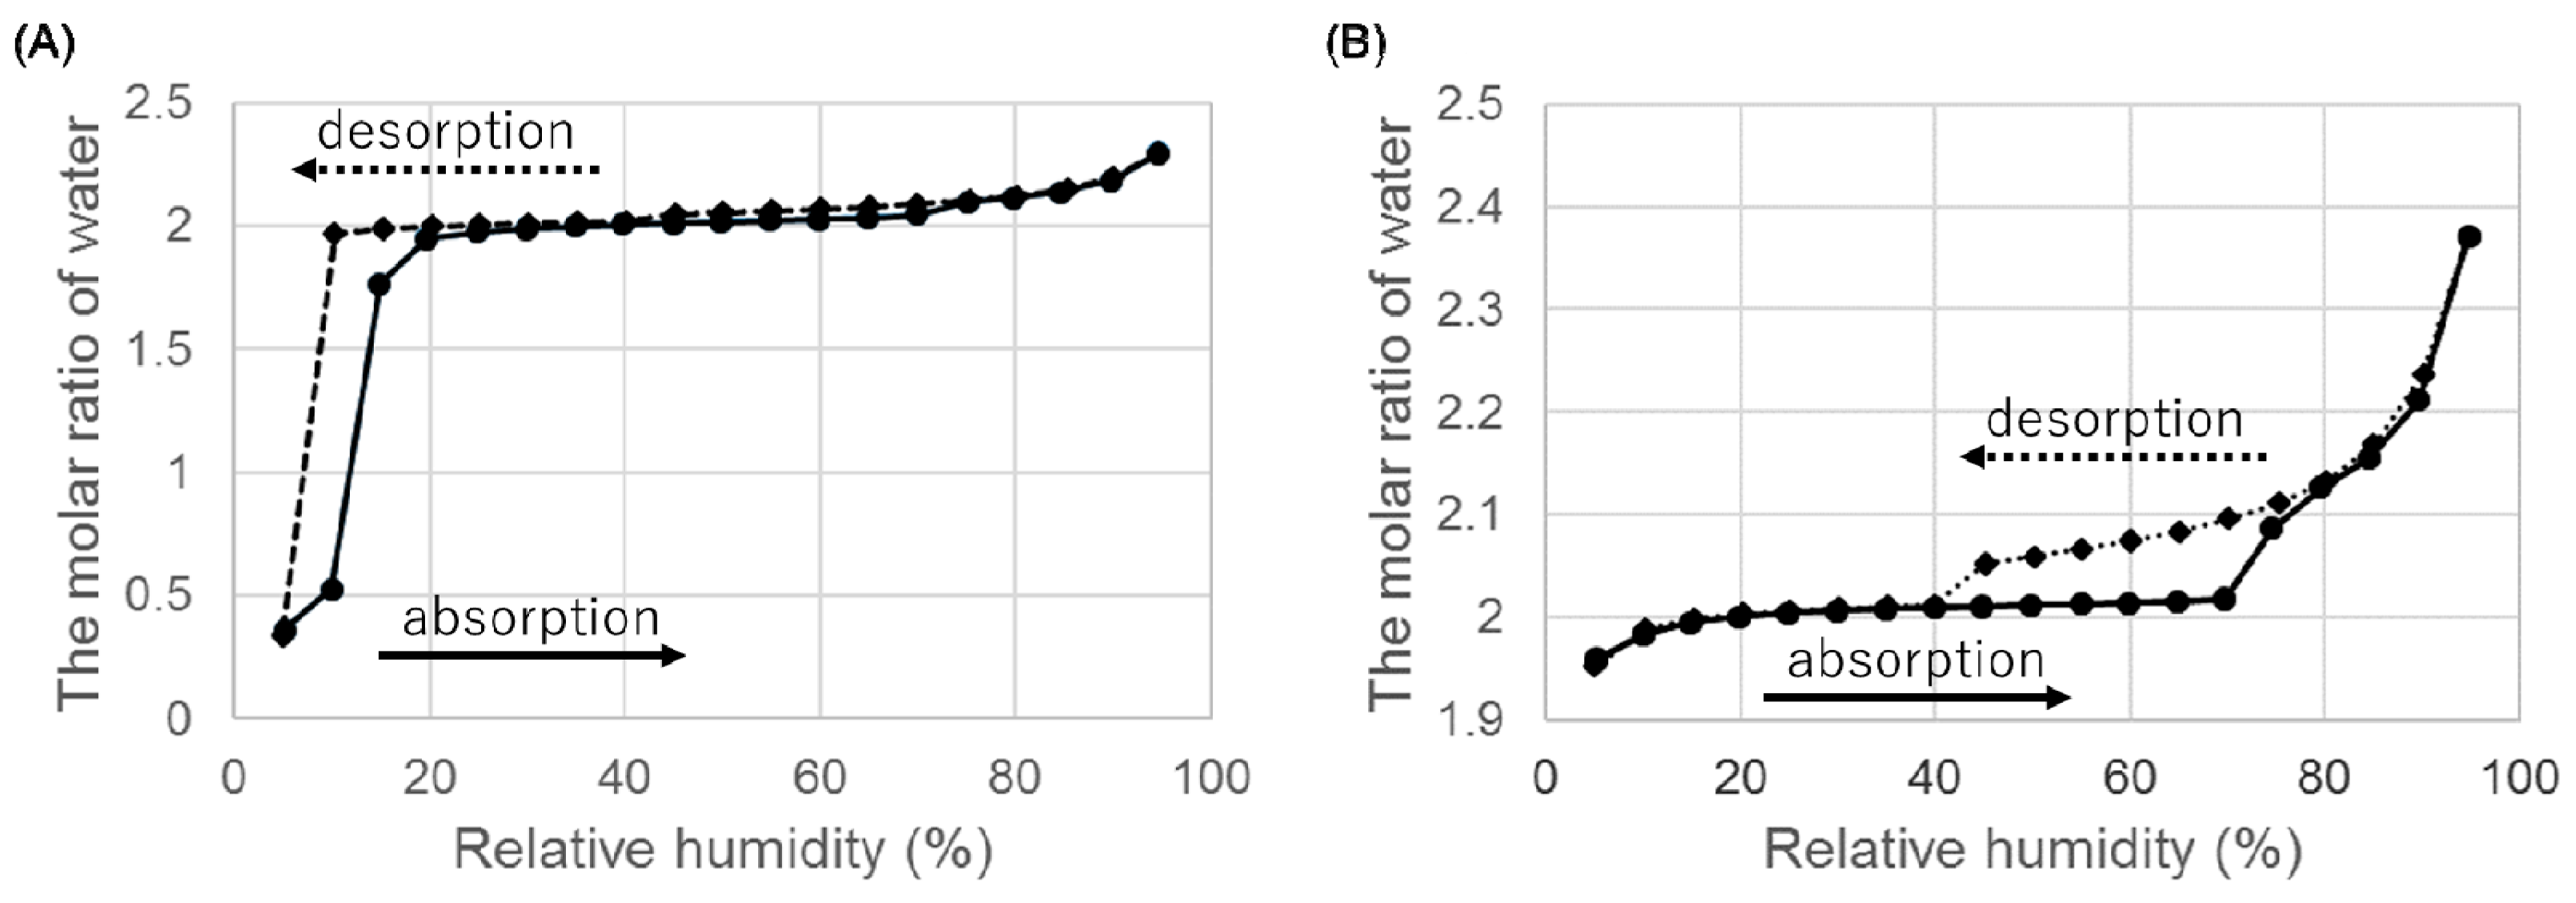
The dehydration tendency of ondansetron HBr and HI dihydrates at varying levels of RH was studied and the results are shown in Figure 6.
When we examined the weight change from 5% to 95% RH, there was a decrease in weight at low RH (Figure 6A). In the absorption process, the dihydrate of HBr was reformed and hydration was completed at 20% RH. These hygroscopicity profiles are consistent with the fact that it was difficult to isolate anhydrate A of HBr at room environment.
The dihydrate of HI showed the hygroscopicity at high RH, but no decrease in weight was observed at low humidity. The dihydrate was stable at low RH.
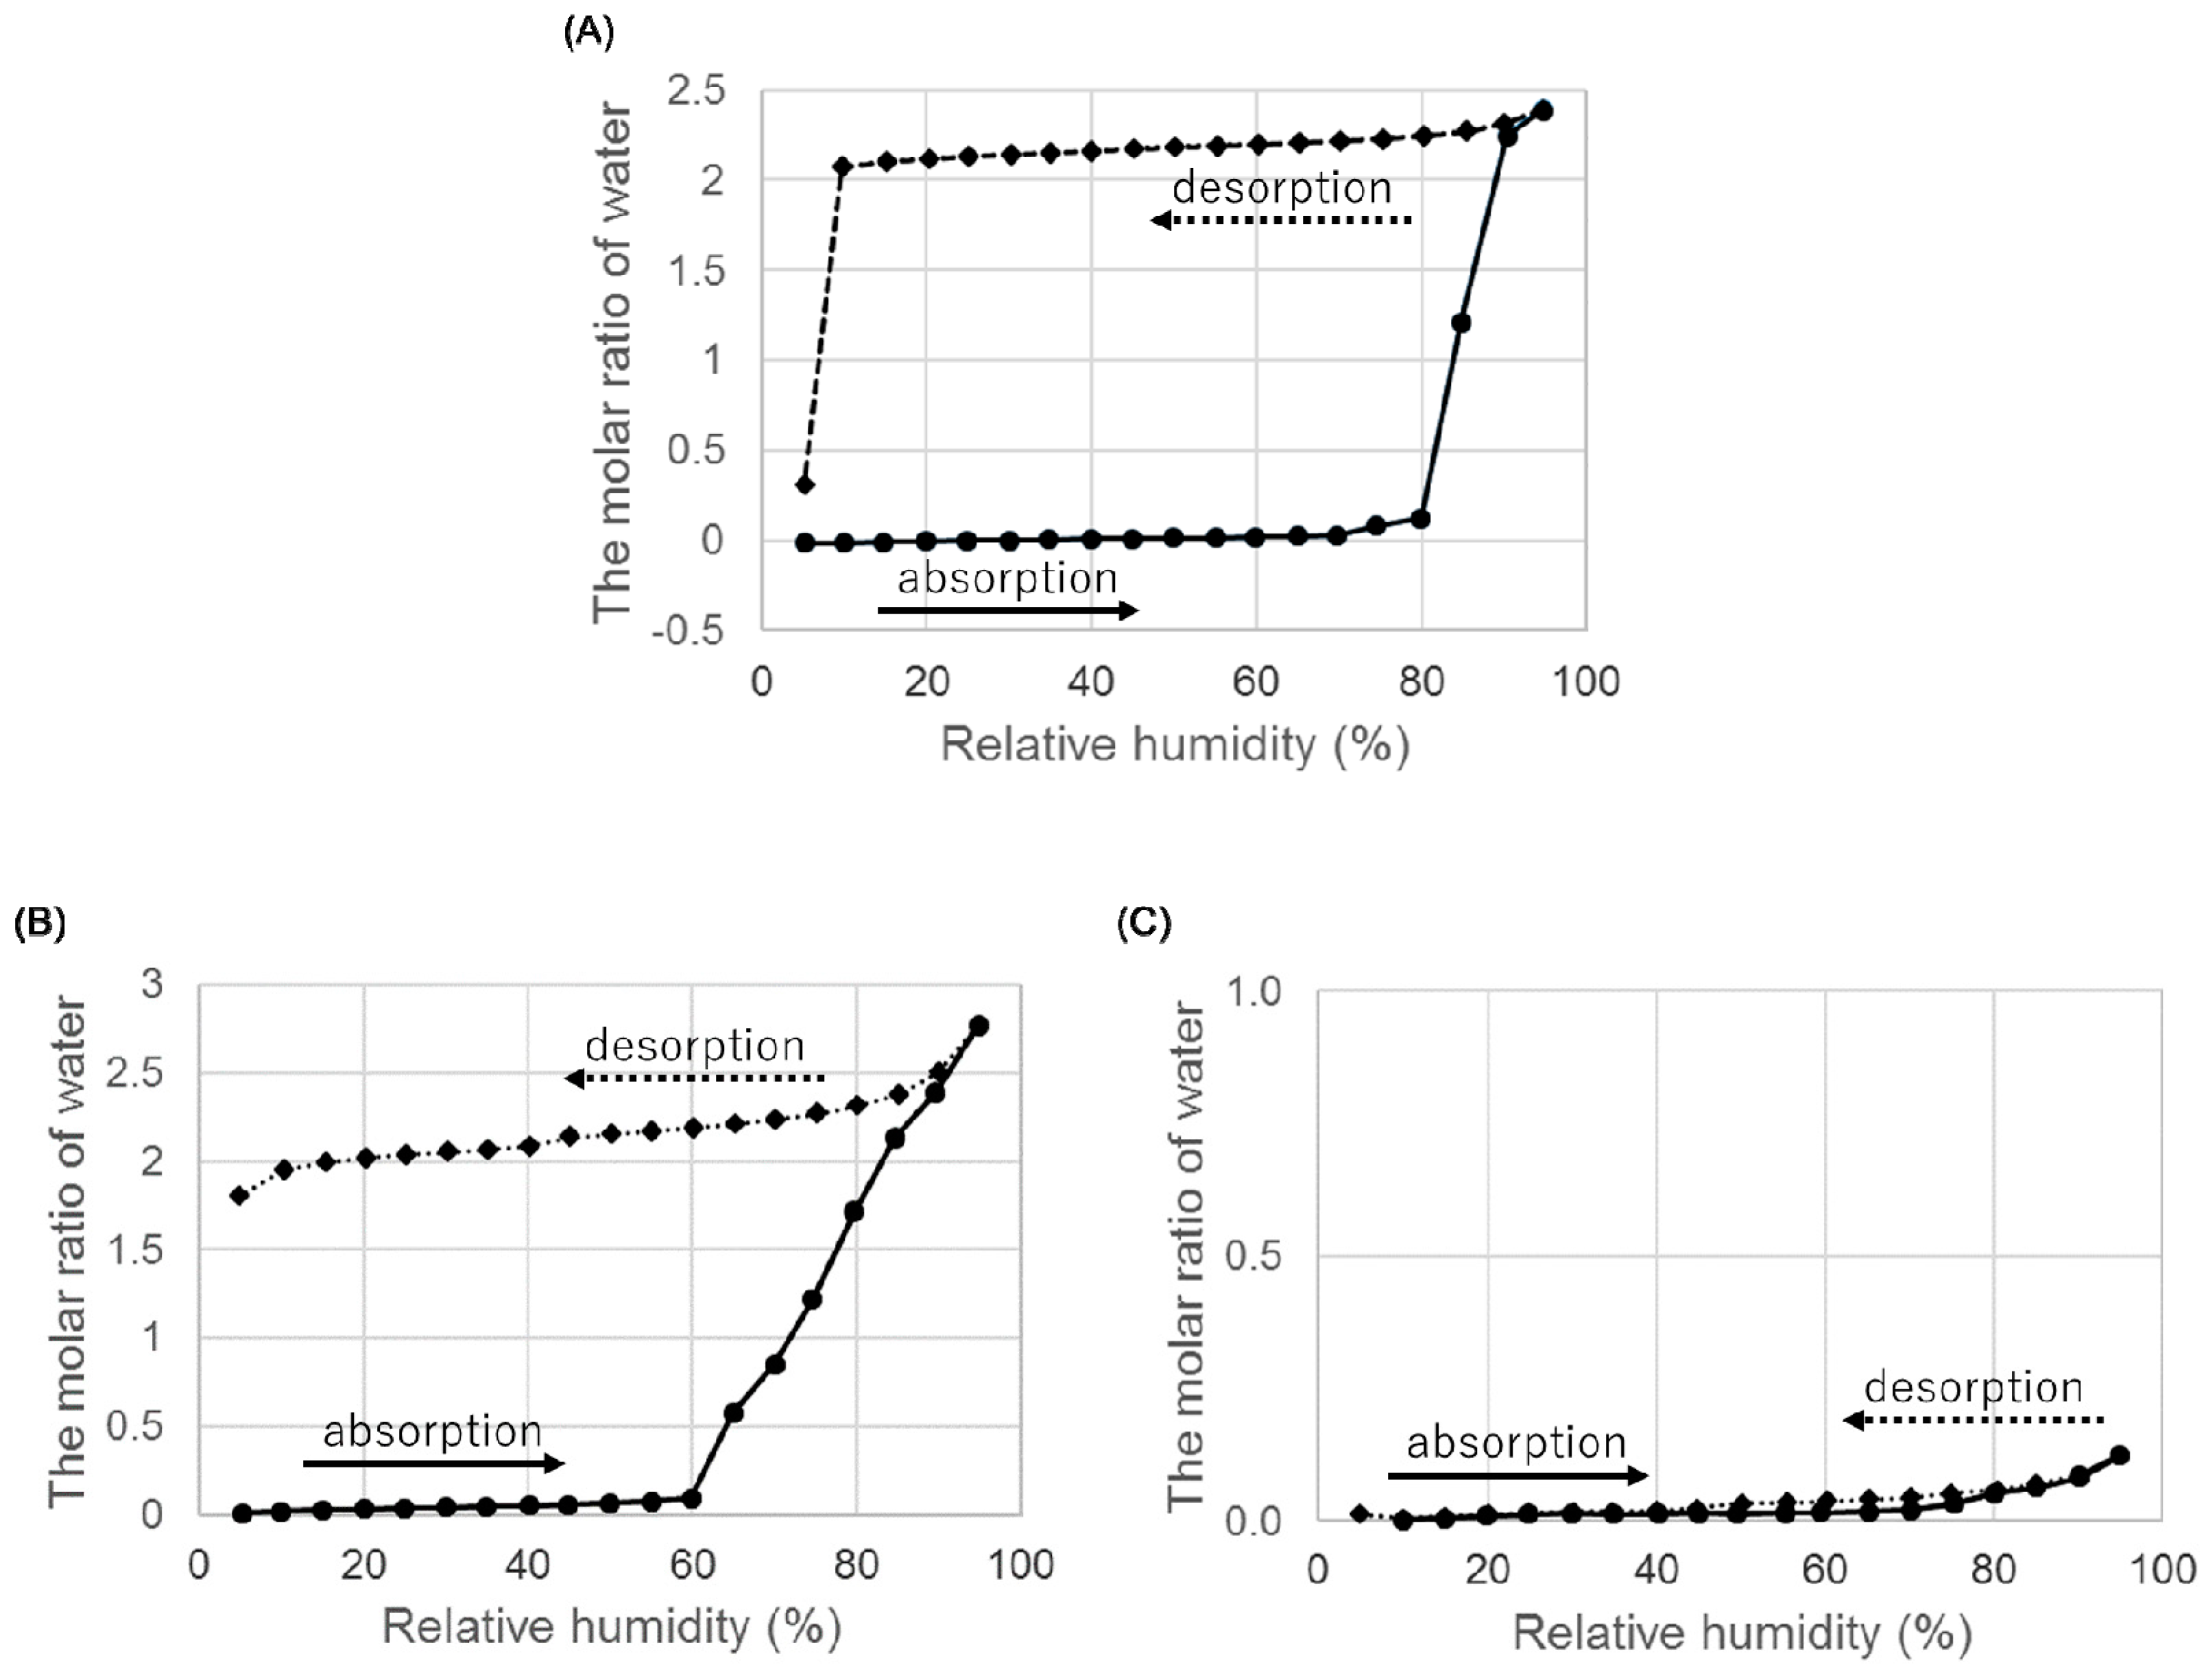
Hygroscopicity was studied to evaluate the physicochemical properties of the anhydrates (Figure 7).
When we examined the weight change from 5% to 95% RH, an anhydrate B of HBr absorbed water at around 85% RH and the increase of weight was equal to the theoretical weight of the dihydrate. The increased weight was maintained until RH reached below 10% in the desorption process, and the weight decreased from around 5% RH. This dehydration profile was the same as that of the dihydrate, indicating that an anhydrate B transformed to a dihydrate at high relative humidity.
Next, we evaluated the hygroscopicity of an anhydrate A of HI. The results are shown in Figure 7B. An anhydrate A absorbed water at around 65% RH, and the increase in weight was approximately equal to the weight of two water molecules. The increase in weight did not decrease at low RH. Confirmation of the crystal form using PXRD indicated that the anhydrate transformed back to a dihydrate. In summary, an anhydrate A obtained by heating a dihydrate transformed back to the initial dihydrate under high humidity conditions.
Finally, we evaluated the hygroscopicity of an anhydrate B of HI. The results are shown in Figure 7C. Although the anhydrate B of ondansetron hydroiodide did not show hygroscopicity, the anhydrate A did and transformed into a dihydrate. The low hygroscopicity of anhydrate B suggests that it may be suitable as a drug substance.
4. Discussion
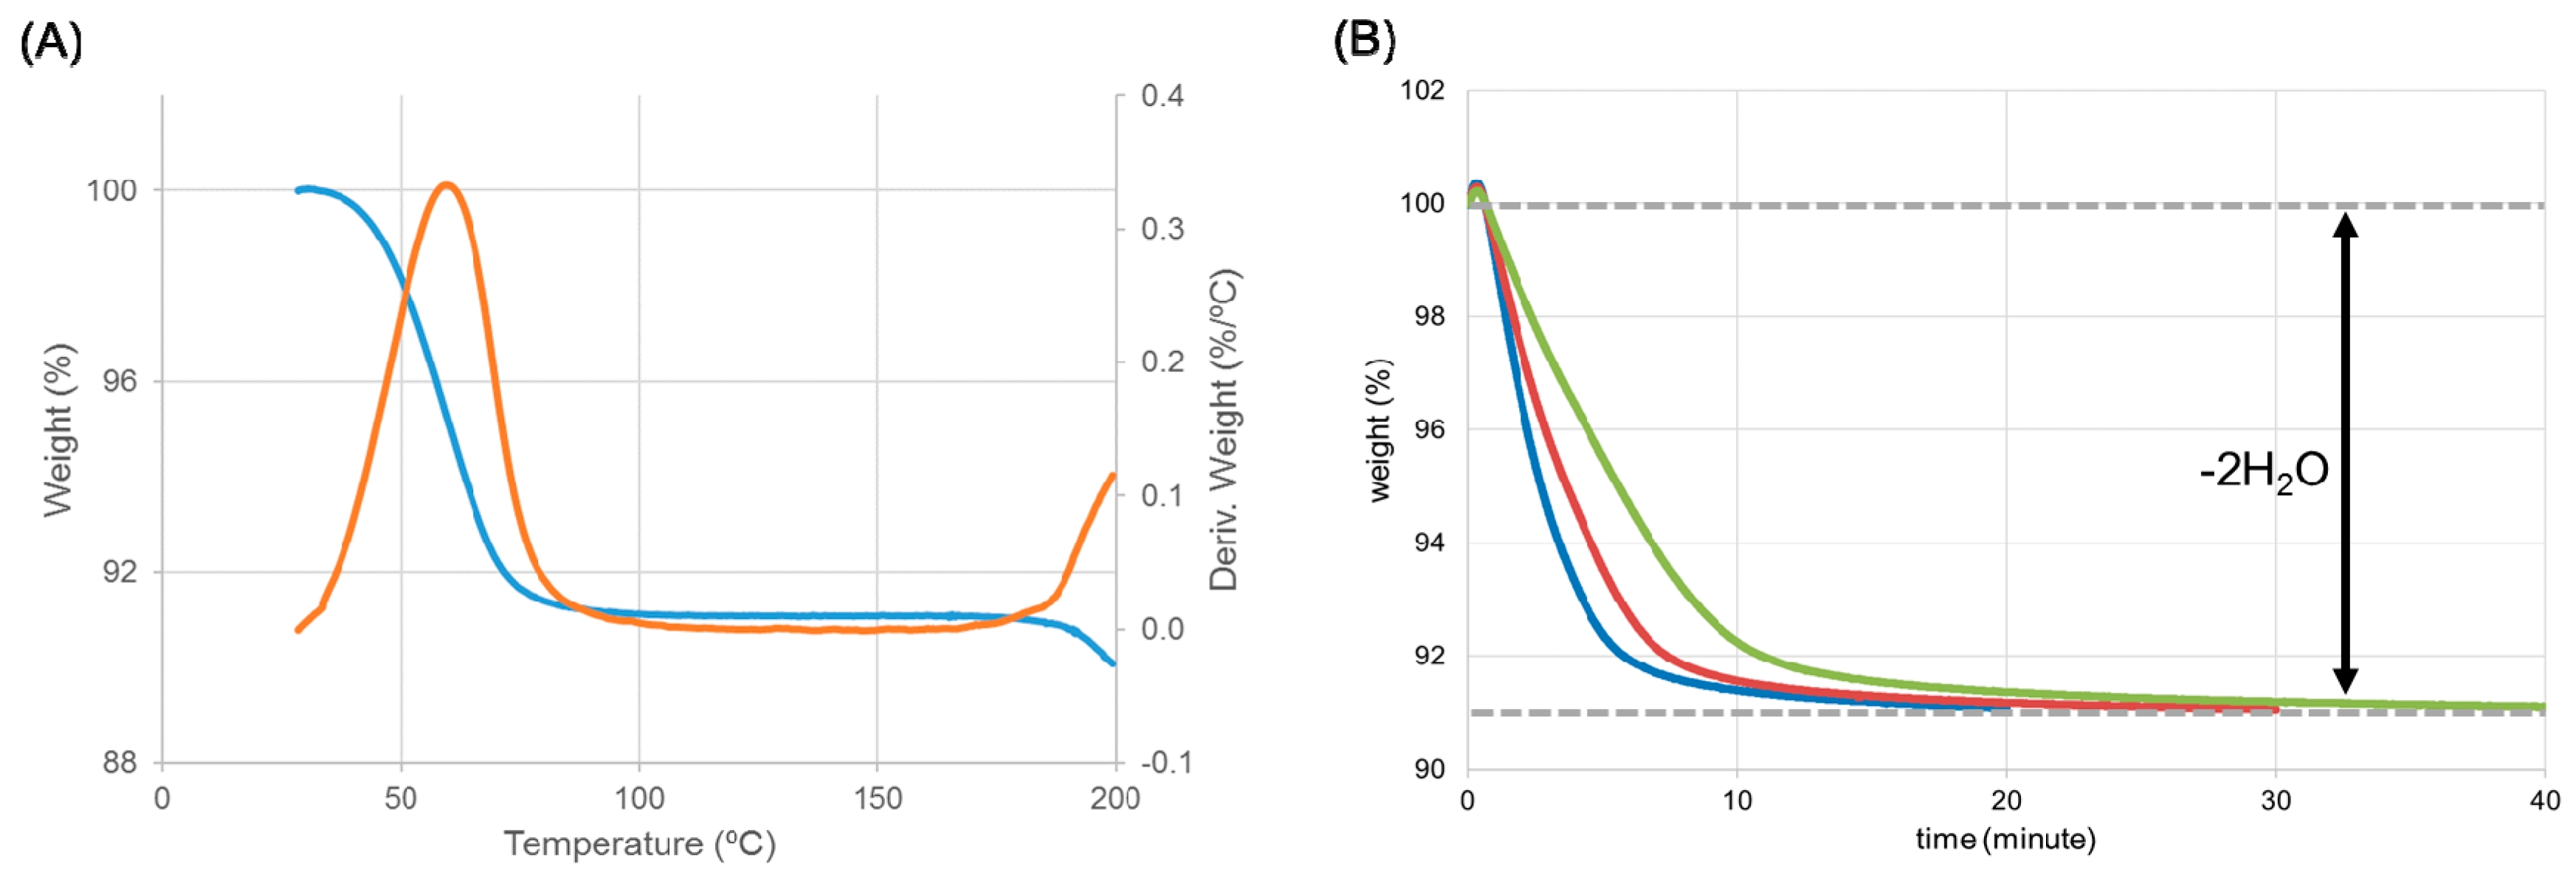
The structures of ondansetron HBr dihydrate and HCl dihydrate were isomorphous, suggesting that HBr dihydrate should show a similar dehydration profile to HCl dihydrate forms. In particular, we evaluated whether or not a hemihydrate intermediate was formed through the dehydration process of HBr dihydrate. TGA produced a derivation curve with only one peak (ca. 60 °C), indicating that the dehydration progressed with one-step (Figure 8A). Whether or not an intermediate was formed was confirmed by monitoring the weight change at different temperatures (Figure 8B). The magnitude of weight change was equivalent to the weight of the water in ondansetron HBr dihydrate (about 9%). This indicates that, contrary to our expectation, the dihydrate of the HBr salt directly transformed to an anhydrate without forming a hemihydrate intermediate, as observed in the dehydration of the HCl salt.
To determine why no intermediate was observed in the dehydration of ondansetron HBr dihydrate, we considered the isomorphic relationship between ondansetron HCl and HBr dihydrates. Some related parameters of the anhydrates are shown in Table 2.
The ion radius of a bromide anion is bigger than that of a chloride anion, suggesting that the distance between two bromide anions is longer than that between two chloride anions. The distance between two anions should get longer considering the difference in ion radius, so the distance between bromide anions was relatively short comparing between chloride anions. As a result, the void volume was markedly different and the unit cell volume of the HBr salt was smaller than that of the HCl salt. The void space should be occupied by the water molecule in a hemihydrate. The small void volume of the HBr salt suggests that it is unable to retain a water molecule due to the lack of space. This may be a fundamental reason as to why no intermediate of HBr salt formed based on crystal structure analysis. Moreover, comparison of the density shows that the HBr salt has high packing efficiency, making it relatively stable. The relative instability of the anhydride of the HCl salt may explain the need to form an intermediate in the transition process.
When we examined the relationship between the crystal structures of each salt dihydrate, we found that the HI salt did not exhibit an isomorphic structure (Table 1 and Figure 1). The ion radius of the iodide anion (2.20 Å) is bigger than those of chloride and bromide anions [29]. Although it is possible for the crystal to increase in size and to rearrange, the larger anion may not fit into an isomorphic structure. Alternatively, studies have reported hydrated anions, represented as [X(H2O)]- [30,31]. We observed a [Cl2(H2O)4]2--like anion and a [Br2(H2O)4]2--like anion in the crystal structure of ondansetron HCl and HBr dihydrate, respectively. Although a kind of [Br2(H2O)4]2--like anion has not been reported, yet, similar types of hydrated anions have been reported. However, hydrated iodide anions reportedly form a different network. Chloride and bromide anions form cyclic clusters, while iodide anions form open chains [31]. We observed a chain cluster in the ondansetron HI dihydrate. The characteristics of the hydrated anions are likely related with the isomorphism of the corresponding dihydrates.
It is important to determine the most suitable property for each salt and hydrate of ondansetron from the perspective of drug development. Good solid physicochemical properties are required of the drug substance form. Stability against humidity is also important. Dihydrates of ondansetron HCl and HBr salts were unstable under low RH conditions, leading to the formation of an anhydrate or a hemihydrate. Anhydrate A of HCl and HBr salts were also unstable, and were even difficult to isolate at room environment. Anhydrate B of the HBr salt was unstable under high RH conditions, leading to the formation of a dihydrate. However, the dihydrate and anhydrate B of the HI salt were stable against humidity, indicating that both forms are feasible for drug development. As iodine has a characteristic pharmacokinetics profile in that it accumulates in the thyroid, iodine-containing salts tend to be avoided as drug substances. Therefore, salt selection requires the consideration of various factors.
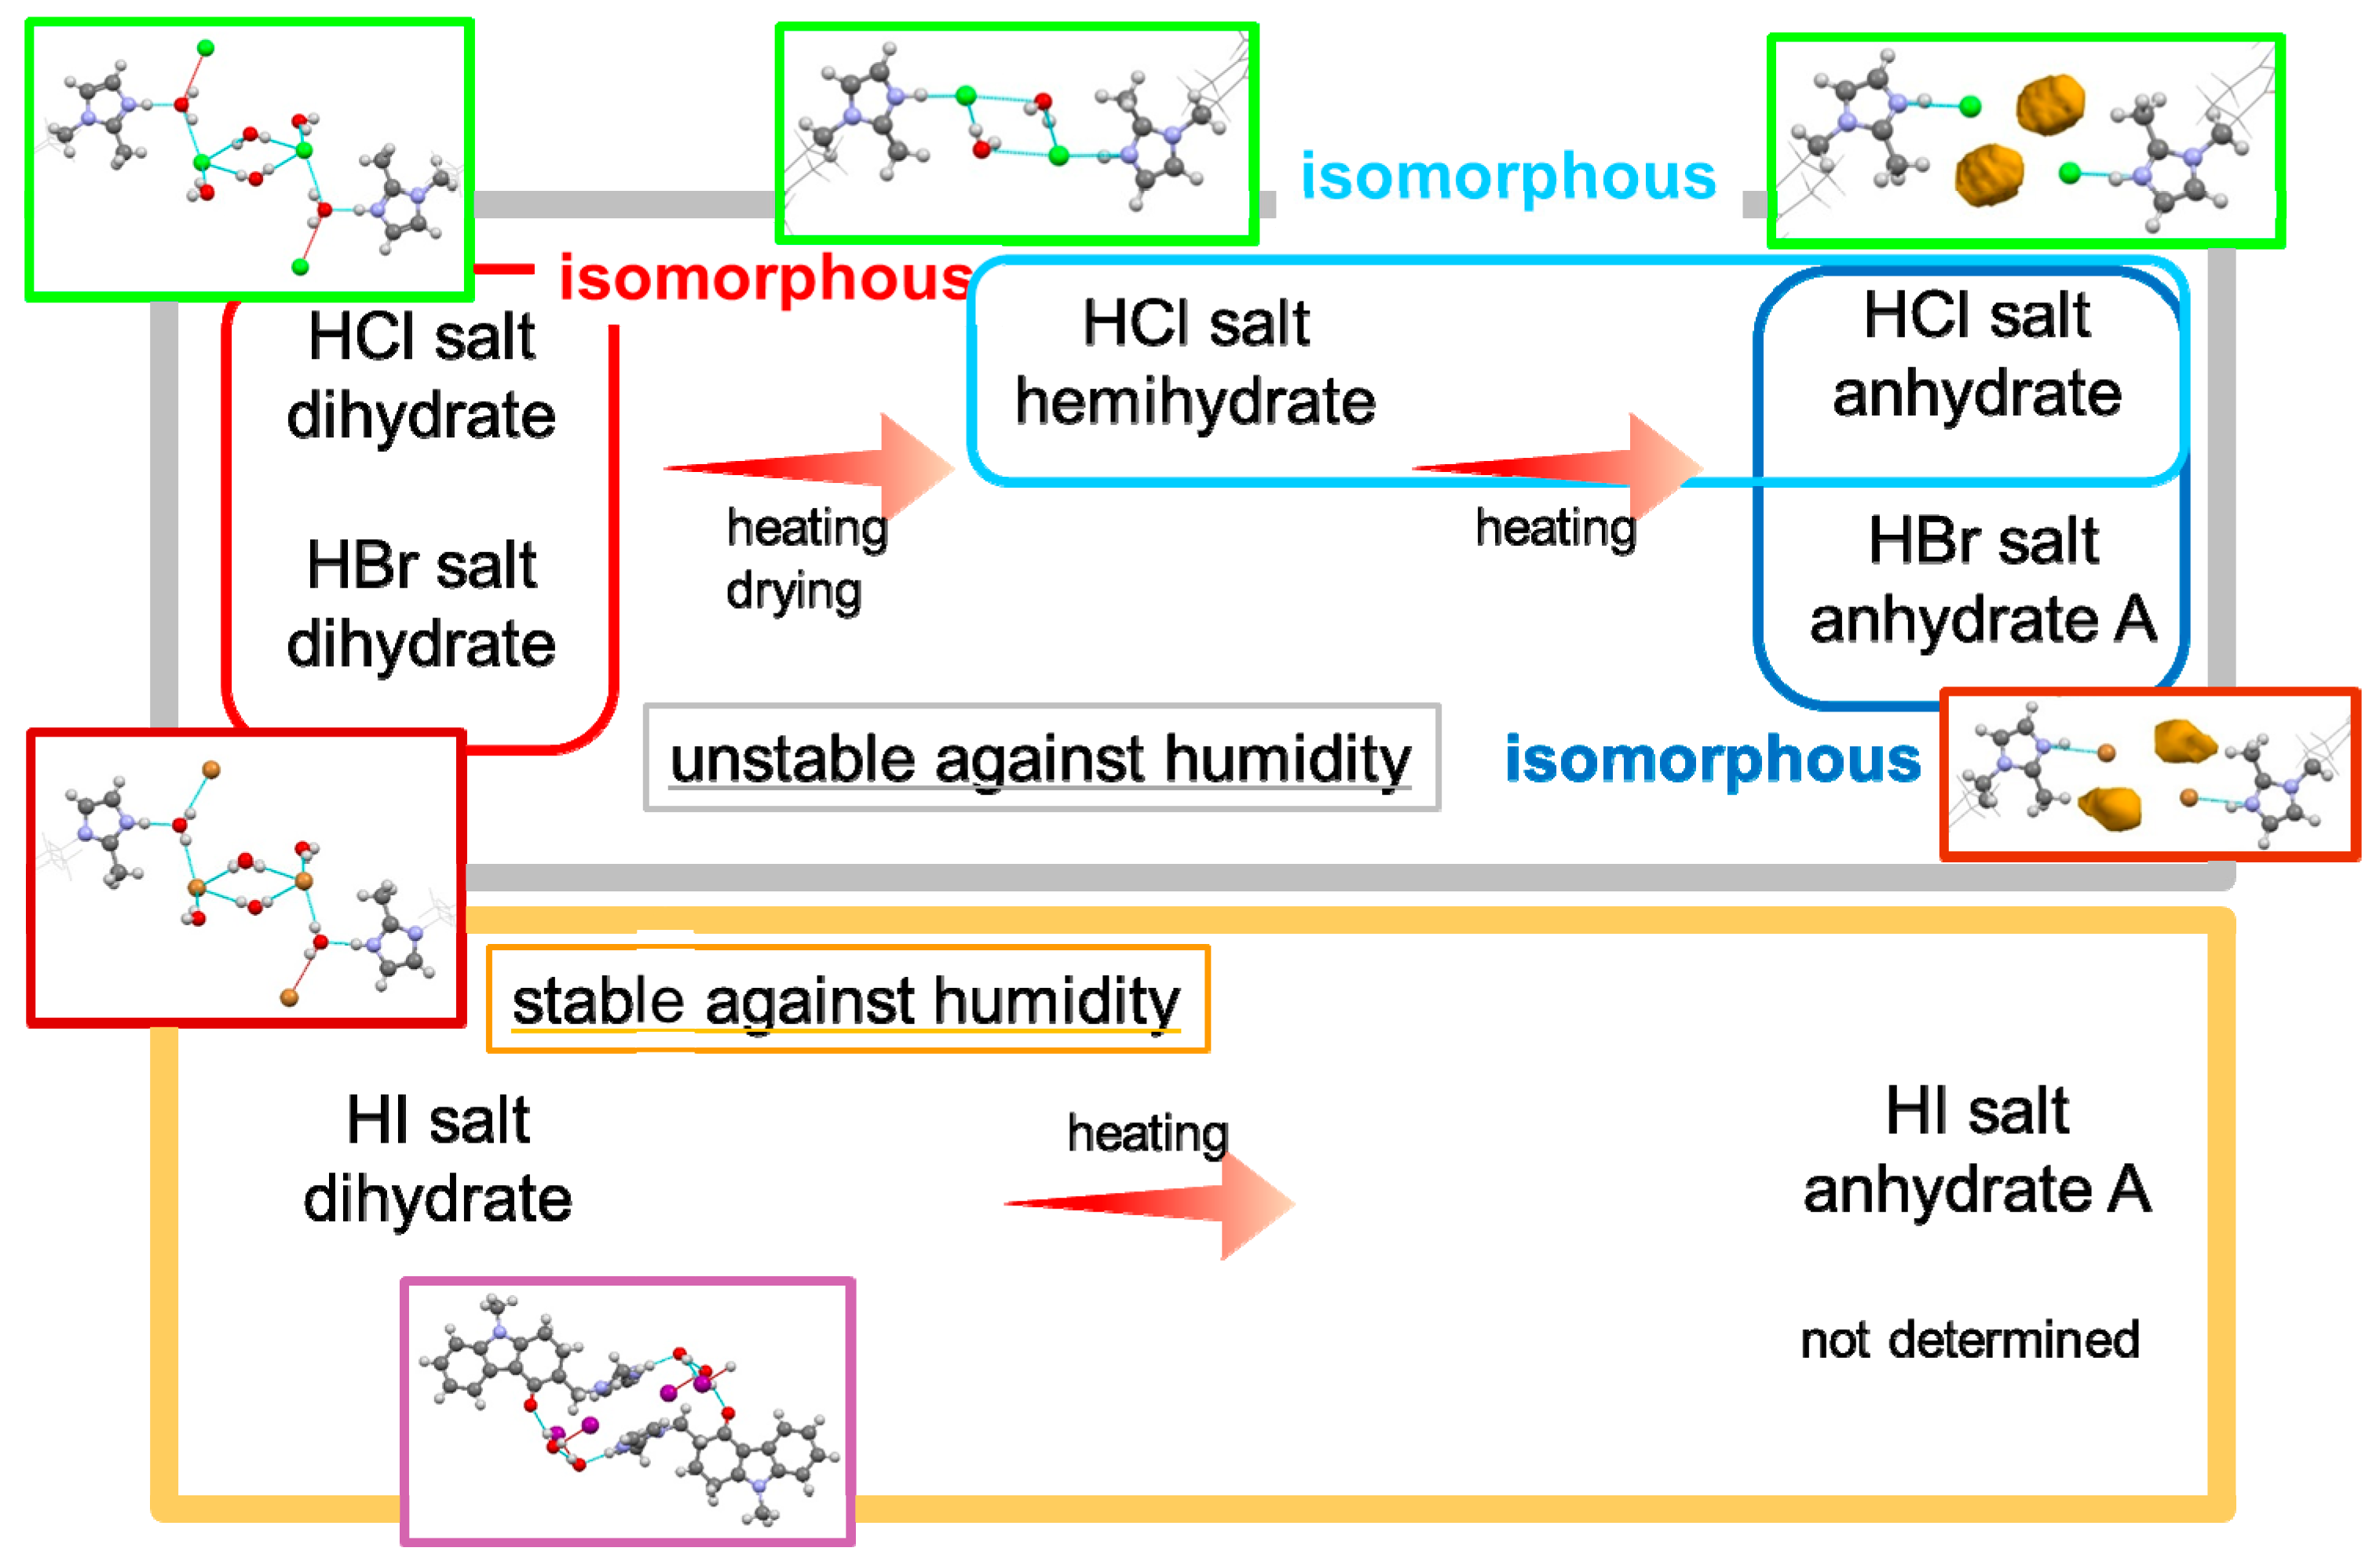
Synthesis of the ondansetron HBr salt and HI salt was successful. A schematic of the dehydration of ondansetron salts is shown in Figure 9.
Ondansetron HCl, HBr and HI salts formed dihydrates. The structures of ondansetron HCl and HBr dihydrates were isomorphous, while ondansetron HI dihydrate had a different structure. Ondansetron HBr did not exhibit the two-stage dehydration observed in the reaction of ondansetron HCl dihydrate despite the isomorphic crystal structures of the dihydrates, indicating that isomorphic polymorphs do not always show the same physicochemical properties. The ondansetron HI salt dihydrate was stable at varying levels of humidity, and was more stable than the HCl and HBr dihydrates. Their hydrophilic properties suggest that halogen anions likely form hydrogen bonds with water molecules. Exchange of the halogen anion contributed to and was effective for improving the hygroscopicity.
Ondansetron HBr anhydrate B and HI anhydrate A and B were stable at room environment although HCl anhydrate salt was unstable. Unfortunately, ondansetron HBr anhydrate B and HI anhydrate A were unstable at high humidity, and were therefore unsuitable as development forms. The crystal structures of both anhydrates were markedly different from that of the anhydrate of HCl salt, which was unstable at room environment and was difficult to isolate. These results also indicate that exchanging the halogen anion contributed to the changing of the crystal structure. Given that it is difficult to predict how a crystal structure will form and the resulting physical properties, a large amount of data is needed for the rational design of salt optimization.
5. Conclusions
Ondansetron HCl, HBr and HI salts were synthesized and formed dihydrates. The structures of ondansetron HCl and HBr dihydrates were isomorphous, while ondansetron HI dihydrate showed a different structure. Ondansetron HBr dihydrate did not exhibit the two-stage dehydration observed in the reaction of ondansetron HCl dihydrate despite the isomorphic crystal structures of the dihydrate forms, indicating that isomorphic polymorphs do not always show the same physicochemical properties. The ondansetron HI dihydrate salt was stable across varying levels of humidity, suggesting that it was more stable than HCl and HBr dihydrate salts. These results also indicate that the changing of halogen anions contributed to changing the crystal structure. Given that it is difficult to predict how a crystal structure will form and the resulting physical properties, a large among of data is needed for the rational design of salt optimization.
Supplementary Materials
The following are available online at https://0-www-mdpi-com.brum.beds.ac.uk/2073-4352/9/3/180/s1: Figure S1. Numbering of atoms for each crystal form; Figure S2. XRD patterns of ondansetron salts; Figure S3. DSC curves of ondansetron salts; Figure S4. TGA curves of ondansetron salts; Figure S5. XRD with heating measurement of HBr dihydrate using SPring-8 BL19B2; Figure S6. XRD with heating measurement of HI dihydrate using SPring-8 BL19B2; and Table S1. List of interactions observed in each crystal structure.
Author Contributions
The manuscript was written through contributions from all authors. All authors have approved the final version of manuscript.
Funding
A part of this work was supported by JSPS KAKENHI Grant Number JP17K05745 and JP18H04504.
Acknowledgments
The synchrotron radiation experiments were performed using the BL19B2 of SPring-8 with the approval of the Japan Synchrotron Radiation Research Institute (JASRI) (Proposal No. 2016B1838). The authors also appreciate Yukihito Sugano for his assistance with X-ray crystal structure analysis and deep discussion.
Conflicts of Interest
The authors declare no conflict of interest.
References
- Tong, W.-Q.T.; Whitesell, G. In Situ Salt Screening-A Useful Technique for Discovery Support and Preformulation Studies. Pharm. Dev. Technol. 1998, 3, 215–223. [Google Scholar] [CrossRef]
- Morissette, S.L.; Almarsson, Ö.; Peterson, M.L.; Remenar, J.F.; Read, M.J.; Lemmo, A.V.; Ellis, S.; Cima, M.J.; Gardner, C.R. High-throughput crystallization: Polymorphs, salts, co-crystals and solvates of pharmaceutical solids. Adv. Drug Deliv. Rev. 2004, 56, 275–300. [Google Scholar] [CrossRef] [PubMed]
- He, Y.; Orton, E.; Yang, D. The Selection of a Pharmaceutical Salt—The Effect of the Acidity of the Counterion on Its Solubility and Potential Biopharmaceutical Performance. J. Pharm. Sci. 2018, 107, 419–425. [Google Scholar] [CrossRef] [PubMed]
- Kim, H.; Gao, J.; Burgess, D.J. Evaluation of solvent effects on protonation using NMR spectroscopy: Implication in salt formation. Int. J. Pharm. 2009, 377, 105–111. [Google Scholar] [CrossRef]
- Bayliss, M.K.; Butler, J.; Feldman, P.L.; Green, D.V.S.; Leeson, P.D.; Palovich, M.R.; Taylor, A.J. Quality guidelines for oral drug candidates: Dose, solubility and lipophilicity. Drug Discovery Today 2016, 21, 1719–1727. [Google Scholar] [CrossRef] [PubMed]
- Serajuddin, A.T.M. Salt formation to improve drug solubility. Adv. Drug Deliv. Rev. 2007, 59, 603–616. [Google Scholar] [CrossRef]
- Diniz, L.F.; Carvalho, P.S.; de Melo, C.C.; Ellena, J. Reducing the Hygroscopicity of the Anti-Tuberculosis Drug (S,S)-Ethambutol Using Multicomponent Crystal Forms. Cryst. Growth Des. 2017, 17, 2622–2630. [Google Scholar] [CrossRef]
- Morissette, S.L.; Soukasene, S.; Levinson, D.; Cima, M.J.; Almarsson, Ö. Elucidation of crystal form diversity of the HIV protease inhibitor ritonavir by high-throughput crystallization. Proc. Natl. Acad. Sci. USA 2003, 100, 2180–2184. [Google Scholar] [CrossRef]
- Remenar, J.F.; MacPhee, J.M.; Larson, B.K.; Tyagi, V.A.; Ho, J.H.; McIlroy, D.A.; Hickey, M.B.; Shaw, P.B.; Almarsson, Ö. Salt Selection and Simultaneous Polymorphism Assessment via High-Throughput Crystallization: The Case of Sertraline. Org. Process. Res. Dev. 2003, 7, 990–996. [Google Scholar] [CrossRef]
- Bauer, J.; Spanton, S.; Henry, R.; Quick, J.; Dziki, W.; Porter, W.; Morris, J. Ritonavir: An Extraordinary Example of Conformational Polymorphism. Pharm. Res. 2001, 18, 859–866. [Google Scholar] [CrossRef]
- Thakral, N.K.; Kelly, R.C. Salt disproportionation: A material science perspective. Int. J. Pharm. 2017, 520, 228–240. [Google Scholar] [CrossRef] [PubMed]
- Tieger, E.; Kiss, V.; Pokol, G.; Finta, Z.; Dusek, M.; Rohlicek, J.; Skorepova, E.; Brazda, P. Studies on the crystal structure and arrangement of water in sitagliptin L-tartrate hydrates. Crystengcomm 2016, 18, 3819–3831. [Google Scholar] [CrossRef]
- Grobelny, P.; Mukherjee, A.; Desiraju, G.R. Polymorphs and hydrates of Etoricoxib, a selective COX-2 inhibitor. Crystengcomm 2012, 14, 5785–5794. [Google Scholar] [CrossRef]
- Bond, A.D.; Cornett, C.; Larsen, F.H.; Qu, H.; Raijada, D.; Rantanen, J. Structural basis for the transformation pathways of the sodium naproxen anhydrate–hydrate system. Iucrj 2014, 1, 328–337. [Google Scholar] [CrossRef] [PubMed]
- Noguchi, S.; Miura, K.; Fujiki, S.; Iwao, Y.; Itai, S. Clarithromycin form I determined by synchrotron X-ray powder diffraction. Acta Crystallogr. Sect. C 2012, 68, o41–o44. [Google Scholar] [CrossRef]
- Colombo, V.; Masciocchi, N.; Palmisano, G. Crystal Chemistry of the Antibiotic Doripenem. J. Pharm. Sci. 2014, 103, 3641–3647. [Google Scholar] [CrossRef]
- Kobayashi, K.; Fukuhara, H.; Hata, T.; Sekine, A.; Uekusa, H.; Ohashi, Y. Physicochemical and Crystal Structure Analyses of the Antidiabetic Agent Troglitazone. Chem. Pharm. Bull. 2003, 51, 807–814. [Google Scholar] [CrossRef] [PubMed]
- Fujii, K.; Aoki, M.; Uekusa, H. Solid-State Hydration/Dehydration of Erythromycin A Investigated by ab Initio Powder X-ray Diffraction Analysis: Stoichiometric and Nonstoichiometric Dehydrated Hydrate. Cryst. Growth Des. 2013, 13, 2060–2066. [Google Scholar] [CrossRef]
- Fujii, K.; Uekusa, H.; Itoda, N.; Yonemochi, E.; Terada, K. Mechanism of Dehydration-Hydration Processes of Lisinopril Dihydrate Investigated by ab Initio Powder X-ray Diffraction Analysis. Cryst. Growth Des. 2012, 12, 6165–6172. [Google Scholar] [CrossRef]
- Brown, G.W.; Paes, D.; Bryson, J.; Freeman, A.J. The effectiveness of a single intravenous dose of ondansetron. Oncology 1992, 49, 273–278. [Google Scholar] [CrossRef] [PubMed]
- Collin, S.; Moureau, F.; Quintero, M.G.; Vercauteren, D.P.; Evrard, G.; Durant, F. Stereoelectronic requirements of benzamide 5HT3 antagonists. Comparison with D2 antidopaminergic analogues. J. Chem. Soc. Perkin Trans. 1995, 2, 77–84. [Google Scholar] [CrossRef]
- Mizoguchi, R.; Uekusa, H. Elucidating the Dehydration Mechanism of Ondansetron Hydrochloride Dihydrate with a Crystal Structure. Cryst. Growth Des. 2018, 18, 6142–6149. [Google Scholar] [CrossRef]
- Sheldrick, G.M. SHELXT—Integrated space-group and crystalstructure determination. Acta Crystallogr. Sect. A 2015, A71, 3–8. [Google Scholar] [CrossRef]
- Neumann, M. X-Cell: A novel indexing algorithm for routine tasks and difficult cases. J. Appl. Crystallogr. 2003, 36, 356–365. [Google Scholar] [CrossRef]
- Sun, H.; Jin, Z.; Yang, C.; Akkermans, R.L.C.; Robertson, S.H.; Spenley, N.A.; Miller, S.; Todd, S.M. COMPASS II: Extended coverage for polymer and drug-like molecule databases. J. Mol. Model. 2016, 22, 47. [Google Scholar] [CrossRef] [PubMed]
- Engel, G.E.; Wilke, S.; Konig, O.; Harris, K.D.M.; Leusen, F.J.J. PowderSolve—A complete package for crystal structure solution from powder diffraction patterns. J. Appl. Crystallogr. 1999, 32, 1169–1179. [Google Scholar] [CrossRef]
- Veldhuizen, D.A.V.; Lamont, G.B. Multiobjective Evolutionary Algorithms: Analyzing the State-of-the-Art. Evol. Comput. 2000, 8, 125–147. [Google Scholar] [CrossRef] [PubMed]
- Osaka, K.; Matsumoto, T.; Miura, K.; Sato, M.; Hirosawa, I.; Watanabe, Y. The Advanced Automation for Powder Diffraction toward Industrial Application. AIP Conf. Proc. 2010, 1234, 9–12. [Google Scholar] [CrossRef]
- Jia, Y.Q. Crystal radii and effective ionic radii of the rare earth ions. J. Solid State Chem. 1991, 95, 184–187. [Google Scholar] [CrossRef]
- Chakraborty, S.; Dutta, R.; Arunachalam, M.; Ghosh, P. Encapsulation of [X2(H2O)4]2− (X = F/Cl) clusters by pyridyl terminated tripodal amide receptor in aqueous medium: Single crystal X-ray structural evidence. Dalton Trans. 2014, 43, 2061–2068. [Google Scholar] [CrossRef]
- Hoque, M.N.; Das, G. Overview of the strategic approaches for the solid-state recognition of hydrated anions. CrystEngComm 2017, 19, 1343–1360. [Google Scholar] [CrossRef]
Figure 1.
Results of single crystal structure analysis of the hydrogen bonding network in the (A,C) HBr salt, and (B,D) HI salt, and π-π stacking interactions in the (E) HBr salt and (D,F) HI salt.
Figure 1.
Results of single crystal structure analysis of the hydrogen bonding network in the (A,C) HBr salt, and (B,D) HI salt, and π-π stacking interactions in the (E) HBr salt and (D,F) HI salt.

Figure 2.
Thermal behavior of ondansetron salts. (A) HBr dihydrate and (B) HI dihydrate. Solid line indicates the differential scanning calorimetry (DSC) curve, dashed line indicates the thermogravimetric (TG) curve. Temperature on the DSC curve indicates the peak top temperature.
Figure 2.
Thermal behavior of ondansetron salts. (A) HBr dihydrate and (B) HI dihydrate. Solid line indicates the differential scanning calorimetry (DSC) curve, dashed line indicates the thermogravimetric (TG) curve. Temperature on the DSC curve indicates the peak top temperature.

Figure 3.
Variable temperature (VT)-X-ray diffraction scanning results for ondansetron (A) HBr dihydrate and (B) HI dihydrate. Patterns of the dihydrate (red), anhydrate A (blue), anhydrate B (purple) are shown.
Figure 3.
Variable temperature (VT)-X-ray diffraction scanning results for ondansetron (A) HBr dihydrate and (B) HI dihydrate. Patterns of the dihydrate (red), anhydrate A (blue), anhydrate B (purple) are shown.

Figure 4.
Reversibility after heating was confirmed from X-ray diffraction patterns. Red indicates the dihydrate diffraction pattern, and blue indicates the anhydrate diffraction pattern. (A) HBr salt and (B) HI salt.
Figure 4.
Reversibility after heating was confirmed from X-ray diffraction patterns. Red indicates the dihydrate diffraction pattern, and blue indicates the anhydrate diffraction pattern. (A) HBr salt and (B) HI salt.

Figure 5.
Comparison of anhydrate crystal forms. (A–C) Hydrogen bonding network, (D–F) π-π stacking interaction, and (G–I) B axis-projected view. (A,D,G) Anhydrate A of HBr, (B,E,H) anhydrate B of HBr, and (C,F,I) anhydrate B of HI.
Figure 5.
Comparison of anhydrate crystal forms. (A–C) Hydrogen bonding network, (D–F) π-π stacking interaction, and (G–I) B axis-projected view. (A,D,G) Anhydrate A of HBr, (B,E,H) anhydrate B of HBr, and (C,F,I) anhydrate B of HI.

Figure 6.
Hygroscopicity of ondansetron salts dihydrate at 25 °C. (A) Hydrobromide dihydrate and (B) hydroiodide dihydrate.
Figure 6.
Hygroscopicity of ondansetron salts dihydrate at 25 °C. (A) Hydrobromide dihydrate and (B) hydroiodide dihydrate.

Figure 7.
Hygroscopicity of ondansetron salts anhydrates at 25 °C. (A) Hydrobromide anhydrate B, (B) hydroiodide anhydrate A, and (C) hydroiodide anhydrate B.
Figure 7.
Hygroscopicity of ondansetron salts anhydrates at 25 °C. (A) Hydrobromide anhydrate B, (B) hydroiodide anhydrate A, and (C) hydroiodide anhydrate B.

Figure 8.
Identification of the intermediate using thermogravimetric analysis. (A) The thermogravimetric analysis (TGA) curve (blue) was overwritten by the derivation of the TGA curve (orange). (B) Change in weight (%) at different temperatures: 40 °C (green), 45 °C (red), and 50 °C (blue). The magnitude of weight loss (about 9%) was equivalent to the weight of water in the dihydrate.

Figure 9.
Schematic representation of the dehydration tendency of ondansetron salts.


Table 1.
Crystal graphic parameters of the ondansetron HCl salt, HBr salt and HI salt.
| HCl salt (YILGAB [21]) | HBr salt dihydrate | HBr salt anhydrate A | HBr salt anhydrate B | HI salt dihydrate | HI salt anhydrate B | |
|---|---|---|---|---|---|---|
| Chemical formula | C18H20ClN3O 2H2O | C18H20BrN3O 2H2O | C18H20BrN3O | C18H20BrN3O | C18H20IN3O 2H2O | C18H20IN3O |
| Crystal system | Monoclinic | Monoclinic | Monoclinic | Monoclinic | Triclinic | Monoclinic |
| Space group | P21/c | P21/c | P21/c | P21/c | P-1 | P21/c |
| Temp. (K) | 298 | 93 | 413 | 298 | 93 | 93 |
| a (Å) | 15.082 (3) | 15.19912 (12) | 14.7114 (23) | 13.1939 (22) | 7.69854 (14) | 13.4834 (4) |
| b (Å) | 9.741 (3) | 9.66181 (8) | 9.8069 (16) | 8.7052 (14) | 8.42520 (15) | 8.44016 (19) |
| c (Å) | 12.734 (3) | 12.69645 (12) | 13.1735 (21) | 15.1708 (26) | 15.6102 (3) | 15.7830 (4) |
| α (°) | 90.0000 | 90.0000 | 90.0000 | 90.0000 | 90.2705 (14) | 90.0000 |
| β (°) | 100.83 (1) | 100.6910 (8) | 114.1036 (8) | 104.1480 (3) | 96.0841 (15) | 111.035 (3) |
| γ (°) | 90.0000 | 90.0000 | 90.0000 | 90.0000 | 107.9273 (17) | 90.0000 |
| V (Å 3) | 1837.5 (8) | 1832.12 (3) | 1734.9 (5) | 1689.6 (5) | 957.17 (3) | 1676.45(8) |
| Z | 4 | 4 | 4 | 4 | 2 | 4 |
| Radiation type | Cu Kα | Cu Kα | Synchrotron (λ = 1.0000) | Synchrotron (λ = 1.0000) | Cu Kα | Cu Kα |
| R[F2>2σ(F2)] | 0.07 | 0.061 | - | - | 0.026 | 0.041 |
| wR(F2) | - | 0.196 | - | - | 0.068 | 0.107 |
| No. of reflections | 3219- | 3590 | - | - | 3689 | 3294 |
| No. of parameters | - | 240 | - | - | 240 | 210 |
| Rp (%) | - | 8.56 | 7.18 | - | - | |
| Rwp (%) | - | 14.35 | 12.11 | - | - | |
| Sample type | Single crystal | Single crystal | Powder | Powder | Single crystal | Single crystal |
| CCDC No. | (YILGAB) | 1893917 | 1893918 | 1893919 | 1893920 | 1893921 |
-: not obtained by a reference.
Table 2.
Comparison of parameters of the anhydrates of hydrochloride and hydrobromide.
| Hydrochloride [22] | Hydrobromide | |
|---|---|---|
| Distance between anions (Å) | 4.755 | 4.767 |
| Ion radius (Å) [29] | 1.81 | 1.96 |
| Void volume (Å3) | 6.1 | 1.3 |
| Unit cell volume (Å3) | 1751 | 1735 |
| Density (g/cm3) | 1.25 | 1.43 |
Both unit cells were determined at the same temperature (413 K).
© 2019 by the authors. Licensee MDPI, Basel, Switzerland. This article is an open access article distributed under the terms and conditions of the Creative Commons Attribution (CC BY) license (http://creativecommons.org/licenses/by/4.0/).
Share and Cite
MDPI and ACS Style
Mizoguchi, R.; Uekusa, H. Elucidation of the Crystal Structures and Dehydration Behaviors of Ondansetron Salts. Crystals 2019, 9, 180. https://0-doi-org.brum.beds.ac.uk/10.3390/cryst9030180
AMA Style
Mizoguchi R, Uekusa H. Elucidation of the Crystal Structures and Dehydration Behaviors of Ondansetron Salts. Crystals. 2019; 9(3):180. https://0-doi-org.brum.beds.ac.uk/10.3390/cryst9030180
Chicago/Turabian StyleMizoguchi, Ryo, and Hidehiro Uekusa. 2019. "Elucidation of the Crystal Structures and Dehydration Behaviors of Ondansetron Salts" Crystals 9, no. 3: 180. https://0-doi-org.brum.beds.ac.uk/10.3390/cryst9030180
Note that from the first issue of 2016, this journal uses article numbers instead of page numbers. See further details here.