Monochromatic Depolarizer Based on Liquid Crystal
by
 , , ,
, , ,
Paweł Marć
* ,
,
Noureddine Bennis
, 
Anna Spadło
,
Aleksandra Kalbarczyk
,
Rafał Węgłowski
,
Katarzyna Garbat
and
Leszek R. Jaroszewicz
Faculty of New Technologies and Chemistry, Military University of Technology, 2 gen. S. Kaliskiego St., 00-908 Warsaw, Poland
*
Author to whom correspondence should be addressed.
Crystals 2019, 9(8), 387; https://0-doi-org.brum.beds.ac.uk/10.3390/cryst9080387
Submission received: 24 May 2019
/
Revised: 17 July 2019
/
Accepted: 22 July 2019
/
Published: 28 July 2019
(This article belongs to the Special Issue Liquid Crystal Optical Device)
Abstract
:Polarization is a very useful parameter of a light beam in many optical measurements. Improvement of holographic systems requires optical elements which need a diffused and depolarized light beam. This paper describes a simple monochromatic depolarizer based on a pure vertically aligned liquid crystal without pretilt. In this work we present an extended description of depolarizer by analyzing its electro-optic properties measured in spatial and time domains with the use of crossed polarizers and polarimetric configurations. Crossed polarizers set-up provides information on spatial and temporal changes of microscopic textures while polarimetric measurement allows to measure voltage and time dependence of degree of polarization. Three different thicknesses, i.e., 5 μm, 10 μm and 15 μm have been manufactured in order to analyze another degree of freedom for this type of depolarizer device based on a liquid crystals’ material. Consideration of the light scattering capability of the cell is reported.
1. Introduction
Depolarized light is very useful in optical measurements continuously finding application as for example spatial diffused phase element in holography [1]. Commercially used light sources are polarized or at least partially polarized. However, in many spectroscopic devices it is desirable to work with unpolarized light. Therefore, special devices should be developed to depolarize it. In general, light can be depolarized by reflection from diffused media or transmission through specially designed birefringent or scattering optical elements. Light backscattered from materials with a high roughness is a good depolarizer [2,3,4] and carries valuable information on optical properties of illuminated surfaces [5,6]. However, it is difficult to use such light as a source due to random direction of reflected light. This makes necessity to use the lenses’ system in a detection unit because of a photodetector’s limited active area.
The most popular and currently used depolarizers are designed in two ways as spatially distributed linear retarders or a composition of at least two birefringent plates having optical thickness greater than coherence length of the broad band light source. Spatial birefringence distribution has brought common forms known as Cornu or wedge types of depolarizers [7], and spectral birefringence distribution as Lyot depolarizer [8]. They are used in both, bulk optic systems [1] and optical fiber systems, as well [9].
Narrow band and laser line sources are difficult to be depolarized and both mentioned above types of optical elements are insufficient to depolarize such light sources. Therefore, an effective depolarization of such light is performed by illumination of a transparent diffused material or an optical element having spatially distributed birefringence. In the first case the transmitted light is depolarized but optical losses increase sufficiently due to the scattering effect. In the latter every particular point of an output light beam is polarized but the mean Stokes vector integrated in the cross-section of the beam shows it as depolarized light. For this reason the process is named pseudo-depolarization.
Passive depolarizers and active depolarizers based on liquid crystals (LCs) were early identified as effective devices for light depolarization. Devices available commercially and described in the literature give possibility to depolarize both narrow and broad band light sources. It is made by using scattering properties or a spatially distributed birefringence of the used LC based materials. Scattering properties of silica nanoparticles in LCs matrix [10] and cholesteric LCs in a wedge configuration [11] were presented as effective depolarizers. Spatial distribution of birefringence in LCs’ polymers and different processes of LCs’ polymer alignment layers were shown, as well. A commercially available depolarizer of linearly polarized light consists of stripped patterns of microretarder arrays with variable orientations of fast axes. This array is manufactured with an LC polymer [12]. Other types of spatial distributed birefringence are based on modifications of alignment layers of standard LCs’ cells by using mechanical microrubbing [13], photoalignment [14], and homeotropic alignment by using surfactants [15] for selected nematic LCs.
The last configuration of the LCs was identified as an optical element with the best developing potential in designing an LC based depolarizer. Regarding the control of Vertically Aligned Nematic (VAN) cells by means of a substrate surface treatment, there are different methods for achieving better control of such device [15]. Any one of these methods has its advantages and disadvantages and what is useful for some applications may not be useful for another one. If the surface alignment layer is modified to have a given pretilt angle [16], then the LC directors will always have a predetermined reorientation upon switching by external electric field in order to find application in spatial light modulators. However, in the case of Pure VAN (PVAN) cell with zero pretilt, the local orientation of LC director will be undefined upon switching. In this case, the cell usually generates disordered birefringent medium related to undefined switching direction of molecules which produce random polarization of the transmitted light by LCs’ cell without scattering. Therefore, depolarization effect may be performed and the cell cannot be used for the phase control. However, it can be used as a depolarizer which is effective for either monochromatic light or light with any spectral range.
Most of depolarizers based on LCs described above are passive optical elements. Only devices with pure homeotropic LC director configuration allow to use LC electro-optic properties in order to tune degree of polarization (DOP) level by electric field [17]. In this paper we present an extended analysis of depolarization properties of PVAN cells. The key issue to use the above concept is to have a proper spatial distribution of birefringence upon switching. To reach this goal, a biopolymer alignment layer like deoxyribonucleic acid (DNA) derivatives crosslinked with surfactant complex such as hexadecyltrimethylammonium chloride (CTMA) needs to be used [15]. When the LC material is introduced close to the surface, LC molecules align parallel to hydrophobic tails of the surfactant surrounding the DNA, thereby aligning homeotropically with the surface.
In the first stage of the study depolarization effectiveness of the PVAN cells, DOP measurements were used. This parameter strongly depends on spatial distribution of birefringence [1,17] and spectral characteristics of light sources used in the experiments [18], as well. For this type of optical element the measured DOP depends on size of the incident beam and its input state of polarization (SOP). Therefore, a narrow band red line of the stabilized He-Ne laser has been used as a light source. All manufactured PVAN cells were characterized in frame of their electro-optic properties and were analyzed in spatial domain, as well as time domain by using crossed polarizers and polarimetric set-up. Additional measurement of Mueller matrices allows to characterize dichroic and birefringence properties of the manufactured PVAN cell. Real time control of micrographic images of PAVN cell gives information about long term stability of depolarization effect of the proposed device. This type of optical element was applied to validate depolarization sensitive interferometric system [19].
2. Technology of the PVAN Cell
2.1. Preparation of Biopolymer Alignment Layer
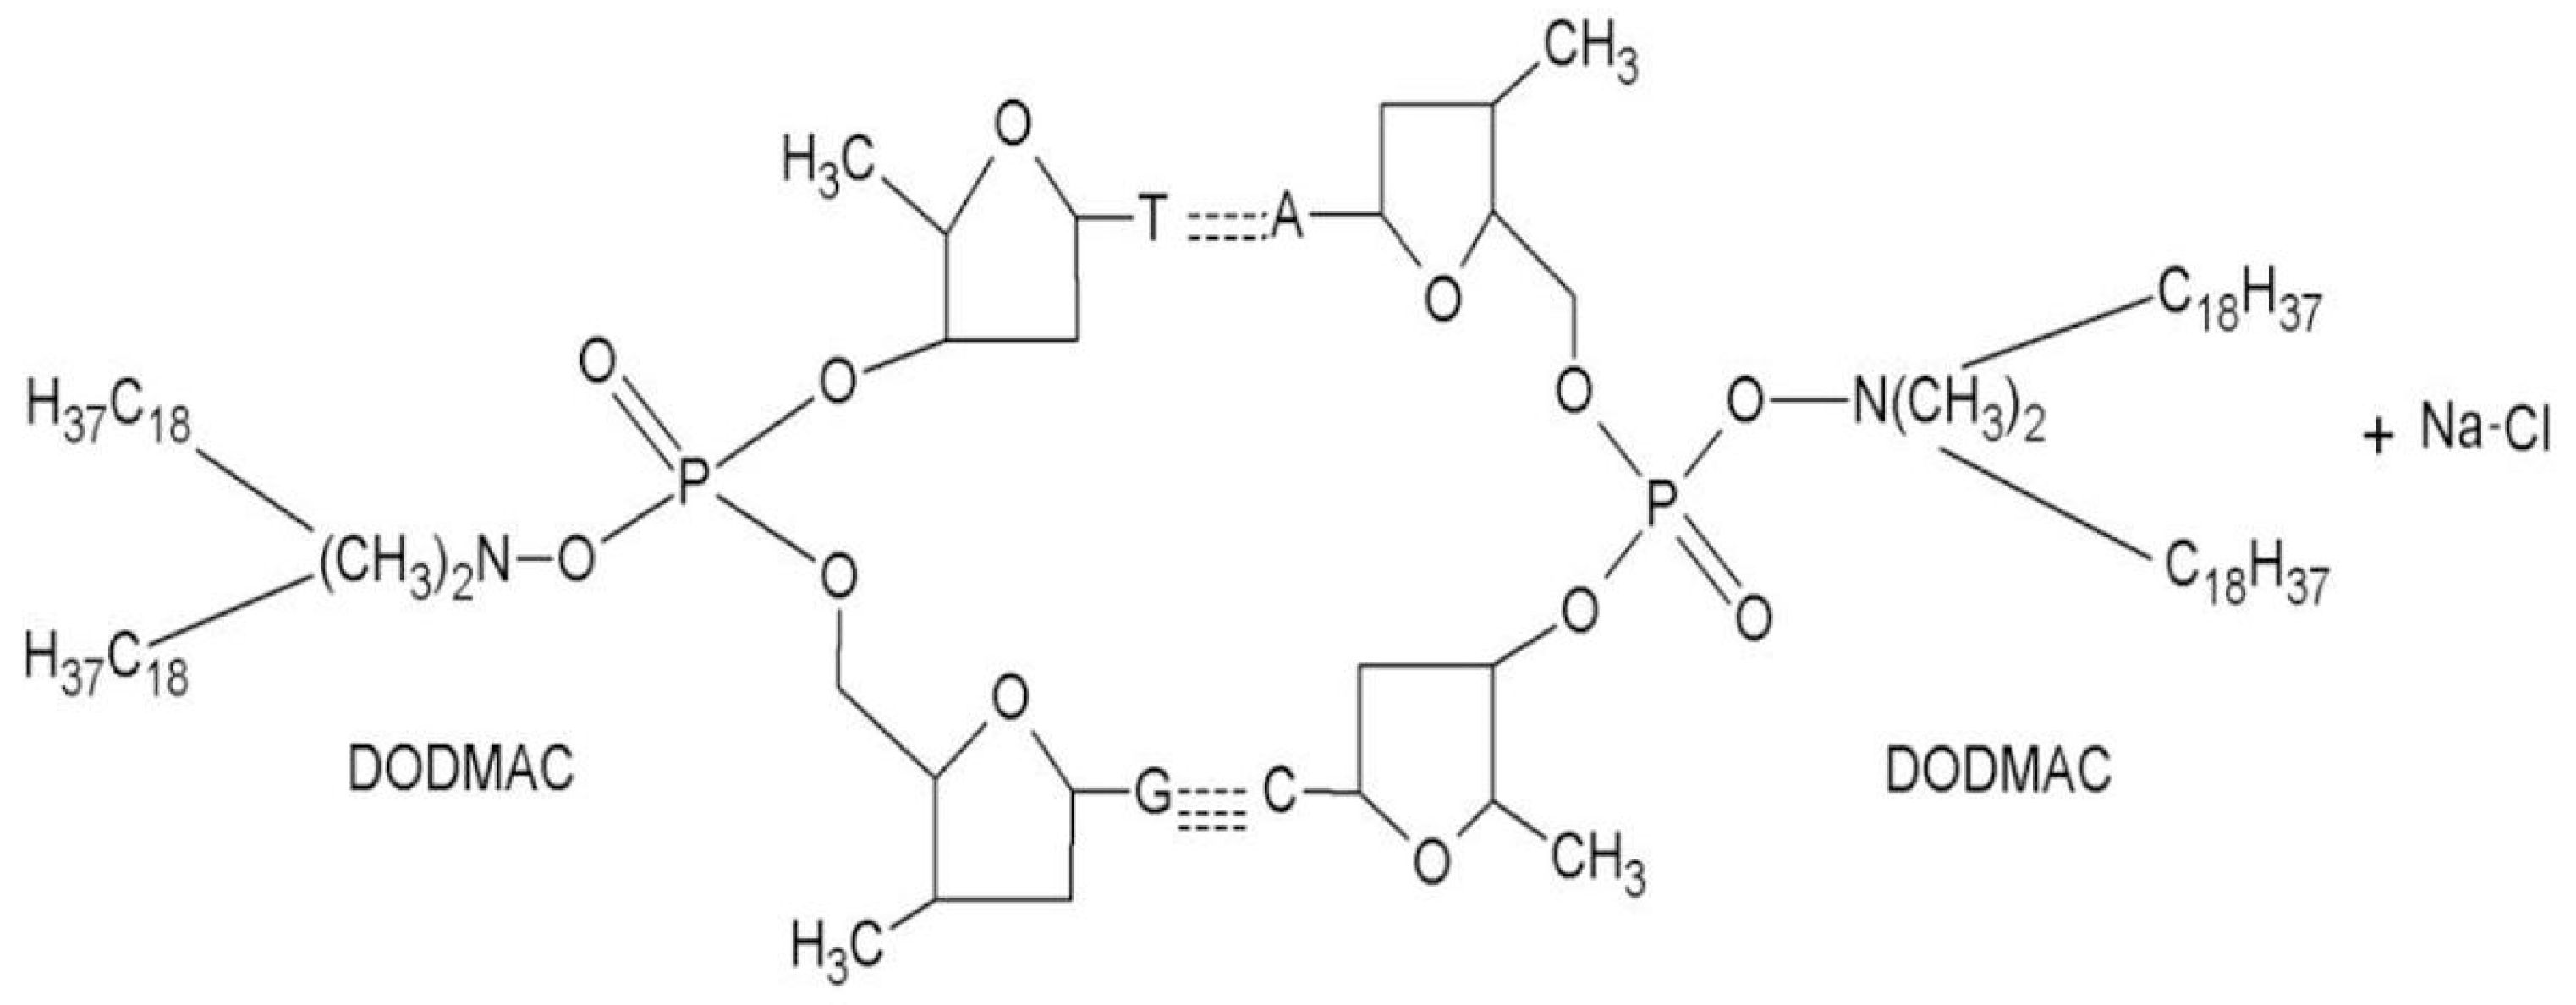
DNA-based biopolymer was used in this research with set of experiments in order to stabilize its aligning properties. The pure DNA, as a linear and unbranched biopolymer, is soluble only in aqueous solutions which is not compatible with typically devices fabrication processes. Definitely, it is convenient to deposit thin alignment layers of DNA complexed with a suitable cationic surfactant. Such modification makes surfactant complexes of DNA soluble only in organic solvents. Additionally, this alignment surface appears to be a stable at high processing temperatures with no visible degradation of the film. The required modification of DNA with some cationic surfactant complex (see Figure 1), such as hexadecyltrimethylammonium chloride (CTMA) or dimethyldioctadecylammonium chloride (DODMAC) was done based mainly on the procedure mentioned in references [20,21]. In the aqueous solution DNA with a cationic surfactant combine through ion exchange mechanism in which the sodium ions Na+ present in DNA salt back bone are replaced by surfactant groups [15] as is presented in Figure 1.
CTMA was chosen because it is a standard surfactant with a single aliphatic tail for technological applications of DNA complexes. The choice of DODMAC surfactant was motivated by its two long aliphatic tails supposed to more tightly fill the space around the DNA helix as compared to CTMA. Long alkyl chains of the cationic surfactant molecules are oriented perpendicular to the film plane and chiral DNA helices are oriented in the direction parallel to the film plane (perpendicular to the long alkyl chain) because of electrostatic attraction and thermodynamic stability [22].
The DNA conversion was performed according to the procedure in which the aqueous solution of the DNA polymer was added to an equal amount of the DODMAC aqueous solution and the precipitate was collected by filtration under vacuum and purified by rinsing with de-ionized water. DNA-DODMAC was dissolved in butanol and the solution was mixed in a glass bottle at 60 °C. Once completely dissolved, the solution was filtered through a 0.4 µm pore size syringe filter.
2.2. Manufacturing Process of the Cells
Test cells for DOP measurements were prepared using glass plates coated with conductive layer of Indium Thin Oxide (ITO) having resistivity of 20 Ohms/square. Monopixel of a 1 cm2 area was patterned in the ITO by photolithography process. DNA-DODMAC complex was dissolved in butanol at a concentration of 3 wt. %. The solution was spin coated onto the substrates. Then, the film was baked at 80 °C for 1 hour to remove residual solvent. The two substrates were assembled using epoxy glue and uniformly separated by 5 μm, 10 μm and 15 μm thick glass spacers. All cells were filled with the experimental LCs’ mixture having negative dielectric anisotropy described below.
2.3. Liquid Crystal Formulation
A high number of excellent nematic mixtures having positive dielectric anisotropy and high chemical stability have been formulated. However, very few mixtures with negative dielectric anisotropy have been developed. Commercially available stable nematic materials for VAN displays are mainly 1,2-difluorobenzene derivatives having Δn around 0.09. Efficient depolarizer based on the PVAN configuration requires sufficient retardance in the generated domains upon switching. In this case, LCs material with a relatively high birefringence will be needed, in order to achieve sufficient retardance at least π + 2 mπ for linear polarization and π/2 + mπ for circular polarization, for m = 0, 1,… [15]. As the potential exploitation of this device is related to LC properties, methods of their syntheses and performance improvements related to cell manufacturing are important. The LC mixture used in this work is an experimental mixture under code name of 2050 prepared by Military University of Technology of Warsaw, Poland. This mixture has been prepared through a three- component eutectic mixture (see Table 1). To increase birefringence, we selected laterally difluoro-substituted terphenyls Compound (I) [23,24]. They have fully aromatic structure with a negative dielectric anisotropy and exhibit excellent chemical and photochemical stability. Compounds (II) and (III) are very convenient components to decrease the melting point of three ring eutectic mixtures.
The resulting mixture 2050 has negative dielectric anisotropy and exhibits the following optical parameters measured at λ = 589 nm: ordinary index no = 1.5006, extraordinary index ne = 1.6273 and birefringence Δn = 0.1273. The phase sequence as a function of the temperature of the nematic mixture is Cr 0 < N <51.4 °C Iso. Temperature of phase transition between isotropic and nematic phase (clearing temperature) is around 51.4 °C.
Dielectric spectroscopy was performed to confirm the negative electric anisotropy of the proposed mixture. The procedure of this measurement is described in reference [25]. The electric anisotropy measured at room temperature (25 °C) and at the frequency of 1 kHz is about Δε = −0.8. This LC mixture shows a very low dielectric anisotropy since constituent compounds of the mixture do not contain strong polar groups like -CN or -NCS.
3. Electro-Optic Measurements
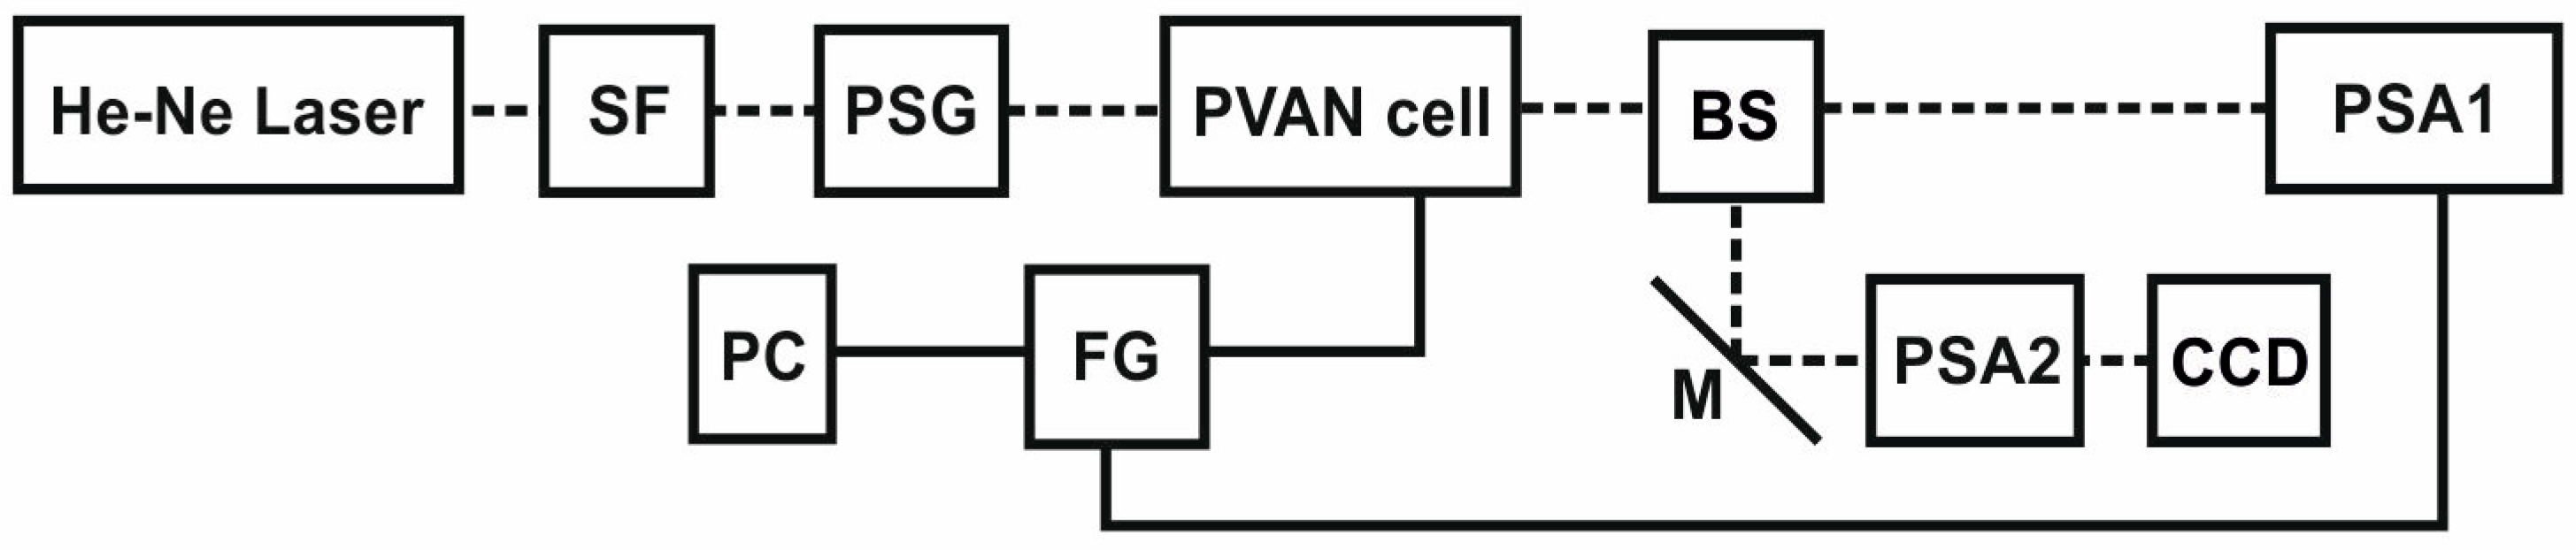
Polarimetric and crossed polarizers set-ups were used to study depolarization properties of manufactured PVAN cells. Both were integrated to use the same light source what was schematically presented in Figure 2. This set-up consists of spatial filter module (SF—Thorlabs), SOP generator (PSG—Thorlabs), beam splitter (BS—Thorlabs), mirror M, a pair of SOP analyzers PSA1 and PSA2 (PAX5710VIS, Thorlabs), CCD camera (DMK 72AUC02, The Imaging Source) and function generator (FG-Agilent), and personal computer (PC) as a control unit.
Laser light (He-Ne λ = 633 nm) illuminates the spatial filter module (SF) first. A Gaussian linearly polarized mode of He-Ne laser is transformed by SF to obtain light beam with homogeneous intensity and by using lenses and diaphragm the beam size is adjusted up to around 5mm of its outer diameter. Such beam passes through a SOP generator (PSG) which was assembled with a linear polarizer and a quarter waveplate. By using PSG, the manual adjustment of demanded input SOPs is possible. Light beam with selected SOP is next transmitted through the PVAN cell and polarization changes are measured by a SOP analyzer PSA1. Micrographs of the tested sample texture are taken by CCD camera after sequence reflections of a light beam from BS and M, and its passing through the second SOP analyzer PSA2. In the polarimetric part of the set-up as PSA1 the commercial PAX5710VIS polarimetric head (ThorLabs) was applied. PSG and PSA2 form the crossed polarizers’ part of the set-up because PSA2 is a simple linear analyzer. Function generator (FG) drives the tested LC cell to obtain its electro-optic characteristics. PC was used to operate FG, CCD and PSA1.
Voltage changes of the FG signal allow to induce an electric field inside the LC cell to reach birefringence spatial modulation [17]. Then, measured by PSA1 Stokes vector is a spatial integration of all SOPs present in the cross-section of the transmitted beam. Since this beam carries mixed SOPs the measured Stokes vector shows this light beam as a depolarized one.
For proper validation of depolarization properties of a PVAN cell in all further experiments as a driven signal was used square waveform with a 1 kHz frequency and its voltage was changed within the range of 0–10 V with an increment of 50 mV. Additionally, thickness of the PNAN cell was taken into account and there were tested samples with thicknesses of 5 μm, 10 μm and 15 μm. In each measurement, the tested sample was illuminated first by linear horizontal (H) SOP and full polarization characterization of this device another specific input SOPs were generated, i.e., another three linearly polarized with azimuth: vertical (V), at 45° and at −45°, and two circularly polarized with right (R) and left (L) handedness.
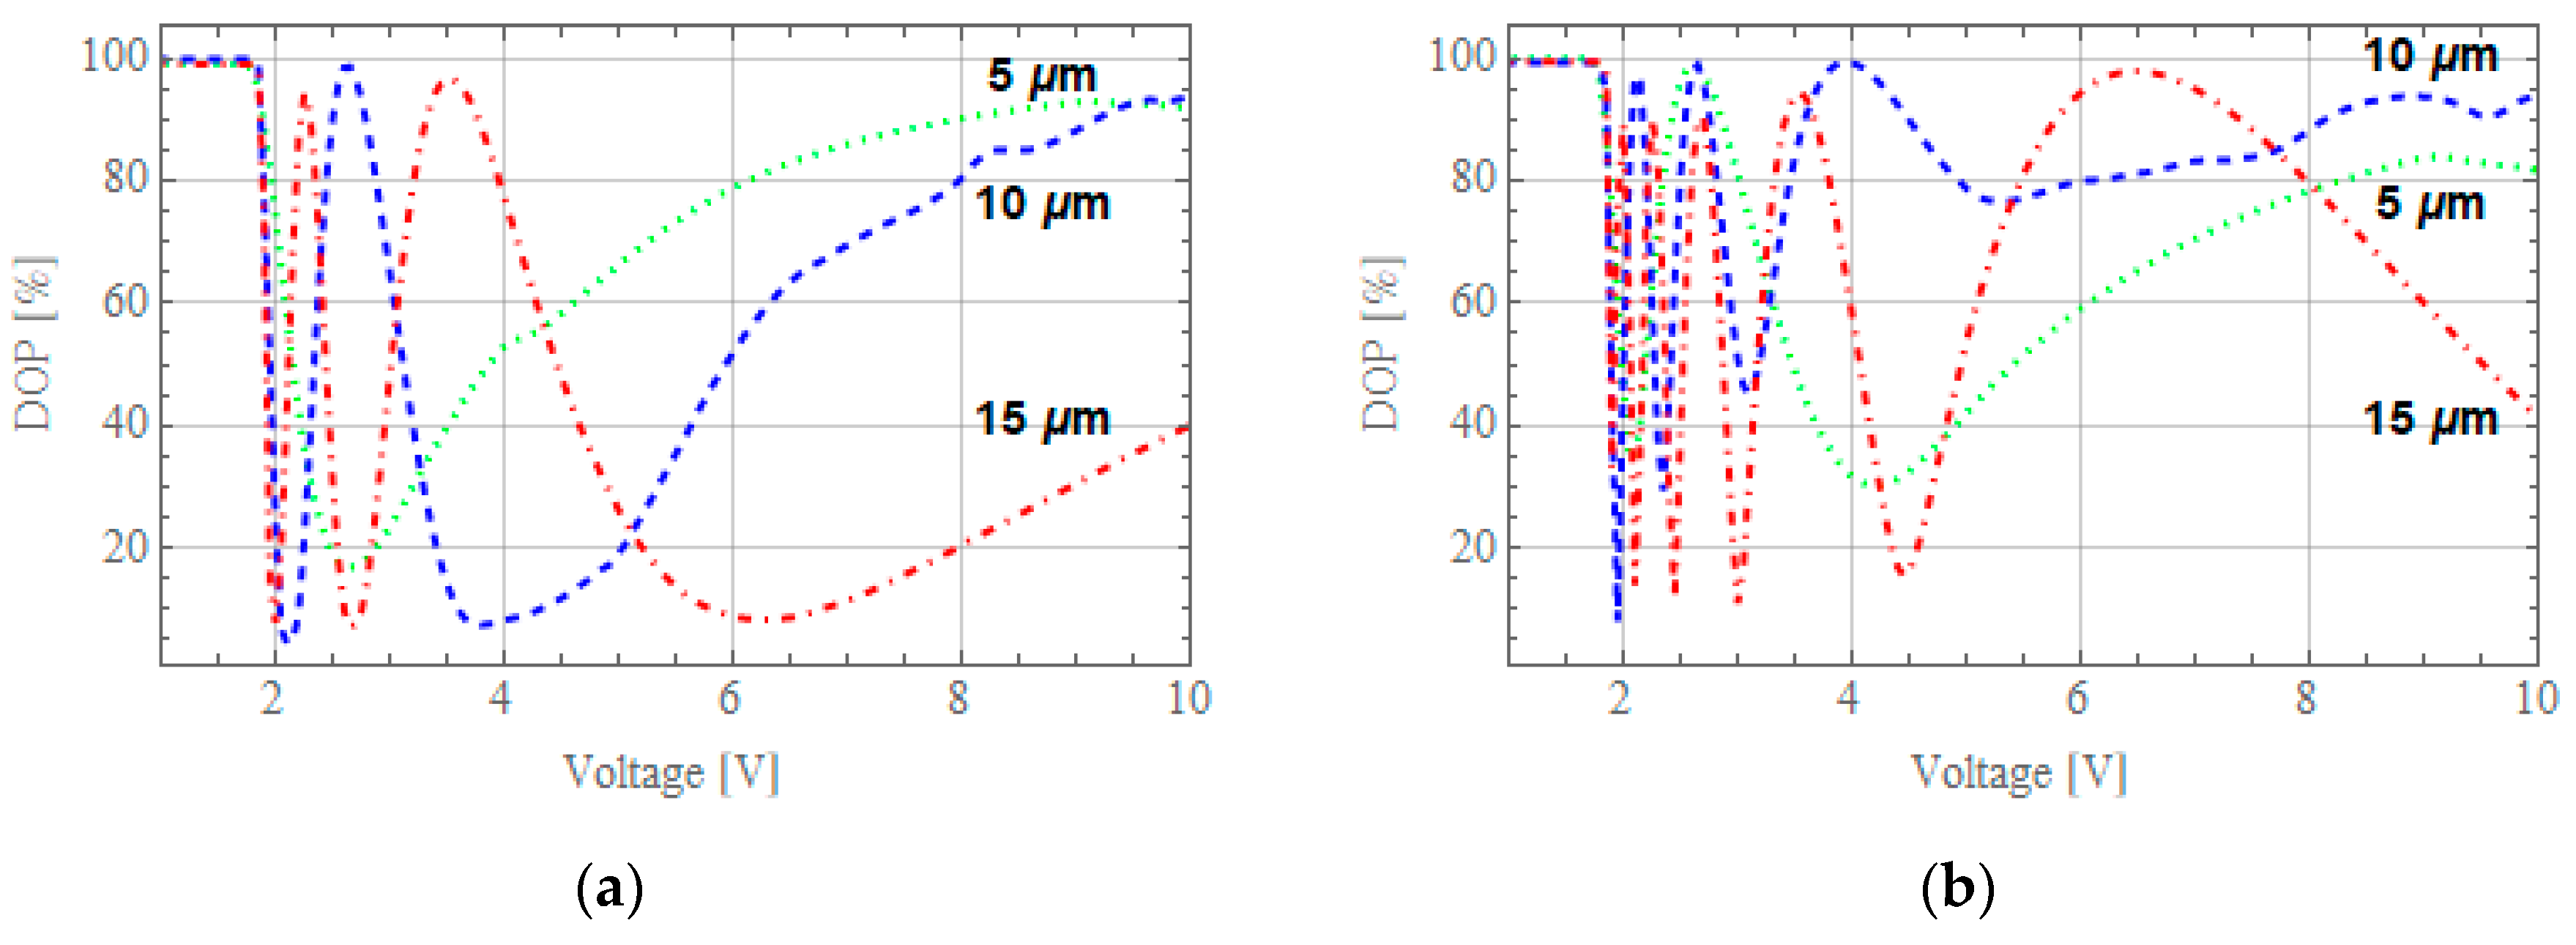
The above measurements allow to obtain Mueller matrices for full characterization of tested samples. However, as the first validation of PVAN cells’ principles of work, DOP changes for two representative input SOPs, i.e., H and R were presented in Figure 3, respectively.
The above presented DOP properties as a function of the applied voltage for LC response prove that PVAN cells are the effective depolarizers at certain values of voltages. This effectiveness has periodic character and with increasing thickness of the cell, the number of extremes increases proportionally. Number of minima doubles for circular R SOP (Figure 3b) comparing to H SOP (Figure 3a). However, DOP for linear SOP reaches lower values of minima than the circular one. This effect is related to induced by applied voltage linear birefringence of the used PVAN and is similar to results presented in [17]. As it was mentioned above, the DNA-surfactant film is expected as a promising homeotropic alignment film with rubbing-free. As result of the anchoring strength of homeotropic alignment is weak, therefore Freedericksz transition is soften to around 2 V [26].
Figure 3a,b shows that dynamics of DOP changes above this voltage increases sufficiently with LC thickness. For the sample with a thickness of 5 μm (Figure 3 green dotted line) the effectiveness of depolarization is the lowest and it has only one minimum for linear polarization and DOP is around 18% at 2.65 V (Figure 3a). For samples with thicknesses of 10 μm and 15 μm first minima appear just above the threshold voltages for both input polarizations. And for a 10 μm sample (blue dashed lines) DOP reaches its global minima for both input SOP, i.e., 4.4% at 2.1 V for horizontal and 8% at 1.95 V for right circular. In contrast for the sample with a thickness of 15 μm these minima are of 7% at 2.65 V and 11% at 3 V. These values suggest that the PVAN cell with a 10 μm thickness is the most effective among analyzed samples. Moreover, these measurement data show that PVAN cell with a 5 μm thickness is too thin to be used as an effective depolarizer and in further analysis this sample was excluded.
However, an extended analysis of depolarization properties requires measurement of Mueller matrices of a PVAN cell. Mueller matrix of an LCC sample allows to characterize losses, dichroism, birefringence, and depolarization [4,27]. In this paper, the first of these parameters was excluded from consideration because above Fréedericksz transition, all manufactured samples exhibit small total losses around 0.5 dB. Due to the fact that random orientation of molecules in such type of LCC induces a random fluctuation of the refractive index, the light scattering capability of the cell has to be investigated [28]. This effect was described as a small angle light scattering in [29], and its influence on depolarization properties of the PVAN cell is discussed at the end of this paper. To obtain information about next three parameters, the polar decomposition method was used [4,27,30]. The normalized experimentally Mueller matrix M in this model is a concatenation of three matrices MD, MR and MΔ which carries information about dichroism, birefringence and depolarization, respectively. This takes the following mathematical form of:
Depolarization properties of optical element beads on Mueller matrix can be calculated based on Matrix MΔ or directly from the experimental matrix M as average DOP (AvDOP) [4,27] and anisotropic depolarization degree (Add) [4]. In the paper, direct model and mentioned parameters are calculated by the following equations:
where: α and ε are azimuth and ellipticity of input SOP represented by Stokes vector S.
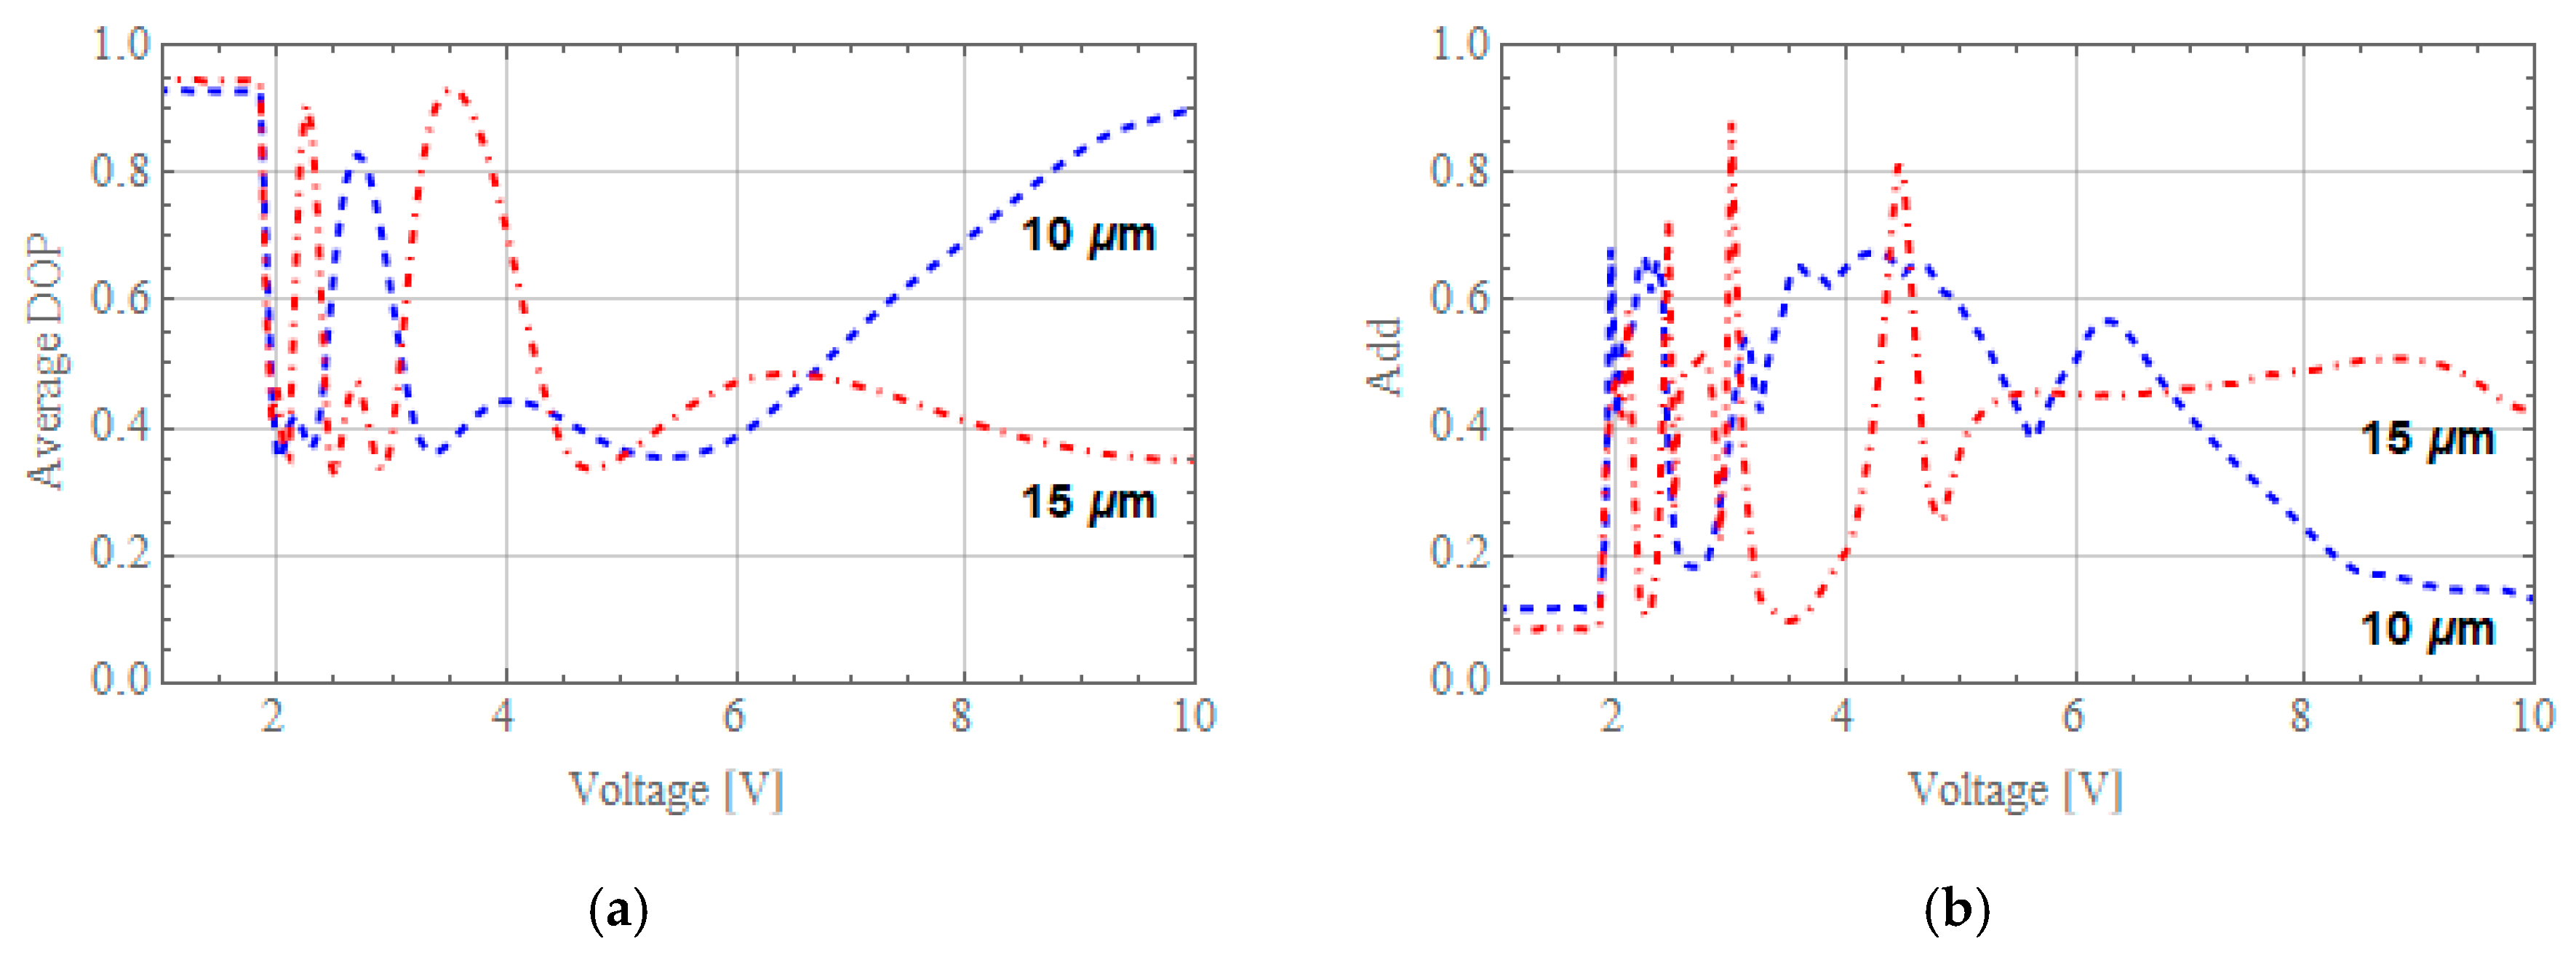
AvDOP is an integral of DOP calculated from output Stokes vector S′ which depends on general SOP of the input Stokes vector S and Mueller matrix M of the tested optical element. Non-depolarizing optical element has AvDOP = 1 and it is 0 for totally depolarizing element. Partial depolarizing devices have intermediate values. In Figure 4a these parameters for the tested PVAN cell with a thickness of 10 μm and 15 μm were presented. Add parameter is a cumulative information about anisotropy of the average DOP calculated as a relative difference of maximal and minimal values of AvDOP. Due to the fact that DOP characteristics presented in Figure 3 have different locations of minima and maxima for linear and circular input SOPs on a voltage scale, it is expected that tested samples can be considered as at least partially anisotropic element. Therefore, it is reasonable to calculate Add parameter. In this case Add = 0 means that the depolarizer is isotropic and Add = 1 means that it is totally anisotropic. In Figure 4b Add parameters of the tested samples are presented.
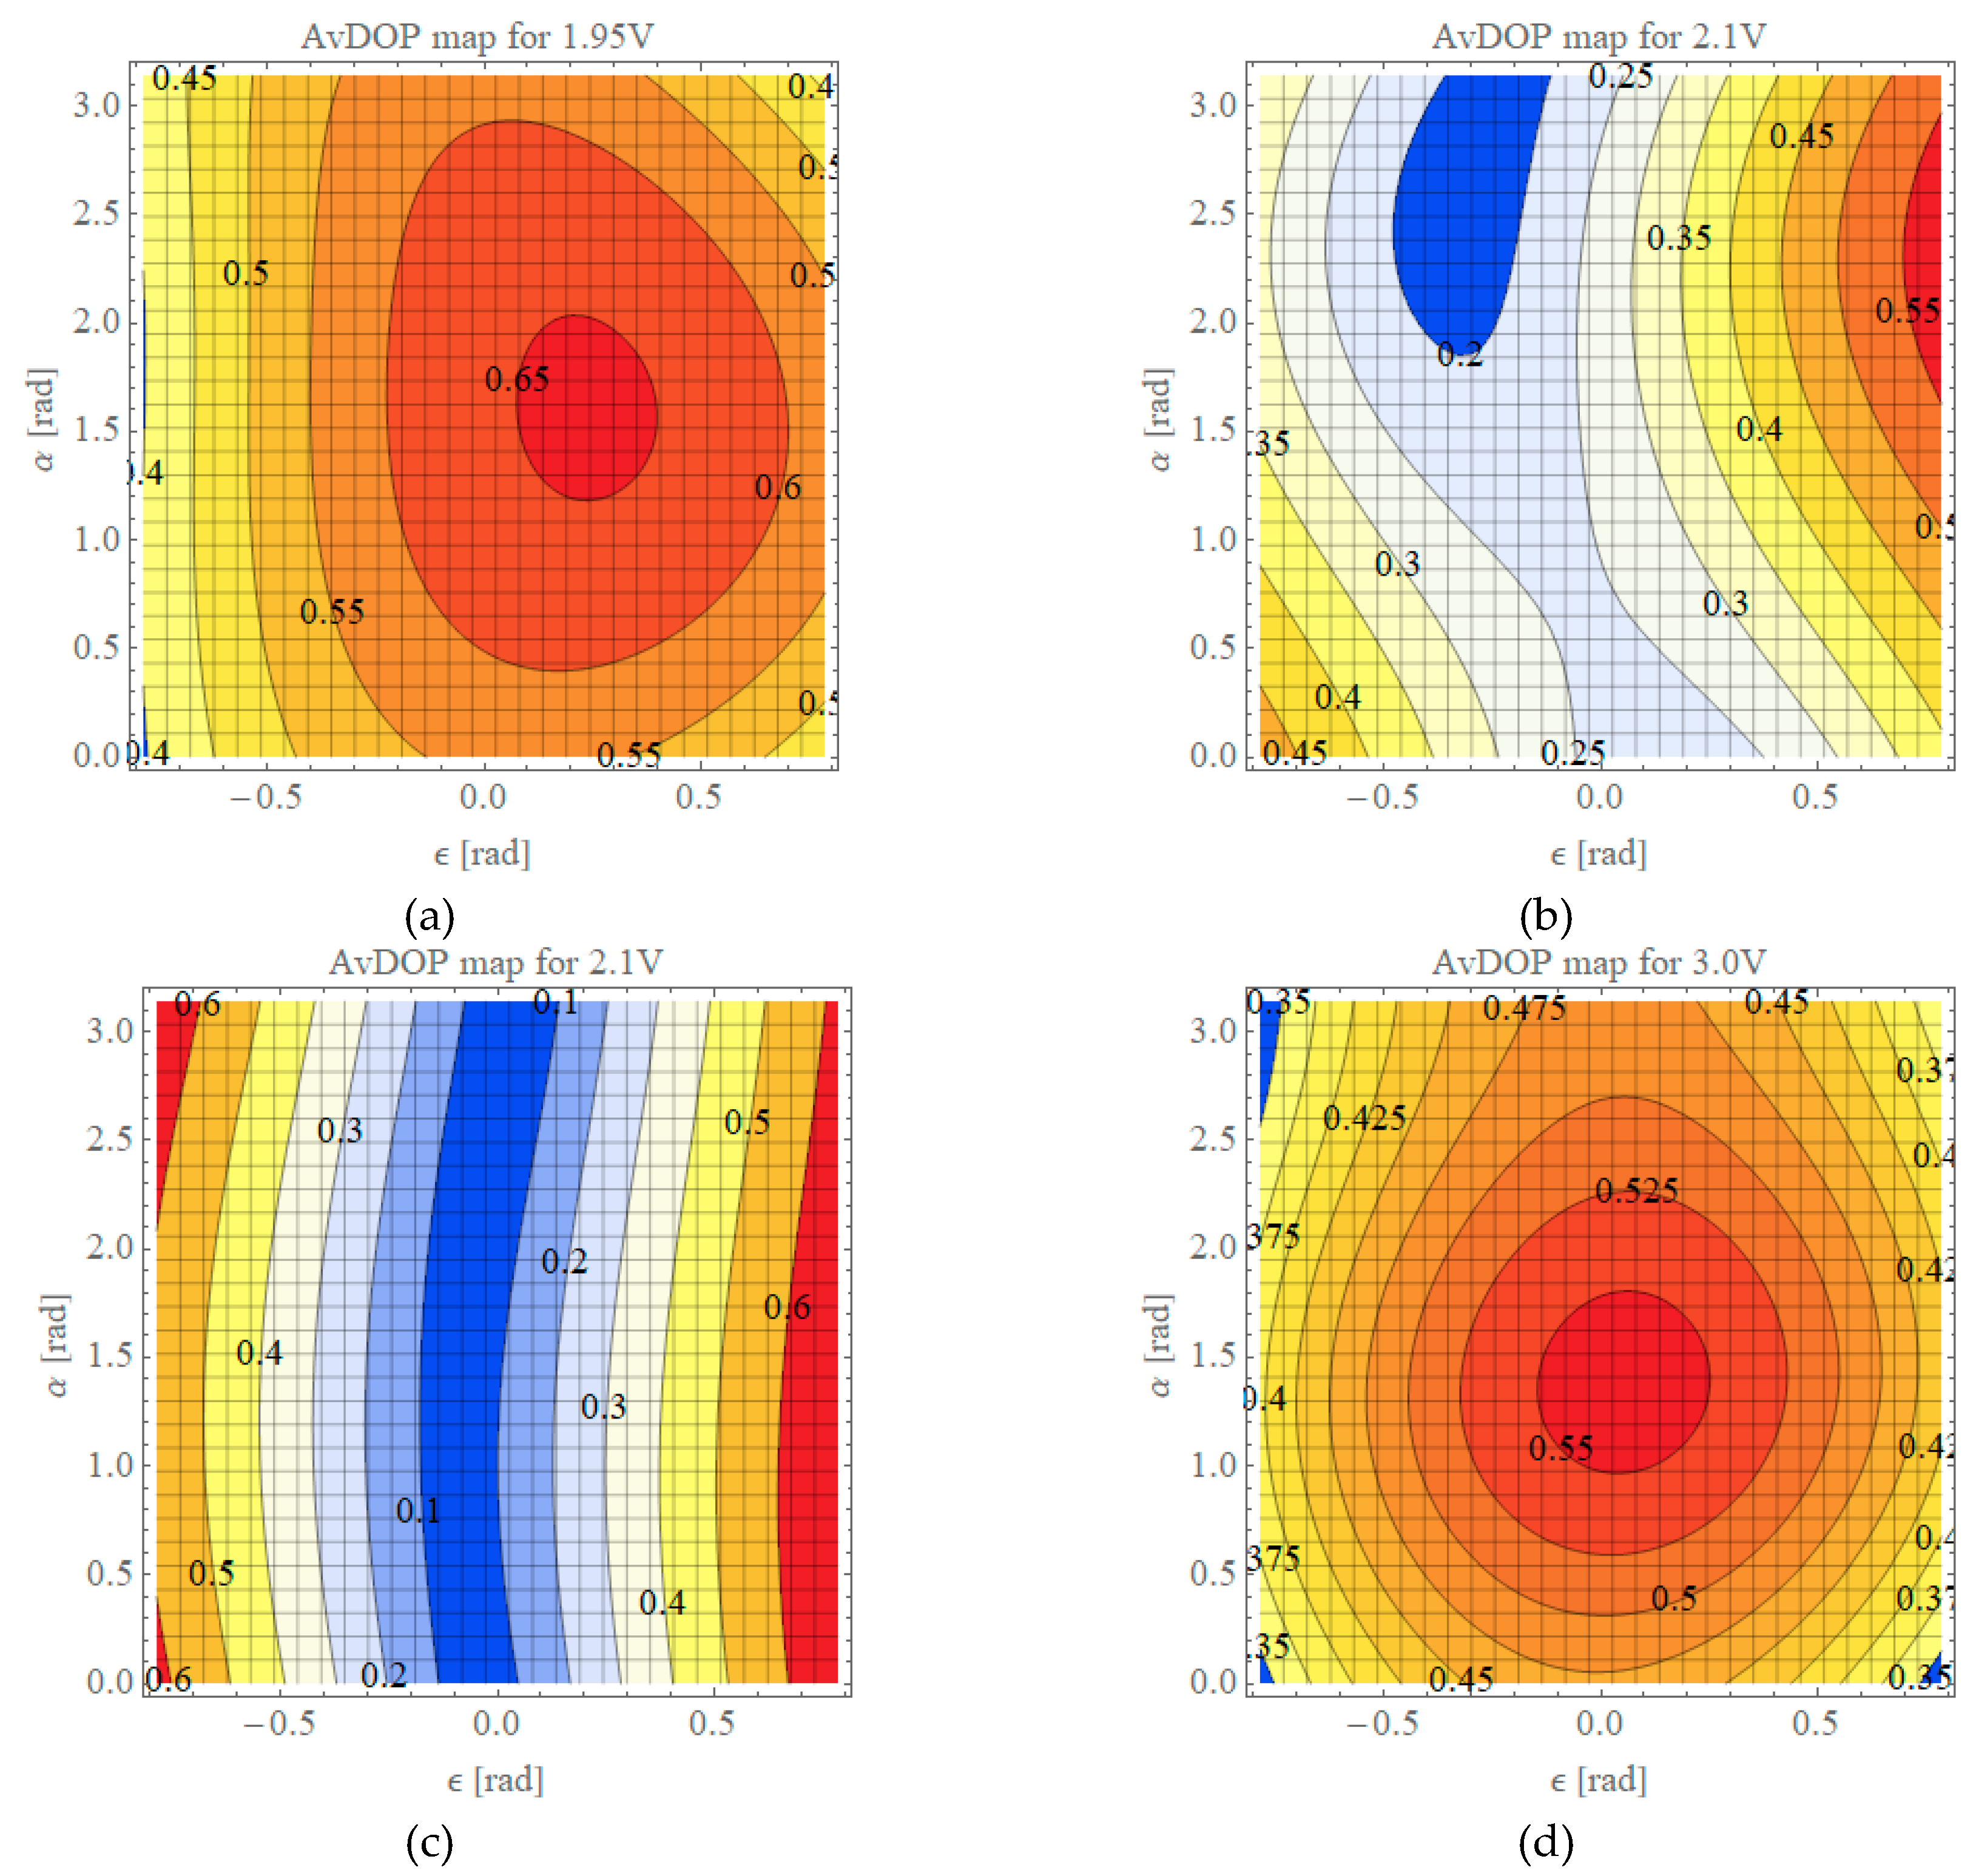
Analyses of plots presented in Figure 4a show that both tested elements have relatively high values of AvDOP parameter because the minima are of around 0.35 and it is far from the measured DOP presented in Figure 3. However, information about AvDOP gives general information on how strong attention needs to be taken to apply proper voltage to a known input SOP or how to tune voltage to minimize DOP if input SOP is unknown. Unfortunately, anisotropic properties of depolarization of tested samples presented in Figure 4b in this form do not allow to apprehend if high or low value of Add is preferable or not for this device. Therefore, following the method presented in [31], the 2D map of AvDOP as a function of input SOP parameters α and ε is shown in Figure 5. Voltage values selected for these plots were taken as minima of linear and circular input SOPs, respectively.
The above 2D maps show zones labeled by AvDOP values. Red zones point maxima while blue zones point minima of this parameter. Proper selection of voltage allows to reach minimum DOP for a certain input SOP (Figure 3), but the above 2D map allows to access the influence of changes of input SOP on measured DOP. Thus, if the input SOP is linear H as in Figure 5a,c, for both samples it is necessary to keep SOP linear to be in or close to the DOP global minimum. Input circular polarizations [see Figure 5a,d] have higher AvDOP and their behavior in both samples is opposite to previous plots. Here minima are close to circular SOPs and changes of input SOP in the linear polarization directions locate maxima around the linear V SOP.
In the next step of the analysis the polar decomposition defined by relations (1) was used to extract information about dichroism and birefringence of the tested PVAN cell. Voltage changes of representative, cumulative parameters for mentioned above effects as diattenuation and retardance [30] are presented in Figure 6.
Diattenuation presented in Figure 6a calculated basing on MD matrices has very small fluctuations and in this case both tested samples are dichroism free. However, calculated total retardance (Figure 6b) based on matrices MR includes information about cumulative birefringence of the PVAN cell. These calculations prove that depolarization properties of these devices are strongly connected with mean birefringence. Calculated birefringence [30] from retardances of both samples are of 0.116 and 0.111 for thicknesses of 10 μm and 15 μm, respectively and these values fully correspond with data mentioned in Table 1 of the previous paragraph.
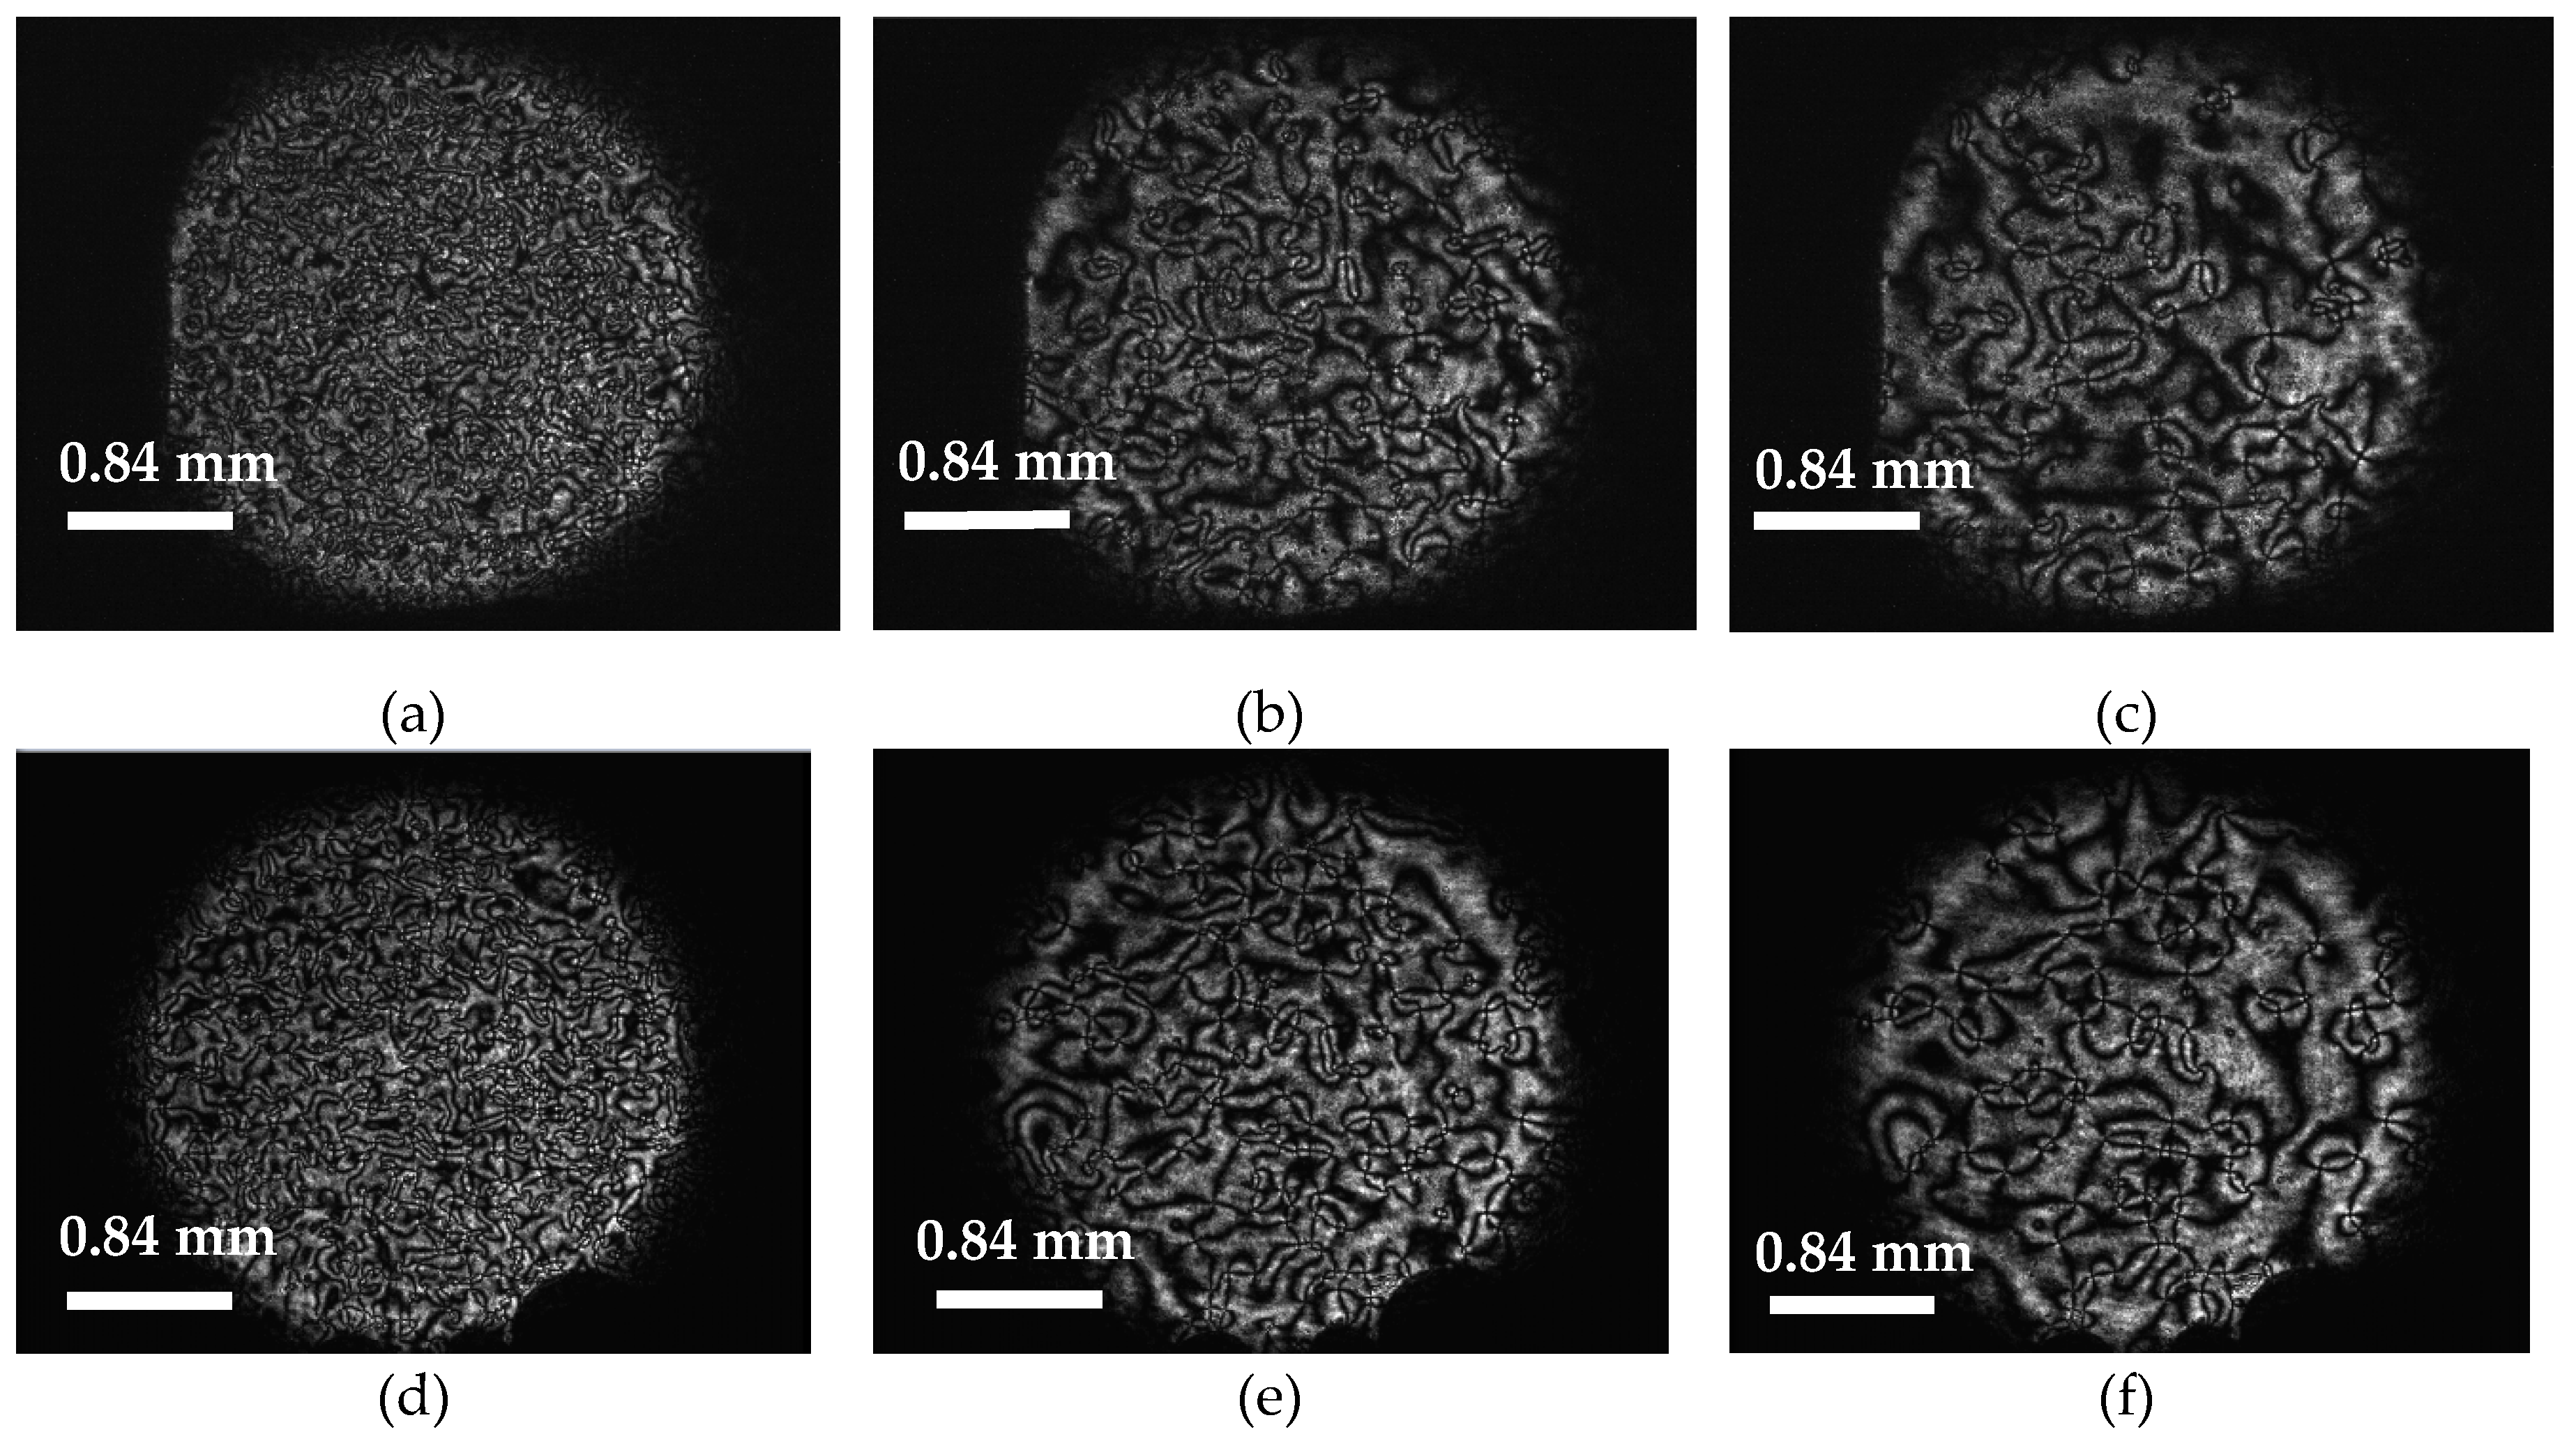
Spatial and time domain electro-optic characteristics of the tested PVAN cells were characterized based on microphotographs observed under crossed polarizers’ configuration of the experimental set-up from Figure 2 and were presented in Figure 7.
Microscopic textures of a conventional PVAN cell show that in this VAN nematic LC with null pretilt, upon switching by external electric field, the field causes continuous deformations of the LCs’ molecules. As result of the conflict between different orientations of the molecules, topological defects are produced. Furthermore, disclinations appear where the local orientation of LC director is undefined. On the other hand, it can be supposed that the domain formation originates from the occurrence due to undefined switching direction of the molecules’ director. This domains’ behavior is characteristic for the formation of numerous umbilical defects induced by applied electric field to the nematic liquid crystal with negative dielectric anisotropy, confined in cells with homeotropic boundary conditions. In this case only one integer strength type of director field deformations can be formed which are regions where the in-plane component of the director rotates through ± 2π (s = ±1) [32], resulting in spatial distribution of birefringence in a PVAN cell under voltage action (see Figure 7). These defects are important in practical applications, such as depolarization of polarized light. Moreover, we have observed that the morphology of such textures changes in time due to umbilical defect annihilation over time where defects of opposite sign and equal strength attract each other and annihilate, thus reduce the number of observed defects with time [33]. Similar results have been observed in our experiment as it is shown in the sequences of Figure 7a to Figure 7b and to Figure 7c for 10 μm thick sample and next Figure 7d–f for 15 μm thick cell. The annihilation dynamics of nematic umbilical defects, induced by electric field application to homeotropically oriented liquid crystal samples of negative dielectric anisotropy, were experimentally investigated in [34].
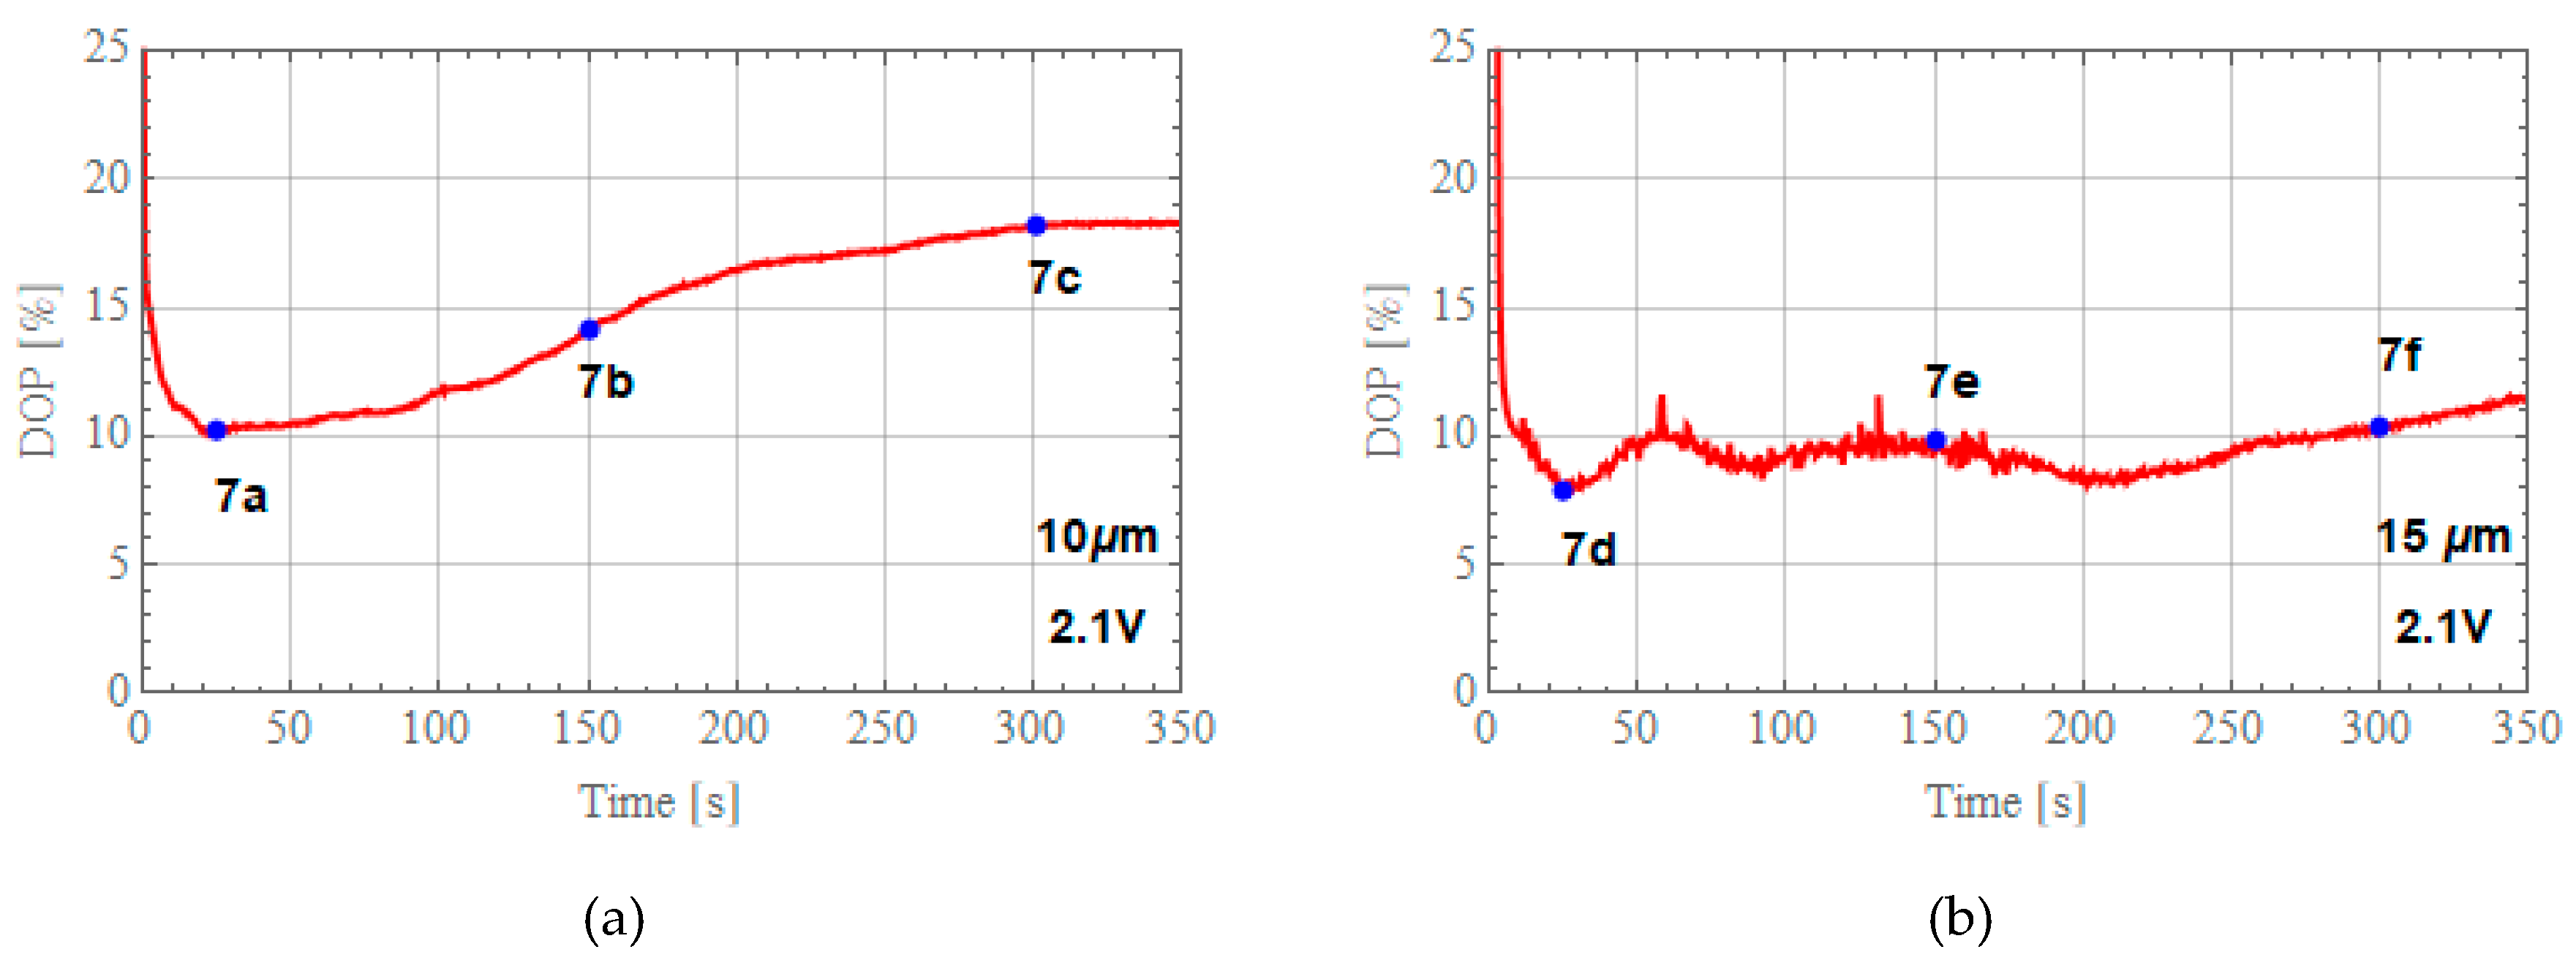
Figure 8 shows time evolution of the measured DOP at different applied voltages. Since the azimuthal tilting of the LC molecules is not defined, the measurement of DOP in 10 μm and 15 μm cells shows that it takes more than 200 s for the first case and 25s for the second to reach the stable DOP through the reorientation process. Similar results have been observed previously [35].
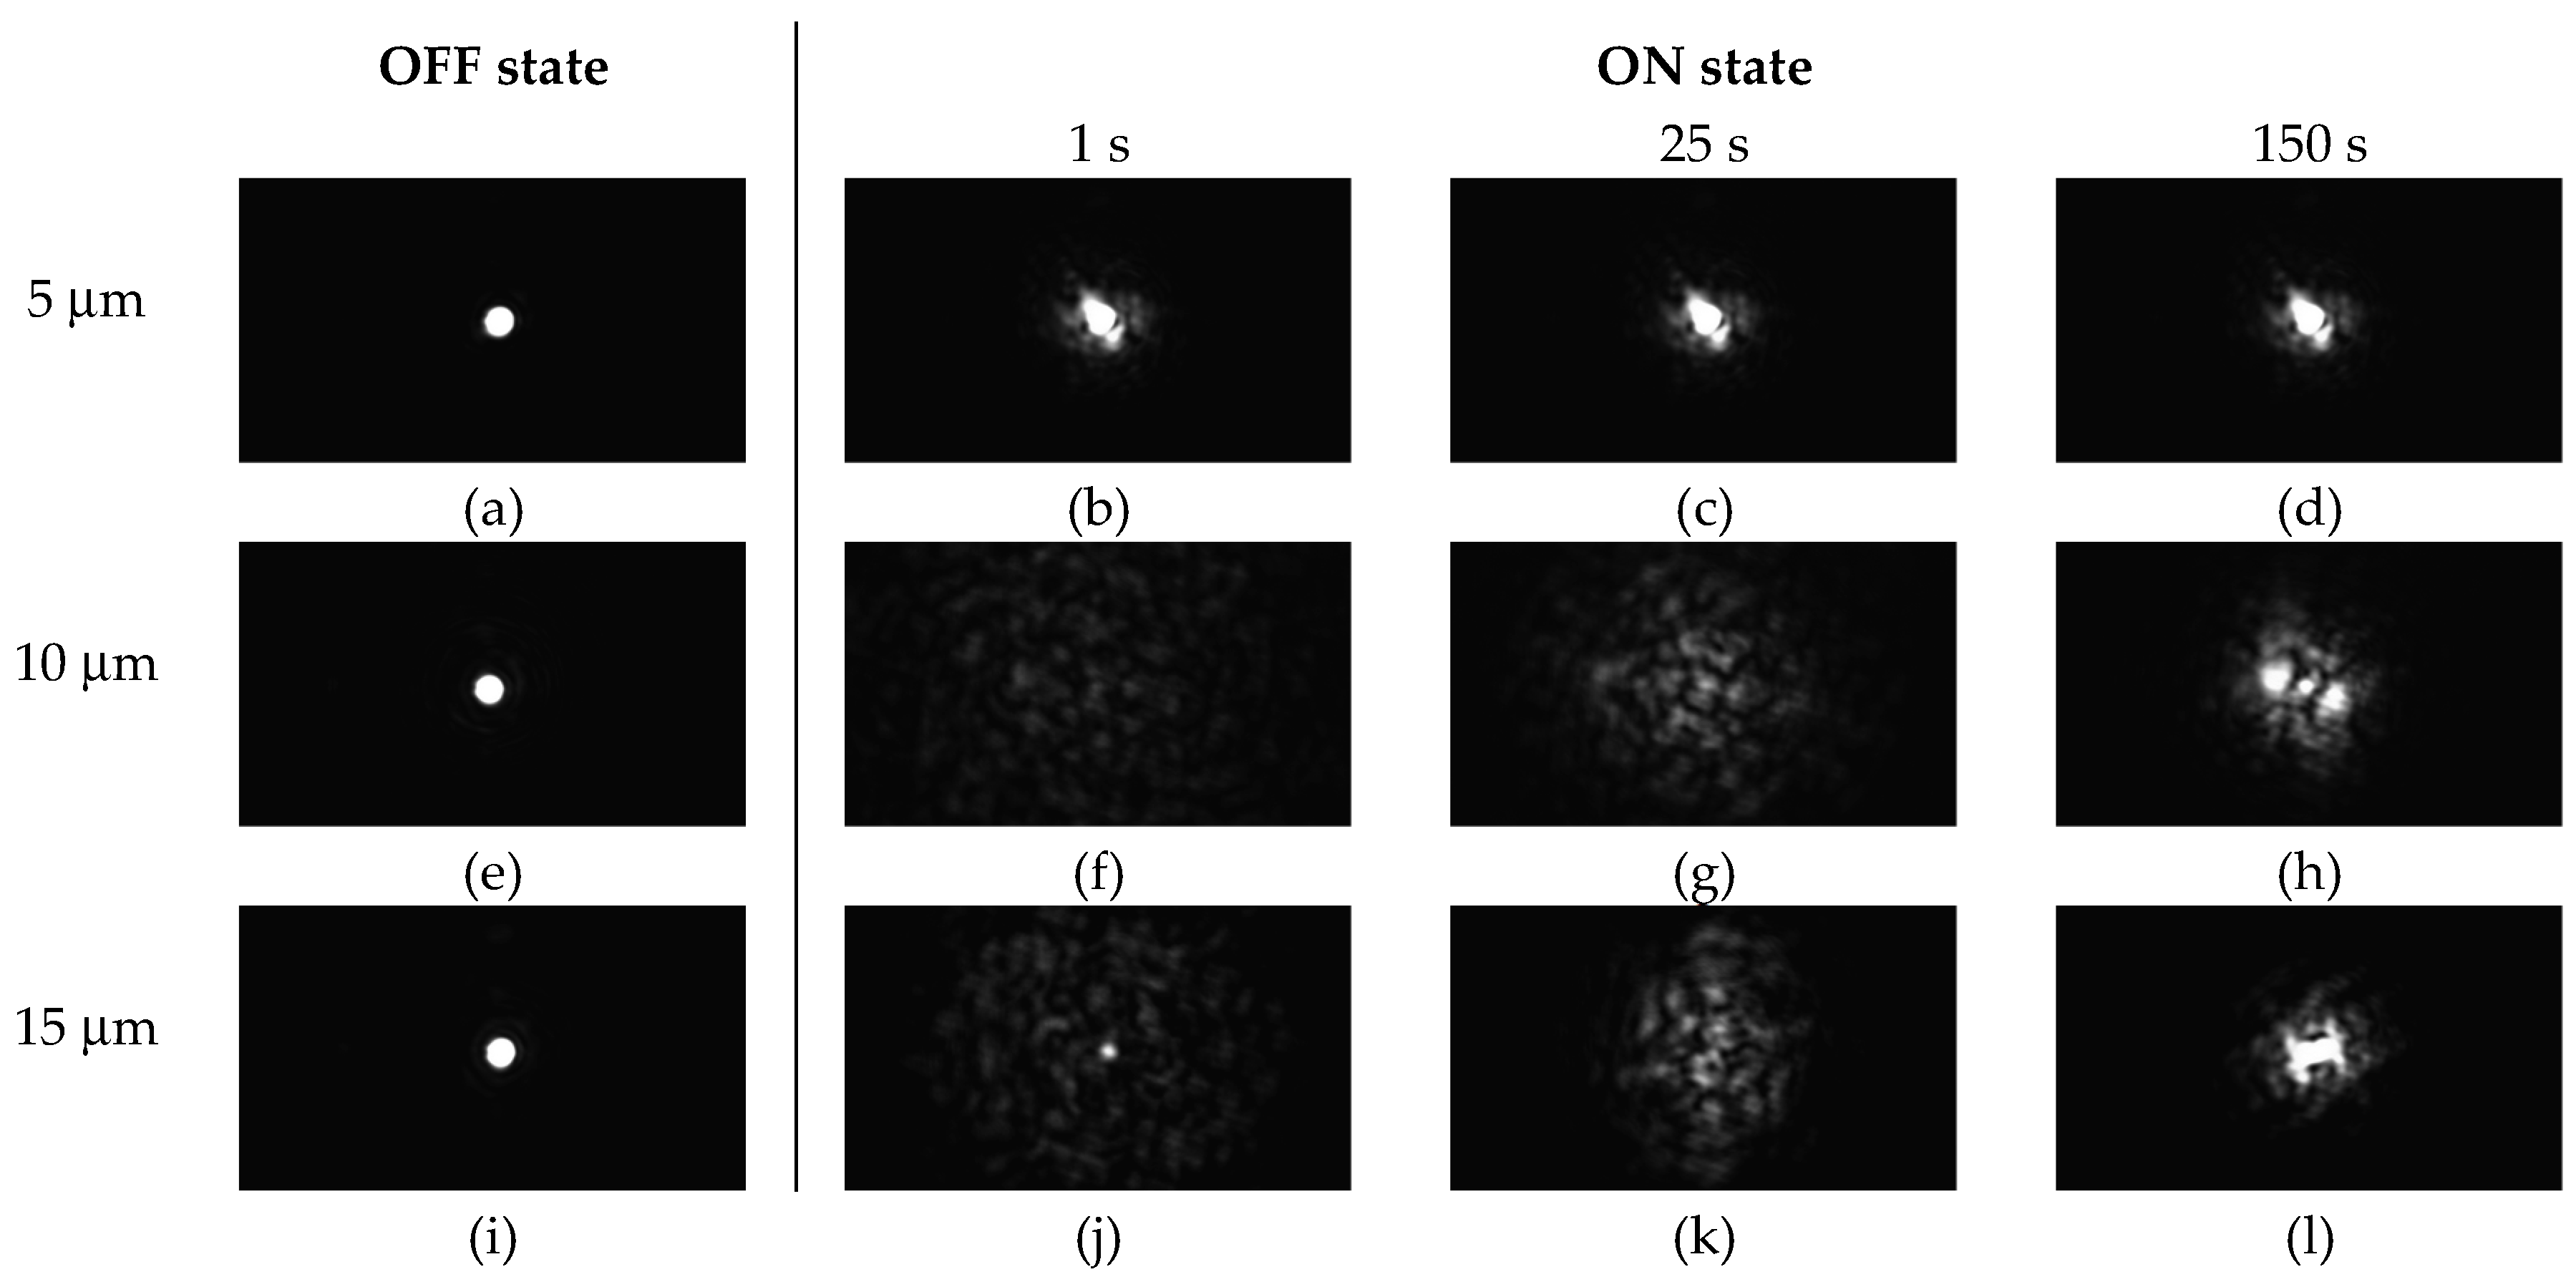
To study the light scattering capability of the cells with thickness of 5 μm, 10 μm and 15 μm, Fourier transform of scattered light has been adopted. This method has been developed as a sensitive one for studying this effect from inhomogeneous and dynamic structures [36]. The samples were illuminated using a parallel beam of He-Ne laser and placed behind the lens at a certain distance from the focal plane. We applied to each sample a voltage corresponding to minimum (DOP); V = 2.65 V, 2.15 V and 2.15 V in the case of 5 μm, 10 μm and 15 μm, respectively. We recorded the images of the scattered beams that are detected by CCD camera placed at Fourier plan after different times’ lag detection. Figure 9 shows images of spectral intensities’ distributions of the focused beams after switching ON of the cells with voltages corresponding to the DOP minimum. The small angular scattering distribution has been detected in Fourier plane where the beam profile differs from the focused condition in OFF state (Figure 9a,e,i) showing beam spot spreading. As results of a spatial and temporal changes of refractive index distribution due to annihilation of umbilical defects, a spatial reshaping of the beam spreading changes with time. Significant changes of the beam reshaping with time are observed in thicker cells (10 and 15 μm). However, in a thin cell of 5 μm, no significant changes in light spreading is observed. Correlation of scattering properties of the studied cells with their dynamic change of spatial refractive index distribution, thickness effect and temperature dependence will be a subject of a further study.
4. Conclusions
Depolarization of a monochromatic laser beam based on a pure vertically aligned nematic LC has been proposed. The alignment properties of DNA-based biopolymer were adopted to produce PVAN in order to design a high quality active pseudo-depolarizer. One of electro-optical properties of the tested PVAN cell is the ability to control the DOP level using relatively low voltages. Depolarization level of this device depends strongly on input SOP and generally has the anisotropic character. Polar decomposition method applied to experimental Mueller matrices shows that for tested devices voltage applied to the cell induces birefringence domains in addition the calculated mean values of retardance are at the level of 0.11. This value is in good correspondence with data from the refractometer measurement of the used LC. Furthermore, they are dichroism free. The small angular scattering distribution has been detected at Fourier plane after switching ON of the cells with voltage corresponding to the DOP minimum. As a result, a spatial reshaping of the beam spreading is changing with time due to annihilation of the umbilical defect.
Author Contributions
P.M. and N.B. analyzed measurement data and prepared manuscript, A.S. prepared and described the biopolymer of alignment layer, A.K. measured PVAN cells, R.W. manufactured PVAN cells, K.G. formulated the LC crystal mixture, L.R.J. analyzed and interpreted measurement data.
Funding
This work was supported by the Ministry of National Defense by research grants: GBMON/13-995/2018/WAT and Ministry of Higher Education as a statutory activity project PBS -23 - 898.
Acknowledgments
We would like to thank Anna Pakuła and Tomasz Jankowski from Virtual Reality Techniques Division of the Warsaw University of Technology for the scattering measurement.
Conflicts of Interest
The authors declare no conflict of interest.
References
- Takeda, M.; Wang, W.; Naik, D.N.; Singh, R.K. Spatial Statistical Optics and Spatial Correlation Holography: A Review. Opt. Rev. 2014, 21, 849–861. [Google Scholar] [CrossRef]
- Le Roy-Brehonnet, F.; Le Jeune, B. Utilization of Mueller matrix formalism to obtain optical targets depolarization and polarization properties. Prog. Quant. Electr. 1997, 21, 109–151. [Google Scholar] [CrossRef]
- Le Roy-Brehonnet, F.; Le Jeune, B.; Gerligand, P.Y.; Cariou, J.; Lotrian, J. Analysis of depolarizing optical targets by Mueller matrix formalism. Pure. Appl. Opt. 1997, 6, 385–404. [Google Scholar] [CrossRef]
- Boulvert, F.; Le Brun, G.; Le Jeune, B.; Cariou, J.; Martin, L. Decomposition algorithm of an experimental Mueller matrix. Opt. Commun. 2009, 282, 692–704. [Google Scholar] [CrossRef]
- Firdous, S.; Anwar, S. Noninvasive optical diagnostic of breast cancer using depolarization of light. Optik 2016, 127, 3035–3038. [Google Scholar] [CrossRef]
- Pierangelo, A.; Benali, A.; Antonelli, M.-R.; Novikova, T.; Validire, P.; Gayet, B.; De Martin, A. Ex-vivo characterization of human colon cancer by Mueller polarimetric imaging. Opt. Express 2011, 19, 1582–1593. [Google Scholar] [CrossRef] [PubMed]
- Ge, J.H.; Chen, Z.; Chen, Y.F.; Chen, C.Y.; Zhai, Y.Z.; Zhang, J.; Sui, Z.; Lin, H.H.; Wang, J.J.; Deng, Q.H. Optimized Design of Parameters for Wedge-Crystal Depolarizer. App. Mech. Mater. 2012, 110–116, 3351–3357. [Google Scholar] [CrossRef]
- Burns, W.K. Degree of polarization in the Lyot depolarizer. J. Lightwave Technol. 1983, 1, 475–479. [Google Scholar] [CrossRef] [Green Version]
- Jaroszewicz, L.R.; Krajewski, Z.; Kowalski, H.; Mazur, G.; Zinówko, P.; Kowalski, J. AFORS autonomous fibre-optic rotational seismograph: Design and application. Acta Geophys. 2011, 59, 578–596. [Google Scholar] [CrossRef]
- Diorio, N.J., Jr.; Fisch, M.R.; West, J.L. Filled liquid crystal depolarizers. J. Appl. Phys. 2001, 90, 3675–3678. [Google Scholar] [CrossRef]
- Zhang, D.; Luo, F.; Luo, Y.; Li, J.; Liu, C.; Liu, H.; Shen, Z.; Wang, W. Cholesteric liquid crystal Depolarizer. Opt. Eng. 2007, 46, 070504. [Google Scholar] [CrossRef]
- ThorLabs, Inc. Available online: https://www.thorlabs.com/newgrouppage9.cfm?objectgroup_id=8043 (accessed on 26 July 2019).
- Honma, M.; Nose, T. Liquid-crystal depolarizer consisting of randomly aligned hybrid orientation domains. Appl. Opt. 2004, 43, 4667–4671. [Google Scholar] [CrossRef] [PubMed]
- Wei, B.-Y.; Chen, P.; Ge, S.-J.; Zhang, L.-C.; Hu, W.; Lu, Y.-Q. Liquid crystal depolarizer based on photoalignment technology. Photon. Res. 2016, 4, 70–73. [Google Scholar] [CrossRef]
- Spadło, A.; Bennis, N.; Węgłowski, R.; Węgłowska, D.; Czupryński, K.; Otón, J.M. Biopolymer as alignment layer for liquid crystal mixtures. Mol. Cryst. Liq. Cryst. 2017, 657, 56–65. [Google Scholar] [CrossRef]
- Marino, A.; Santamato, E.; Bennis, N.; Quintana, X.; Otón, J.M.; Tkachenko, V.; Abbate, G. Ellipsometric Study of Vertically Aligned Nematic Liquid Crystals. App. Phys. Lett. 2009, 94, 013508. [Google Scholar] [CrossRef]
- Vena, C.; Massarelli, R.; Carbone, F.; Versace, C. An approach to a model disordered birefringence medium for light depolarization applied to a liquid crystal device. J. Opt. 2014, 16, 16065705. [Google Scholar] [CrossRef]
- Sakai, J.; Machida, S.; Kimura, T. Degree of polarization in anisotropic single-mode optical fibers: Theory. J. Quant. Electro. 1982, 18, 488–495. [Google Scholar] [CrossRef]
- Kalbarczyk, A.; Jaroszewicz, L.R.; Bennis, N.; Chruściel, M.; Marć, P. The Young Interferometer as an Optical System for a Variable Depolarizer Characterization. Sensors 2019, 19, 3037. [Google Scholar] [CrossRef]
- Heckman, E.M.; Hagen, J.A.; Yaney, P.P.; Grote, J.G.; Hopkins, F.K. Processing techniques for deoxyribonucleic acid: Biopolymer for photonics applications. Appl. Phys. Lett. 2005, 87, 211115. [Google Scholar] [CrossRef]
- Wang, L.; Yoshida, J.; Ogata, N.; Sasaki, S.; Kajiyama, T. Self-Assembled Supramolecular Films Derived from Marine Deoxyribonucleic Acid (DNA)−Cationic Surfactant Complexes: Large-Scale Preparation and Optical and Thermal Properties. Chem. Mater. 2001, 13, 1273–1281. [Google Scholar] [CrossRef]
- Grote, J.G.; Diggs, D.E.; Nelson, R.L.; Zetts, J.S.; Hopkins, F.K.; Ogata, N.; Hagen, J.A.; Heckman, H.; Yaney, P.P.; Stone, M.O.; et al. DNA Photonics [Deoxyribonucleic Acid]. Mol. Cryst. Liq. Cryst. 2005, 426, 3–17. [Google Scholar] [CrossRef]
- Kula, P.; Spadło, A.; Dziaduszek, J.; Filipowicz, M.; Dąbrowski, R.; Czub, J.; Urban, S. Mesomorphic, dielectric and optical properties of fluorosubstituted biphenyls, terphenyls, and quaterphenyls. Opto-Electron. Rev. 2008, 16, 379–385. [Google Scholar] [CrossRef]
- Urban, S.; Kula, P.; Spadło, A.; Geppi, M.; Marini, A. Dielectric properties of selected laterally fluorosubstituted 4,4′′-dialkyl, dialkoxy and alkyl-alkoxy [1:1′;4′:1′′] terphenyls. Liq. Cryst. 2010, 37, 1321–1330. [Google Scholar] [CrossRef]
- Perkowski, P. Numerical elimination methods of ITO cell contribution to dielectric spectra of ferroelectric liquid crystals. Opto-Electron. Rev. 2011, 17, 176–182. [Google Scholar] [CrossRef]
- Seo, D.-S. Generation of pretilt angle in NLC and EO characteristics of transcription-aligned TN-LCD fabricated by transcription alignment on polyimide surfaces. Liq. Cryst. 1999, 26, 397–400. [Google Scholar] [CrossRef]
- Goldstein, D. Polarized Light, 2nd ed.; Marcel Dekker: New York, NY, USA, 2003; pp. 533–557. [Google Scholar]
- Lorenz, A.; Omairat, F.; Braun, L.; Kolosova, V. Nematic copolymer network LCs for swift continuous phase modulation and opaque scattering states. Mol. Cryst. Liq. Cryst. 2017, 646, 220–225. [Google Scholar] [CrossRef] [Green Version]
- Hashimoto, T.; Nakai, A.; Shiwaku, T.; Hasegawa, H.; Rojstaczer, S.; Stein, R.S. Small-Angle Light Scattering from Nematic Liquid Crystals:Fluctuations of Director Field Due to Many-Body Interactions of Disclinations. Macromolecules 1989, 22, 422–429. [Google Scholar] [CrossRef]
- Kula, P.; Bennis, N.; Marć, P.; Harmata, P.; Gacioch, K.; Morawiak, P.; Jaroszewicz, L.R. Perdeuterated liquid crystals for near infrared applications. Opt. Mat. 2016, 60, 209–213. [Google Scholar] [CrossRef] [Green Version]
- Chipman, R.A. Depolarization in the Mueller Calculus. Proc. SPIE 2003, 5158, 184–192. [Google Scholar]
- Dierking, I.; Ravnik, M.; Lark, E.; Healey, J.; Alexander, G.P.; Yeomans, J.M. Anisotropy in the annihilation dynamics of umbilic defects in nematic liquid crystals. Phys. Rev. E 2012, 85, 021703. [Google Scholar] [CrossRef]
- Chuang, I.; Durrer, R.; Turok, N.; Yurke, B. Cosmology in the laboratory: Defect dynamics in liquid crystals. Science 1991, 251, 1336–1342. [Google Scholar] [CrossRef] [PubMed]
- Dierking, I.; Marshall, O.; Wright, J.; Bulleid, N. Annihilation dynamics of umbilical defects in nematic liquid crystals under applied electric fields. Phys. Rev. E 2005, 71, 061709. [Google Scholar] [CrossRef] [PubMed]
- Vena, C.; Versace, C.; Strangi, G.; D’Elia, S.; Bartolino, R. Light depolarization effects during the Fréedericksz transition in nematic liquid crystals. Opt. Express 2007, 15, 17063–17071. [Google Scholar] [CrossRef] [PubMed]
- Ding, H.; Wang, Z.; Nguyen, F.; Boppart, S.A.; Popescu, G. Fourier Transform Light Scattering of Inhomogeneous and Dynamic Structures. Phys. Rev. Lett. 2008, 101, 238102. [Google Scholar] [CrossRef] [PubMed]
Figure 1.
DNA structure with a surfactant DODMAC, where: A, T, G and C—four nitrogen-containing nucleobases and hydrogen bonds bind the nitrogenous bases of the two separate polynucleotides.
Figure 1.
DNA structure with a surfactant DODMAC, where: A, T, G and C—four nitrogen-containing nucleobases and hydrogen bonds bind the nitrogenous bases of the two separate polynucleotides.

Figure 2.
Integrated polarimetric and crossed polarizers’ set-ups for depolarization properties characterization of a PVAN cell. SF—spatial filter module, PSG—SOP generator, BS—beam splitter, PSA1—polarimeter as a SOP analyzer, M—mirror, PSA2—SOP analyzer as a linear polarizer with vertical orientation, FG—function generator, PC—personal computer.

Figure 3.
DOP as a function of the voltage for PVAN cells with thicknesses: 5 μm (green dotted line), 10 μm (blue dashed line) and 15 μm (red dot-dashed line) for input SOP: (a) linear H and (b) circular R.
Figure 3.
DOP as a function of the voltage for PVAN cells with thicknesses: 5 μm (green dotted line), 10 μm (blue dashed line) and 15 μm (red dot-dashed line) for input SOP: (a) linear H and (b) circular R.

Figure 4.
Calculated (a) AvDOP and (b) Add as a function of the applied voltage for PVAN cells with thicknesses of 10 μm (blue dotted line) and 15 μm (dot-dashed line). AvDOP—average DOP, Add—anisotropic depolarization degree.
Figure 4.
Calculated (a) AvDOP and (b) Add as a function of the applied voltage for PVAN cells with thicknesses of 10 μm (blue dotted line) and 15 μm (dot-dashed line). AvDOP—average DOP, Add—anisotropic depolarization degree.

Figure 5.
Calculated AvDOP maps for PVAN cells with thicknesses: 10 μm (a) & (b) and 15 μm (c) & (d) for following voltages and input SOPs (a) 1.95 V & circular R, (b) 2.1 V & linear H, (c) 2.1 V & linear H and (d) 3 V & circular R.
Figure 5.
Calculated AvDOP maps for PVAN cells with thicknesses: 10 μm (a) & (b) and 15 μm (c) & (d) for following voltages and input SOPs (a) 1.95 V & circular R, (b) 2.1 V & linear H, (c) 2.1 V & linear H and (d) 3 V & circular R.

Figure 6.
Calculated: (a) diattenuation and (b) retardance of tested PVAN cells with thicknesses of 10 μm (blue dotted line) and 15 μm (dot-dashed line).
Figure 6.
Calculated: (a) diattenuation and (b) retardance of tested PVAN cells with thicknesses of 10 μm (blue dotted line) and 15 μm (dot-dashed line).

Figure 7.
Microphotographs of 2050 LC domains on the DODA biofilm observed under crossed polarizers for input linear horizontal SOP and under voltage of 2.15 V applied to the cell in three time intervals of the samples with thickness of 10 μm after (a) 25 s, (b) 150 s (c) 300 s and 15 μm after (d) 25 s, (e) 150 s, (f) 300 s.

Figure 8.
Time evolution of measured DOP at different applied voltages to PVAN cells with thickness of: (a) 10 μm and (b) 15 μm. The SOP of the incident light is linearly H polarized.
Figure 8.
Time evolution of measured DOP at different applied voltages to PVAN cells with thickness of: (a) 10 μm and (b) 15 μm. The SOP of the incident light is linearly H polarized.

Figure 9.
Spectral intensity distribution of a focused beam transmitted by cells of thickness of 5 μm, 10 μm and 15 μm when the cells are driven with the voltage of V = 2.65 V, 2.15 V and 2.15 V, respectively. (a,e,i) represent the focused condition at V = 0. The images of scattered beam are recorded by a CCD camera placed at Fourier plan after different times’ lag detection. The SOP of the incident light is linear H polarized.


Table 1.
General molecular structures of compounds used to form the investigated 2050 nematic mixture and their weight %.
Table 1.
General molecular structures of compounds used to form the investigated 2050 nematic mixture and their weight %.
| Components | Chemical Structure | Weight % |
|---|---|---|
| I |  R1 and R2 = alkyl (CH3-C5H11) | 34.1 |
| II |  | 18.6 |
| III |  | 47.3 |
© 2019 by the authors. Licensee MDPI, Basel, Switzerland. This article is an open access article distributed under the terms and conditions of the Creative Commons Attribution (CC BY) license (http://creativecommons.org/licenses/by/4.0/).
Share and Cite
MDPI and ACS Style
Marć, P.; Bennis, N.; Spadło, A.; Kalbarczyk, A.; Węgłowski, R.; Garbat, K.; Jaroszewicz, L.R. Monochromatic Depolarizer Based on Liquid Crystal. Crystals 2019, 9, 387. https://0-doi-org.brum.beds.ac.uk/10.3390/cryst9080387
AMA Style
Marć P, Bennis N, Spadło A, Kalbarczyk A, Węgłowski R, Garbat K, Jaroszewicz LR. Monochromatic Depolarizer Based on Liquid Crystal. Crystals. 2019; 9(8):387. https://0-doi-org.brum.beds.ac.uk/10.3390/cryst9080387
Chicago/Turabian StyleMarć, Paweł, Noureddine Bennis, Anna Spadło, Aleksandra Kalbarczyk, Rafał Węgłowski, Katarzyna Garbat, and Leszek R. Jaroszewicz. 2019. "Monochromatic Depolarizer Based on Liquid Crystal" Crystals 9, no. 8: 387. https://0-doi-org.brum.beds.ac.uk/10.3390/cryst9080387
Note that from the first issue of 2016, this journal uses article numbers instead of page numbers. See further details here.