Gold Nanoparticle-Mediated Photoporation Enables Delivery of Macromolecules over a Wide Range of Molecular Weights in Human CD4+ T Cells

 , ,
, , 
Abstract
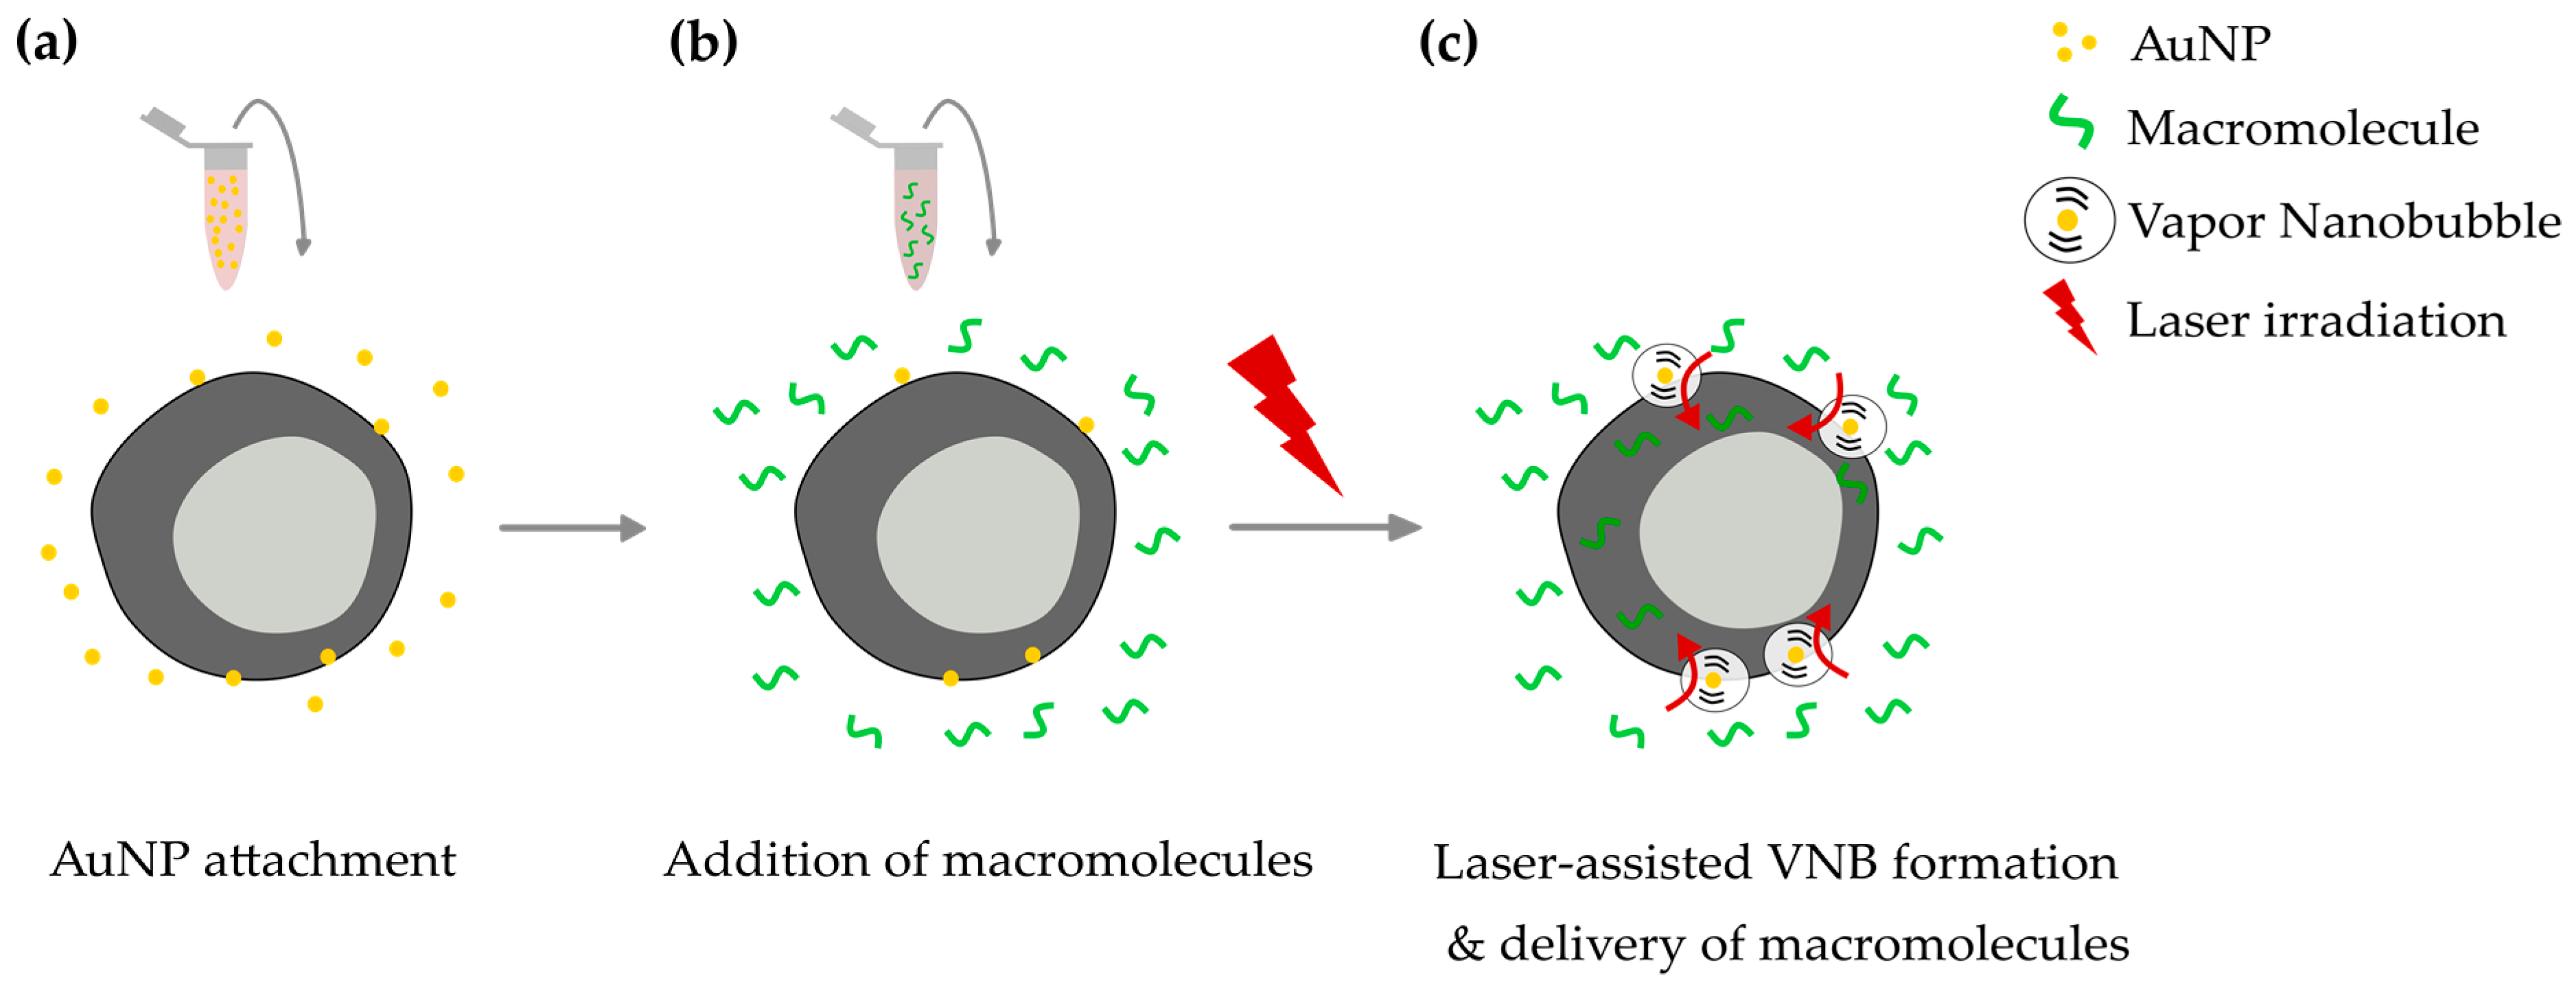
:1. Introduction
2. Materials and Methods
2.1. Synthesis and Characterization of 60 nm AuNPs
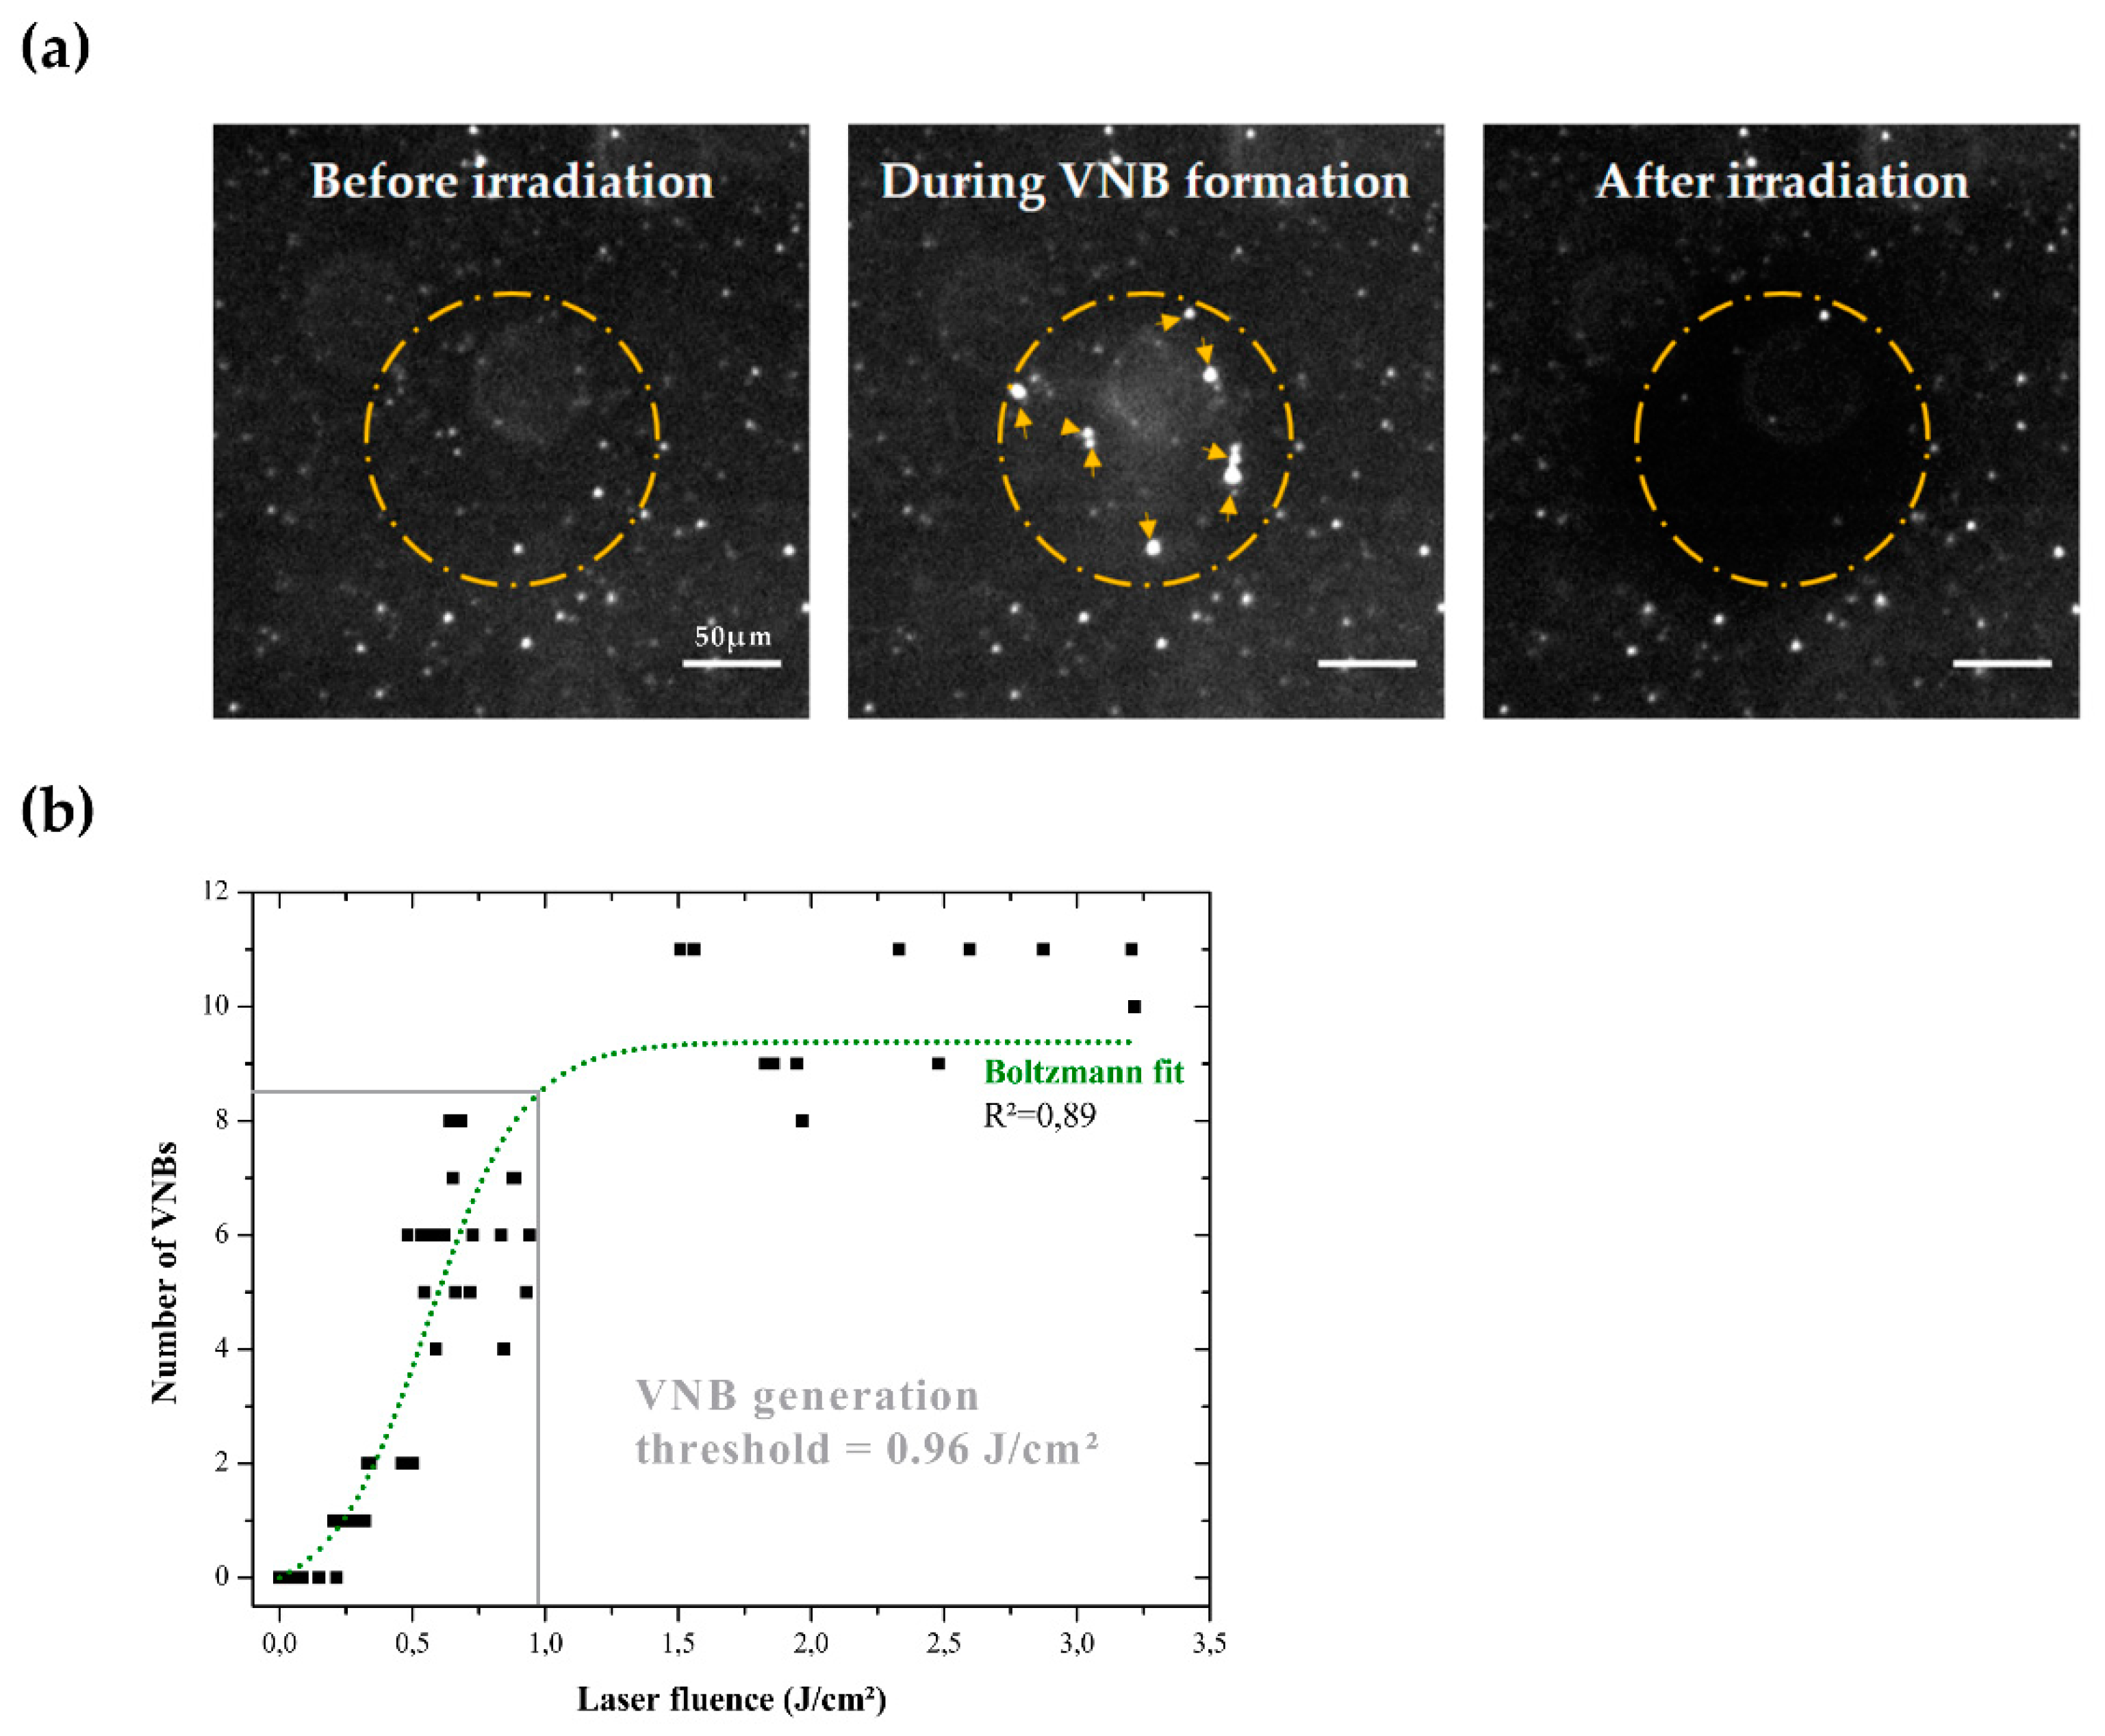
2.2. Detection of VNBs and Determination of VNB Generation Threshold
2.3. Jurkat and Primary Human CD4+ T Cell Culture
2.4. Visualization of AuNP Attachment and Quantification of the Number of AuNPs Per Cell
2.5. Delivery of FITC-Dextrans to Jurkat and Human CD4+ T Cells by VNB Photoporation
2.6. Evaluation of FITC-Dextran Delivery by Confocal Microscopy and Flow Cytometry
2.7. Cell Viability Assay
2.8. Statistical Analysis
3. Results
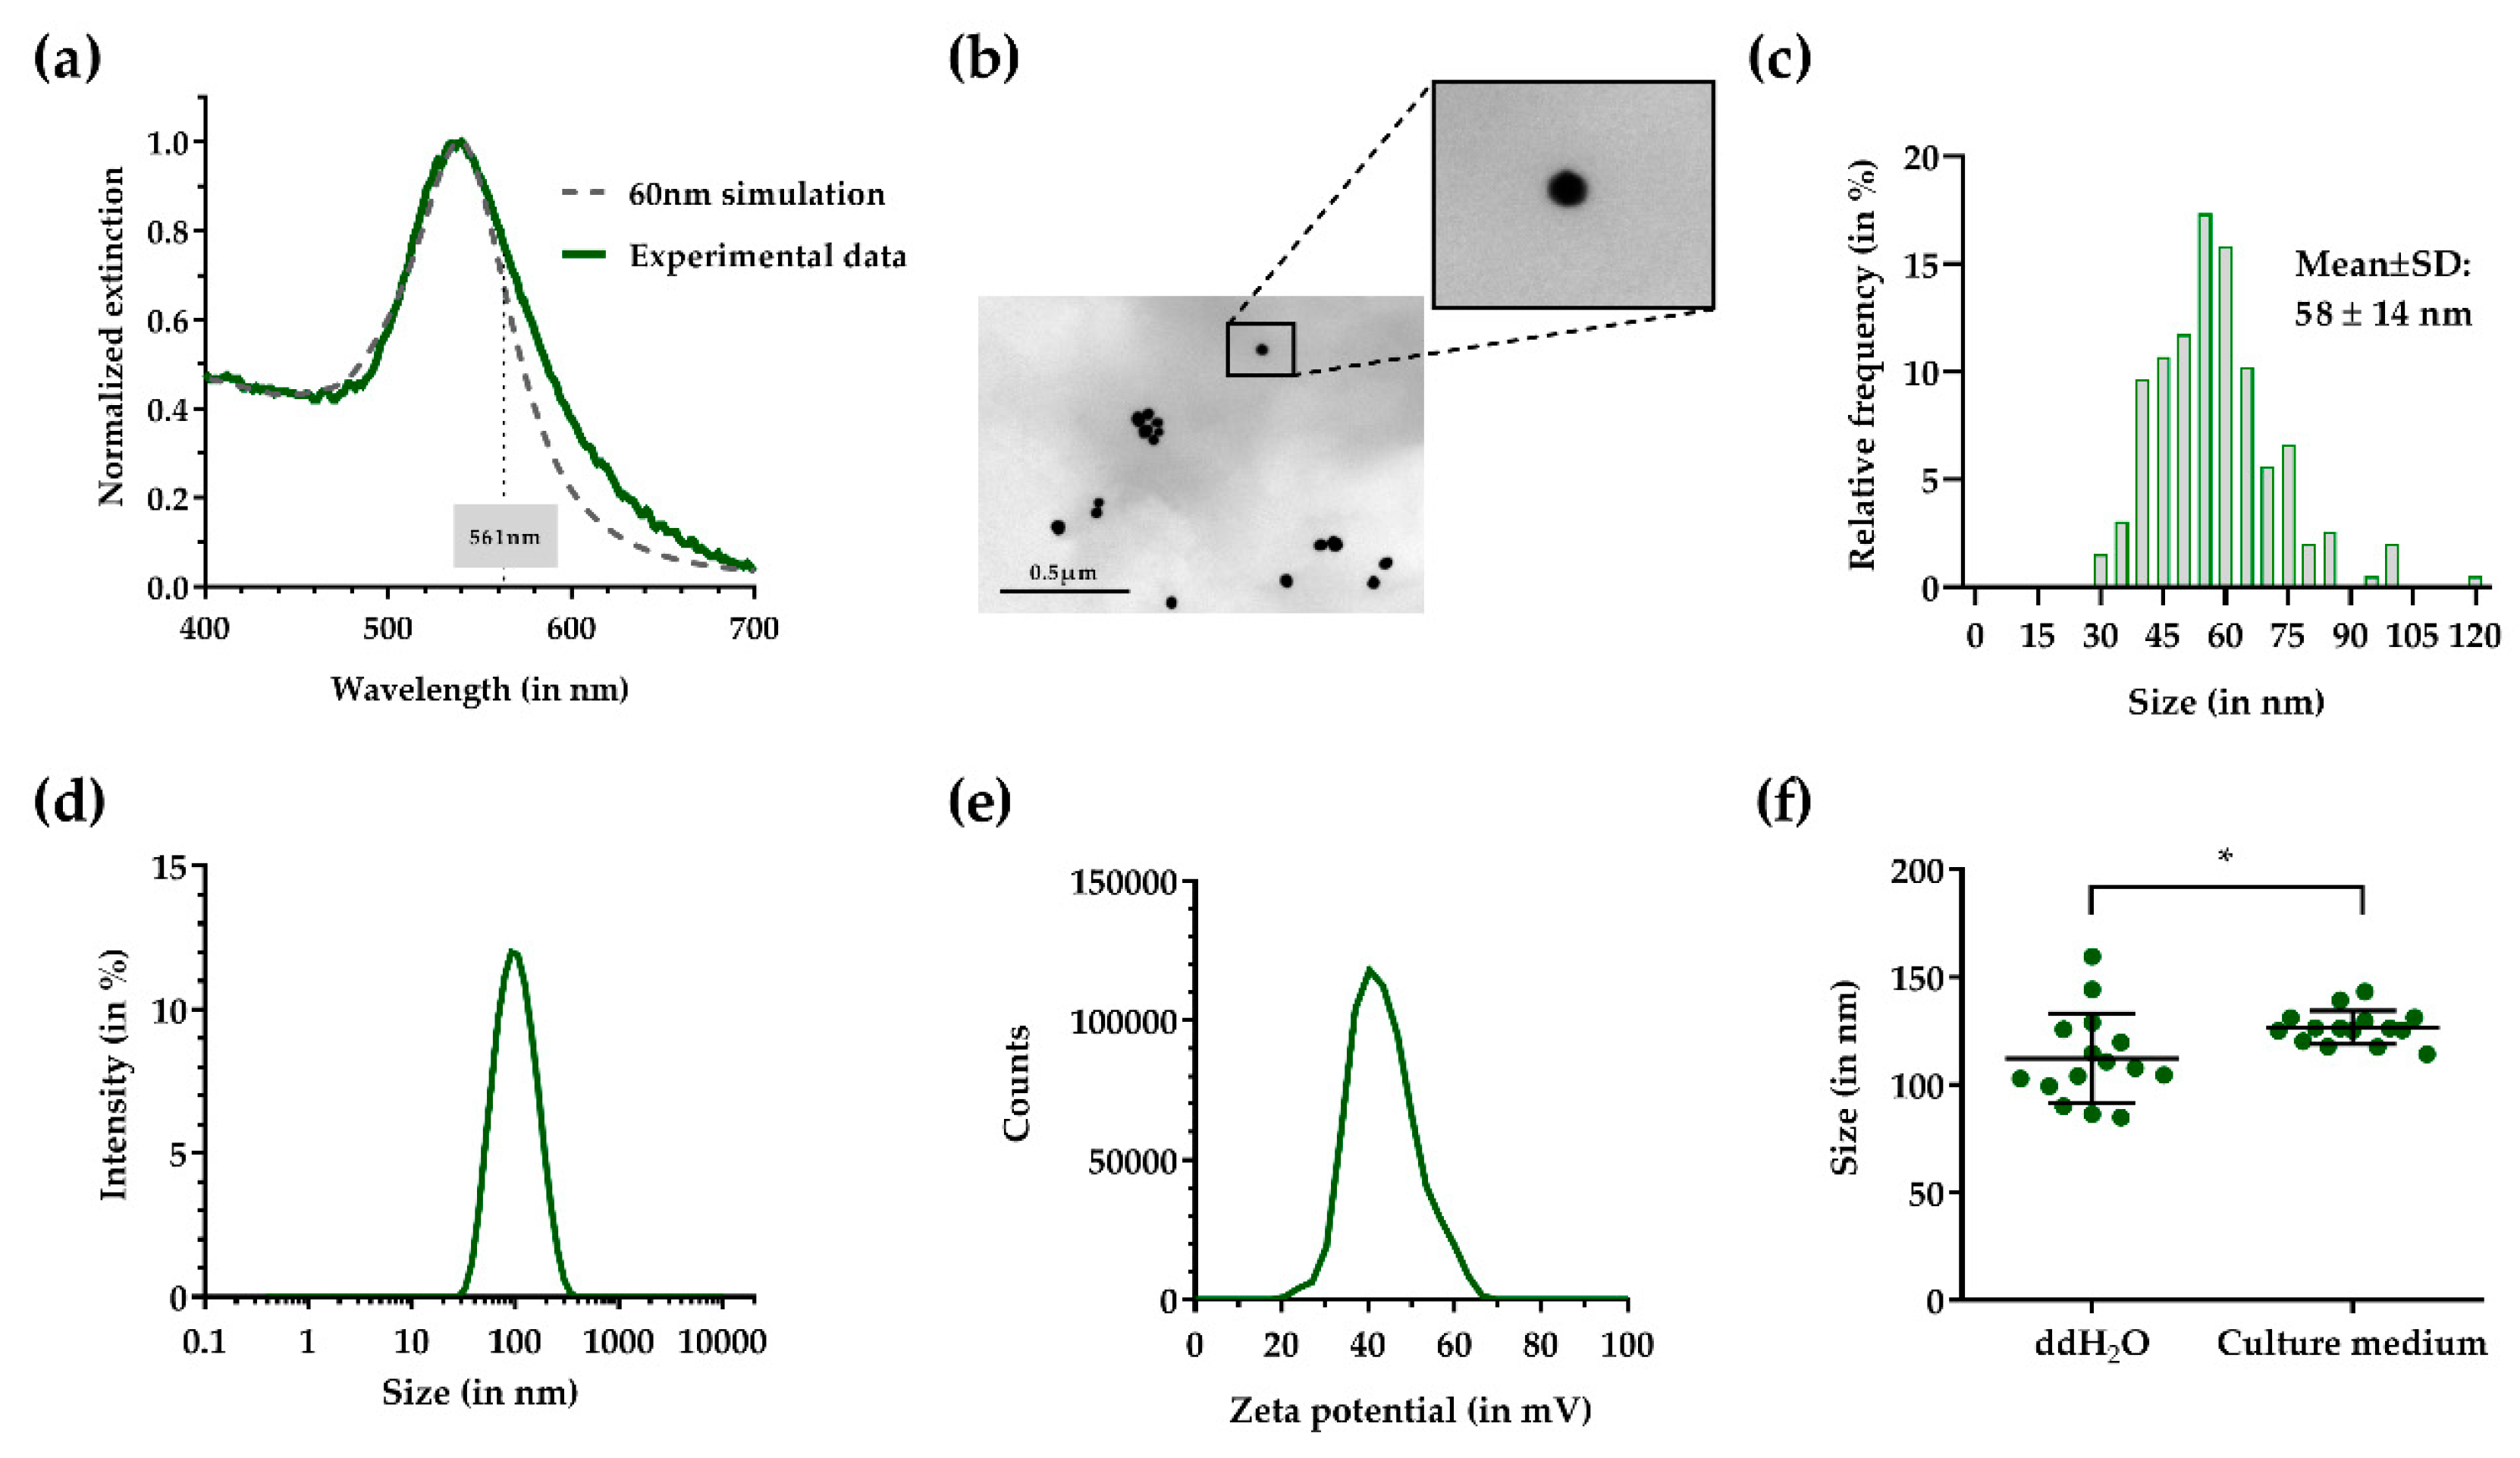
3.1. Physicochemical Characterization of 60 nm Cationic AuNPs
3.2. Determination of the VNB Generation Threshold
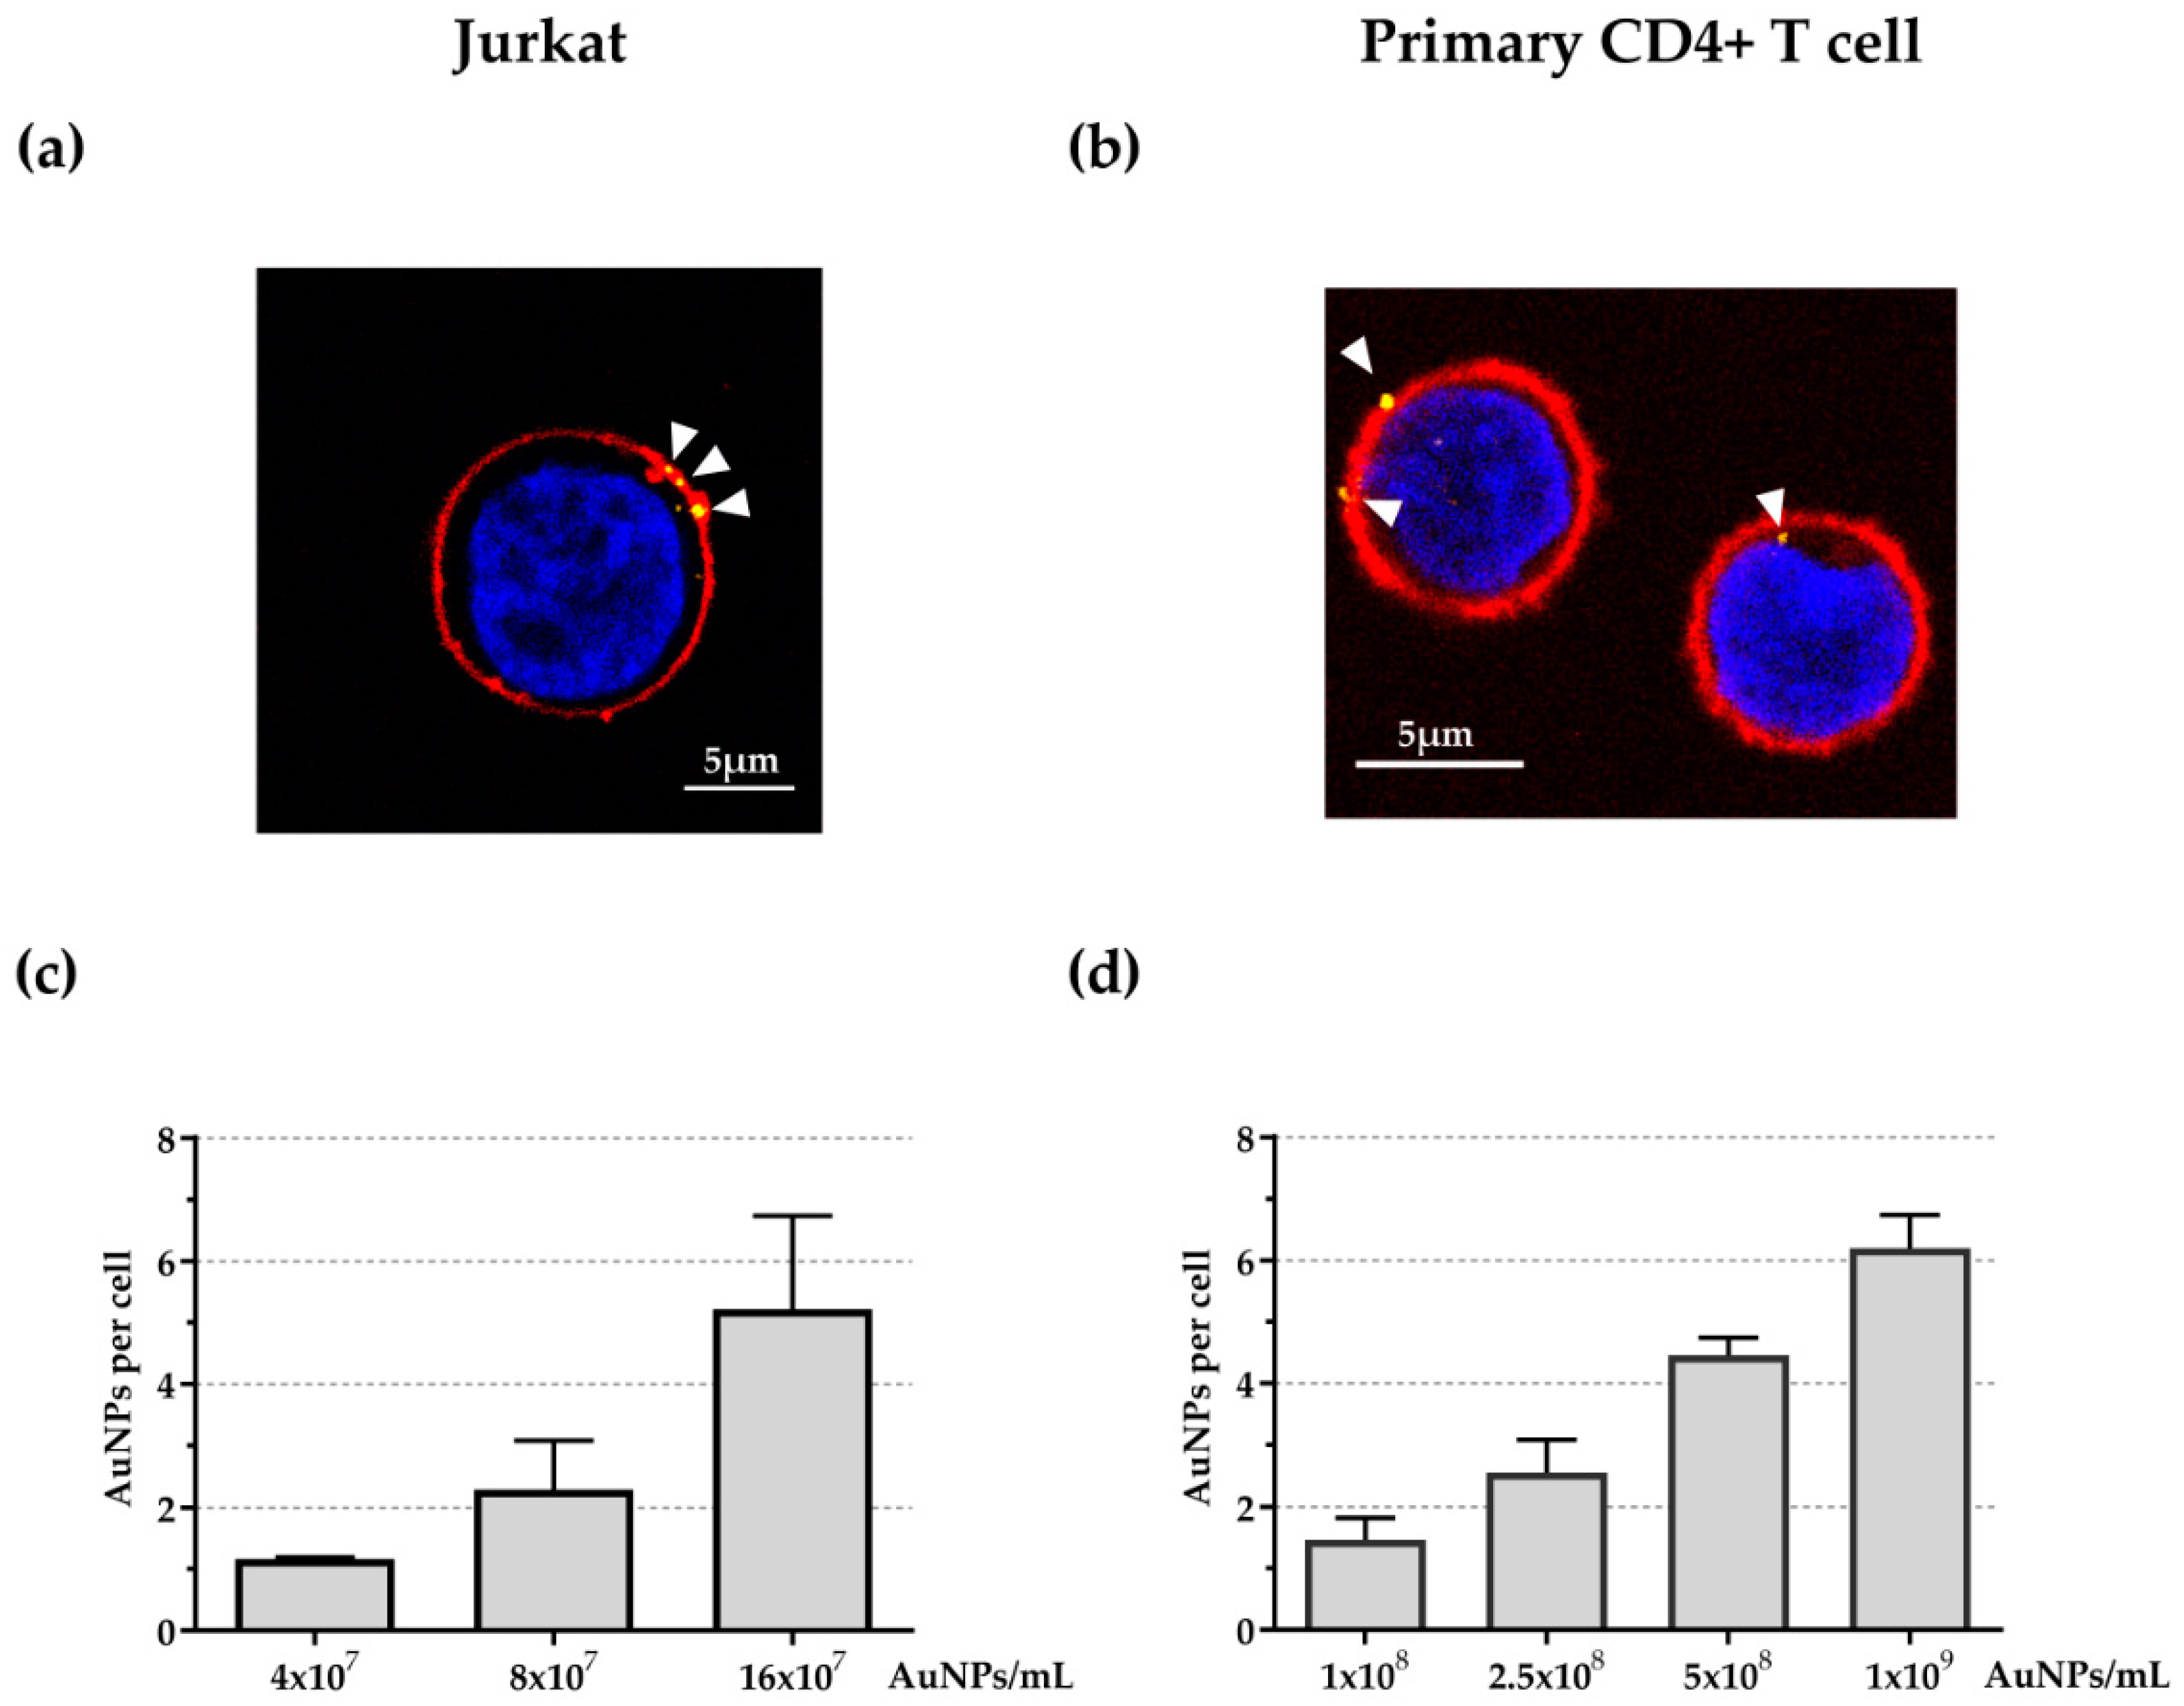
3.3. Visualization and Quantification of AuNP Attachment to Jurkat and Primary Human CD4+ T Cells
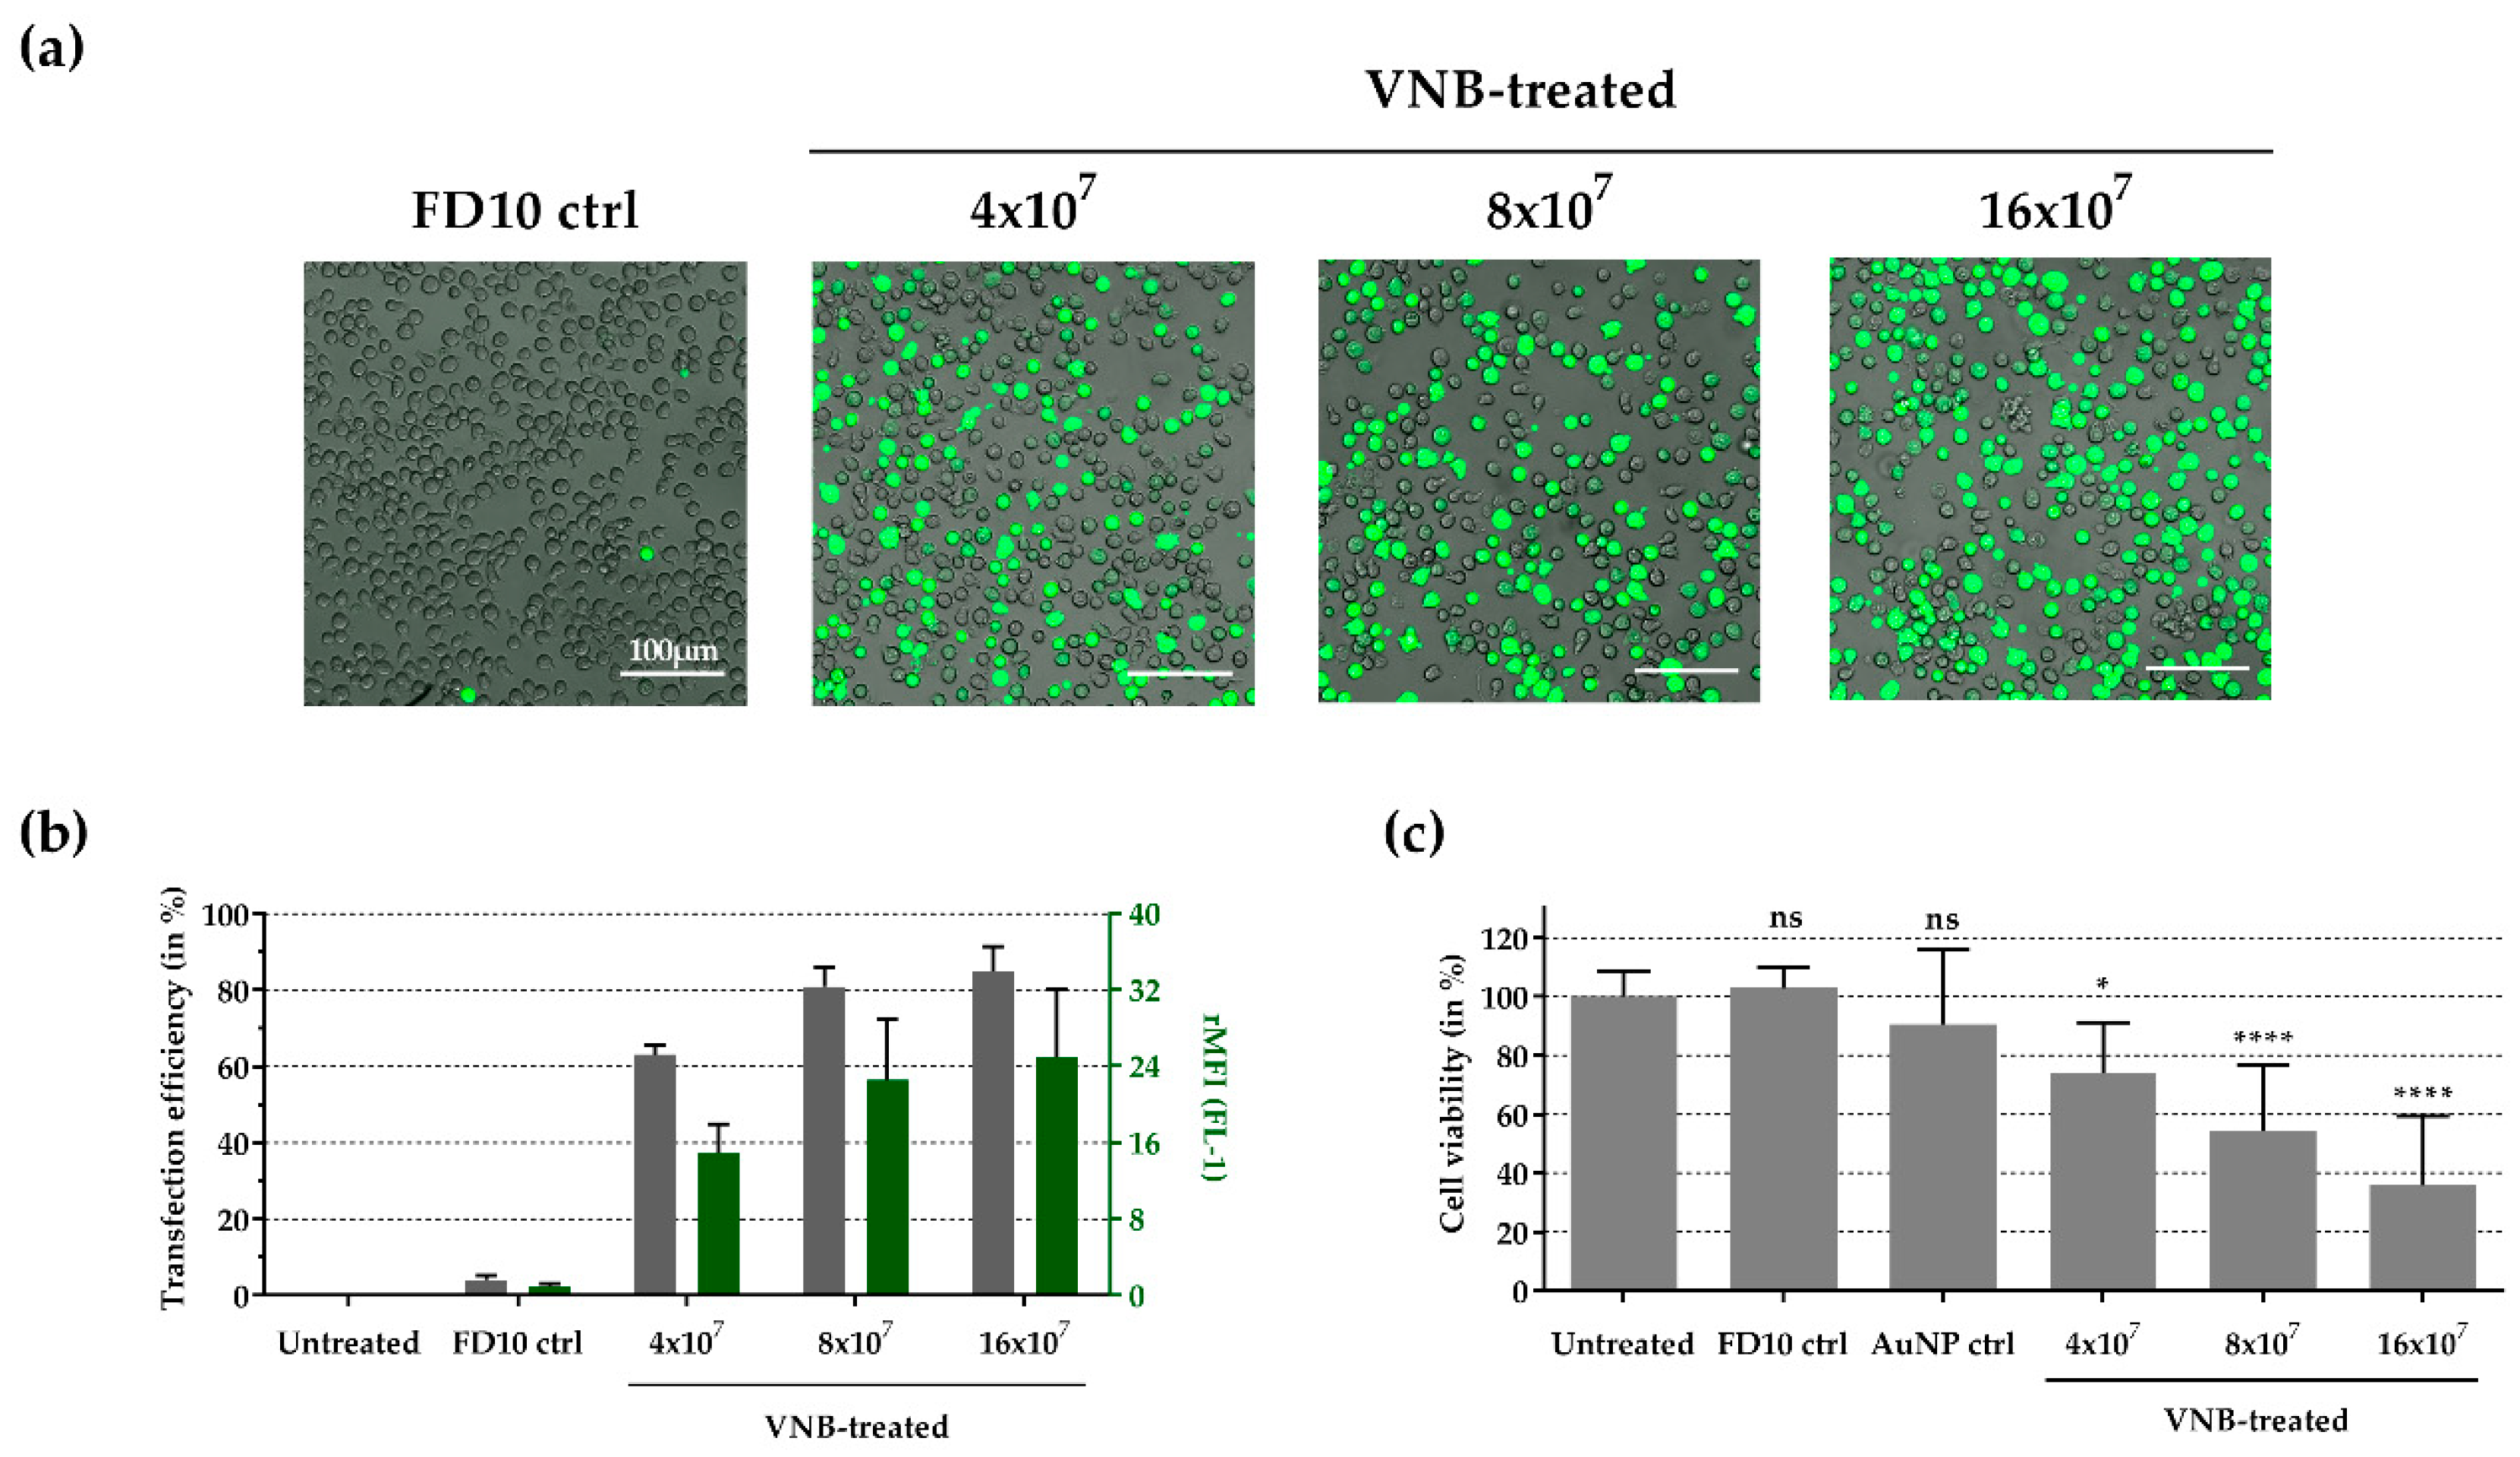
3.4. Intracellular Delivery of FITC-Dextran 10 kDa into Jurkat Cells
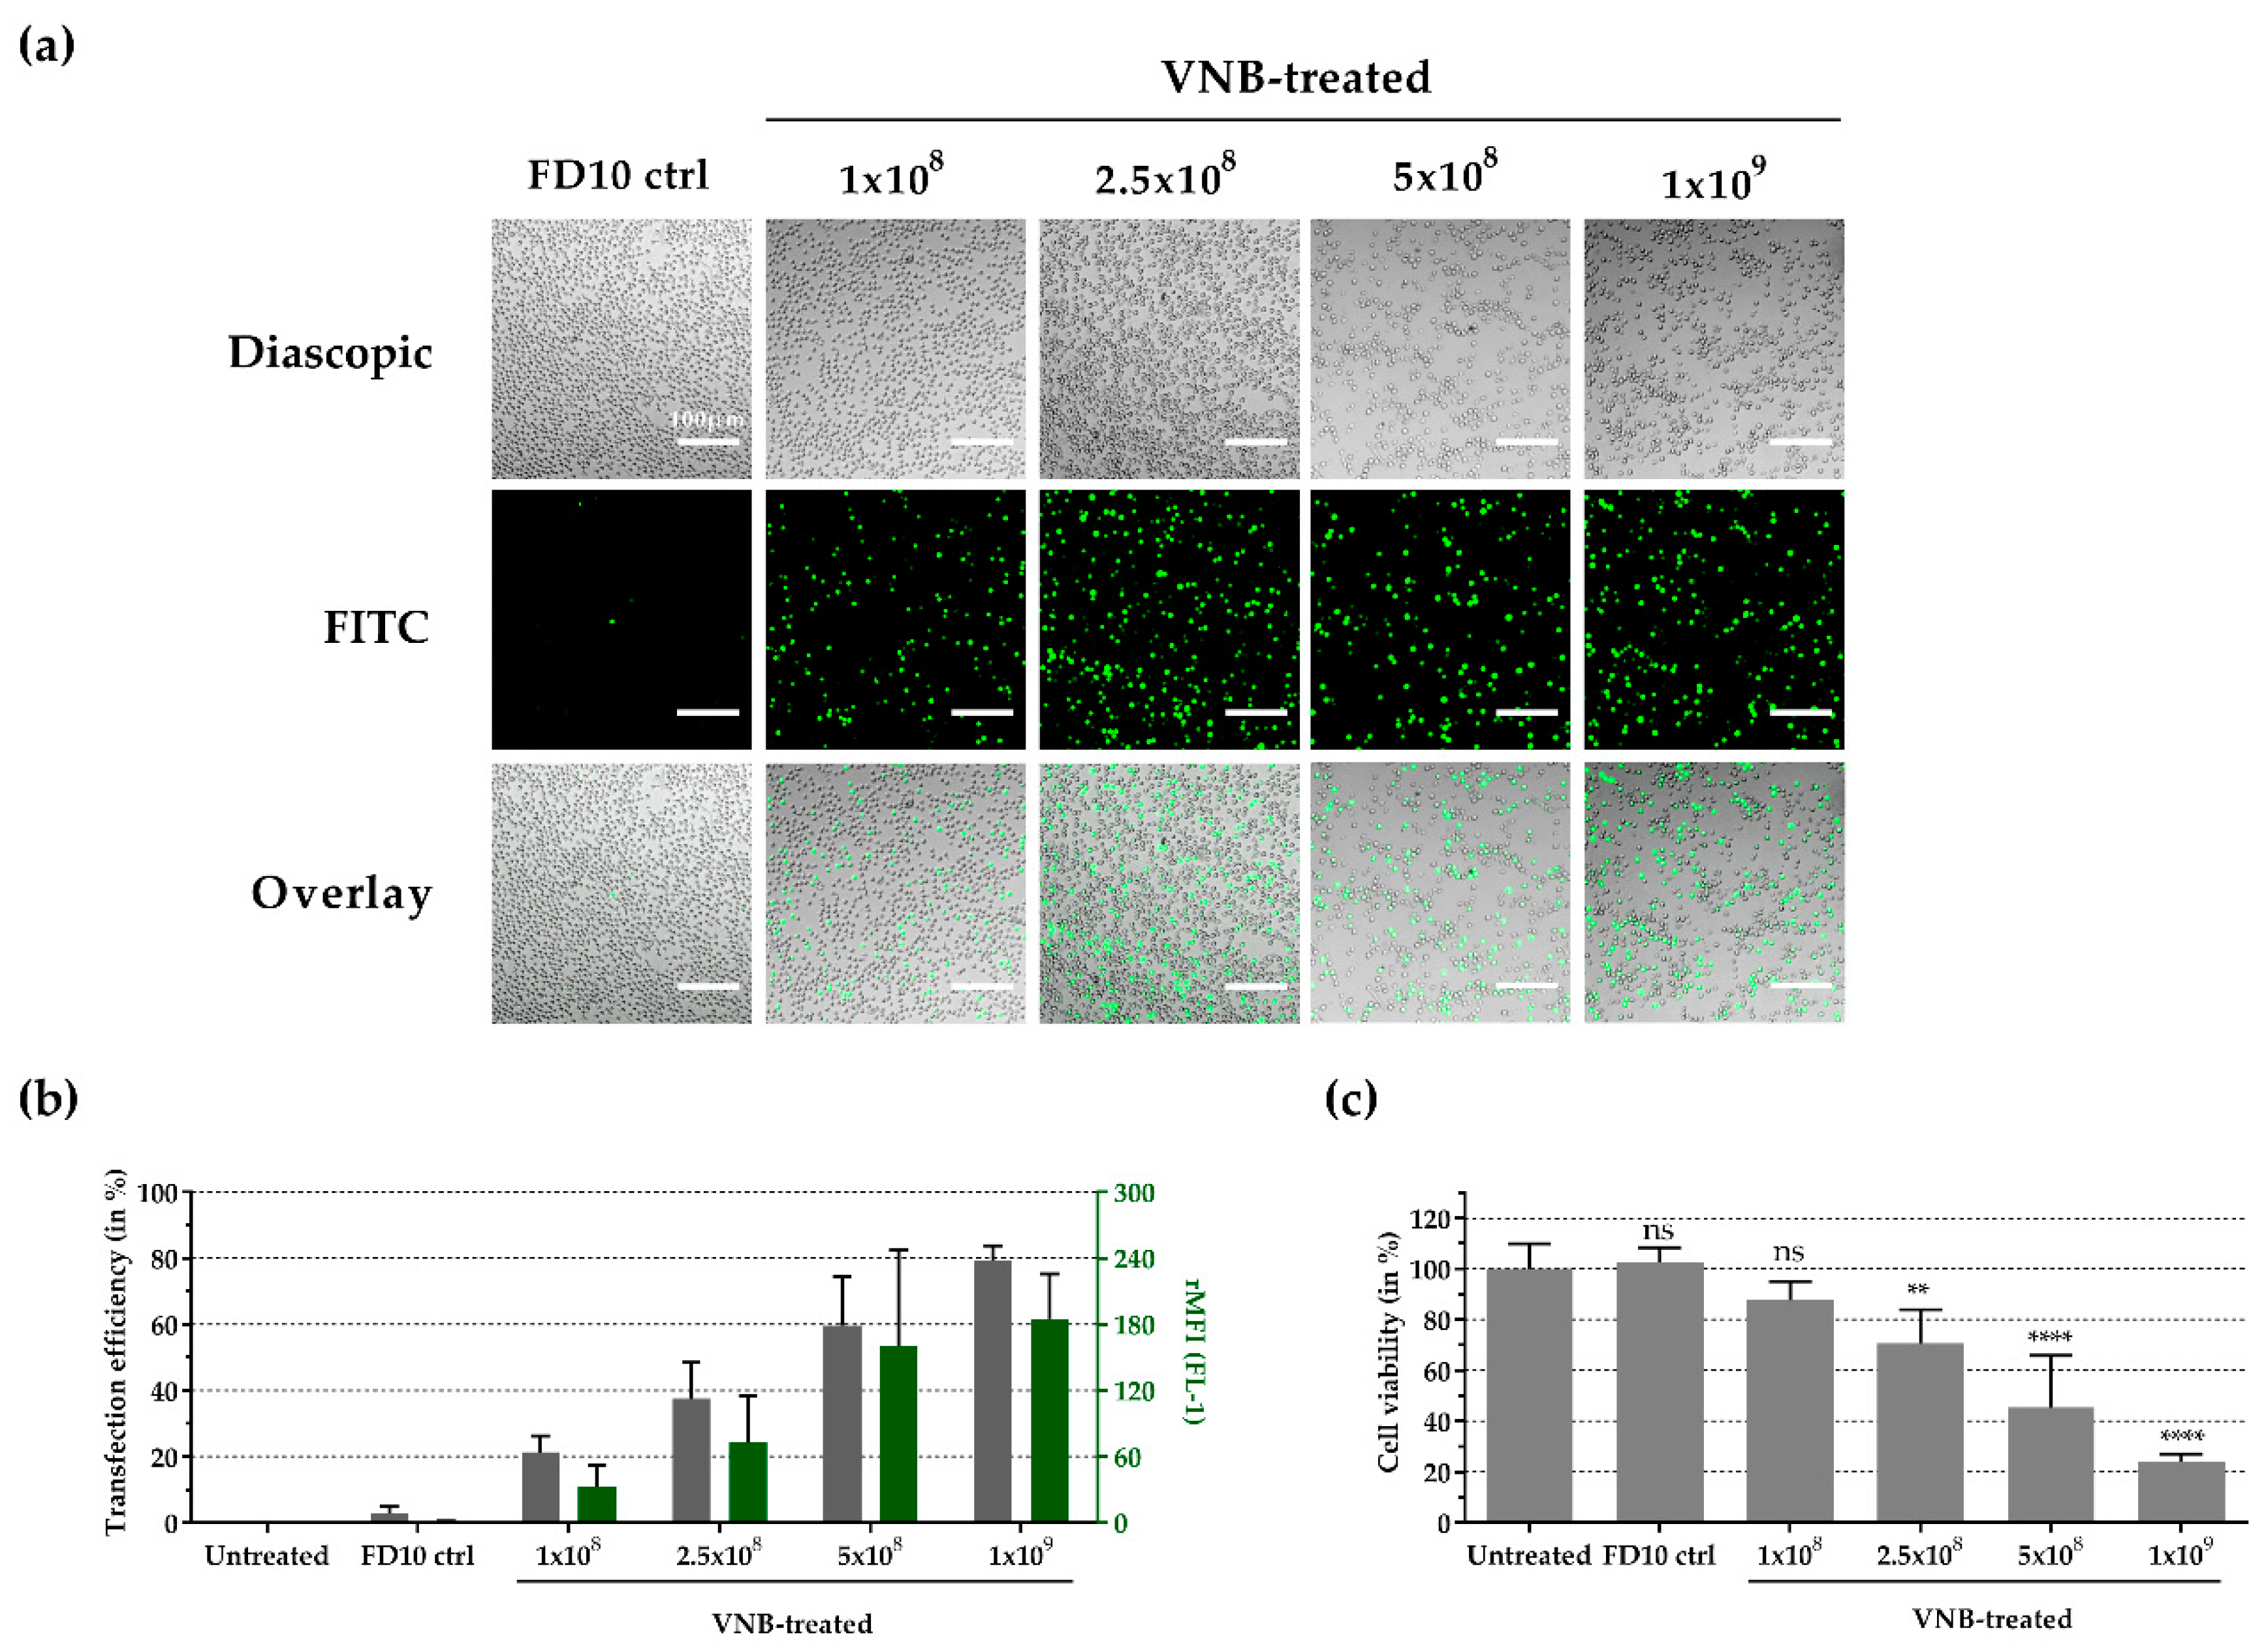
3.5. Intracellular Delivery of FITC-Dextran 10 kDa into Primary Human CD4+ T Cells
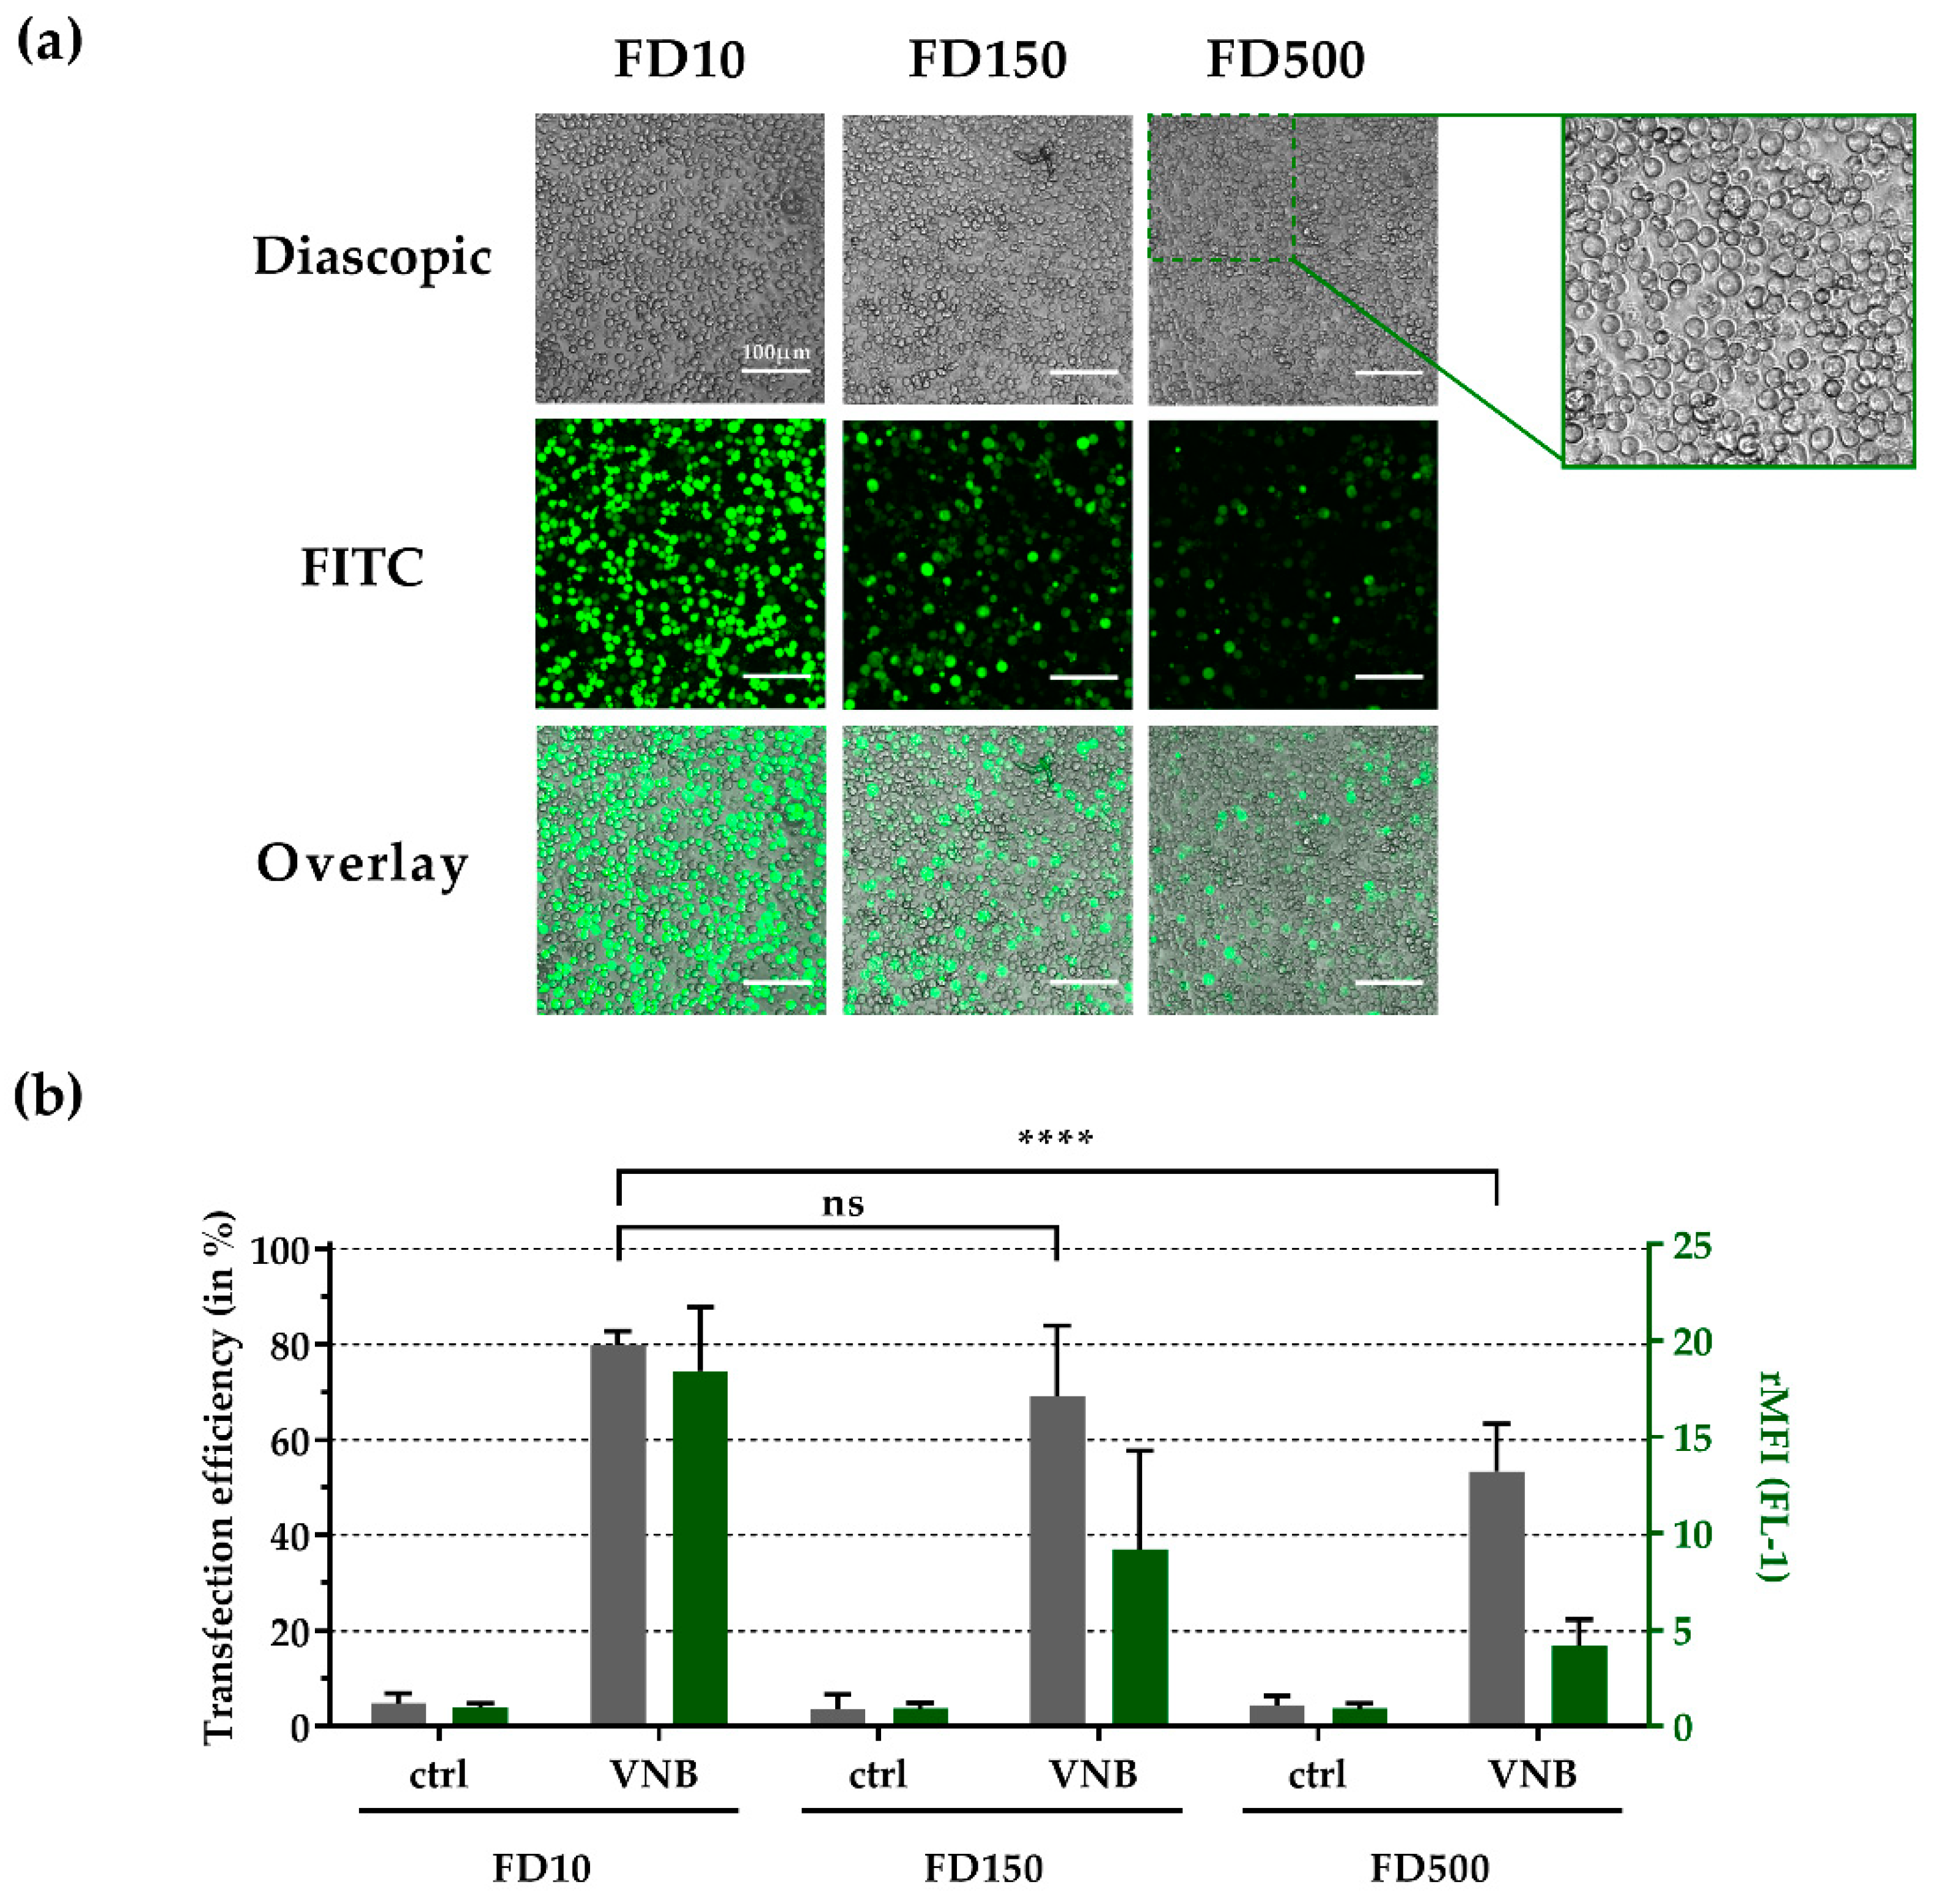
3.6. Intracellular Delivery of Higher Molecular Weight FITC-Dextrans into Jurkat Cells
4. Discussion
Author Contributions
Funding
Conflicts of Interest
References
- June, C.H.; Levine, B.L. T cell engineering as therapy for cancer and HIV: Our synthetic future. Philos. Trans. R. Soc. B Biol. Sci. 2015, 370, 20140374. [Google Scholar] [CrossRef] [PubMed]
- Sadelain, M.; Rivière, I.; Riddell, S. Therapeutic T cell engineering. Nature 2017, 545, 423–431. [Google Scholar] [CrossRef] [PubMed] [Green Version]
- Fesnak, A.D.; June, C.H.; Levine, B.L. Engineered T cells: The promise and challenges of cancer immunotherapy. Nat. Rev. Cancer 2016, 16, 566–581. [Google Scholar] [CrossRef] [PubMed]
- Hale, M.; Mesojednik, T.; Romano Ibarra, G.S.; Sahni, J.; Bernard, A.; Sommer, K.; Scharenberg, A.M.; Rawlings, D.J.; Wagner, T.A. Engineering HIV-Resistant, Anti-HIV Chimeric Antigen Receptor T Cells. Mol. Ther. 2017, 25, 570–579. [Google Scholar] [CrossRef] [PubMed] [Green Version]
- Borst, J.; Ahrends, T.; Bąbała, N.; Melief, C.J.M.; Kastenmüller, W. CD4+ T cell help in cancer immunology and immunotherapy. Nat. Rev. Immunol. 2018, 18, 635–647. [Google Scholar] [CrossRef] [PubMed]
- Kennedy, R.; Celis, E. Multiple roles for CD4+ T cells in anti-tumor immune responses. Immunol. Rev. 2008, 222, 129–144. [Google Scholar] [CrossRef]
- Kamphorst, A.O.; Ahmed, R. CD4 T-cell immunotherapy for chronic viral infections and cancer. Immunotherapy 2013, 5, 975–987. [Google Scholar] [CrossRef] [PubMed] [Green Version]
- Autologous T-Cells Genetically Modified at the CCR5 Gene by Zinc Finger Nucleases SB-728 for HIV - Full Text View - ClinicalTrials.gov. Available online: https://clinicaltrials.gov/ct2/show/NCT00842634 (accessed on 23 April 2019).
- Phase 1 Dose Escalation Study of Autologous T-cells Genetically Modified at the CCR5 Gene by Zinc Finger Nucleases in HIV-Infected Patients - Full Text View - ClinicalTrials.gov. Available online: https://clinicaltrials.gov/ct2/show/NCT01044654 (accessed on 23 April 2019).
- Study of Autologous T-cells Genetically Modified at the CCR5 Gene by Zinc Finger Nucleases in HIV-Infected Subjects - Full Text View - ClinicalTrials.gov. Available online: https://clinicaltrials.gov/ct2/show/NCT01252641 (accessed on 23 April 2019).
- Varela-Rohena, A.; Carpenito, C.; Perez, E.E.; Richardson, M.; Parry, R.V.; Milone, M.; Scholler, J.; Hao, X.; Mexas, A.; Carroll, R.G.; et al. Genetic engineering of T cells for adoptive immunotherapy. Immunol. Res. 2008, 42, 166–181. [Google Scholar] [CrossRef] [Green Version]
- Hultquist, J.F.; Hiatt, J.; Schumann, K.; McGregor, M.J.; Roth, T.L.; Haas, P.; Doudna, J.A.; Marson, A.; Krogan, N.J. CRISPR–Cas9 genome engineering of primary CD4 + T cells for the interrogation of HIV–host factor interactions. Nat. Protoc. 2019, 14, 1. [Google Scholar] [CrossRef]
- Leibman, R.S.; Riley, J.L. Engineering T Cells to Functionally Cure HIV-1 Infection. Mol. Ther. 2015, 23, 1149–1159. [Google Scholar] [CrossRef] [Green Version]
- Peer, D. A daunting task: Manipulating leukocyte function with RNAi. Immunol. Rev. 2013, 253, 185–197. [Google Scholar] [CrossRef]
- Stewart, M.P.; Langer, R.; Jensen, K.F. Intracellular Delivery by Membrane Disruption: Mechanisms, Strategies, and Concepts. Chem. Rev. 2018, 118, 7409–7531. [Google Scholar] [CrossRef]
- Granot-Matok, Y.; Kon, E.; Dammes, N.; Mechtinger, G.; Peer, D. Therapeutic mRNA delivery to leukocytes. J. Control. Release Off. J. Control. Release Soc. 2019, 305, 165–175. [Google Scholar] [CrossRef]
- Yin, H.; Kanasty, R.L.; Eltoukhy, A.A.; Vegas, A.J.; Dorkin, J.R.; Anderson, D.G. Non-viral vectors for gene-based therapy. Nat. Rev. Genet. 2014, 15, 541–555. [Google Scholar] [CrossRef]
- Roth, T.L.; Puig-Saus, C.; Yu, R.; Shifrut, E.; Carnevale, J.; Li, P.J.; Hiatt, J.; Saco, J.; Krystofinski, P.; Li, H.; et al. Reprogramming human T cell function and specificity with non-viral genome targeting. Nature 2018, 559, 405. [Google Scholar] [CrossRef]
- Sahay, G.; Querbes, W.; Alabi, C.; Eltoukhy, A.; Sarkar, S.; Zurenko, C.; Karagiannis, E.; Love, K.; Chen, D.; Zoncu, R.; et al. Efficiency of siRNA delivery by lipid nanoparticles is limited by endocytic recycling. Nat. Biotechnol. 2013, 31, 653–658. [Google Scholar] [CrossRef] [Green Version]
- Vermeulen, L.M.P.; Brans, T.; Samal, S.K.; Dubruel, P.; Demeester, J.; Smedt, S.C.D.; Remaut, K.; Braeckmans, K. Endosomal Size and Membrane Leakiness Influence Proton Sponge-Based Rupture of Endosomal Vesicles. ACS Nano 2018, 12, 2332–2345. [Google Scholar] [CrossRef] [Green Version]
- Schaffer, D.V.; Fidelman, N.A.; Dan, N.; Lauffenburger, D.A. Vector unpacking as a potential barrier for receptor-mediated polyplex gene delivery. Biotechnol. Bioeng. 2000, 67, 598–606. [Google Scholar] [CrossRef]
- Stewart, M.P.; Sharei, A.; Ding, X.; Sahay, G.; Langer, R.; Jensen, K.F. In vitro and ex vivo strategies for intracellular delivery. Nature 2016, 538, 183–192. [Google Scholar] [CrossRef] [Green Version]
- Shi, J.; Ma, Y.; Zhu, J.; Chen, Y.; Sun, Y.; Yao, Y.; Yang, Z.; Xie, J. A Review on Electroporation-Based Intracellular Delivery. Molecules 2018, 23, 3044. [Google Scholar] [CrossRef]
- Venslauskas, M.S.; Šatkauskas, S. Mechanisms of transfer of bioactive molecules through the cell membrane by electroporation. Eur. Biophys. J. 2015, 44, 277–289. [Google Scholar] [CrossRef]
- DiTommaso, T.; Cole, J.M.; Cassereau, L.; Buggé, J.A.; Hanson, J.L.S.; Bridgen, D.T.; Stokes, B.D.; Loughhead, S.M.; Beutel, B.A.; Gilbert, J.B.; et al. Cell engineering with microfluidic squeezing preserves functionality of primary immune cells in vivo. Proc. Natl. Acad. Sci. 2018, 115, E10907–E10914. [Google Scholar] [CrossRef] [Green Version]
- Zhang, M.; Ma, Z.; Selliah, N.; Weiss, G.; Genin, A.; Finkel, T.H.; Cron, R.Q. The impact of Nucleofection® on the activation state of primary human CD4 T cells. J. Immunol. Methods 2014, 408, 123–131. [Google Scholar] [CrossRef]
- Sharei, A.; Zoldan, J.; Adamo, A.; Sim, W.Y.; Cho, N.; Jackson, E.; Mao, S.; Schneider, S.; Han, M.-J.; Lytton-Jean, A.; et al. A vector-free microfluidic platform for intracellular delivery. Proc. Natl. Acad. Sci. 2013, 110, 2082–2087. [Google Scholar] [CrossRef] [Green Version]
- Sharei, A.; Trifonova, R.; Jhunjhunwala, S.; Hartoularos, G.C.; Eyerman, A.T.; Lytton-Jean, A.; Angin, M.; Sharma, S.; Poceviciute, R.; Mao, S.; et al. Ex Vivo Cytosolic Delivery of Functional Macromolecules to Immune Cells. PLoS ONE 2015, 10, e0118803. [Google Scholar] [CrossRef]
- Qin, Z.; Bischof, J.C. Thermophysical and biological responses of gold nanoparticle laser heating. Chem. Soc. Rev. 2012, 41, 1191–1217. [Google Scholar] [CrossRef]
- Komiyama, M.; Yoshimoto, K.; Sisido, M.; Ariga, K. Chemistry Can Make Strict and Fuzzy Controls for Bio-Systems: DNA Nanoarchitectonics and Cell-Macromolecular Nanoarchitectonics. Bull. Chem. Soc. Jpn. 2017, 90, 967–1004. [Google Scholar] [CrossRef] [Green Version]
- Xiong, R.; Samal, S.K.; Demeester, J.; Skirtach, A.G.; Smedt, S.C.D.; Braeckmans, K. Laser-assisted photoporation: Fundamentals, technological advances and applications. Adv. Phys. X 2016, 1, 596–620. [Google Scholar] [CrossRef]
- Lukianova-Hleb, E.; Hu, Y.; Latterini, L.; Tarpani, L.; Lee, S.; Drezek, R.A.; Hafner, J.H.; Lapotko, D.O. Plasmonic Nanobubbles as Transient Vapor Nanobubbles Generated Around Plasmonic Nanoparticles. ACS Nano 2010, 4, 2109–2123. [Google Scholar] [CrossRef]
- Lapotko, D. Optical excitation and detection of vapor bubbles around plasmonic nanoparticles. Opt. Express 2009, 17, 2538–2556. [Google Scholar] [CrossRef]
- Xiong, R.; Raemdonck, K.; Peynshaert, K.; Lentacker, I.; De Cock, I.; Demeester, J.; De Smedt, S.C.; Skirtach, A.G.; Braeckmans, K. Comparison of gold nanoparticle mediated photoporation: Vapor nanobubbles outperform direct heating for delivering macromolecules in live cells. ACS Nano 2014, 8, 6288–6296. [Google Scholar] [CrossRef]
- Wayteck, L.; Xiong, R.; Braeckmans, K.; De Smedt, S.C.; Raemdonck, K. Comparing photoporation and nucleofection for delivery of small interfering RNA to cytotoxic T cells. J. Control. Release Off. J. Control. Release Soc. 2017, 267, 154–162. [Google Scholar] [CrossRef]
- Turkevich, J.; Stevenson, P.C.; Hillier, J. A study of the nucleation and growth processes in the synthesis of colloidal gold. Discuss. Faraday Soc. 1951, 11, 55–75. [Google Scholar] [CrossRef]
- Vermeulen, L.M.P.; Fraire, J.C.; Raes, L.; De Meester, E.; De Keulenaer, S.; Van Nieuwerburgh, F.; De Smedt, S.; Remaut, K.; Braeckmans, K. Photothermally Triggered Endosomal Escape and Its Influence on Transfection Efficiency of Gold-Functionalized JetPEI/pDNA Nanoparticles. Int. J. Mol. Sci. 2018, 19, 2400. [Google Scholar] [CrossRef]
- Haiss, W.; Thanh, N.T.K.; Aveyard, J.; Fernig, D.G. Determination of Size and Concentration of Gold Nanoparticles from UV−Vis Spectra. Anal. Chem. 2007, 79, 4215–4221. [Google Scholar] [CrossRef]
- Xu, Y.; Gustafson, B.Å.S. A generalized multiparticle Mie-solution: Further experimental verification. J. Quant. Spectrosc. Radiat. Transf. 2001, 70, 395–419. [Google Scholar] [CrossRef]
- González-Rubio, G.; Guerrero-Martínez, A.; Liz-Marzán, L.M. Reshaping, Fragmentation, and Assembly of Gold Nanoparticles Assisted by Pulse Lasers. Acc. Chem. Res. 2016, 49, 678–686. [Google Scholar] [CrossRef] [Green Version]
- Labanieh, L.; Majzner, R.G.; Mackall, C.L. Programming CAR-T cells to kill cancer. Nat. Biomed. Eng. 2018, 2, 377. [Google Scholar] [CrossRef]
- Xiong, R.; Drullion, C.; Verstraelen, P.; Demeester, J.; Skirtach, A.G.; Abbadie, C.; De Vos, W.H.; De Smedt, S.C.; Braeckmans, K. Fast spatial-selective delivery into live cells. J. Control. Release 2017, 266, 198–204. [Google Scholar] [CrossRef]
- Xiong, R.; Verstraelen, P.; Demeester, J.; Skirtach, A.G.; Timmermans, J.-P.; De Smedt, S.C.; De Vos, W.H.; Braeckmans, K. Selective Labeling of Individual Neurons in Dense Cultured Networks With Nanoparticle-Enhanced Photoporation. Front. Cell. Neurosci. 2018, 12, 80. [Google Scholar] [CrossRef] [Green Version]
- Bošnjak, B.; Permanyer, M.; Sethi, M.K.; Galla, M.; Maetzig, T.; Heinemann, D.; Willenzon, S.; Förster, R.; Heisterkamp, A.; Kalies, S. CRISPR/Cas9 Genome Editing Using Gold-Nanoparticle-Mediated Laserporation. Adv. Biosyst. 2018, 2, 1700184. [Google Scholar] [CrossRef]
- Gebauer, J.S.; Malissek, M.; Simon, S.; Knauer, S.K.; Maskos, M.; Stauber, R.H.; Peukert, W.; Treuel, L. Impact of the Nanoparticle–Protein Corona on Colloidal Stability and Protein Structure. Langmuir 2012, 28, 9673–9679. [Google Scholar] [CrossRef]
- Charbgoo, F.; Nejabat, M.; Abnous, K.; Soltani, F.; Taghdisi, S.M.; Alibolandi, M.; Thomas Shier, W.; Steele, T.W.J.; Ramezani, M. Gold nanoparticle should understand protein corona for being a clinical nanomaterial. J. Controlled Release 2018, 272, 39–53. [Google Scholar] [CrossRef]
- Mislick, K.A.; Baldeschwieler, J.D. Evidence for the role of proteoglycans in cation-mediated gene transfer. Proc. Natl. Acad. Sci. 1996, 93, 12349. [Google Scholar] [CrossRef]
- Riedl, S.A.B.; Kaiser, P.; Raup, A.; Synatschke, C.V.; Jérôme, V.; Freitag, R. Non-Viral Transfection of Human T Lymphocytes. Processes 2018, 6, 188. [Google Scholar] [CrossRef]
- Zarska, M.; Novotny, F.; Havel, F.; Sramek, M.; Babelova, A.; Benada, O.; Novotny, M.; Saran, H.; Kuca, K.; Musilek, K.; et al. Two-Step Mechanism of Cellular Uptake of Cationic Gold Nanoparticles Modified by (16-Mercaptohexadecyl) trimethylammonium Bromide. Bioconjug. Chem. 2016, 27, 2558–2574. [Google Scholar] [CrossRef]
- Fadnes, B.; Husebekk, A.; Svineng, G.; Rekdal, Ø.; Yanagishita, M.; Kolset, S.O.; Uhlin-Hansen, L. The proteoglycan repertoire of lymphoid cells. Glycoconj. J. 2012, 29, 513–523. [Google Scholar] [CrossRef] [Green Version]
- Olden, B.R.; Cheng, Y.; Yu, J.L.; Pun, S.H. Cationic polymers for non-viral gene delivery to human T cells. J. Control. Release 2018, 282, 140–147. [Google Scholar] [CrossRef]
- Jones, K.S.; Petrow-Sadowski, C.; Bertolette, D.C.; Huang, Y.; Ruscetti, F.W. Heparan Sulfate Proteoglycans Mediate Attachment and Entry of Human T-Cell Leukemia Virus Type 1 Virions into CD4+ T Cells. J. Virol. 2005, 79, 12692–12702. [Google Scholar] [CrossRef]
- Abraham, R.T.; Weiss, A. Jurkat T cells and development of the T-cell receptor signalling paradigm. Nat. Rev. Immunol. 2004, 4, 301–308. [Google Scholar] [CrossRef]
- Heinemann, D.; Schomaker, M.; Kalies, S.; Schieck, M.; Carlson, R.; Escobar, H.M.; Ripken, T.; Meyer, H.; Heisterkamp, A. Gold Nanoparticle Mediated Laser Transfection for Efficient siRNA Mediated Gene Knock Down. PLOS ONE 2013, 8, e58604. [Google Scholar] [CrossRef]
- Xiong, R.; Joris, F.; Liang, S.; De Rycke, R.; Lippens, S.; Demeester, J.; Skirtach, A.; Raemdonck, K.; Himmelreich, U.; De Smedt, S.C.; et al. Cytosolic Delivery of Nanolabels Prevents Their Asymmetric Inheritance and Enables Extended Quantitative in Vivo Cell Imaging. Nano Lett. 2016, 16, 5975–5986. [Google Scholar] [CrossRef] [Green Version]
- Zhang, Z.; Qiu, S.; Zhang, X.; Chen, W. Optimized DNA electroporation for primary human T cell engineering. BMC Biotechnol. 2018, 18, 4. [Google Scholar] [CrossRef]
- Singh, N.; Perazzelli, J.; Grupp, S.A.; Barrett, D.M. Early memory phenotypes drive T cell proliferation in patients with pediatric malignancies. Sci. Transl. Med. 2016, 8, 320ra3. [Google Scholar] [CrossRef]
- Sommermeyer, D.; Hudecek, M.; Kosasih, P.L.; Gogishvili, T.; Maloney, D.G.; Turtle, C.J.; Riddell, S.R. Chimeric antigen receptor-modified T cells derived from defined CD8+ and CD4+ subsets confer superior antitumor reactivity in vivo. Leukemia 2016, 30, 492–500. [Google Scholar] [CrossRef]
- Sun, B.; Zhang, Y. Overview of orchestration of CD4+ T cell subsets in immune responses. Adv. Exp. Med. Biol. 2014, 841, 1–13. [Google Scholar]
- McManus, M.T.; Haines, B.B.; Dillon, C.P.; Whitehurst, C.E.; van Parijs, L.; Chen, J.; Sharp, P.A. Small Interfering RNA-Mediated Gene Silencing in T Lymphocytes. J. Immunol. 2002, 169, 5754–5760. [Google Scholar] [CrossRef] [Green Version]
- Clift, D.; McEwan, W.A.; Labzin, L.I.; Konieczny, V.; Mogessie, B.; James, L.C.; Schuh, M. A Method for the Acute and Rapid Degradation of Endogenous Proteins. Cell 2017, 171, 1692–1706. [Google Scholar] [CrossRef]


© 2019 by the authors. Licensee MDPI, Basel, Switzerland. This article is an open access article distributed under the terms and conditions of the Creative Commons Attribution (CC BY) license (http://creativecommons.org/licenses/by/4.0/).
Share and Cite
Raes, L.; Van Hecke, C.; Michiels, J.; Stremersch, S.; Fraire, J.C.; Brans, T.; Xiong, R.; De Smedt, S.; Vandekerckhove, L.; Raemdonck, K.; et al. Gold Nanoparticle-Mediated Photoporation Enables Delivery of Macromolecules over a Wide Range of Molecular Weights in Human CD4+ T Cells. Crystals 2019, 9, 411. https://0-doi-org.brum.beds.ac.uk/10.3390/cryst9080411
Raes L, Van Hecke C, Michiels J, Stremersch S, Fraire JC, Brans T, Xiong R, De Smedt S, Vandekerckhove L, Raemdonck K, et al. Gold Nanoparticle-Mediated Photoporation Enables Delivery of Macromolecules over a Wide Range of Molecular Weights in Human CD4+ T Cells. Crystals. 2019; 9(8):411. https://0-doi-org.brum.beds.ac.uk/10.3390/cryst9080411
Chicago/Turabian StyleRaes, Laurens, Clarissa Van Hecke, Julie Michiels, Stephan Stremersch, Juan C. Fraire, Toon Brans, Ranhua Xiong, Stefaan De Smedt, Linos Vandekerckhove, Koen Raemdonck, and et al. 2019. "Gold Nanoparticle-Mediated Photoporation Enables Delivery of Macromolecules over a Wide Range of Molecular Weights in Human CD4+ T Cells" Crystals 9, no. 8: 411. https://0-doi-org.brum.beds.ac.uk/10.3390/cryst9080411