Polarization Dependence of Low-Frequency Vibrations from Multiple Faces in an Organic Single Crystal

Department of Chemistry and Bar Ilan Institute for Nanotechnology and Advanced Materials, Bar Ilan University, Ramat Gan 5290002, Israel
*
Authors to whom correspondence should be addressed.
Crystals 2019, 9(8), 425; https://0-doi-org.brum.beds.ac.uk/10.3390/cryst9080425
Submission received: 16 July 2019
/
Revised: 5 August 2019
/
Accepted: 14 August 2019
/
Published: 16 August 2019
(This article belongs to the Special Issue Raman Spectroscopy of Crystals)
Abstract
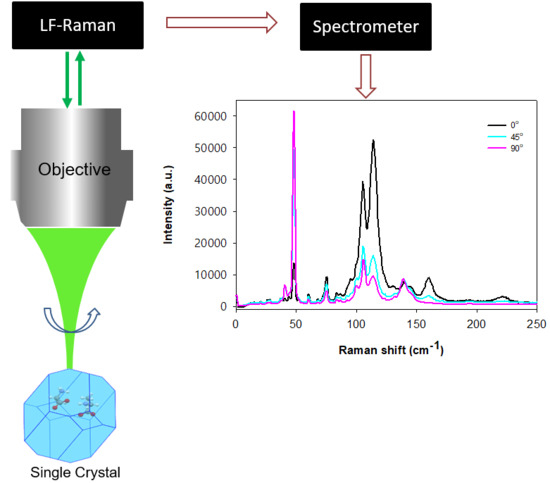
:Recent developments in optical filters have enabled the facile use of Raman spectroscopy for detection of low frequency (LF) vibrational modes. LF-Raman spectroscopy offers fast and sensitive characterization of LF vibrations, and enables the measurement of single microcrystals and detection of defects. It is useful for probing intermolecular interactions in crystals, which are lower in energy, such as hydrogen bonds, shear modes, and breathing modes. Crystal excitation from multiple faces allows learning the orientation of intermolecular interactions, as polarization dependence varies with the polarizability of the interactions along the planes. Elucidating the orientations of the intermolecular interactions in organic crystals is essential for guiding the reactions or adsorption to a specific crystal face. In this study, we investigated the dependence of the LF-Raman signal intensity on the orientation of an organic single microcrystal of L-alanine. Three incident beam directions provided the orientations of the intermolecular interactions by analyzing the corresponding LF-Raman spectra. The signal intensity correlated well with the proximity between the incident beam’s direction and the orientations of the intermolecular interactions. Excellent compatibility was found between the spectra and simulated orientations based on structural information.
1. Introduction
Under proper conditions, pure compounds ranging from small molecules to organometallic complexes, proteins, and polymers are organized into highly ordered crystal structures. During crystallization, these compounds typically adopt a unique three-dimensional orientation. The crystal structure affects many physical and chemical properties. In drug crystals, the structure may have an impact on pharmaceutical properties [1,2,3]. Therefore, it is extremely important to investigate and understand the structure and orientations of intermolecular interactions in crystals. To date, many different physical techniques have been used to characterize crystalline structures, such as X-ray diffraction (XRD) [4], thermal analysis [5], and electron microscopy [6]. Recently, low-frequency (LF) Raman was presented as a tool for chiral characterization of crystalline powders [7,8].
In general, each face of a single crystal provides detailed structural information. The most common experimental method that allows resolution of individual atoms is single crystal X-ray diffraction (SCXRD) [9,10]. However, it requires an at least partially transparent and sufficiently large crystal (of over 10 µm). Another method for characterizing crystals, that uses X-rays, is near edge X-ray absorption fine structure, this technique determines the molecular orientation for nontransparent samples [11,12]. Raman spectroscopy provides information on both covalent bonds based on intramolecular vibrations and intermolecular interactions [13,14,15]. In general, this method is considered fast, as one Raman measurement requires a few seconds while a XRD measurement normally takes over 10 min. Furthermore, higher sensitivity was established for Raman compared to XRD in crystal purity investigations [8]. LF-Raman focuses on intermolecular interactions, including shear modes, breathing modes, and hydrogen bond stretching modes, which are lower in energy and provide LF shifts. Previous publications state that vibrational modes in the region of 0–100 cm−1 are generated by weak interactions, such as molecular degrees of freedom and shear modes [16,17], while vibrational modes in the region of 100–200 cm−1 are generated by stronger intermolecular interactions such as hydrogen bonds [18,19]. LF-Raman bands were assigned to hydrogen bond stretching vibrations using the density functional theory (DFT) calculations [20].
Light polarization determination and manipulation are crucial for many optical applications. Light polarization is essential for many metrology applications such as stress analysis [21], pharmaceutical ingredient analysis [22], and biological microscopy [23], as dependence on light polarization indicates the polarizability of the measured chemical interactions. Different polarizations of light may enrich color diversity in devices by ranging degrees of absorption in different materials, an essential property for LCD screens [24], 3D movies [25], and glare-reducing sunglasses [26]. Previous studies have used polarized Raman spectroscopy for various applications in material characterization [27,28,29]. Polarization dependence in Raman [30,31], along with transmission electron microscopy, was recently used to investigate the crystallographic orientation of a dark crystal [32].
In this study, we present a new method for the investigation of crystal structures by studying vibrational modes obtained from each face of a single crystal using LF-Raman. This method does not require any transparency of the measured crystal, as collecting Raman scattering is done in reflection mode. In addition, the crystal diameter can be as small as the focus of the exciting laser. Our model is an L-alanine single crystal [33,34], where LF-Raman was employed to study the correlation between the signal intensity at three incident beam directions and the orientations of intermolecular interactions when excited from multiple faces. The Mercury program was used to study the structural information of the measured single crystal and to simulate orientations of intermolecular interactions from different faces of the crystal. Comparing the obtained LF-Raman spectra to the structures achieved by Mercury showed extremely high compatibility, verifying that this method is useful for investigating single crystals.
2. Materials and Methods
Materials: analytical-grade L-alanine (> 99.5%) was purchased from Merck. For recrystallization, double distilled water was used, which was obtained by purifying water through a Barnstead EASY Pure II osmosis system (Thermo Fisher Scientific Inc., Kiryat Shmona, Israel).
Recrystallization of alanine: a supersaturated stock solution of L-alanine was prepared by dissolving 400 mg/mL in water, which was warmed up to 60 °C. The solution was stirred for 30 min and left to cool and crystallize at room temperature. Various crystal sizes were obtained from this synthesis, the length of (101) plane ranged from 500–2000 µm. Three crystals with different sizes were measured in this research.
Structure drawings: simulations of the L-alanine crystal structure and plane calculations were performed by the Mercury program using CIF number LALNIN26 from the Cambridge Crystallographic Data Center (CCDC).
Chemical fingerprint Raman: this term refers to the spectral range of above 200 cm−1, often-called regular Raman scattering. These spectra were taken using a micro-Raman instrument (Scientific LabRAM HR, HORIBA Jobin Yvon, Palaiseau, France), in air at room temperature. Different faces of the crystal were excited by a laser with an excitation wavelength of λex = 532 nm and optical power of 30 mW with acquisition time of 5 seconds and grating groove density of 600 g/mm. The acromatic λ/2 plate with retardance accuracy of > λ/100 was located before the instrument so that the returning beam will not depolarize. Three polarization directions were measured: 0, 45, and 90 degrees. These Raman spectra are presented in Supplementary Figures S1–S3.
LF-Raman: LF-Raman measurements were taken using an integrated laser and VHG filter system (ONDAX, XLF-MICRO 532 nm) with 50 mW of optical power at an excitation wavelength of λex = 532 nm. The laser output was routed into a lab-built microscope, and the Raman signal was fiber-coupled into an imaging spectrometer (SP-2500i, Princeton Instruments, Trenton, NJ, USA) with an EM-CCD camera (Pro-EM 16002, Princeton Instruments, Trenton, NJ, USA). The acromatic λ/2 plate with retardance accuracy of > λ/100 was located inside the ONDAX box, right after the laser, so that the returning beam would not depolarize. Three polarization directions were measured: 0, 45, and 90 degrees. The acquisition time was 25 seconds, and the groove density of the selected grating was 1800 g/mm. Five or more spots were tested in each measured face for polarization dependence.
3. Results and Discussion
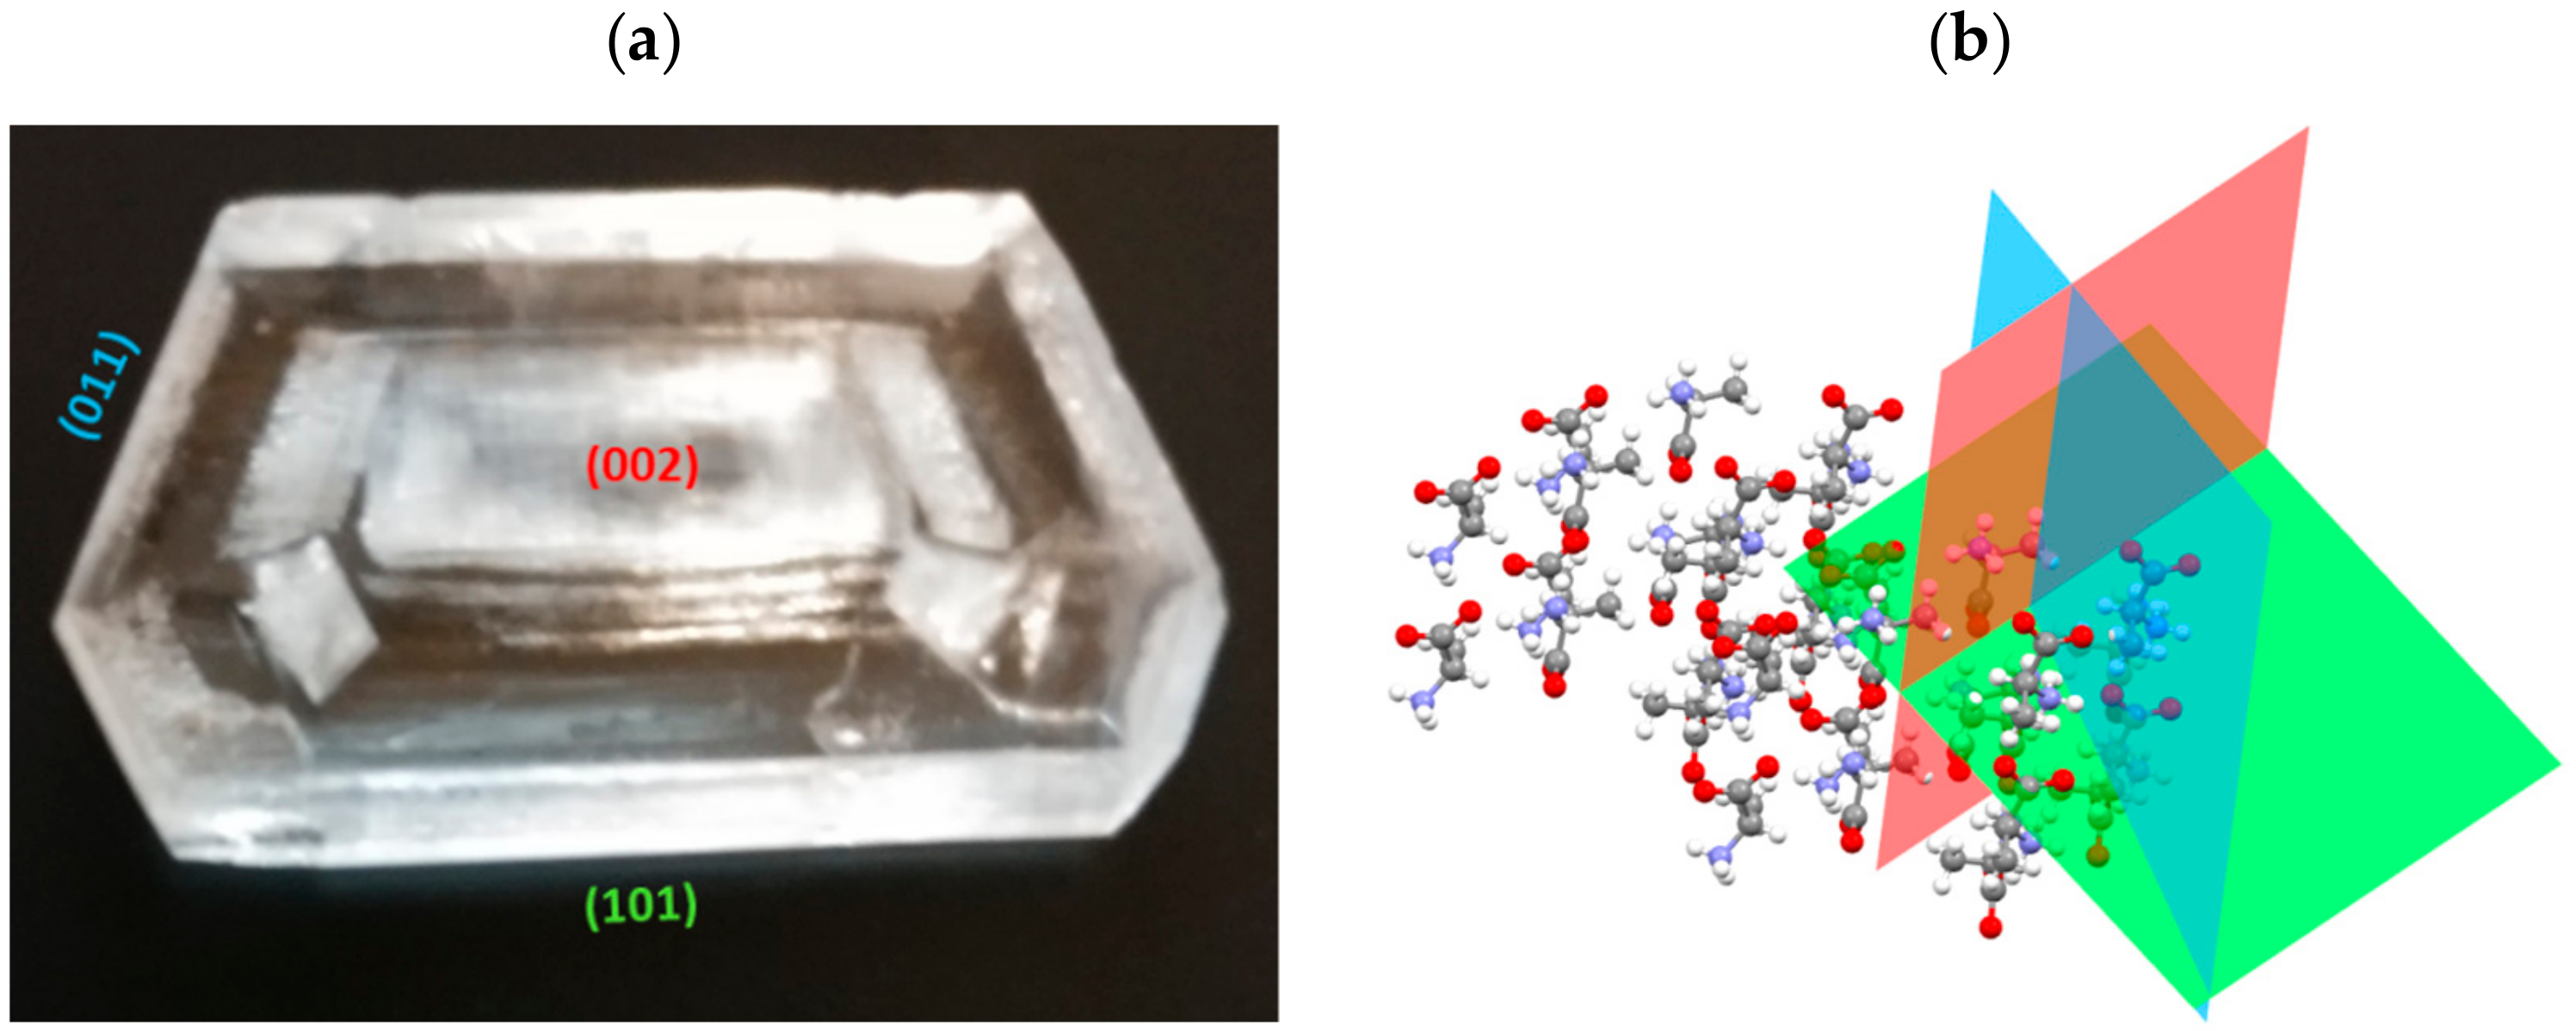
L-alanine was crystallized, and three main planes of a single crystal were characterized using LF-Raman: (101), (002), and (011). The planes selected for this study were expected to show significant differences, as they are almost perpendicular to each other. Figure 1 introduces the biggest obtained L-alanine single crystal (length of (101) = 2000 µm) and its investigated planes (a) and simulations of the crystal planes in the structure (b).
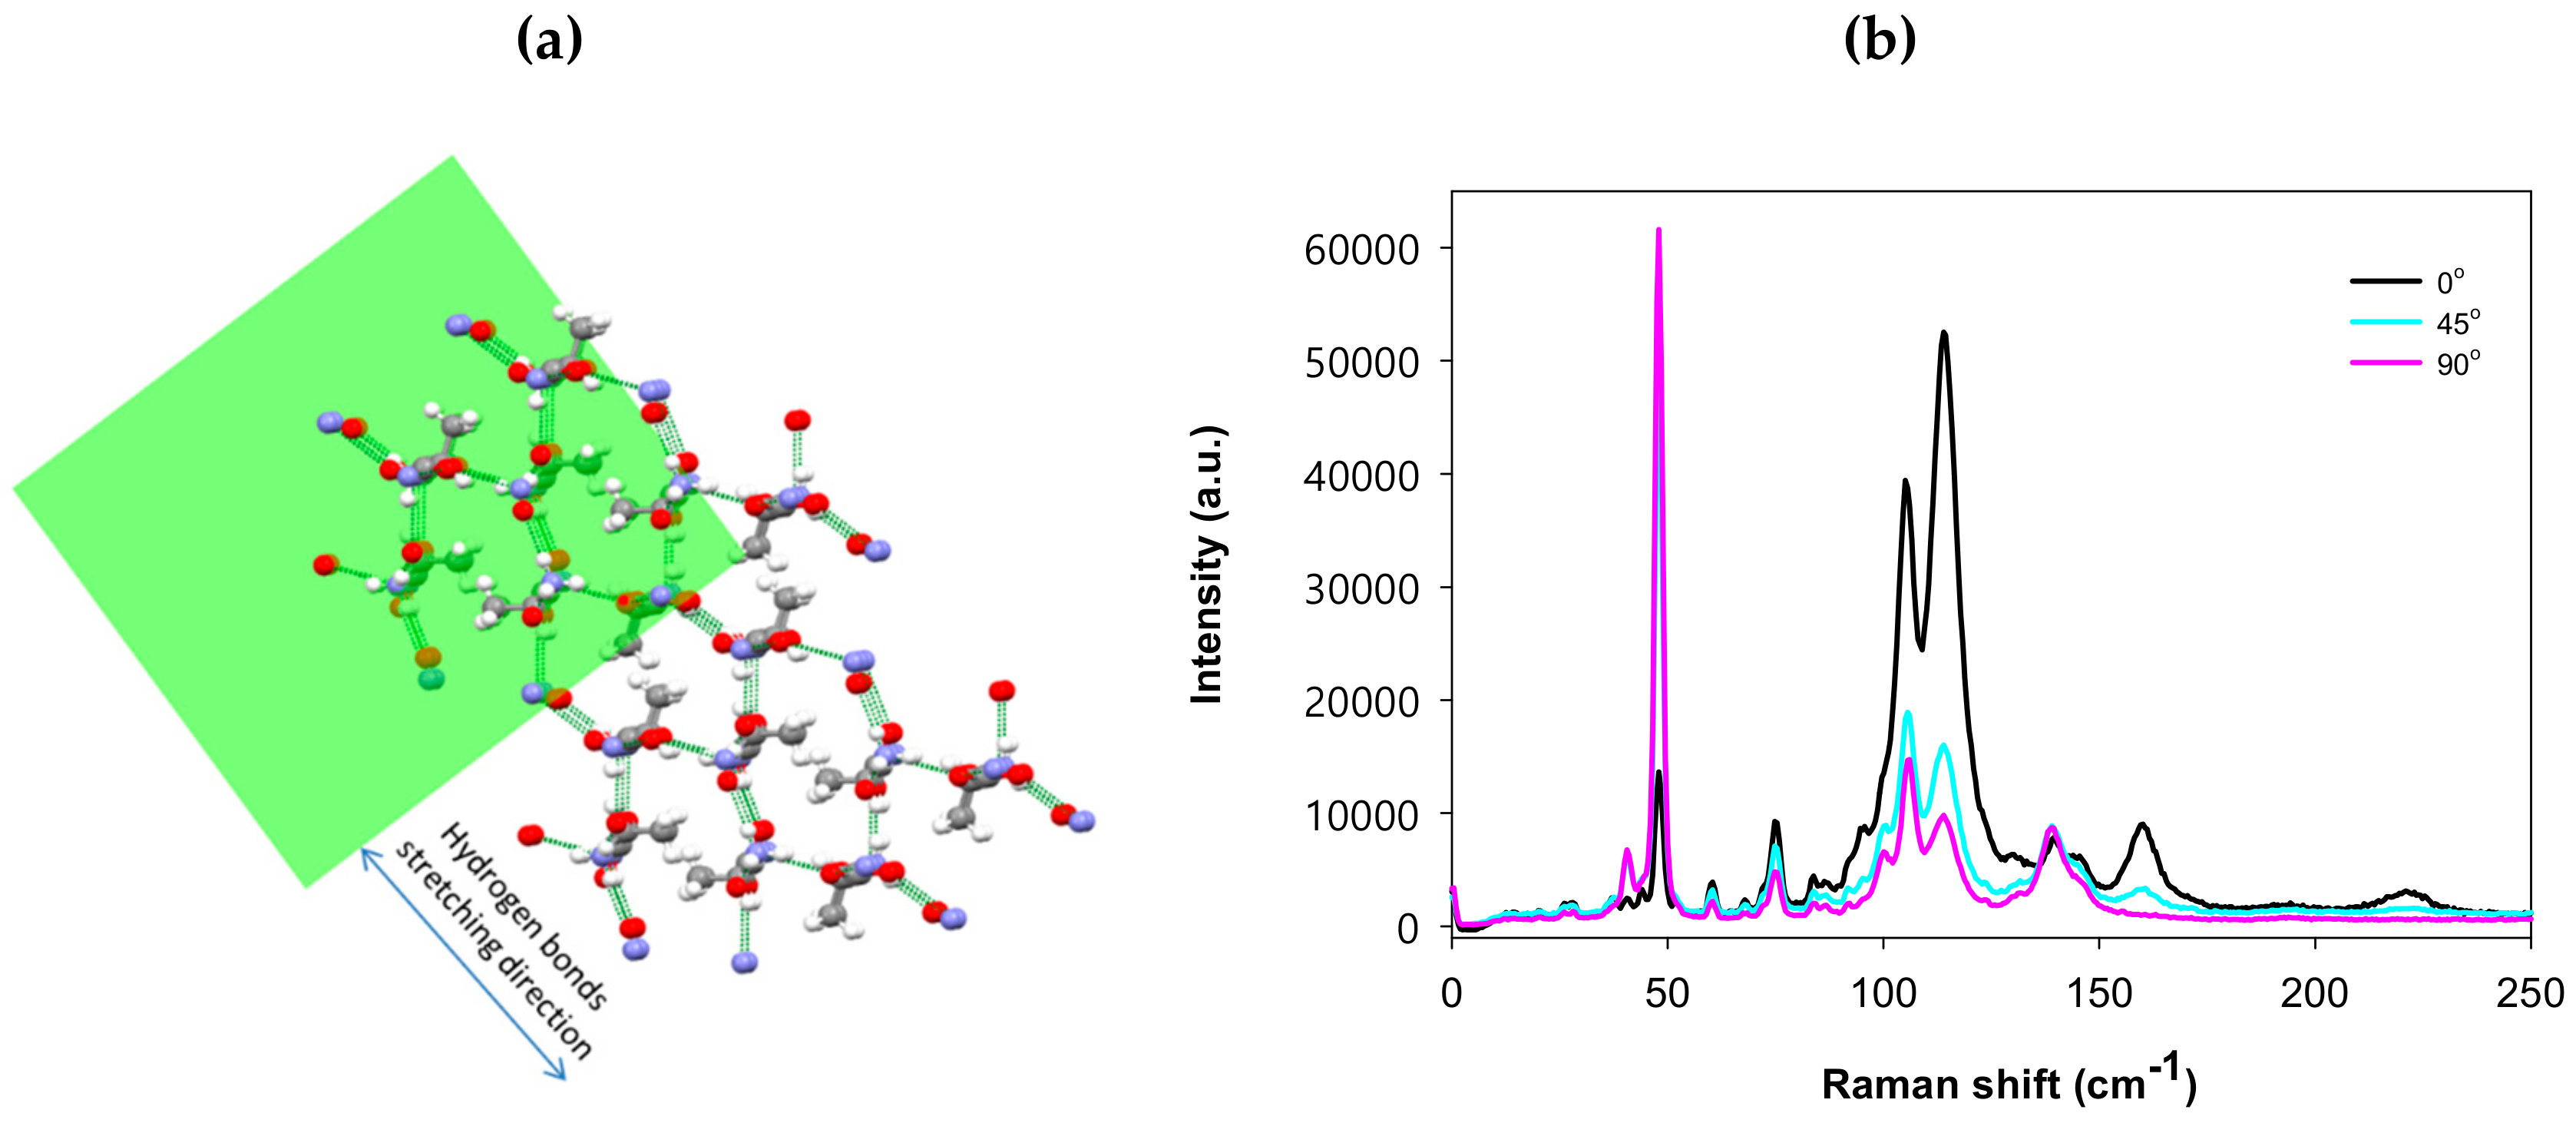
Three main Raman shifts demonstrate changes in relative intensity with the beam’s polarization direction. The shifts at 100–130 cm−1 correspond to hydrogen bond stretching. Specifically, the shift at 114 cm−1 is assigned by DFT calculations to stretching of the strong hydrogen bonds of N---H---O, while the shift at 105 cm−1 is assigned to stretching of the weaker hydrogen bonds of C–H---O=C [20]. The narrow shift at 48 cm−1 corresponds to the crystal layer shear modes [16,17,35]. Figure 2a presents a simulation of the hydrogen bonds (dashed lines) relative to the (101) plane, showing that hydrogen bonds excited from this plane are located along one axis, therefore the polarization direction is expected to determine whether hydrogen bond stretching modes are excited. Figure 2b presents LF-Raman spectra obtained from the three polarization directions, showing that the polarization direction strongly affects the distribution of photons in both spectral regions of the hydrogen bond stretching modes (strong and weak) and shear modes. Amino acid molecules form layers as they crystallize, for amino acid containing an aliphatic side chain such as alanine, a hydrogen bond’s network appears every two layers [7]. When the beam direction is parallel to the layers, a strong excitation of the hydrogen bonds’ network is expected, thereby exciting all hydrogen bond vibrations, while a beam that is perpendicular to the layers is expected to excite mostly the shear modes. The excitation direction of 0° demonstrates ~52 k counts for the Raman shift at 114 cm−1 and only 12 k counts for the shift at 48 cm−1. However, the excitation direction of 90° demonstrates only 10k counts for the Raman shift at 114 cm−1 and over 60 k counts for the shift at 48 cm−1.
When the crystal is excited from the (002) plane, the polarization direction also affects the photon distribution along the different spectral regions of the hydrogen bond stretching modes and shear modes. Unlike the (101) plane, only the strong hydrogen bond stretching mode at 114 cm−1 changes in intensity with beam polarization. Figure 3a presents a simulation of hydrogen bonds (dotted lines) relative to the (002) plane, showing that most of the bonds are vertical to this plane. However, the mode found along this plane corresponds to O---H---N stretching, which is located along one axis, as indicated in the figure. Therefore, the polarization direction should determine whether this mode is excited or not. Figure 3b presents LF-Raman spectra from the three polarization directions. In this case, the polarization direction affects only the intensity of the stronger hydrogen bond’s stretching mode, as expected from the Mercury simulation. The weaker hydrogen bond stretching of C–H---O=C maintains its intensity and is not affected by the polarization direction, this indicates that the interaction is perpendicular to the (002) plane. An excitation direction of 0° produces about 38 k counts for the Raman shift at 114 cm−1 and only 8 k counts for the shift at 48 cm−1, while excitation from 90° produces only 10 k counts for the Raman shift at 114 cm−1 and over 60 k counts for the shift at 48 cm−1.
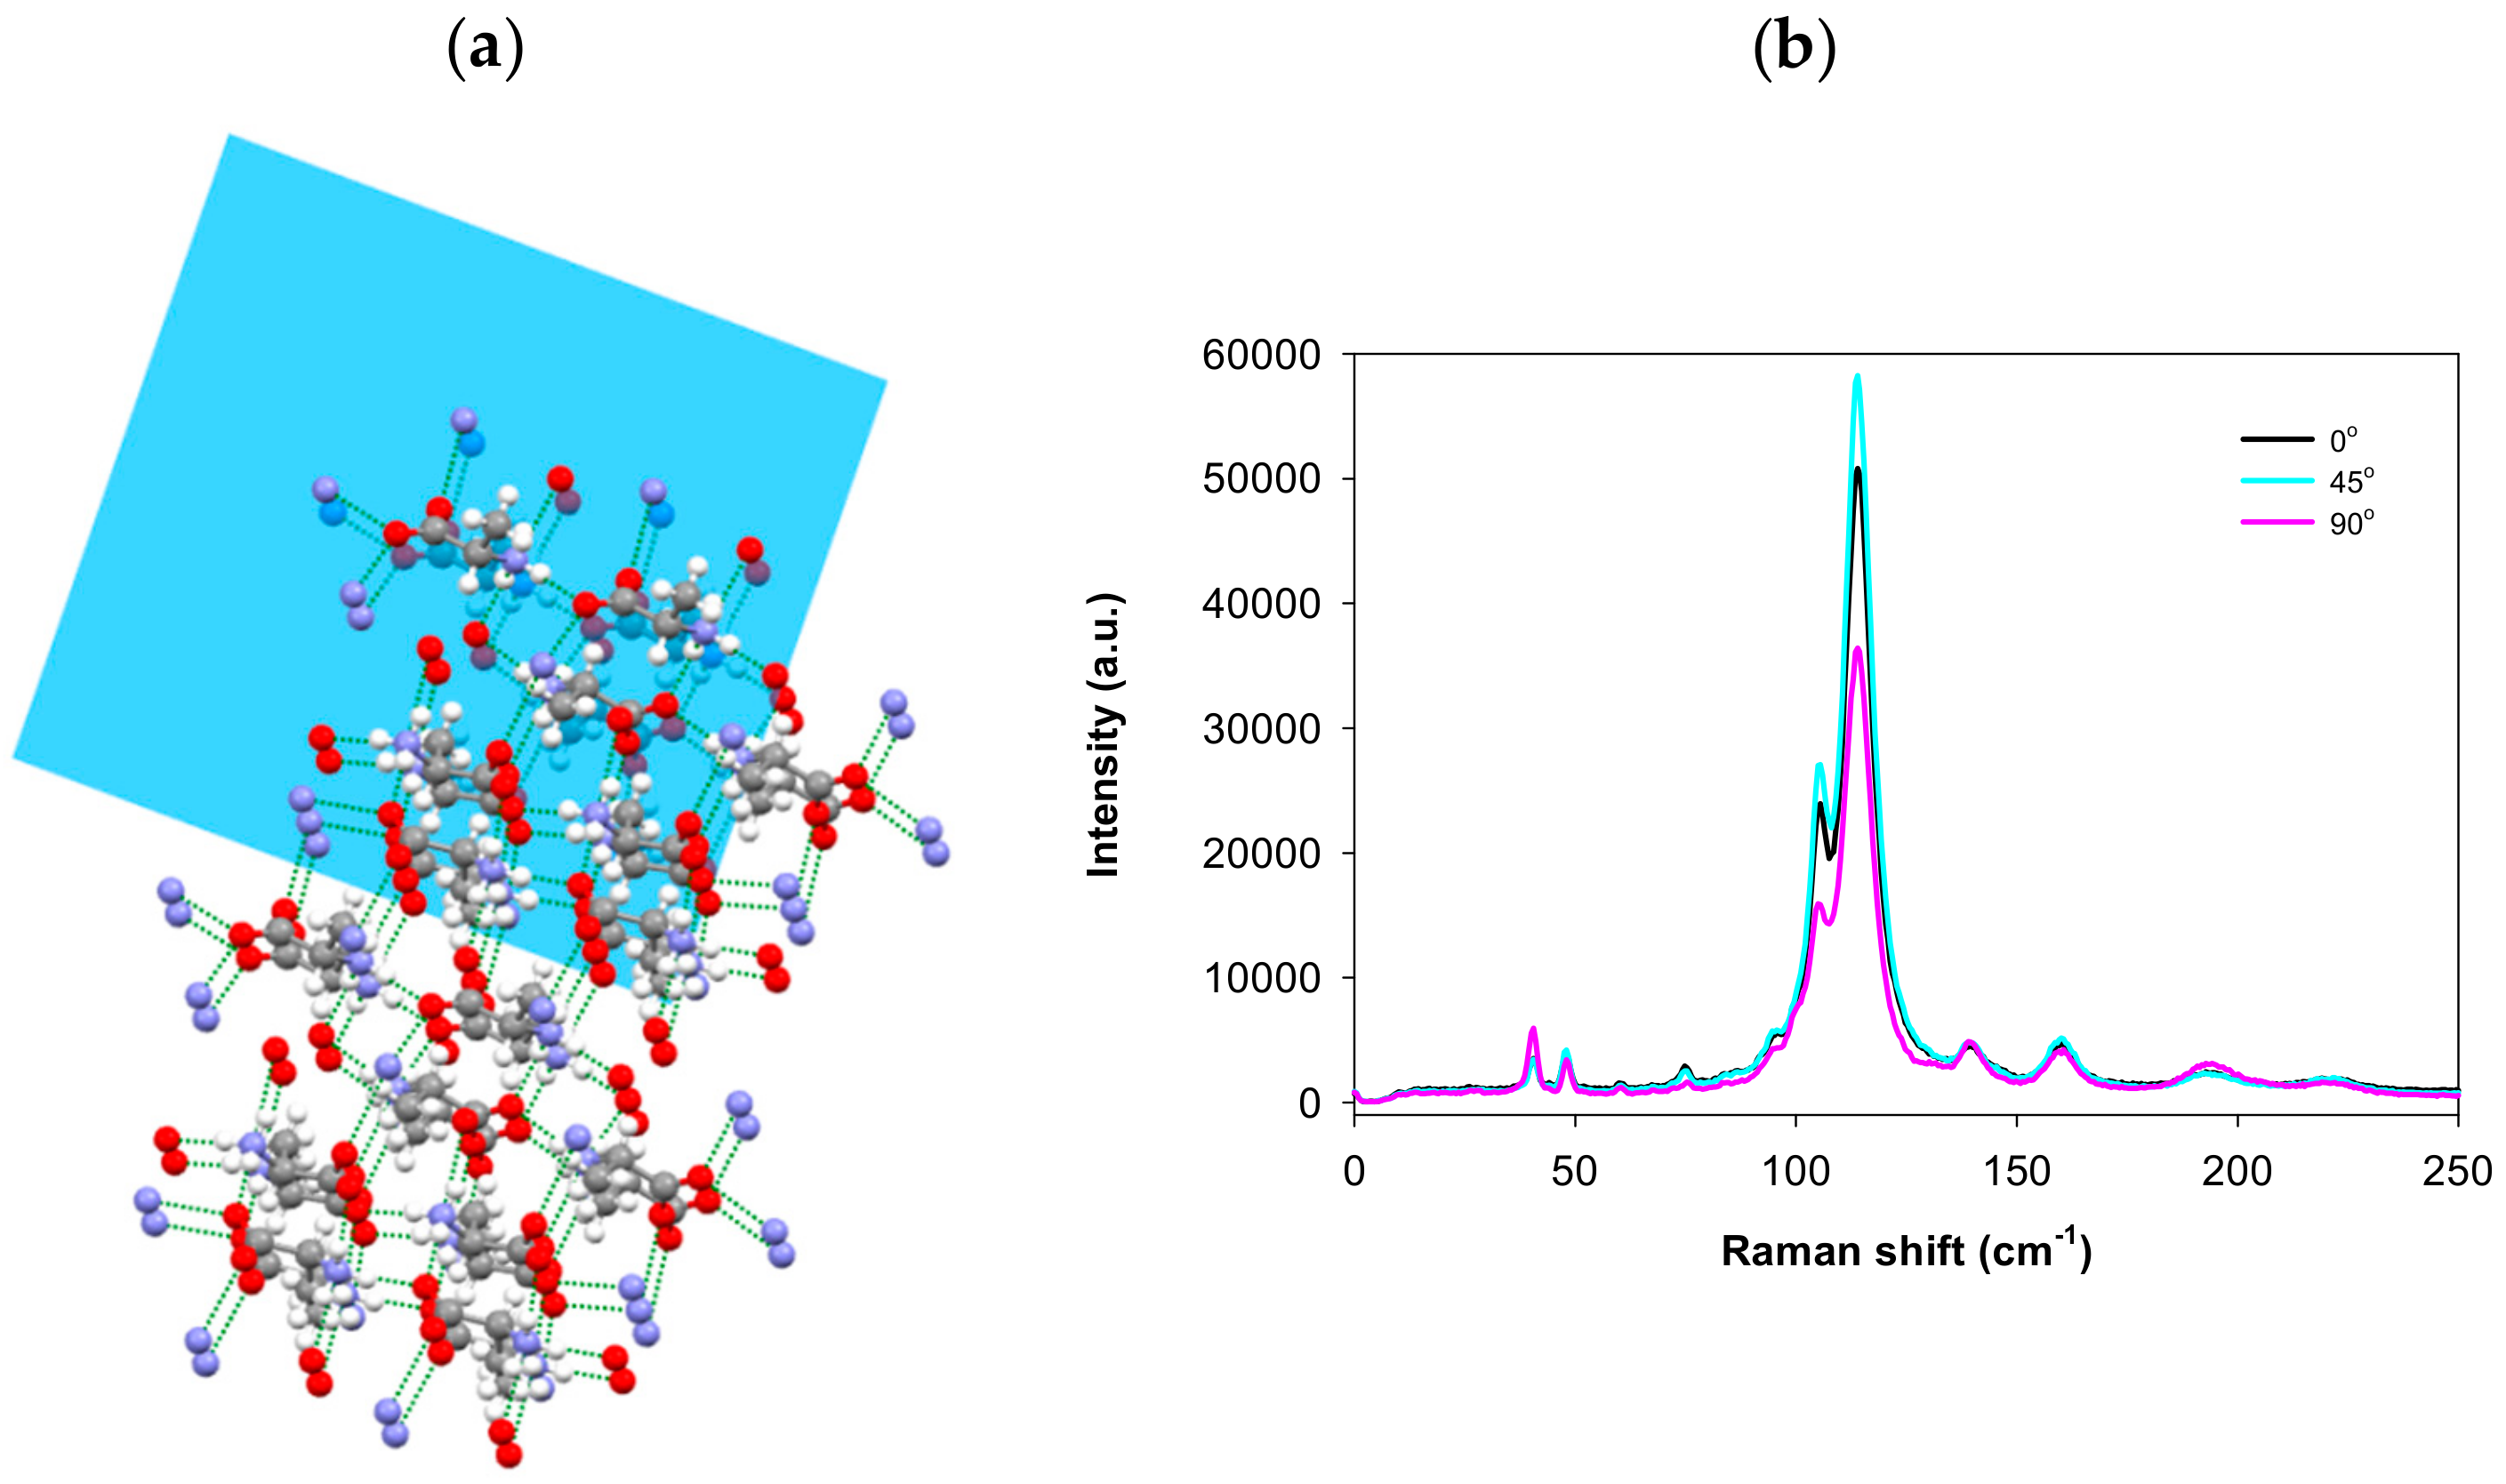
Excitation from the (011) plane demonstrated almost no dependence on polarization direction. Figure 4 presents a simulation of the hydrogen bonds (dashed lines) relative to the (011) plane, showing equal distribution of hydrogen bond stretching bands along the x and y axes of this plane, resulting in constant hydrogen bond excitation at different polarization directions. The lower energy region of shear modes in the crystal layer has low intensity and maintains its intensity with beam polarization, as this interaction is not polarizable along this plane. Overall, looking on the three measured planes, a focus on the shear mode at 48 cm−1 reveals that the (101) and (002) planes demonstrate similar polarization dependence, as this interaction is polarizable along these planes, while the (011) plane shows no dependence. It is notable that the three selected planes are not completely perpendicular (Figure 1b), and therefore minor changes are observed when the crystal is excited from the (011) plane.
The regular Raman region was also measured for the (101), (002), and (011) planes in the three polarization directions. The spectra are presented in Figures S1–S3 in the Supplementary Information. Changes in the regular Raman spectra are observed with beam polarization, these changes strongly support the suggested explanations for the LF-Raman results. Most are related to the intermolecular interactions (such as N–H and O–H modes at 3000 cm−1) and to adjacent covalent bonds (C=O mixed with N–H deformation at 1600 cm−1, carboxylate salt at 1300 cm−1, and aliphatic chain bands at 500 cm−1) [36]. Regular Raman spectra include detailed information about all covalent bond vibrations. However, the crystal structure is mainly determined by intermolecular interactions, therefore predicting it by regular Raman spectra alone is a challenging task, in particular for bulky molecules. The LF-Raman for organic crystals focuses on the spectral region of intermolecular interactions and therefore provides direct information about the crystal structure.
4. Conclusions
In this study, we investigated the crystallographic orientation of an L-alanine single microcrystal as a model organic crystal using LF-Raman spectroscopy. We showed that with LF-Raman, it is possible to detect intermolecular interactions in the crystal-hydrogen bonds and shear modes. In addition, by redirecting the beam polarization and analyzing spectral changes, we were able to study orientations of the intermolecular interactions in single crystals. For well-defined crystalline structures, such as the measured crystal, excitation from different faces is used to verify the orientations of the intermolecular interactions along the crystal. In the case of L-alanine, the (101) and (002) planes demonstrate similar polarization dependence, while the (011) plane is essentially independent of the polarization.
LF-Raman spectroscopy offers fast and sensitive characterization of LF vibrations and enables measurement of single microcrystals and defect detection. We believe that in the future, giving a rich database of the LF vibrations available, this method coupled with a proper software, will be able to provide information on crystallographic orientations of nontransparent and extremely small crystals in which the use of SCXRD is limited. It can be used as a tool for studying orientations of intermolecular interactions in organic crystals, which are essential for guiding specific reactions or adsorption to a particular crystal face. It is well known that different additives such as peptides, proteins, and organic molecules can modify crystal growth processes. The additives effect is usually rationalized by selective adsorption to a specific crystal face, which controls the morphology of the crystal. During crystallization, LF-Raman spectroscopy of the specific crystal face can provide important information about the effect of the additive on the crystal’s morphology and growth. LF-Raman spectroscopy offers an advanced technique for this purpose, as methods currently available for studying crystal surface interactions are limited and based mainly on scanning force microscopy.
Supplementary Materials
The following are available online at https://0-www-mdpi-com.brum.beds.ac.uk/2073-4352/9/8/425/s1. Figure S1: Regular Raman spectra from the (101) plane of the L-Ala crystal excited at different beam polarization directions; Figure S2: Regular Raman spectra from the (002) plane of the L-Ala crystal excited at different beam polarization directions; Figure S3: Regular Raman spectra from the (011) plane of the L-Ala crystal excited at different beam polarization directions.
Author Contributions
I.N. crystallized the L-alanine; I.N. and H.A. conducted the measurements, analyzed the results and prepared the draft; Y.M. and Y.R.T. supervised the research and reviewed the paper.
Funding
This research was financially supported by the Israel Innovation Authority.
Acknowledgments
We gratefully acknowledge the technical support given by ONDAX.
Conflicts of Interest
The authors declare no conflict of interest.
References
- Chen, J.; Sarma, B.; Evans, J.M.B.; Myerson, A.S. Pharmaceutical crystallization. Cryst. Growth Des. 2011, 11, 887–895. [Google Scholar] [CrossRef]
- Morissette, S.L.; Almarsson, Ö.; Peterson, M.L.; Remenar, J.F.; Read, M.J.; Lemmo, A.V.; Ellis, S.; Cima, M.J.; Gardner, C.R. High-throughput crystallization: Polymorphs, salts, co-crystals and solvates of pharmaceutical solids. Adv. Drug Deliv. Rev. 2004, 56, 275–300. [Google Scholar] [CrossRef] [PubMed]
- Gues-Hornedo, N.R. Denette Murphy Significance of Controlling Crystallization Mechanisms and Kinetics in Pharmaceutical Systems. J. Pharm. Sci. 1999, 88, 651–660. [Google Scholar] [CrossRef] [PubMed]
- Jimenez, I.; Arbiol, J.; Dezanneau, G.; Cornet, A.; Morante, J.R. Crystalline structure, defects and gas sensor response to NO2 and H2S of tungsten trioxide nanopowders. Sens. Actuators B Chem. 2003, 93, 475–485. [Google Scholar] [CrossRef]
- Tabi, T.; Sajó, I.E.; Szabó, F.; Luyt, A.S.; Kovács, J.G. Crystalline structure of annealed polylactic acid and its relation to processing. Express Polym. Lett. 2010, 4, 659–668. [Google Scholar] [CrossRef]
- Deng, H.; Li, X.; Peng, Q.; Wang, X.; Chen, J.; Li, Y. Monodisperse magnetic single-crystal ferrite microspheres. Angew. Chem. 2005, 117, 2842–2845. [Google Scholar] [CrossRef]
- Aviv, H.; Nemtsov, I.; Mastai, Y.; Tischler, Y.R. Characterization of Crystal Chirality in Amino Acids Using Low-Frequency Raman Spectroscopy. J. Phys. Chem. A 2017, 121, 7882–7888. [Google Scholar] [CrossRef] [PubMed]
- Nemtsov, I.; Mastai, Y.; Tischler, Y.R.; Aviv, H. Chiral Purity of Crystals Using Low-Frequency Raman Spectroscopy. ChemPhysChem 2018, 19, 3116–3121. [Google Scholar] [CrossRef]
- Crasto, D.; Malola, S.; Brosofsky, G.; Dass, A.; Hakkinen, H. Single crystal XRD structure and theoretical analysis of the chiral Au30S (S-t-Bu) 18 cluster. J. Am. Chem. Soc. 2014, 136, 5000–5005. [Google Scholar] [CrossRef]
- Dong, Q.; Fang, Y.; Shao, Y.; Mulligan, P.; Qiu, J.; Cao, L.; Huang, J. Electron-hole diffusion lengths >175 μm in solution grown CH3NH3PbI3 single crystals. Science 2015, 347, 967–971. [Google Scholar] [CrossRef]
- Bianconi, A. Surface X-Ray absorption spectroscopy: surface EXAFS and surface XANES. Appl. Surf. Sci. 1980, 6, 392–418. [Google Scholar] [CrossRef]
- Yano, J.; Yachandra, V.K. X-ray absorption spectroscopy. Photosynth. Res. 2009, 102, 241–254. [Google Scholar] [CrossRef] [PubMed] [Green Version]
- Schiff, D.; Aviv, H.; Rosenbaum, E.; Tischler, Y.R. Spectroscopic Method for Fast and Accurate Group A Streptococcus Bacteria Detection. Anal. Chem. 2016, 88, 2164–2169. [Google Scholar] [CrossRef] [PubMed]
- Aviv, H.; Berezin, S.; Agai, O.; Sinwani, M.; Tischler, Y.R. Deposition and Characterization of Roughened Surfaces. Langmuir 2017, 33, 1810–1815. [Google Scholar] [CrossRef] [PubMed]
- Zhu, G.; Zhu, X.; Fan, Q.; Wan, X. Raman spectra of amino acids and their aqueous solutions. Spectrochim. Acta Part A Mol. Biomol. Spectrosc. 2011, 78, 1187–1195. [Google Scholar] [CrossRef] [PubMed]
- Williams, M.R.C.; Aschaffenburg, D.J.; Ofori-Okai, B.K.; Schmuttenmaer, C.A. Intermolecular vibrations in hydrophobic amino acid crystals: Experiments and calculations. J. Phys. Chem. B 2013, 117, 10444–10461. [Google Scholar] [CrossRef] [PubMed]
- Niehues, G.; Heyden, M.; Schmidt, D.A.; Havenith, M.; Berzofsky, J.A.; DeLisi, C.; Haller, E.E.; Havenith, M. Exploring hydrophobicity by THz absorption spectroscopy of solvated amino acids. Faraday Discuss. 2011, 150, 193–207. [Google Scholar] [CrossRef]
- Kalanoor, B.S.; Ronen, M.; Oren, Z.; Gerber, D.; Tischler, Y.R. New Method to Study the Vibrational Modes of Biomolecules in the Terahertz Range Based on a Single-Stage Raman Spectrometer. ACS Omega 2017, 2, 1232–1240. [Google Scholar] [CrossRef] [Green Version]
- Woods, K.N.; Pfeffer, J.; Dutta, A.; Klein-Seetharaman, J.; Haak, J.R. Vibrational resonance, allostery, and activation in rhodopsin-like G protein-coupled receptors. Sci. Rep. 2016, 6, 37290–37306. [Google Scholar] [CrossRef]
- Takahashi, M.; Okamura, N.; Ding, X.; Shirakawa, H.; Minamide, H. Intermolecular hydrogen bond stretching vibrations observed in terahertz spectra of crystalline vitamins. CrystEngComm 2018, 20, 1960–1969. [Google Scholar] [CrossRef]
- Hariharan, P.; Oreb, B.F.; Brown, N. A digital phase-measurement system for real-time holographic interferometry. Opt. Commun. 1982, 41, 393–396. [Google Scholar] [CrossRef]
- Marguí, E.; Van Meel, K.; Van Grieken, R.; Buendía, A.; Fontàs, C.; Hidalgo, M.; Queralt, I. Method for the determination of Pd-catalyst residues in active pharmaceutical ingredients by means of high-energy polarized-beam energy dispersive X-ray fluorescence. Anal. Chem. 2009, 81, 1404–1410. [Google Scholar] [CrossRef] [PubMed]
- De Boer, J.F.; Milner, T.E.; van Gemert, M.J.C.; Nelson, J.S. Two-dimensional birefringence imaging in biological tissue by polarization-sensitive optical coherence tomography. Opt. Lett. 1997, 22, 934–936. [Google Scholar] [CrossRef] [PubMed] [Green Version]
- Kim, S.-C.; Kim, E.-S. A novel configuration of LCD projectors for efficient orthogonal polarization of two projected views. Opt. Commun. 2006, 266, 55–66. [Google Scholar] [CrossRef]
- Iizuka, K. Welcome to the wonderful world of 3D: introduction, principles and history. Opt. Photonics News 2006, 17, 42–51. [Google Scholar] [CrossRef]
- Padgett, M.; Allen, L. Light with a twist in its tail. Contemp. Phys. 2000, 41, 275–285. [Google Scholar] [CrossRef]
- Duesberg, G.S.; Loa, I.; Burghard, M.; Syassen, K.; Roth, S. polarized Raman. Phys. Rev. Lett. 2000, 85, 5436–5439. [Google Scholar] [CrossRef]
- Haesler, J.; Schindelholz, I.; Riguet, E.; Bochet, C.G.; Hug, W. Absolute configuration of chirally deuterated neopentane. Nature 2007, 446, 526. [Google Scholar] [CrossRef]
- Barron, L.D.; Zhu, F.; Hecht, L.; Tranter, G.E.; Isaacs, N.W. Raman optical activity: An incisive probe of molecular chirality and biomolecular structure. J. Mol. Struct. 2007, 834, 7–16. [Google Scholar] [CrossRef]
- Gorelik, V.S.; Kaminskii, A.A.; Melnik, N.N.; Sverbil, P.P.; Voinov, Y.P.; Zavaritskaya, T.N.; Zlobina, L.I. Spontaneous Raman scattering spectra of ADP and DADP crystals in different polarization schemes. J. Russ. Laser Res. 2008, 29, 357–363. [Google Scholar] [CrossRef]
- Maeda, Y.; Udono, H.; Terai, Y. Raman spectra for β-FeSi2 bulk crystals. Thin Solid Films 2004, 461, 165–170. [Google Scholar] [CrossRef]
- Kim, J.; Lee, J.U.; Lee, J.; Park, H.J.; Lee, Z.; Lee, C.; Cheong, H. Anomalous polarization dependence of Raman scattering and crystallographic orientation of black phosphorus. Nanoscale 2015, 7, 18708–18715. [Google Scholar] [CrossRef] [PubMed] [Green Version]
- Wang, C.H.; Storms, R.D. Raman Study of Hydrogen Bonding and Long-Wavelength Lattice Modes in an L-Alanine Single Crystal. J. Chem. Phys. 1971, 55, 5110–5119. [Google Scholar] [CrossRef]
- Razzetti, C.; Ardoino, M.; Zanotti, L.; Zha, M.; Paorici, C. Solution growth and characterisation of L-alanine single crystals. Cryst. Res. Technol. 2002, 37, 456–465. [Google Scholar] [CrossRef]
- Zhao, Y.; Luo, X.; Li, H.; Zhang, J.; Araujo, P.T.; Gan, C.K.; Wu, J.; Zhang, H.; Quek, S.Y.; Dresselhaus, M.S.; et al. Interlayer breathing and shear modes in few-trilayer MoS2 and WSe2. Nano Lett. 2013, 13, 1007–1015. [Google Scholar] [CrossRef] [PubMed]
- Li, F.; Men, Z.; Li, S.; Wang, S.; Li, Z.; Sun, C. Study of hydrogen bonding in ethanol-water binary solutions by Raman spectroscopy. Spectrochim. Acta Part A Mol. Biomol. Spectrosc. 2018, 189, 621–624. [Google Scholar] [CrossRef] [PubMed]
Figure 1.
(a) Photo of the L-alanine single crystal and measured planes. (b) L-alanine crystal structure showing measured planes, obtained in simulation using Mercury. Green, red, and blue represent the (101), (002), and (011) planes, respectively.
Figure 1.
(a) Photo of the L-alanine single crystal and measured planes. (b) L-alanine crystal structure showing measured planes, obtained in simulation using Mercury. Green, red, and blue represent the (101), (002), and (011) planes, respectively.

Figure 2.
(a) Hydrogen bonds’ simulation (dotted lines) in the L-alanine single crystal relative to the (101) plane. (b) Low frequency Raman spectra of the crystal excited from the (101) plane in three beam polarization directions: zero (black), 45 (cyan), and 90 (pink) degrees.
Figure 2.
(a) Hydrogen bonds’ simulation (dotted lines) in the L-alanine single crystal relative to the (101) plane. (b) Low frequency Raman spectra of the crystal excited from the (101) plane in three beam polarization directions: zero (black), 45 (cyan), and 90 (pink) degrees.

Figure 3.
(a) Simulation of hydrogen bonds (dotted lines) in the L-alanine single crystal relative to the (002) plane. (b) LF-Raman spectra of the crystal excited from the (002) plane in three beam polarization directions: zero (black), 45 (cyan), and 90 (pink) degrees.
Figure 3.
(a) Simulation of hydrogen bonds (dotted lines) in the L-alanine single crystal relative to the (002) plane. (b) LF-Raman spectra of the crystal excited from the (002) plane in three beam polarization directions: zero (black), 45 (cyan), and 90 (pink) degrees.

Figure 4.
(a) Simulation of hydrogen bonds (dotted lines) in the L-alanine single crystal relative to the (011) plane. (b) LF-Raman spectra of the crystal excited from the (011) plane in three beam polarization directions: zero (black), 45 (cyan), and 90 (pink) degrees.
Figure 4.
(a) Simulation of hydrogen bonds (dotted lines) in the L-alanine single crystal relative to the (011) plane. (b) LF-Raman spectra of the crystal excited from the (011) plane in three beam polarization directions: zero (black), 45 (cyan), and 90 (pink) degrees.

© 2019 by the authors. Licensee MDPI, Basel, Switzerland. This article is an open access article distributed under the terms and conditions of the Creative Commons Attribution (CC BY) license (http://creativecommons.org/licenses/by/4.0/).
Share and Cite
MDPI and ACS Style
Nemtsov, I.; Aviv, H.; Mastai, Y.; Tischler, Y.R. Polarization Dependence of Low-Frequency Vibrations from Multiple Faces in an Organic Single Crystal. Crystals 2019, 9, 425. https://0-doi-org.brum.beds.ac.uk/10.3390/cryst9080425
AMA Style
Nemtsov I, Aviv H, Mastai Y, Tischler YR. Polarization Dependence of Low-Frequency Vibrations from Multiple Faces in an Organic Single Crystal. Crystals. 2019; 9(8):425. https://0-doi-org.brum.beds.ac.uk/10.3390/cryst9080425
Chicago/Turabian StyleNemtsov, Irena, Hagit Aviv, Yitzhak Mastai, and Yaakov R. Tischler. 2019. "Polarization Dependence of Low-Frequency Vibrations from Multiple Faces in an Organic Single Crystal" Crystals 9, no. 8: 425. https://0-doi-org.brum.beds.ac.uk/10.3390/cryst9080425
Note that from the first issue of 2016, this journal uses article numbers instead of page numbers. See further details here.