
Co-Expression Network Analysis of Micro-RNAs and Proteins in the Alzheimer’s Brain: A Systematic Review of Studies in the Last 10 Years


Abstract
:1. Introduction
2. Materials and Methods
2.1. Study Design
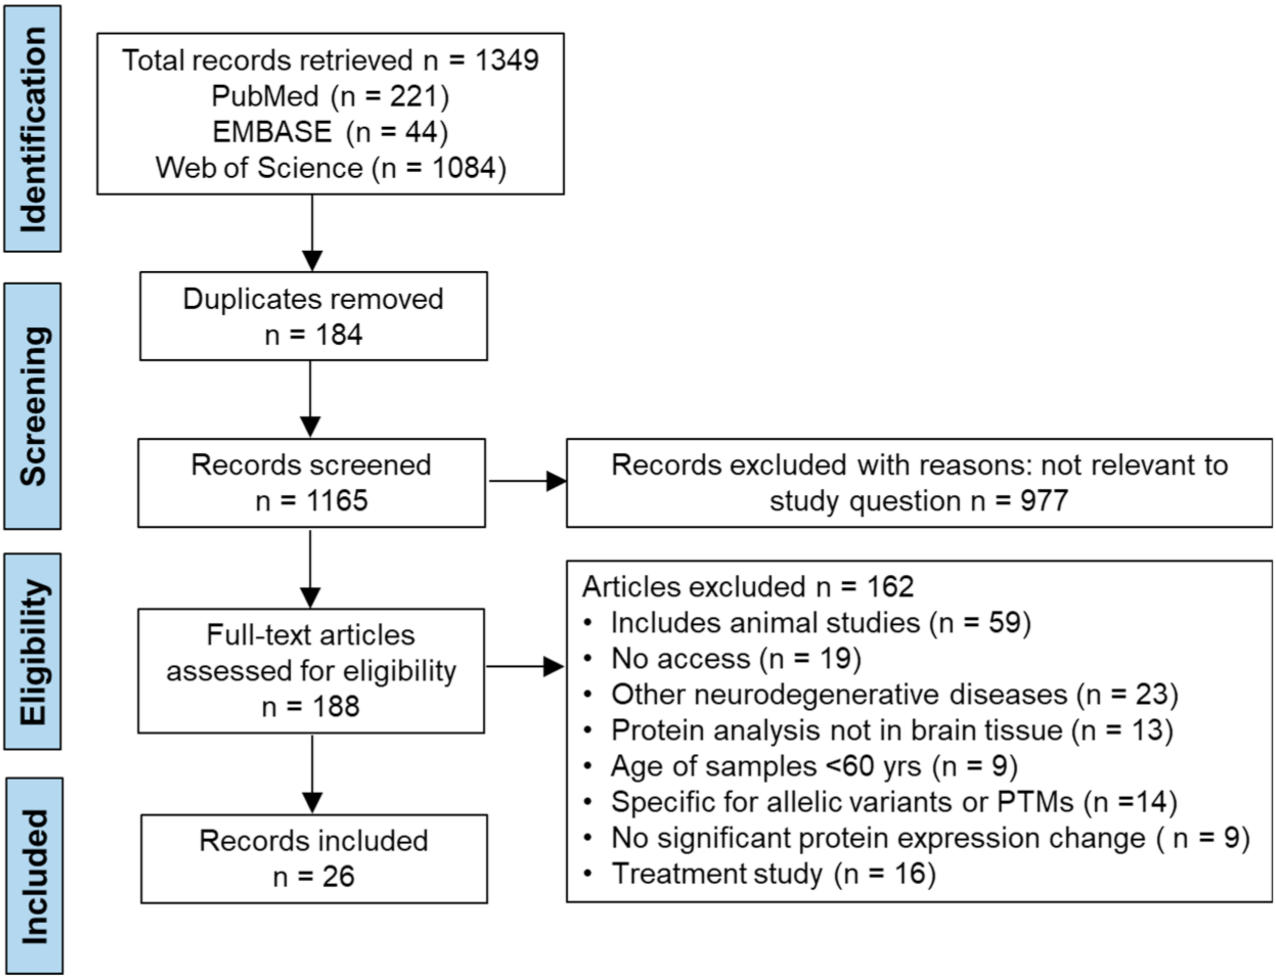
2.1.1. Search Strategy
2.1.2. Search Terms and Databases
2.1.3. Data Extraction
2.1.4. Quality Appraisal of Papers
2.1.5. Meta-Analyses
2.2. Pathway Analysis
2.3. Predicting miRNA-Protein Interactions through Inverse Relationships
3. Results
3.1. Study Characteristics
3.2. Data Extraction
3.3. AXIS Quality Appraisal
3.4. Risk of Bias
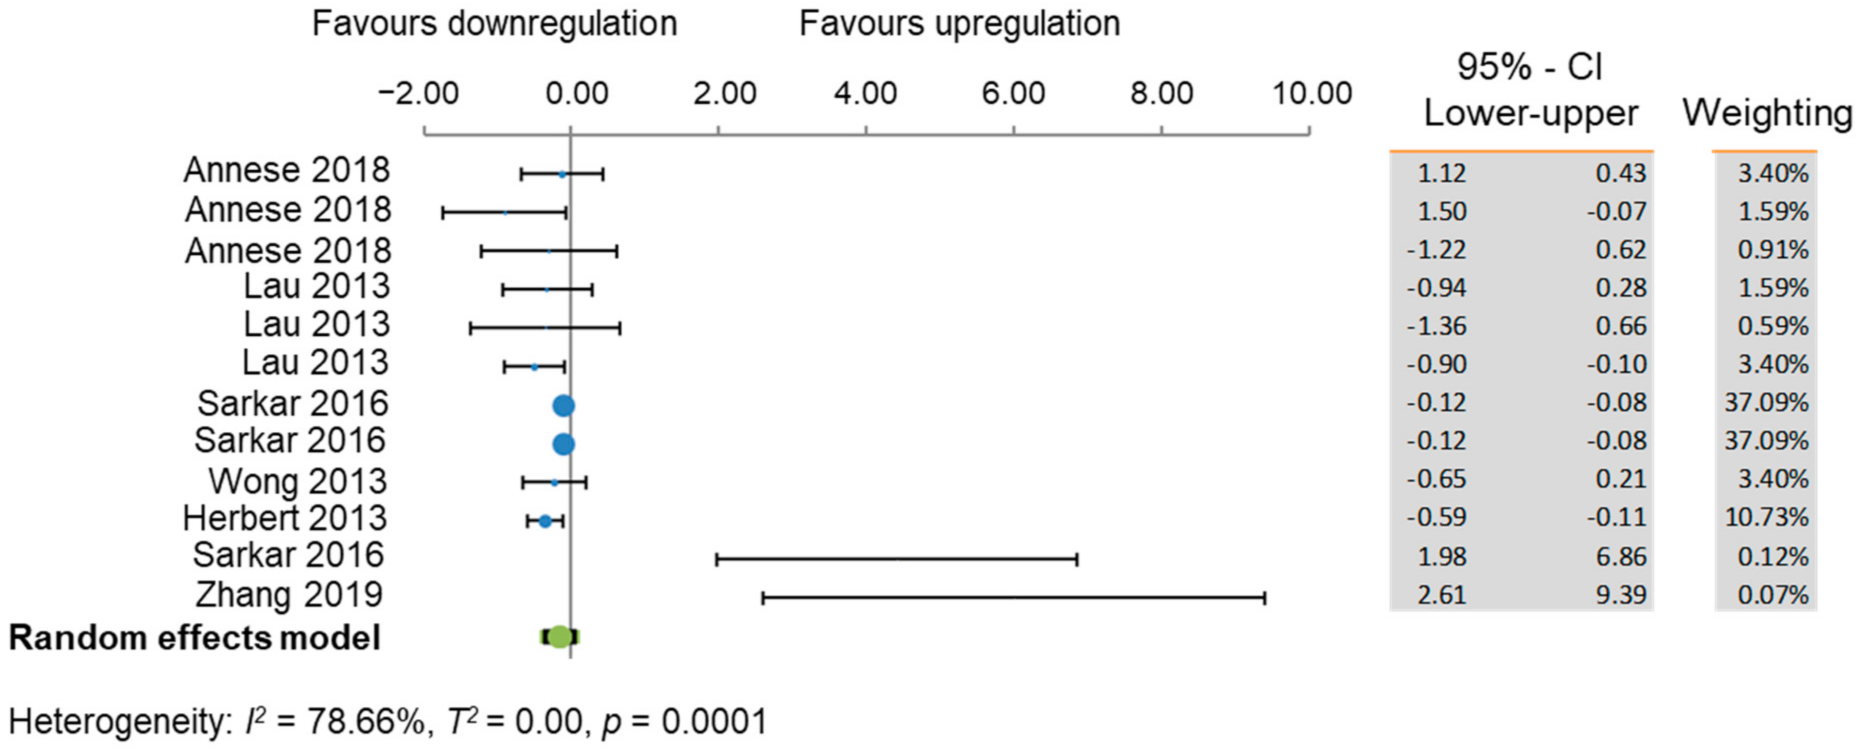
3.5. Meta-Analyses
3.6. Pathways Analysis
4. Discussion
Limitations
5. Conclusions
Supplementary Materials
Author Contributions
Funding
Institutional Review Board Statement
Informed Consent Statement
Data Availability Statement
Acknowledgments
Conflicts of Interest
References
- Alzheimer’s Association. Alzheimer’s disease facts and figures. Alzheimers Dement. 2020, 16, 391–460. [Google Scholar] [CrossRef]
- Hebert, L.E.; Weuve, J.; Scherr, P.A.; Evans, D.A. Alzheimer disease in the United States (2010–2050) estimated using the 2010 census. Neurology 2013, 80, 1778–1783. [Google Scholar] [CrossRef] [Green Version]
- Virani, S.S.; Alonso, A.; Benjamin, E.J.; Bittencourt, M.S.; Callaway, C.W.; Carson, A.P.; Chamberlain, A.M.; Chang, A.R.; Cheng, S.; Delling, F.N.; et al. Heart disease and stroke statistics—2020 update: A report from the american heart association. Circulation 2020, 141, e139–e596. [Google Scholar] [CrossRef]
- Jennings, L.A.; Hollands, S.; Keeler, E.; Wenger, N.S.; Reuben, D.B. The effects of dementia care co-management on acute care, hospice, and long-term care utilization. J. Am. Geriatr. Soc. 2020, 68, 2500–2507. [Google Scholar] [CrossRef]
- Yu, H.; Wang, X.; He, R.; Liang, R.; Zhou, L. Measuring the caregiver burden of caring for community-residing people with Alzheimer’s disease. PLoS ONE 2015, 10, e0132168. [Google Scholar] [CrossRef] [Green Version]
- GBD 2016 Dementia Collaborators. Global, regional, and national burden of Alzheimer’s disease and other dementias, 1990–2016: A systematic analysis for the global burden of disease study 2016. Lancet Neurol. 2019, 18, 88–106. [Google Scholar] [CrossRef] [Green Version]
- Viña, J.; Lloret, A. Why women have more Alzheimer’s disease than men: Gender and mitochondrial toxicity of amyloid-beta peptide. J. Alzheimers Dis. 2010, 20 (Suppl. 2), S527–S533. [Google Scholar] [CrossRef] [PubMed] [Green Version]
- Farrer, L.A.; Cupples, L.A.; Haines, J.L.; Hyman, B.; Kukull, W.A.; Mayeux, R.; Myers, R.H.; Pericak-Vance, M.A.; Risch, N.; van Duijn, C.M. Effects of age, sex, and ethnicity on the association between apolipoprotein E genotype and Alzheimer disease. A meta-analysis. APOE and Alzheimer disease meta analysis consortium. JAMA 1997, 278, 1349–1356. [Google Scholar] [CrossRef] [PubMed]
- Evans, D.A.; Bennett, D.A.; Wilson, R.S.; Bienias, J.L.; Morris, M.C.; Scherr, P.A.; Hebert, L.E.; Aggarwal, N.; Beckett, L.A.; Joglekar, R.; et al. Incidence of Alzheimer disease in a biracial urban community: Relation to apolipoprotein E allele status. Arch. Neurol. 2003, 60, 185–189. [Google Scholar] [CrossRef] [PubMed] [Green Version]
- Matthews, K.A.; Xu, W.; Gaglioti, A.H.; Holt, J.B.; Croft, J.B.; Mack, D.; McGuire, L.C. Racial and ethnic estimates of Alzheimer’s disease and related dementias in the United States (2015–2060) in adults aged ≥65 years. Alzheimers Dement. 2019, 15, 17–24. [Google Scholar] [CrossRef] [PubMed]
- Breteler, M.M.; Claus, J.J.; Grobbee, D.E.; Hofman, A. Cardiovascular disease and distribution of cognitive function in elderly people: The rotterdam study. BMJ 1994, 308, 1604–1608. [Google Scholar] [CrossRef] [Green Version]
- Wilson, R.S.; Krueger, K.R.; Arnold, S.E.; Schneider, J.A.; Kelly, J.F.; Barnes, L.L.; Tang, Y.; Bennett, D.A. Loneliness and risk of Alzheimer disease. Arch. Gen. Psychiatry 2007, 64, 234–240. [Google Scholar] [CrossRef] [PubMed] [Green Version]
- Gottesman, R.F.; Albert, M.S.; Alonso, A.; Coker, L.H.; Coresh, J.; Davis, S.M.; Deal, J.A.; McKhann, G.M.; Mosley, T.H.; Sharrett, A.R.; et al. Associations between midlife vascular risk factors and 25-year incident dementia in the atherosclerosis risk in communities (ARIC) cohort. JAMA Neurol. 2017, 74, 1246–1254. [Google Scholar] [CrossRef]
- Zhao, M.; Veeranki, S.P.; Magnussen, C.G.; Xi, B. Recommended physical activity and all cause and cause specific mortality in US adults: Prospective cohort study. BMJ 2020, 370, m2031. [Google Scholar] [CrossRef] [PubMed]
- Mann, D.M.; Yates, P.O.; Marcyniuk, B. Correlation between senile plaque and neurofibrillary tangle counts in cerebral cortex and neuronal counts in cortex and subcortical structures in Alzheimer’s disease. Neurosci. Lett. 1985, 56, 51–55. [Google Scholar] [CrossRef]
- Hardy, J.; Allsop, D. Amyloid deposition as the central event in the aetiology of Alzheimer’s disease. Trends Pharmacol. Sci. 1991, 12, 383–388. [Google Scholar] [CrossRef]
- Rubin, R. Recently approved alzheimer drug raises questions that might never be answered. JAMA 2021, 326, 469–472. [Google Scholar] [CrossRef] [PubMed]
- Makin, S. The amyloid hypothesis on trial. Nature 2018, 559, S4–S7. [Google Scholar] [CrossRef] [Green Version]
- Serrano-Pozo, A.; Das, S.; Hyman, B.T. APOE and Alzheimer’s disease: Advances in genetics, pathophysiology, and therapeutic approaches. Lancet Neurol. 2021, 20, 68–80. [Google Scholar] [CrossRef]
- Mirzaei, S.; Zarrabi, A.; Hashemi, F.; Zabolian, A.; Saleki, H.; Ranjbar, A.; Saleh, S.H.S.; Bagherian, M.; Sharifzadeh, S.O.; Hushmandi, K.; et al. Regulation of nuclear Factor-KappaB (NF-κB) signaling pathway by non-coding RNAs in cancer: Inhibiting or promoting carcinogenesis? Cancer Lett. 2021, 509, 63–80. [Google Scholar] [CrossRef]
- Ashrafizadeh, M.; Zarrabi, A.; Hushmandi, K.; Hashemi, F.; Moghadam, E.R.; Owrang, M.; Hashemi, F.; Makvandi, P.; Goharrizi, M.A.S.B.; Najafi, M.; et al. Lung cancer cells and their sensitivity/resistance to cisplatin chemotherapy: Role of microRNAs and upstream mediators. Cell. Signal. 2021, 78, 109871. [Google Scholar] [CrossRef]
- Mirzaei, S.; Zarrabi, A.; Asnaf, S.E.; Hashemi, F.; Zabolian, A.; Hushmandi, K.; Raei, M.; Goharrizi, M.A.S.B.; Makvandi, P.; Samarghandian, S.; et al. The role of microRNA-338-3p in cancer: Growth, invasion, chemoresistance, and mediators. Life Sci. 2021, 268, 119005. [Google Scholar] [CrossRef]
- Catalanotto, C.; Cogoni, C.; Zardo, G. MicroRNA in control of gene expression: An overview of nuclear functions. Int. J. Mol. Sci. 2016, 17, 1712. [Google Scholar] [CrossRef] [PubMed] [Green Version]
- Cao, D.D.; Li, L.; Chan, W.Y. MicroRNAs: Key regulators in the central nervous system and their implication in neurological diseases. Int. J. Mol. Sci. 2016, 17, 842. [Google Scholar] [CrossRef] [PubMed]
- Im, H.I.; Kenny, P.J. MicroRNAs in neuronal function and dysfunction. Trends Neurosci. 2012, 35, 325–334. [Google Scholar] [CrossRef] [PubMed] [Green Version]
- Hébert, S.S.; Sergeant, N.; Buée, L. MicroRNAs and the regulation of tau metabolism. Int. J. Alzheimers Dis. 2012, 2012, 406561. [Google Scholar] [CrossRef] [PubMed] [Green Version]
- Sarkar, S.; Jun, S.; Rellick, S.; Quintana, D.D.; Cavendish, J.Z.; Simpkins, J.W. Expression of microRNA-34a in Alzheimer’s disease brain targets genes linked to synaptic plasticity, energy metabolism, and resting state network activity. Brain Res. 2016, 1646, 139–151. [Google Scholar] [CrossRef] [Green Version]
- Long, J.M.; Maloney, B.; Rogers, J.T.; Lahiri, D.K. Novel upregulation of amyloid-β precursor protein (APP) by microRNA-346 via targeting of APP mRNA 5′-untranslated region: Implications in Alzheimer’s disease. Mol. Psychiatry 2019, 24, 345–363. [Google Scholar] [CrossRef] [Green Version]
- Han, C.; Guo, L.; Yang, Y.; Guan, Q.; Shen, H.; Sheng, Y.; Jiao, Q. Mechanism of microRNA-22 in regulating neuroinflammation in Alzheimer’s disease. Brain Behav. 2020, 10, e01627. [Google Scholar] [CrossRef]
- Nelson, P.T.; Wang, W.X. MiR-107 is reduced in Alzheimer’s disease brain neocortex: Validation study. J. Alzheimers Dis. 2010, 21, 75–79. [Google Scholar] [CrossRef] [Green Version]
- Fang, M.; Wang, J.; Zhang, X.; Geng, Y.; Hu, Z.; Rudd, J.A.; Ling, S.; Chen, W.; Han, S. The miR-124 regulates the expression of BACE1/β-secretase correlated with cell death in Alzheimer’s disease. Toxicol. Lett. 2012, 209, 94–105. [Google Scholar] [CrossRef] [PubMed]
- El Fatimy, R.; Li, S.; Chen, Z.; Mushannen, T.; Gongala, S.; Wei, Z.; Balu, D.T.; Rabinovsky, R.; Cantlon, A.; Elkhal, A.; et al. MicroRNA-132 provides neuroprotection for tauopathies via multiple signaling pathways. Acta Neuropathol. 2018, 136, 537–555. [Google Scholar] [CrossRef] [PubMed] [Green Version]
- Zhong, Z.; Yuan, K.; Tong, X.; Hu, J.; Song, Z.; Zhang, G.; Fang, X.; Zhang, W. MiR-16 attenuates β-amyloid-induced neurotoxicity through targeting β-site amyloid precursor protein-cleaving enzyme 1 in an Alzheimer’s disease cell model. Neuroreport 2018, 29, 1365–1372. [Google Scholar] [CrossRef]
- Hanna, J.; Hossain, G.S.; Kocerha, J. The Potential for microRNA Therapeutics and Clinical Research. Front Genet. 2019, 10, 478. [Google Scholar] [CrossRef] [Green Version]
- Ghaffari, M.; Sanadgol, N.; Abdollahi, M.A. Systematic review of current progresses in the nucleic acid-based therapies for neurodegeneration with implications for Alzheimer’s disease. Mini. Rev. Med. Chem. 2020, 20, 1499–1517. [Google Scholar] [CrossRef]
- Nazem, A.; Mansoori, G.A. Nanotechnology for Alzheimer’s disease detection and treatment. Insci. J. 2011, 1, 169–193. [Google Scholar] [CrossRef]
- Lanford, R.E.; Hildebrandt-Eriksen, E.S.; Petri, A.; Persson, R.; Lindow, M.; Munk, M.E.; Kauppinen, S.; Ørum, H. Therapeutic silencing of microRNA-122 in primates with chronic hepatitis C virus infection. Science 2010, 327, 198–201. [Google Scholar] [CrossRef] [PubMed] [Green Version]
- Liberati, A.; Altman, D.G.; Tetzlaff, J.; Mulrow, C.; Gøtzsche, P.C.; Ioannidis, J.P.; Clarke, M.; Devereaux, P.J.; Kleijnen, J.; Moher, D. The PRISMA statement for reporting systematic reviews and meta-analyses of studies that evaluate healthcare interventions: Explanation and elaboration. BMJ 2009, 339, b2700. [Google Scholar] [CrossRef] [PubMed] [Green Version]
- Downes, M.J.; Brennan, M.L.; Williams, H.C.; Dean, R.S. Development of a critical appraisal tool to assess the quality of cross-sectional studies (AXIS). BMJ Open 2016, 6, e011458. [Google Scholar] [CrossRef] [PubMed] [Green Version]
- Higgins, J.P.; Altman, D.G.; Gøtzsche, P.C.; Jüni, P.; Moher, D.; Oxman, A.D.; Savovic, J.; Schulz, K.F.; Weeks, L.; Sterne, J.A.; et al. The cochrane collaboration’s tool for assessing risk of bias in randomised trials. BMJ 2011, 343, d5928. [Google Scholar] [CrossRef] [Green Version]
- Vlachos, I.S.; Kostoulas, N.; Vergoulis, T.; Georgakilas, G.; Reczko, M.; Maragkakis, M.; Paraskevopoulou, M.D.; Prionidis, K.; Dalamagas, T.; Hatzigeorgiou, A.G. DIANA miRPath v.2.0: Investigating the combinatorial effect of microRNAs in pathways. Nucleic Acids Res. 2012, 40, W498–W504. [Google Scholar] [CrossRef] [PubMed]
- Paraskevopoulou, M.D.; Georgakilas, G.; Kostoulas, N.; Vlachos, I.S.; Vergoulis, T.; Reczko, M.; Filippidis, C.; Dalamagas, T.; Hatzigeorgiou, A.G. DIANA-microT web server v5.0: Service integration into miRNA functional analysis workflows. Nucleic Acids Res. 2013, 41, W169–W173. [Google Scholar] [CrossRef] [Green Version]
- Annese, A.; Manzari, C.; Lionetti, C.; Picardi, E.; Horner, D.S.; Chiara, M.; Caratozzolo, M.F.; Tullo, A.; Fosso, B.; Pesole, G.; et al. Whole transcriptome profiling of late-onset Alzheimer’s disease patients provides insights into the molecular changes involved in the disease. Sci. Rep. 2018, 8, 4282. [Google Scholar] [CrossRef] [PubMed] [Green Version]
- Cheng, L.; Vella, L.J.; Barnham, K.J.; McLean, C.; Masters, C.L.; Hill, A.F. Small RNA fingerprinting of Alzheimer’s disease frontal cortex extracellular vesicles and their comparison with peripheral extracellular vesicles. J. Extracell. Vesicles 2020, 9, 1766822. [Google Scholar] [CrossRef] [PubMed]
- Chopra, N.; Wang, R.; Maloney, B.; Nho, K.; Beck, J.S.; Pourshafie, N.; Niculescu, A.; Saykin, A.J.; Rinaldi, C.; Counts, S.E.; et al. MicroRNA-298 reduces levels of human amyloid-β precursor protein (APP), β-site APP-converting enzyme 1 (BACE1) and specific tau protein moieties. Mol. Psychiatry 2020. [Google Scholar] [CrossRef] [Green Version]
- Culpan, D.; Kehoem, P.G.; Love, S. Tumour necrosis factor-α (TNF-α) and miRNA expression in frontal and temporal neocortex in Alzheimer’s disease and the effect of TNF-α on miRNA expression in vitro. Int. J. Mol. Epidemiol. Genet. 2011, 2, 156–162. [Google Scholar] [PubMed]
- Gong, G.; An, F.; Wang, Y.; Bian, M.; Yu, L.J.; Wei, C. miR-15b represses BACE1 expression in sporadic Alzheimer’s disease. Oncotarget 2017, 8, 91551–91557. [Google Scholar] [CrossRef] [Green Version]
- Hébert, S.S.; Wang, W.X.; Zhu, Q.; Nelson, P.T. A study of small RNAs from cerebral neocortex of pathology-verified Alzheimer’s disease, dementia with lewy bodies, hippocampal sclerosis, frontotemporal lobar dementia, and non-demented human controls. J. Alzheimers Dis. 2013, 35, 335–348. [Google Scholar] [CrossRef] [PubMed] [Green Version]
- Henriques, A.D.; Machado-Silva, W.; Leite, R.; Suemoto, C.K.; Leite, K.; Srougi, M.; Pereira, A.C.; Jacob-Filho, W.; Nóbrega, O.T.; Brazilian Aging Brain Study Group. Genome-wide profiling and predicted significance of post-mortem brain microRNA in Alzheimer’s disease. Mech. Ageing Dev. 2020, 191, 111352. [Google Scholar] [CrossRef]
- Kumar, S.; Reddy, P.H. MicroRNA-455-3p as a Potential Biomarker for Alzheimer’s disease: An update. Front. Aging Neurosci. 2018, 10, 41. [Google Scholar] [CrossRef] [PubMed] [Green Version]
- Kumar, S.; Vijayan, M.; Reddy, P.H. MicroRNA-455-3p as a potential peripheral biomarker for Alzheimer’s disease. Hum. Mol. Genet. 2017, 26, 3808–3822. [Google Scholar] [CrossRef] [PubMed]
- Lau, P.; Bossers, K.; Janky, R.; Salta, E.; Frigerio, C.S.; Barbash, S.; Rothman, R.; Sierksma, A.S.; Thathiah, A.; Greenberg, D.; et al. Alteration of the microRNA network during the progression of Alzheimer’s disease. EMBO Mol. Med. 2013, 5, 1613–1634. [Google Scholar] [CrossRef] [Green Version]
- Lei, X.; Lei, L.; Zhang, Z.; Zhang, Z.; Cheng, Y. Downregulated miR-29c correlates with increased BACE1 expression in sporadic Alzheimer’s disease. Int. J. Clin. Exp. Pathol. 2015, 8, 1565–1574. [Google Scholar] [PubMed]
- Li, J.; Chen, W.; Yi, Y.; Tong, Q. miR-219-5p inhibits tau phosphorylation by targeting TTBK1 and GSK-3β in Alzheimer’s disease. J. Cell Biochem. 2019, 120, 9936–9946. [Google Scholar] [CrossRef] [PubMed]
- Liu, D.Y.; Zhang, L. MicroRNA-132 promotes neurons cell apoptosis and activates Tau phosphorylation by targeting GTDC-1 in Alzheimer’s disease. Eur. Rev. Med. Pharmacol. Sci. 2019, 23, 8523–8532. [Google Scholar] [CrossRef]
- Llorens, F.; Thüne, K.; Andrés-Benito, P.; Tahir, W.; Ansoleaga, B.; Hernández-Ortega, K.; Martí, E.; Zerr, I.; Ferrer, I. MicroRNA expression in the locus coeruleus, entorhinal cortex, and hippocampus at early and middle stages of braak neurofibrillary tangle pathology. J. Mol. Neurosci. 2017, 63, 206–215. [Google Scholar] [CrossRef]
- Moncini, S.; Lunghi, M.; Valmadre, A.; Grasso, M.; Del Vescovo, V.; Riva, P.; Denti, M.A.; Venturin, M. The miR-15/107 Family of microRNA genes regulates CDK5R1/p35 with Implications for Alzheimer’s disease pathogenesis. Mol. Neurobiol. 2017, 54, 4329–4342. [Google Scholar] [CrossRef]
- Müller, M.; Kuiperij, H.B.; Claassen, J.A.; Küsters, B.; Verbeek, M.M. MicroRNAs in Alzheimer’s disease: Differential expression in hippocampus and cell-free cerebrospinal fluid. Neurobiol. Aging 2014, 35, 152–158. [Google Scholar] [CrossRef]
- Pichler, S.; Gu, W.; Hartl, D.; Gasparoni, G.; Leidinger, P.; Keller, A.; Meese, E.; Mayhaus, M.; Hampel, H.; Riemenschneider, M. The miRNome of Alzheimer’s disease: Consistent downregulation of the miR-132/212 cluster. Neurobiol. Aging 2017, 50, e1–e167. [Google Scholar] [CrossRef] [PubMed]
- Qian, Q.; Zhang, J.; He, F.P.; Bao, W.X.; Zheng, T.T.; Zhou, D.M.; Pan, H.Y.; Zhang, H.; Zhang, X.Q.; He, X.; et al. Down-regulated expression of microRNA-338-5p contributes to neuropathology in Alzheimer’s disease. FASEB J. 2019, 33, 4404–4417. [Google Scholar] [CrossRef]
- Santa-Maria, I.; Alaniz, M.E.; Renwick, N.; Cela, C.; Fulga, T.A.; Van Vactor, D.; Tuschl, T.; Clark, L.N.; Shelanski, M.L.; McCabe, B.D.; et al. Dysregulation of microRNA-219 promotes neurodegeneration through post-transcriptional regulation of tau. J. Clin. Investig. 2015, 125, 681–686. [Google Scholar] [CrossRef] [PubMed]
- Wang, X.; Liu, D.; Huang, H.Z.; Wang, Z.H.; Hou, T.Y.; Yang, X.; Pang, P.; Wei, N.; Zhou, Y.F.; Dupras, M.J.; et al. A novel MicroRNA-124/PTPN1 signal pathway mediates synaptic and memory deficits in Alzheimer’s disease. Biol. Psychiatry 2018, 83, 395–405. [Google Scholar] [CrossRef] [PubMed]
- Wong, H.K.; Veremeyko, T.; Patel, N.; Lemere, C.A.; Walsh, D.M.; Esau, C.; Vanderburg, C.; Krichevsky, A.M. De-repression of FOXO3a death axis by microRNA-132 and -212 causes neuronal apoptosis in Alzheimer’s disease. Hum. Mol. Genet. 2013, 22, 3077–3092. [Google Scholar] [CrossRef] [PubMed] [Green Version]
- Yuan, J.; Wu, Y.; Li, L.; Liu, C. MicroRNA-425-5p promotes tau phosphorylation and cell apoptosis in Alzheimer’s disease by targeting heat shock protein B8. J. Neural. Transm. 2020, 127, 339–346. [Google Scholar] [CrossRef]
- Zhang, C.; Lu, J.; Liu, B.; Cui, Q.; Wang, Y. Primate-specific miR-603 is implicated in the risk and pathogenesis of Alzheimer’s disease. Aging 2016, 8, 272–290. [Google Scholar] [CrossRef] [PubMed] [Green Version]
- Zhao, Y.; Alexandrov, P.N.; Jaber, V.; Lukiw, W.J. Deficiency in the ubiquitin conjugating enzyme UBE2A in Alzheimer’s Disease (AD) is linked to deficits in a natural circular miRNA-7 sponge (circRNA; ciRS-7). Genes 2016, 7, 116. [Google Scholar] [CrossRef] [Green Version]
- Zhao, Y.; Bhattacharjee, S.; Jones, B.M.; Dua, P.; Alexandrov, P.N.; Hill, J.M.; Lukiw, W.J. Regulation of TREM2 expression by an NF-κB-sensitive miRNA-34a. Neuroreport 2013, 24, 318–323. [Google Scholar] [CrossRef] [PubMed] [Green Version]
- Beckelman, B.C.; Zhou, X.; Keene, C.D.; Ma, T. Impaired eukaryotic elongation factor 1A expression in Alzheimer’s disease. Neurodegener. Dis. 2016, 16, 39–43. [Google Scholar] [CrossRef] [Green Version]
- Chiu, C.; Miller, M.C.; Monahan, R.; Osgood, D.P.; Stopa, E.G.; Silverberg, G.D. P-glycoprotein expression and amyloid accumulation in human aging and Alzheimer’s disease: Preliminary observations. Neurobiol. Aging 2015, 36, 2475–2482. [Google Scholar] [CrossRef]
- Shepherd, C.E.; Affleck, A.J.; Bahar, A.Y.; Carew-Jones, F.; Gregory, G.; Small, D.H.; Halliday, G.M. Alzheimer’s amyloid-β and tau protein accumulation is associated with decreased expression of the LDL receptor-associated protein in human brain tissue. Brain Behav. 2020, 10, e01672. [Google Scholar] [CrossRef]
- Chen, C.H.; Zhou, W.; Liu, S.; Deng, Y.; Cai, F.; Tone, M.; Tone, Y.; Tong, Y.; Song, W. Increased NF-κB signalling up-regulates BACE1 expression and its therapeutic potential in Alzheimer’s disease. Int. J. Neuropsychopharmacol. 2012, 15, 77–90. [Google Scholar] [CrossRef] [PubMed] [Green Version]
- Holler, C.J.; Davis, P.R.; Beckett, T.L.; Platt, T.L.; Webb, R.L.; Head, E.; Murphy, M.P. Bridging integrator 1 (BIN1) protein expression increases in the Alzheimer’s disease brain and correlates with neurofibrillary tangle pathology. J. Alzheimers Dis. 2014, 42, 1221–1227. [Google Scholar] [CrossRef] [Green Version]
- Walker, D.G.; Whetzel, A.M.; Lue, L.F. Expression of suppressor of cytokine signaling genes in human elderly and Alzheimer’s disease brains and human microglia. Neuroscience 2015, 302, 121–137. [Google Scholar] [CrossRef] [PubMed] [Green Version]
- Glennon, E.B.; Whitehouse, I.J.; Miners, J.S.; Kehoe, P.G.; Love, S.; Kellett, K.A.; Hooper, N.M. BIN1 is decreased in sporadic but not familial Alzheimer’s disease or in aging. PLoS ONE 2013, 8, e78806. [Google Scholar] [CrossRef] [PubMed] [Green Version]
- Byman, E.; Schultz, N.; Netherlands Brain Bank; Fex, M.; Wennström, M. Brain alpha-amylase: A novel energy regulator important in Alzheimer disease? Brain Pathol. 2018, 28, 920–932. [Google Scholar] [CrossRef] [PubMed] [Green Version]
- Huang, H.; Camats-Perna, J.; Medeiros, R.; Anggono, V.; Widagdo, J. Altered Expression of the m6A Methyltransferase METTL3 in Alzheimer’s disease. eNeuro 2020, 7, ENEURO.0125-20.2020. [Google Scholar] [CrossRef] [PubMed]
- Yoo, I.D.; Park, M.W.; Cha, H.W.; Yoon, S.; Boonpraman, N.; Yi, S.S.; Moon, J.S. Elevated CLOCK and BMAL1 contribute to the impairment of aerobic glycolysis from astrocytes in Alzheimer’s disease. Int. J. Mol. Sci. 2020, 21, 7862. [Google Scholar] [CrossRef]
- Chen, J.; Wang, M.; Turko, I.V. Mass spectrometry quantification of clusterin in the human brain. Mol. Neurodegener. 2012, 7, 41. [Google Scholar] [CrossRef] [Green Version]
- Gu, J.; Hu, W.; Tan, X.; Qu, S.; Chu, D.; Gong, C.X.; Iqbal, K.; Liu, F. Elevation of casein kinase 1ε associated with TDP-43 and tau pathologies in Alzheimer’s disease. Brain Pathol. 2020, 30, 283–297. [Google Scholar] [CrossRef] [PubMed]
- Xu, J.; Patassini, S.; Rustogi, N.; Riba-Garcia, I.; Hale, B.D.; Phillips, A.M.; Waldvogel, H.; Haines, R.; Bradbury, P.; Stevens, A.; et al. Regional protein expression in human Alzheimer’s brain correlates with disease severity. Commun. Biol. 2019, 2, 43. [Google Scholar] [CrossRef]
- Batkulwar, K.; Godbole, R.; Banarjee, R.; Kassaar, O.; Williams, R.J.; Kulkarni, M.J. Advanced glycation end products modulate amyloidogenic APP processing and tau phosphorylation: A mechanistic link between glycation and the development of Alzheimer’s disease. ACS Chem. Neurosci. 2018, 9, 988–1000. [Google Scholar] [CrossRef] [PubMed]
- Ilic, K.; Mlinac-Jerkovic, K.; Jovanov-Milosevic, N.; Simic, G.; Habek, N.; Bogdanovic, N.; Kalanj-Bognar, S. Hippocampal expression of cell-adhesion glycoprotein neuroplastin is altered in Alzheimer’s disease. J. Cell Mol. Med. 2019, 23, 1602–1607. [Google Scholar] [CrossRef] [PubMed]
- Lue, L.F.; Schmitz, C.T.; Serrano, G.; Sue, L.I.; Beach, T.G.; Walker, D.G. TREM2 protein expression changes correlate with Alzheimer’s disease neurodegenerative pathologies in post-mortem temporal cortices. Brain Pathol. 2015, 25, 469–480. [Google Scholar] [CrossRef] [PubMed] [Green Version]
- Bekris, L.M.; Galloway, N.M.; Montine, T.J.; Schellenberg, G.D.; Yu, C.E. APOE mRNA and protein expression in postmortem brain are modulated by an extended haplotype structure. Am. J. Med. Genet. Part B Neuropsychiatr. Genet. 2010, 153B, 409–417. [Google Scholar] [CrossRef] [PubMed] [Green Version]
- Caušević, M.; Farooq, U.; Lovestone, S.; Killick, R. β-Amyloid precursor protein and tau protein levels are differently regulated in human cerebellum compared to brain regions vulnerable to Alzheimer’s type neurodegeneration. NeuroSci. Lett. 2010, 485, 162–166. [Google Scholar] [CrossRef]
- Campanari, M.L.; Navarrete, F.; Ginsberg, S.D.; Manzanares, J.; Sáez-Valero, J.; García-Ayllón, M.S. Increased expression of readthrough acetylcholinesterase variants in the brains of Alzheimer’s disease patients. J. Alzheimers Dis. 2016, 53, 831–841. [Google Scholar] [CrossRef] [Green Version]
- Bartolotti, N.; Bennett, D.A.; Lazarov, O. Reduced pCREB in Alzheimer’s disease prefrontal cortex is reflected in peripheral blood mononuclear cells. Mol. Psychiatry 2016, 21, 1158–1166. [Google Scholar] [CrossRef] [PubMed]
- Jin, N.; Qian, W.; Yin, X.; Zhang, L.; Iqbal, K.; Grundke-Iqbal, I.; Gong, C.X.; Liu, F. CREB regulates the expression of neuronal glucose transporter 3: A possible mechanism related to impaired brain glucose uptake in Alzheimer’s disease. Nucleic Acids Res. 2013, 41, 3240–3256. [Google Scholar] [CrossRef] [PubMed]
- Gu, Q.; Cuevas, E.; Raymick, J.; Kanungo, J.; Sarkar, S. Downregulation of 14-3-3 Proteins in Alzheimer’s disease. Mol. Neurobiol. 2020, 57, 32–40. [Google Scholar] [CrossRef]
- Ginsberg, S.D.; Mufson, E.J.; Counts, S.E.; Wuu, J.; Alldred, M.J.; Nixon, R.A.; Che, S. Regional selectivity of rab5 and rab7 protein upregulation in mild cognitive impairment and Alzheimer’s disease. J. Alzheimers Dis. 2010, 22, 631–639. [Google Scholar] [CrossRef] [Green Version]
- Wang, S.; Wang, R.; Chen, L.; Bennett, D.A.; Dickson, D.W.; Wang, D.S. Expression and functional profiling of neprilysin, insulin-degrading enzyme, and endothelin-converting enzyme in prospectively studied elderly and Alzheimer’s brain. J. Neurochem. 2010, 115, 47–57. [Google Scholar] [CrossRef] [Green Version]
- Sengupta, U.; Montalbano, M.; McAllen, S.; Minuesa, G.; Kharas, M.; Kayed, R. Formation of toxic oligomeric assemblies of RNA-binding protein: Musashi in Alzheimer’s disease. Acta Neuropathol. Commun. 2018, 6, 113. [Google Scholar] [CrossRef] [PubMed] [Green Version]
- Liao, Y.; Qi, X.L.; Cao, Y.; Yu, W.F.; Ravid, R.; Winblad, B.; Pei, J.J.; Guan, Z.Z. Elevations in the levels of NF-κB and inflammatory chemotactic factors in the brains with Alzheimer’s disease—One mechanism may involve α3 nicotinic acetylcholine receptor. Curr. Alzheimer Res. 2016, 13, 1290–1301. [Google Scholar] [CrossRef] [PubMed]
- Kondratova, A.A.; Kondratov, R.V. The circadian clock and pathology of the ageing brain. Nat. Rev. Neurosci. 2012, 13, 325–335. [Google Scholar] [CrossRef] [PubMed]
- Yamazaki, S.; Numano, R.; Abe, M.; Hida, A.; Takahashi, R.; Ueda, M.; Block, G.D.; Sakaki, Y.; Menaker, M.; Tei, H. Resetting central and peripheral circadian oscillators in transgenic rats. Science 2000, 288, 682–685. [Google Scholar] [CrossRef] [Green Version]
- Buhr, E.D.; Takahashi, J.S. Molecular components of the Mammalian circadian clock. In Circadian Clocks; Springer: Berlin/Heidelberg, Germany, 2013; Volume 217, pp. 3–27. [Google Scholar] [CrossRef] [Green Version]
- Cronin, P.; McCarthy, M.J.; Lim, A.S.P.; Salmon, D.P.; Galasko, D.; Masliah, E.; De Jager, F.L.; Bennett, D.A.; Desplats, P. Circadian alterations during early stages of Alzheimer’s disease are associated with aberrant cycles of DNA methylation in BMAL1. Alzheimers Dement. 2017, 13, 689–700. [Google Scholar] [CrossRef] [PubMed]
- Song, H.; Moon, M. Aβ-induced degradation of BMAL1 and CBP leads to circadian rhythm disruption in Alzheimer’s disease. Mol. Neurodegener. 2015, 10, 13. [Google Scholar] [CrossRef] [Green Version]
- Belanger, V.; Picard, N.; Cermakian, N. The circadian regulation of Presenilin-2 gene expression. Chronobiol. Int. 2006, 23, 747–766. [Google Scholar] [CrossRef]
- Chiou, Y.Y.; Yang, Y.; Rashid, N.; Ye, R.; Selby, C.P.; Sancar, A. Mammalian period represses and de-represses transcription by displacing CLOCK-BMAL1 from promoters in a Cryptochrome-dependent manner. Proc. Natl. Acad. Sci. USA 2016, 113, E6072–E6079. [Google Scholar] [CrossRef] [PubMed] [Green Version]
- Yang, Y.; Xu, T.; Zhang, Y.; Qin, X. Molecular basis for the regulation of the circadian clock kinases CK1δ and CK1ε. Cell Signal. 2017, 31, 58–65. [Google Scholar] [CrossRef]
- Zhou, L.; Bryant, C.D.; Loudon, A.; Palmer, A.A.; Vitaterna, M.H.; Turek, F.W. The circadian clock gene Csnk1e regulates rapid eye movement sleep amount, and nonrapid eye movement sleep architecture in mice. Sleep 2014, 37, 785–793C. [Google Scholar] [CrossRef] [Green Version]
- Walton, K.M.; Fisher, K.; Rubitski, D.; Marconi, M.; Meng, Q.J.; Sládek, M.; Adams, J.; Bass, M.; Chandrasekaran, R.; Butler, T.; et al. Selective inhibition of casein kinase 1 epsilon minimally alters circadian clock period. J. Pharmacol. Exp. Ther. 2009, 330, 430–439. [Google Scholar] [CrossRef] [PubMed]
- Harvey, K.F.; Pfleger, C.M.; Hariharan, I.K. The Drosophila Mst ortholog, hippo, restricts growth and cell proliferation and promotes apoptosis. Cell 2003, 114, 457–467. [Google Scholar] [CrossRef] [Green Version]
- Meng, Z.; Moroishi, T.; Guan, K.L. Mechanisms of Hippo pathway regulation. Genes Dev. 2016, 30, 1–17. [Google Scholar] [CrossRef] [PubMed] [Green Version]
- Zhao, B.; Ye, X.; Yu, J.; Li, L.; Li, W.; Li, S.; Yu, J.; Lin, J.D.; Wang, C.Y.; Chinnaiyan, A.M.; et al. TEAD mediates YAP-dependent gene induction and growth control. Genes Dev. 2008, 22, 1962–1971. [Google Scholar] [CrossRef] [PubMed] [Green Version]
- Praskova, M.; Khoklatchev, A.; Ortiz-Vega, S.; Avruch, J. Regulation of the MST1 kinase by autophosphorylation, by the growth inhibitory proteins, RASSF1 and NORE1, and by Ras. Biochem. J. 2004, 381 Pt 2, 453–462. [Google Scholar] [CrossRef] [PubMed]
- Liu, Y.; Deng, J. Ubiquitination-deubiquitination in the Hippo signaling pathway. Oncol. Rep. 2019, 41, 1455–1475. [Google Scholar] [CrossRef] [PubMed] [Green Version]
- Zhao, B.; Li, L.; Tumaneng, K.; Wang, C.Y.; Guan, K.L. A coordinated phosphorylation by Lats and CK1 regulates YAP stability through SCF(beta-TRCP). Genes Dev. 2010, 24, 72–85. [Google Scholar] [CrossRef] [PubMed] [Green Version]
- Schittek, B.; Sinnberg, T. Biological functions of casein kinase 1 isoforms and putative roles in tumorigenesis. Mol. Cancer 2014, 13, 231. [Google Scholar] [CrossRef] [Green Version]
- Dolek, N.; Saylisoy, S.; Ozbabalik, D.; Adapinar, B. Comparison of hippocampal volume measured using magnetic resonance imaging in Alzheimer’s disease, vascular dementia, mild cognitive impairment and pseudodementia. J. Int. Med. Res. 2012, 40, 717–725. [Google Scholar] [CrossRef]
- Boopathy, G.T.K.; Hong, W. Role of hippo pathway-YAP/TAZ signaling in angiogenesis. Front. Cell Dev. Biol. 2019, 7, 49. [Google Scholar] [CrossRef] [PubMed]
- Qing, J.; Liu, X.; Wu, Q.; Zhou, M.; Zhang, Y.; Mazhar, M.; Huang, X.; Wang, L.; He, F. Hippo/YAP pathway plays a critical role in effect of GDNF against Aβ-induced inflammation in microglial cells. DNA Cell Biol. 2020, 39, 1064–1071. [Google Scholar] [CrossRef] [PubMed]
- Gogia, N.; Chimata, A.V.; Deshpande, P.; Singh, A.; Singh, A. Hippo signaling: Bridging the gap between cancer and neurodegenerative disorders. Neural Regen. Res. 2021, 16, 643–652. [Google Scholar] [CrossRef] [PubMed]


| Inclusion | Exclusion |
|---|---|
| Alzheimer’s disease | Braak score < iv CERAD score ≥ 3 Other neurodegenerative diseases—Parkinson’s Disease, Lewy body pathology, Huntington’s Disease, Mild Cognitive Impairment, normal aging, inflammatory diseases (Multiple Sclerosis), PART |
| Post-mortem brain analysis | Plasma, serum, CSF, Saliva, cell-lines, transfected tissues, tissue biopsy |
| qRT-PCR or protein analyses | RNAseq, microarray analysis, in-situ hybridization |
| Qualitative and quantitative analysis | Study focusing on post-translational modifications, mutations, allelic variants, study including treatment or intervention |
| Human | Animals, cell lines |
| Male and female participants | None |
| Age-matched controls compared to AD | Single cohort studies, case studies, non-age-matched controls |
| Age ≥ 60 | Age < 60 |
| All patient ethnicities | No ethnicities were excluded |
| Primary research | Reviews, meta-analyses, bioinformatics studies using previously collected data, conference abstracts, clinical trials |
| Sample size n ≥ 3 | Sample size n < 3 |
| Published in peer-reviewed journals | Non-peer-reviewed |
| English language | Not written in English |
| (A): Up and Downregulation of miRNAs | ||||||
|---|---|---|---|---|---|---|
| Author | AD group (N; Mean Age; M:F) | Control group (N; Mean Age; M:F) | Brain Regions | Methods | miRNA Upregulated | miRNA Downregulated |
| Annese et al. 2018 [43] | 14; 74; 8:5 | 14; 77; 8:5 | HC; MTG; MFG | qRT-PCR | miR-10a-5p, miR-28-3p | miR-132-3p, miR-132-5p, miR-184, miR-212-3p, miR-212-5p, miR-34c-3p, miR-375, miR-539-5p |
| Cheng et al. 2020 [44] | 8; 76; 3:8 | 8; 67; 4:5 | FC; BDE | qRT-PCR | miR-17-5p, miR-18a-5p, miR-190a-5p, miR-219a-2-3p, miR-3157-5p, miR-374b-5p, miR-374c-3p, miR-548, miR-550a-3p, miR-550b-2-5p | miR-4284, miR-5001-3p, miR-132-5p |
| Chopra et al. 2020 [45] | 29; 84; 11:18 | 25; 86; 9:16 | TC; CB | qRT-PCR | miR-298 | |
| Culpan et al. 2011 [46] | 12; 82; 5:7 | 6; 88; 5:1 | FNC; TNC | qRT-PCR | miR-128a, miR-128b | |
| Gong et al. 2017 [47] | 40; -; - | 35; -; - | FC | qRT-PCR | miR-15b | |
| Herbert et al. 2013 [48] | 8; 78; 5:3 | 8; 71; 5:3 | STG; MTG | qRT-PCR | miR-132-3p, miR-100 | |
| Henriques et al. 2020 [49] | 16; 81; 4:12 | 18; 78: 6:12 | STG; MTG | qRT-PCR | miR-3651 | miR-1202, miR-30e-3p, miR-365b-5p, miR-4286, miR-4443, miR-4449, miR-664-3p, miR-767-5p, |
| Kumar et al. 2018 [50] | 27; 80; 14:13 | 15; 79; 8:7 | FC | qRT-PCR | miR-455-3p | |
| Kumar et al. 2017 [51] | 12; 80; 4:8 | 5; 73; 3:2 | FC | qRT-PCR | miR-3613-3p, miR-455-3p, miR-4674, miR-6722 | miR-122-5p |
| Lau et al. 2013 [52] | 41; -; - | 23; -; - | FC; HC | qRT-PCR | miR-142-3p, miR-200a-3p, miR-27a-3p, miR-92b-3p | miR-124-3p, miR-128, miR-129-2-3p, miR-129-5p, miR-132-3p miR-136-5p, miR-138-5p |
| Lei et al. 2015 [53] | 31; 78; 18:13 | 29; 80; 16:13 | FC | qRT-PCR | miR-29c | |
| Li et al. 2019 [54] | 30; 88; 18:12 | 30; 87; 20:10 | FC | qRT-PCR | miR-219-5p | |
| Liu et al. 2019 [55] | 10; -; - | 10; -; - | - | qRT-PCR | miR-132 | |
| Llorens et al. 2017 [56] | 25; -; - | 25; -; - | LC; EC; HC | qRT-PCR | miR-124-3p, miR-132-3p, miR-143-3p, miR-27a-3p | miR-124-3p |
| Long et al. 2019 [28] | 15; 84; - | 5; 84; - | FC | qRT-PCR | miR-346 | |
| Moncini et al. 2016 [57] | 12; 78; 7:3 | 11; 82; 4:7 | HC; TC | qRT-PCR | miR-103, miR-107, miR-15b, miR-16, miR-195 | |
| Muller et al. 2014 [58] | 10; 78; 7:3 | 11; 83; 4:7 | HC | qRT-PCR | miR-16 miR-146 | miR-16 miR-146 miR-107 miR-128a |
| Pichker et al. 2017 [59] | 39; 80; 15:24 | 25; 65; 15:10 | TC; PFC | qRT-PCR | miR-132 miR-212-3p | |
| Qian et al. 2019 [60] | 12; 81; - | 11; 82; - | HC | qRT-PCR | miR-338-5p | |
| Santa-Maria et al. 2015 [61] | 7; 93; 3:4 | 20; 89; 9:11 | FC | qRT-PCR | miR-219-5p | |
| Sarkar et al. 2016 [27] | 13; 76; 6:7 | 10; 77; 5:5 | TC; FC; CB | qRT-PCR | miR-146a | miR-132 |
| Wang et al. 2018 [62] | 12; 86; 3:9 | 12; 86; 1:11 | TC; HC | qRT-PCR | miR-124 | |
| Wong et al. 2013 [63] | 16; 81; 6:10 | 16; 77; 10:6 | TC | qRT-PCR | miR-132 miR-212 | |
| Yuan et al. 2020 [64] | 10; 75; 6:4 | 10; 80; 6:4 | - | qRT-PCR | miR-425-5p | |
| Zhang et al. 2016 [65] | 7; 87; 3:4 | 7; 87; 1:16 | HC | qRT-PCR | miR-603 | |
| Zhao et al. 2016 [66] | 12; 74; - | 6; 72; - | TC; HC | qRT-PCR | miR-7 miR146a miR-155 | |
| Zhao et al. 2013 [67] | 3; 72; - | 3; 72; - | HC | qRT-PCR | miR-34a miR-146a miR-125b miR-155 | |
| Zhong et al. 2018 [33] | 30; 87; - | 20; 87; - | FC | qRT-PCR | miR-16 | |
| (B): Up and downregulation of proteins | ||||||
| Author | AD group (N; Mean Age; M:F) | Control group (N; Mean Age; M:F) | Brain Regions | Methods | Protein Upregulated | Protein Downregulated |
| Beckelman et al. 2016 [68] | 5; 82-98; 2:3 | 5; 78-97; 3:2 | TC | WB, IHC | EEF1A1 | |
| Chiu et al. 2015 [69] | 7; 82.9; 3:4 | 8; 61-91; 10:4 | HP | IHC | ABCB1 (P-Glycoprotein) | |
| Shepherd et al. 2020 [70] | 17; 78; - | 16; 74; - | TC | WB, ELISA | APP, MAPT | RAP |
| Chen et al. 2012 [71] | 18; 74-89; - | 13; 68-69; - | HP, FL, TL, CB | ELISA | NF-κb, BACE1 | |
| Holler et al. 2014 [72] | 52; 85.9; 19:33 | 19; 85.2; 5:14 | HP | Immunoblot/IHC | BIN1 | |
| Walker et al. 2015 [73] | 12; 78,9; 6:6 | 12; 84; 9:3 | TC | WB | SOCS4, SOCS7 | |
| Glennon et al. 2013 [74] | 24; 69-96; 6:18 | 24; 76.4; 14:10 | HP | Immunoblot | BIN1 | |
| Byman et al. 2018 [75] | 12; 63-96; 3:9 | 8; 60-102; 5:3 | HP, IP, IT, FC, SMTG | ELISA, IHC | AMY1A | |
| Huang et al. 2020 [76] | 26; 88.6; 12:14 | 19; 90.3; 9:10 | FC | WB, IP, IHC, IF | RBM15B | METTL3 |
| Yoo et al. 2020 [77] | 3; 72; 0:3 | 3; 65; 2:1 | FC | IF | CLOCK, BMAL1 | |
| Chen et al. 2012 [78] | 12; 68-92; 8:4 | 12; 81-92; 9:3 | FC, TC, PC, OC | Mass spectrometry | CLU | |
| Gu et al. 2020 [79] | 10; 76.6; 6:4 | 9; 79.22; 4:6 | FC | WB, IHC | CK1ε | TDP43 |
| Xu et al. 2019 [80] | 9; 60-80; 6:3 | 9; 61-78; 5:4 | HP, EC, CG, SCx, MCx, CB | MS | AGT, AHNAK, ALAD, ANXA5, AQP4, ASAH1, BAG3, C3, CHGA, CLU, CP, DBI, DKK3, ESD, FGA, FGB, FGG, GJA1, H3F3A, HDGF, HIST1H1C, HIST1H1E, HP, HPX, HRSP12, HSPA1A, HSPB1, IGHA1, IGHG1, IGKC, ISYNA1, ITIH4, MAOB, MAP4, MARCKS, MECP2, NAMPT, NUCKS1, ORM1, PADI2, PAICS, PBXIP1, PCBD1, PLIN3, PNPO, PRDX1, PRDX6, S100A1, S100A11, S100A6, S100A9, SAA1, SELENBP1, SERPINA1, SERPINA3, SERPING1, SPR, STOM, TPD52L1 | ACTN2, ADAP1, AP1G1, CADPS, CAP2, CIRBP, CORO1A, CORO2B, CRAT, DLAT, DLG4, DNAJC6, DNM3, DUSP3, EEF1B2, FARSB, GAS7, GLS, GRPEL1, HGS, HOMER1, HSPA4L, IARS2, IDH3G, IPO7, KIAA0513, KIF5C, LONP1, LRPPRC, LZTFL1, MAPRE3, NDUFA10, NECAB1, OAT, OGDH, OGDHL, OTUB1, OXCT1, PAFAH1B1, PDHX, PDIA3, PHYHIPL, PPME1, PPP2R1A, PTPA, PREP, PRKRA, RAP1GDS1, RGS7, RPH3A, SARS2, SCAI, SDR39U1, SGTB, SH3GL1, SLIRP, SMS, STXBP1, STXBP3, SUCLA2, SUCLG1, TIMM44, TLN2, TRAP1, VPS35, YARS, YWHAG, YWHAH, YWHAQ |
| Batkulwar et al. 2018 [81] | 3; 84.3; - | 3; 89.3; - | FC | MS | CML, Cathepsin B, AEP, RAGE, TAU | |
| Ilic et al. 2019 [82] | 6; 77.8; 2:4 | 6; 75.5; 2:4 | - | IHC | NPTN | |
| Lue et al. 2015 [83] | 11; 82.46; 9:13 | 11; 85.4; 7:4 | FC | Immunoblot | TREM2, DAP12, IBA1, CASP3 | SNAP25, PSD95 |
| Bekris et al. 2010 [84] | 8; 60-93; 5:3 | 8; 79-94; 4:4 | HP | WB | APOE | |
| Causevic et al. 2010 [85] | 4; 82-97; - | 4; 81-86; - | HP | WB | IDE | |
| Campanari et al. 2016 [86] | 19; 75-85; 8:11 | 22; 65-73; 12:10 | FC | WB | ACHE | |
| Bartolotti et al. 2016 [87] | 21; 93.1; 0:21 | 20; 93.49; 0:20 | CB, FC | WB | CREB, CBP, EP300 | |
| Jin et al. 2013 [88] | 7; 86.29; 1:6 | 7; 86.6; 2:5 | FC | WB | GLUT3 | |
| Gu et al. 2020 [89] | 12; 75-98; 3:9 | 12; 61-100; 3:9 | TC | WB, & IHC | YWHAG, YWHAH (14-3-3 Proteins) | |
| Ginsberg et al. 2010 [90] | 38; 84.6; 14:24 | 27; 80.8; 5:12 | PFC | Quantitative immunoblot | RAB5A, RAB7A | |
| Wang et al. 2010 [91] | 10; 87.3; 3:7 | 10; 80.5; 7:3 | HP, EC, CG, SCx, MCx, CB | WB | NEP, IDE | |
| Sengupta et al. 2018 [92] | 4; 75-83; 3:1 | 4; 70-79; 2:2 | HP, BF, FC, CB, STR | WB, IF | MSI1, MSI2 | |
| Liao, et al. 2016 [93] | 10; 81.8; 4:6 | 7; 83.6; 3:4 | MTG | WB, IHC, ELISA | NF-κB, MCP-1, MIP1α | |
| Common Pathways | miRNA p Value | Protein p Value | miRNA (−log (p Value) | miRNA-Protein Inverse Relation |
|---|---|---|---|---|
| Hippo signaling pathway | 7.91 × 10⁻⁸ | 0.021 | 7.1 | ↓ miR-320a [43,44], miR-329-3p [52], miR-495-3p [52] ↑ CSNK1E [79] |
| ↑ miR-3613-3p [51], miR-200a-3p [52], miR-199a-3p [44,52], miR-199b-3p [52], miR-23a-3p [44,52], miR-425-5p [52,64], miR-34c-3p [43,44,56] ↓ YWHAG [80,89] | ||||
| ↑ miR-3613-3p [51] ↓ YWHAH [80,89] | ||||
| ↑ miR-27a-3p [52,56], miR-455-3p [50,51] ↓ YWHAQ [80] | ||||
| ↑ miR-150-5p [52], ↓ PPP2R1A [80] | ||||
| Pathways in cancer | 9.57 × 10⁻⁶ | - | 5 | ↑ miR-3613-3p [51], miR-23a-3p [44,52], miR-550a-3p [34] ↓ CREBBP [87] |
| ↑ miR-603 [65], miR-3613-3p [51] ↓ EP300 [92] | ||||
| Adherends junction | 2.33 × 10⁻⁵ | - | 4.6 | ↑ miR-23a-3p [44,52] ↓ ACTN2 [80] |
| ↑ miR-23a-3p [44,52], miR-3613-3p [51], miR-550a-3p [34] ↓ CREBBP [87] | ||||
| ↑ miR-603 [65], miR-3613-3p [51] ↓ EP300 [87] | ||||
| Wnt signaling pathway | 0.001 | - | 3.1 | ↓ miR-495-3p [52], miR-329-3p [53], miR-320a [43,44], ↑ CSNK1E [79] |
| ↑ miR-603 [65], miR-3613-3p [51] ↓ EP300 [87] | ||||
| ↑ miR-3613-3p [51], miR-23a-3p [44,52], miR-550a-3p [34] ↓ CREBBP [87] | ||||
| PI3K-Akt signaling pathway | 0.001 | - | 3 | ↑ miR-27a-3p [52,56], miR-10a-5p [43], miR-374b-5p [34], miR-155-5p [66,67], miR-200a-3p [52], miR-3613-3p [51], miR-362-3p [52], miR-425-5p [52,64] ↓ CREBBP [87] |
| ↑ miR-150-5p [52] ↓ PPP2R1A [80] | ||||
| ↑ miR-199a-3p [44,52], miR-199b-3p [52], miR-200a-3p [52], miR-3613-3p [51], miR-23a-3p [44,52], miR-425-5p [52,64], miR-34c-3p [43,44,56] ↓ YWHAG [80,89] | ||||
| ↑ miR-3613-3p [51] ↓ YWHAH [80,89] | ||||
| ↑ miR-27a-3p [52,56], miR-455-3p [50,51] ↓ YWHAQ [70] | ||||
| GABAergic | 0.001 | - | 3 | ↑ miR-200a-3p [52], miR-9-5p [27], miR-125b-5p [67] ↓ GLS [80] |
| Estrogen signaling pathway | 0.002 | - | 2.7 | ↑ miR-155-5p [66,67], miR-27a-3p [52,56], miR-3613-3p [51], miR-374b-5p [34], miR-10a-5p [43], miR-200a-3p [52], miR-425-5p [52,64], miR-362-3p [52] ↓ CREB1 [87] |
| Thyroid hormone signaling pathway | 0.002 | - | 2.7 | ↑ miR-3613-3p [51], miR-23a-3p [44,52], miR-550a-3p [34] ↓ CREBBP [87] |
| ↑ miR-155-5p [62,66,67], miR-27a-3p [52,56], miR-3613-3p [51], miR-374b-5p [34], miR-10a-5p [43], miR-200a-3p [52], miR-425-5p [52,64], miR-362-3p [52] ↓ CREB1 [87] | ||||
| Prolactin signaling pathway | 0.002 | - | 2.6 | ↓ miR-487a-3p [52], miR-136-5p [52], miR-543 [52], miR-889-3p [43] ↑SOCS4 [73] |
| Protein processing in endoplasmic reticulum | 0.002 | - | 2.6 | ↓ miR-219a-2-3p [34,52], miR-107 [56,57], miR-103a-3p [57], miR-30e-3p [49], miR-30a-3p [43], miR-195-5p [52,57], miR-16-5p [33,56,57], miR-15b-5p [47,57], miR-889-3p [43], miR-539-5p [43], miR-410-3p [52], miR-129-5p [52], miR-543 [52], miR-375 [43], miR-17-5p [34], miR-495-3p [52], miR-338-5p [60], miR-320a [43,44] ↑ HSPA4L [80] |
| Endocytosis | 0.004 | 0.002 | 2.4 | ↓ miR-298 [45], miR-539-5p [43], miR-18a-5p [34], miR-582-5p [43] ↑RAB5A [90] |
| ↑ miR-603 [65], miR-23a-3p [44,52], miR-3613-3p [51] ↓ DNAJC6 [80] | ||||
| ↑ miR-3613-3p [51], miR-23a-3p [44,52], miR-548 [34], miR-603 [65], miR-362-3p [52], miR-27a-3p [52,56], miR-146a-3p [27,56,67] ↓ DNM3 [80] | ||||
| AMPK signaling pathway | ↑ miR-142-3p [52] ↓ HGS [80] | |||
| AMPK signaling pathway | 0.005 | - | 2.3 | ↑ miR-425-5p [52,64], miR-155-5p [66,67], miR-27a-3p [52,56], miR-10a-5p [43], miR-362-3p [52], miR-374b-5p [34], miR-3613-3p [51], miR-200a-3p [52] ↓ CREB1 [87] |
| AMPK signaling pathway FoxO signaling pathway | ↑ miR-150-5p [52] ↓ PPP2R1A [80] | |||
| AMPK signaling pathway FoxO signaling pathway | 0.006 | - | 2.2 | ↓ miR-329-3p [52], miR-495-3p [52], miR-320a [43,44] ↑ CSNK1E [79] |
| AMPK signaling pathway FoxO signaling pathway | ↑ miR-550a-3p [34], miR-3613-3p [51], miR-23a-3p [44,52] ↓ CREBBP [87] | |||
| AMPK signaling pathway FoxO signaling pathway | ↑ miR-603 [65], miR-3613-3p [51] ↓ EP300 [87] | |||
| AMPK signaling pathway FoxO signaling pathway Adrenergic signaling in cardiomyocytes | ↑ miR-374b-5p [34], miR-3613-3p [51], miR-34c-3p [43,44,56] ↓ HOMER1 [80] | |||
| AMPK signaling pathway FoxO signaling pathway | 0.001 | - | 2.1 | ↑ miR-10a-5p [43], miR-425-5p [52,64], miR-374b-5p [34], miR-362-3p [52], miR-200a-3p [52], miR-155-5p [66,67], miR-27a-3p [52,56], miR-3613-3p [51] ↓ CREB1 [87] |
| Arrhythmogenic right ventricular cardiomyopathy (ARVC) | ↑ miR-150-5p [52] ↓ PPP2R1A [80] | |||
| Arrhythmogenic right ventricular cardiomyopathy (ARVC) Transcriptional mis-regulation in cancer | 0.008 | - | 2.1 | ↓ miR-320a [43,44], miR-543 [52], miR-582-5p [43], miR-889-3p [43], miR-410-3p [52], miR-539-5p [43], miR-30a-3p [43], miR-30e-3p [49], miR-329-3p [52], miR-298 [45], miR-338-5p [60] ↑ CREB1 [87] |
| Arrhythmogenic right ventricular cardiomyopathy (ARVC) Transcriptional mis-regulation in cancer | 0.009 | - | 2 | ↓ miR-15b-5p [47,57] ↑ H3F3A [80] |
| TGF-beta signaling pathway | 0.011 | - | 1.9 | ↑ miR-550a-3p [34], miR-3613-3p [51], miR-23a-3p [44,52] ↓ CREBBP [87] |
| ↑ miR-603 [65], miR-3613-3p [51] ↓ EP300 [87] | ||||
| ↑ miR-150-5p [52] ↓ PPP2R1A [80] | ||||
| Prostate cancer | 0.011 | - | 1.9 | ↑ miR-425-5p [52,64], miR-10a-5p [43], miR-200a-3p [52], miR-374b-5p [34], miR-362-3p [52], miR-27a-3p [52,56], miR-3613-3p [51], miR-155-5p [66,67] ↓ CREB1 [87] |
| ↑ miR-550a-3p [34], miR-23a-3p [44,52], miR-3613-3p [51] ↓ CREBBP [87] | ||||
| ↑ miR-603 [60], miR-3613-3p [46] ↓ EP300 [82] | ||||
| cAMP signaling pathway | 0.013 | - | 1.9 | ↑ miR-155-5p [61,62], miR-10a-5p [38], miR-200a-3p [47], miR-374b-5p [29], miR-27a-3p [47,51], miR-425-5p [47,50], miR-362-3p [47], miR-3613-3p [46] ↓ CREB1 [87] |
| ↑ miR-550a-3p [34], miR-23a-3p [44,52], miR-3613-3p [51] ↓ CREBBP [87] | ||||
| ↑ miR-603 [65], miR-3613-3p [51] ↓ EP300 [87] | ||||
| Cholinergic synapse | 0.015 | - | 1.8 | ↑ miR-155-5p [66,67], miR-10a-5p [43], miR-200a-3p [52], miR-374b-5p [34], miR-27a-3p [52,56], miR-425-5p [52,55], miR-362-3p [52], miR-3613-3p [51] ↓ CREB1 [87] |
| Amoebiasis | 0.020 | 0.004 | 1.7 | ↓ miR-18a-5p [34], miR-582-5p [43], miR-539-5p [43], miR-298 [45] ↑ RAB5A [90] |
| ↑ miR-23a-3p [44,52] ↓ ACTN2 [80] | ||||
| Gap junction | 0.021 | - | 1.7 | ↓ miR-539-5p [43], miR-664a-3p [49], miR-582-5p [43], miR-495-3p [52] ↑ GJA1 [80] |
| mRNA surveillance pathway | 0.024 | - | 1.6 | ↓ miR-410-3p [52], miR-129-5p [52], miR-582-5p [43], miR-769-5p [52], miR-889-3p [43], miR-128-3p [52], miR-320a [43,44], miR-495-3p [52] ↑ MSI2 [92] |
| ↑ miR-150-5p [52] ↓ PPP2R1A [80] | ||||
| Circadian rhythm | 0.025 | 0.001 | 1.6 | ↓ miR-136-5p [52] ↑ ARNTL [77] |
| ↓ miR-15b-5p [47,57], miR-195-5p [52,59], miR-16-5p [33,56,57], miR-889-3p [43], miR-543 [52], miR-338-5p [60], miR-29c-3p [53], miR-129-5p [52], miR-495-3p [52], miR-107 [56,57], miR-103a-3p [57] ↑ CLOCK [77] | ||||
| ↓ miR-329-3p [52], miR-495-5p [52] ↑ CSNK1E [79] | ||||
| ↑ miR-27a-3p [52,56], miR-10a-5p [43], miR-374b-5p [34], miR-155-5p [66,67], miR-200a-3p [52], miR-3613-3p [51], miR-362-3p [52], miR-425-5p [52,64] ↓ CREB1 [87] | ||||
| Insulin signaling pathway | 0.027 | - | 1.6 | ↓ miR-487a-3p [52], miR-136-5p [52], miR-543 [52], miR-889-3p [43] ↑ SOCS4 [73] |
| Bacterial invasion of epithelial cells | 0.352 | - | 1.5 | ↑ miR-603 [65], miR-23a-3p [44,52], miR-548 [34], miR-362-3p [52], miR-3613-3p [51], miR-27a-3p [52,56], miR-146a-3p [27,56,67] ↓ DNM3 [80] |
| cGMP-PKG signaling pathway | 0.035 | - | 1.4 | ↑ miR-155-5p [66,67], miR-10a-5p [43], miR-200a-3p [52], miR-374b-5p [34], miR-27a-3p [52,56], miR-425-5p [52,64], miR-362-3p [52], miR-3613-3p [51], ↓ CREB1 [87] |
Publisher’s Note: MDPI stays neutral with regard to jurisdictional claims in published maps and institutional affiliations. |
© 2021 by the authors. Licensee MDPI, Basel, Switzerland. This article is an open access article distributed under the terms and conditions of the Creative Commons Attribution (CC BY) license (https://creativecommons.org/licenses/by/4.0/).
Share and Cite
Tasker, R.; Rowlands, J.; Ahmed, Z.; Di Pietro, V. Co-Expression Network Analysis of Micro-RNAs and Proteins in the Alzheimer’s Brain: A Systematic Review of Studies in the Last 10 Years. Cells 2021, 10, 3479. https://0-doi-org.brum.beds.ac.uk/10.3390/cells10123479
Tasker R, Rowlands J, Ahmed Z, Di Pietro V. Co-Expression Network Analysis of Micro-RNAs and Proteins in the Alzheimer’s Brain: A Systematic Review of Studies in the Last 10 Years. Cells. 2021; 10(12):3479. https://0-doi-org.brum.beds.ac.uk/10.3390/cells10123479
Chicago/Turabian StyleTasker, Rachel, Joseph Rowlands, Zubair Ahmed, and Valentina Di Pietro. 2021. "Co-Expression Network Analysis of Micro-RNAs and Proteins in the Alzheimer’s Brain: A Systematic Review of Studies in the Last 10 Years" Cells 10, no. 12: 3479. https://0-doi-org.brum.beds.ac.uk/10.3390/cells10123479