Article

Increased Alveolar Heparan Sulphate and Reduced Pulmonary Surfactant Amount and Function in the Mucopolysaccharidosis IIIA Mouse

1
Mechanisms in Cell Biology and Disease Group, UniSA Clinical and Health Sciences, University of South Australia, Adelaide, SA 5000, Australia
2
Proteomics, Metabolomics and MS-Imaging Core Facility, South Australian Health and Medical Research Institute, Adelaide, SA 5000, Australia
3
Department of Biochemistry, Faculty of Biology and Research Institute Hospital 12 de Octubre (Imas12), Complutense University, 28003 Madrid, Spain
4
Faculty of Medicine, University of Southampton, Southampton SO16 6YD, UK
5
Early Origins Adult Health Research Group, Health and Biomedical Innovation, UniSA Clinical and Health Sciences, University of South Australia, Adelaide, SA 5000, Australia
*
Author to whom correspondence should be addressed.
Submission received: 11 February 2021 / Revised: 18 March 2021 / Accepted: 24 March 2021 / Published: 8 April 2021
(This article belongs to the Special Issue Lysosomal Storage Disorders)

Abstract

:
Mucopolysaccharidosis IIIA (MPS IIIA) is a lysosomal storage disease with significant neurological and skeletal pathologies. Respiratory dysfunction is a secondary pathology contributing to mortality in MPS IIIA patients. Pulmonary surfactant is crucial to optimal lung function and has not been investigated in MPS IIIA. We measured heparan sulphate (HS), lipids and surfactant proteins (SP) in pulmonary tissue and bronchoalveolar lavage fluid (BALF), and surfactant activity in healthy and diseased mice (20 weeks of age). Heparan sulphate, ganglioside GM3 and bis(monoacylglycero)phosphate (BMP) were increased in MPS IIIA lung tissue. There was an increase in HS and a decrease in BMP and cholesteryl esters (CE) in MPS IIIA BALF. Phospholipid composition remained unchanged, but BALF total phospholipids were reduced (49.70%) in MPS IIIA. There was a reduction in SP-A, -C and -D mRNA, SP-D protein in tissue and SP-A, -C and -D protein in BALF of MPS IIIA mice. Captive bubble surfactometry showed an increase in minimum and maximum surface tension and percent surface area compression, as well as a higher compressibility and hysteresis in MPS IIIA surfactant upon dynamic cycling. Collectively these biochemical and biophysical changes in alveolar surfactant are likely to be detrimental to lung function in MPS IIIA.

1. Introduction

Mucopolysaccharidosis type IIIA (MPS IIIA, Sanfilippo syndrome) is one of a group of up to 70 devastating lysosomal storage diseases (LSD) [1,2,3], which occur as a result of dysfunctional lysosomes. MPS IIIA is caused by mutations in the lysosomal hydrolase gene, N-sulfoglucosamine sulfohydrolase (SGSH), which produces sulphamidase that normally catalyses the degradation of the glycosaminoglycan (GAG), heparan sulphate (HS), to monosaccharides and inorganic sulphate for recycling in the cell [4]. Sulphamidase deficiency causes partially degraded HS and components of the entire catabolic pathway to accumulate in the lysosomal organelles and substrates for hydrolysis by downstream lysosomal enzymes are no longer degraded [5]. Specifically, there is an accumulation of gangliosides GM2 and GM3 and cholesterol affecting neuropathology in the brain [4].
Whilst MPS IIIA has devastating consequences in the brain with severe neurological dysfunction and behavioural disturbances, other symptoms occur in the skeletal, immune, muscular, renal, endocrine and exocrine systems, in addition to disordered sleep patterns and respiratory issues [2,6,7,8]. MPS IIIA is frequently associated with severe respiratory infection in mid to late teenage years with pneumonia being the leading cause of death at the median age of 14.5 years in the severe phenotype [6,9,10].
Primary lung involvement is not normally a symptom reported in the mucopolysaccharidoses at birth. Rather, respiratory symptoms manifest secondary to neurological and skeletal pathologies in the form of severe respiratory obstructions in upper and lower airways in MPS I, II, V and VI patients, and to a lesser extent in MPS IIIA patients [11]. However, respiratory distress was the primary presentation in two recent cases of MPS I [12] and one of MPS IIIA [5] where lung tissue biopsies showed interstitial cells with vacuolated cytoplasm containing a flocculent substrate, which was suggestive of GAG storage [5,12]. Significant pulmonary, and specifically alveolar involvement, have been confirmed in several LSD including Gaucher, Niemann-Pick types A and C2, Sandhoff and Sialidosis diseases [13,14,15,16,17], with not only the accumulation of lipids and other substrates, but a consequential alteration in the production of pulmonary surfactant (PS) leading to respiratory distress and dysfunction. Surfactant is produced and stored in alveolar epithelial type II cells, in special organelles, the lamellar bodies, belonging to the endosome-lysosome system which finally secrete surfactant into the liquid lining of the lung, where it forms a surface-active film at the air-liquid interface. Surfactant serves a dual role: to regulate the interfacial surface tension of the lung during the breathing cycle to reduce the work of breathing and in host defence as part of the innate immune system of the lung, where it protects against pulmonary-acquired pathogens. Therefore, compromise of the PS system may lead to symptoms including recurrent cases of ear, nose and throat infections, which present more frequently with age in the mucopolysaccharidoses [11].
Here, we hypothesised that the accumulation of undegraded heparan sulphate in the alveolar epithelium contributes to altered metabolism, including synthesis, secretion and composition of pulmonary surfactant in MPS IIIA, leading to impaired surface activity. The aim of this study was to describe alterations in pulmonary tissue storage of GAG, lipid and protein composition of lung tissue and pulmonary surfactant, and surfactant activity using a naturally occurring MPS IIIA mouse model. Impaired surfactant metabolism and activity may explain the increased susceptibility of MPS IIIA patients to respiratory infections and other pulmonary insults.

2. Materials and Methods

2.1. Animals

Wild type, heterozygous and homozygous MPS IIIA (CL57BL/6, D31N aspartate to asparagine mutation) mice were obtained from a breeding colony established and maintained at the Women’s and Children’s Health Network (WCHN) animal facility, Adelaide, South Australia [18]. The mouse model has approximately 3–4% sulphamidase activity in the brain, kidney and liver, and closely mimic the pathological, biochemical and behavioural characteristics observed in humans [18,19]. Mice were kept in a standard 12:12 h light-dark cycle and had free access to pelleted food and water with standard care. All experiments were conducted with ethics approval obtained through the WCHN ethics committee (Ethics #AE1054 and AEC1031/12/18).

2.2. Tissue and Lavage (BALF) Collection

Mice were humanely killed with sodium pentobarbitone (lethabarb 20–80 mg/100 g body weight) at approximately 20 weeks of age. Mice (n = 30 wild type, 25 heterozygous and 55 MPS IIIA mice) were allocated to either tissue collection or bronchoalveolar lavage fluid (BALF) collection. Lung tissue was collected by dissecting the lungs and snap-freezing and storing at −80 °C before analysis. BALF was collected from lungs in situ via tracheal 103 cannulation. Three separate volumes of ice-cold 0.9% (w/v) saline were each instilled into and withdrawn from the lungs 3 times to rinse the lungs of pulmonary surfactant. Recovered BALF was placed on ice before centrifuging (150× g, 5 min, 4 °C). The supernatant was decanted and stored at −80 °C for later lipid extraction and analysis.

2.3. Tissue Homogenisation

Lung tissue samples were prepared for analysis by loading silica-bead tubes with ~50 mg tissue, 1 mL phosphate buffer and protease inhibitor (2.5 µL/50 mg tissue) (Roche Diagnostics, cOmplete protease inhibitor Mini cat#04693159001) before homogenising (Precelly’s 24, Bertin Technology) (6000 rpm, 10 s, room temperature (RT)). Samples were centrifuged (Eppendorf centrifuge 5415R) (500 g, 5 min, 4 °C) to pellet the debris. The supernatant was collected and stored at −80 °C. Total protein quantification in lung homogenates was determined using a micro bicinchoninic acid (BCA) protein assay kit (Thermo Scientific Inc., Melbourne, VIC, Australia Cat# PN 23 227). Bovine serum albumin was used to generate the standard curve.

2.4. Sample Preparation and Analysis—Heparan Sulphate

Heparan sulphate in tissue and BALF samples was depolymerised and desulphated to prepare alkylated disaccharides by butanolysis according to published methods [20]. Briefly, BALF (900 µL) samples were freeze dried overnight. 2,2-dimethoxypropane (50 µL) and butanolic HCl (3 M, 1000 µL) were added to BALF and tissue lysate samples, sealed and incubated (100 °C, 2 h). Samples were dried under nitrogen (45 °C, 1 h) before being reconstituted with 200 µL d9 disaccharide internal standard (IS). Solutions were mixed (30 min) on an orbital shaker (Ratek Instruments, Boronia, VIC, Australia) and centrifuged (Biofuge pico centrifuge, Heraeus, Germany) (13,000 rpm, 15 min). Standards were prepared using disaccharide standard at 1, 5, 20, 100, 500, 1000 and 1500 ng. Blanks consisted of MilliQ water and 0.1% Trifluoroacetic acid (TFA). Sample supernatant (80 µL) and disaccharide standards were loaded into a 96-well microtiter plate, sealed with foil and placed at 6 °C in the sample manager for analysis.
Liquid chromatography-tandem mass spectrometry (LC-MS/MS) analysis was performed using an Acquity UPLC (Waters Corporation, Milford, MA, USA) equipped with a 2.1 mm ID × 50 mm BEH C18 (1.7 µm particle) analytical column (P/N. 186002350) and an API 4000 QTrap mass spectrometer (ABSciex, Concord, ON, Canada). A random order run was created on the mass spectrometry software prior to commencing the run. Initial blank and quality control samples were in specific positions in the run. Samples were analysed interspersed every three injections with a blank injection of MilliQ water/0.1% TFA. A binary solvent system was used; solvent A consisting of water with 0.1% formic acid (FA) and solvent B consisting of acetonitrile with 0.1% FA. Sample injection (2 µL) was loaded on the column at a flow rate of 350 µL/min using 99% solvent A. The LC system was conditioned (2 min) prior to the commencement of the analysis. Chromatographic separation was performed using the gradient shown in Table 1.
Data were acquired in multiple reaction monitoring (MRM) mode. In this mode six transitions were monitored for 50 ms each, m/z 468.245 to 162.077 (butanolysis product), and m/z 477.300 to 162.077 (d9 Disaccharide IS). The peak areas were calculated using Analyst 1.6.2 (AB/Sciex). Although there were multiple peaks present following butanolysis of HS, the dominant peak was integrated for the analysis. The peaks relating to the chondroitin sulphate/dermatan sulphate transition were generally not detected in samples prepared by butanolysis.

2.5. Sample Preparation and Analysis—Gangliosides, Bis(Monoacylglycero)Phosphate (BMP), and Cholesterol

The Folch extraction method was used to prepare samples for analysis [21]. Briefly, BALF samples (90 µL) were freeze dried and reconstituted with MilliQ water (100 µL). Internal standards were added to BALF and tissue samples (100 µg protein) to enable quantification. CHCl3/CH3OH (2 mL) was added prior to mixing on a tube rotator (40 rpm, 10 min) and standing (RT, 50 min). MilliQ water (400 µL) was added, mixed on a tube rotator (40 rpm, 10 min) and then centrifuged (3500 rpm, 5 min). Resultant layers were transferred as follows: upper aqueous layers to glass tubes for ganglioside extraction procedure and lower hydrophobic phase to two glass tubes for BMP and cholesterol analysis, respectively (~50 µL each).
For ganglioside extraction, C18 (200 mg) columns were primed with 3 × 1 mL CH3OH followed by 3 × 1 mL MilliQ water and loaded with sample. Columns were washed with 1 × 1 mL MilliQ water before eluting gangliosides with 3 × 1 mL CH3OH into 10 mL glass tubes, followed by brief vacuum drying. Samples were dried under nitrogen (38 °C) before resuspending in 100 µL 10 mM NH4COOH in CH3OH and centrifuging (3500 rpm, 5 min). Supernatant (80 µL) was transferred into a 96-well microtitre plate for analysis.
For BMP extraction, samples were dried under nitrogen at 38 °C, resuspended in 200 µL 10 mM NH4COOH in CH3OH and vortexed briefly before centrifuging (3500 rpm, 5 min). The supernatant (~25 µL/sample) was transferred to a 96-well microtiter plate for analysis.
For the cholesterol esterification reaction, samples were dried under nitrogen at 38 °C. Anhydrous acetyl chloride/CHCl3 (1:5 v:v) (100 µL) was added, the vial sealed, vortexed (1 min) and allowed to stand (RT, 1 h). Samples were dried under nitrogen at 38 °C, reconstituted in 200 µL 100% CH3OH/10 mM NH4COOH and centrifuged (3500 rpm, 5 min). Supernatant (~80 µL) was transferred into a 96 well microtitre plate for analysis.
Liquid chromatography-tandem mass spectrometry (LC-MS/MS) analysis was performed using a Shimadzu LC-20AD binary pump system combined with an ABSciex API 4000 QTrap mass spectrometer equipped with Analyst software (Version 1.4.2) and a turbo-ionspray source. Liquid chromatography separation was achieved by injecting samples (20 μL) onto a 3 µm Alltima C18 column (50 × 2.1 mm) at 200 µL. The HPLC gradient program began with 70% mobile phase A (30% tetrahydrofuran/20% CH3OH/50% 5 mM NH4COOH in H2O) followed by a linear ramp (0.01–7.0 min) to 100% mobile phase B (70% tetrahydrofuran/20% CH3OH/10% 5 mM NH4COOH in H2O) and maintained for 3 min. Re-equilibration at 70% mobile phase A was performed for 3 min prior to the next injection. A Valco 10-port post column valve diverted column flow to waste for the first 1.7 min.
Mass spectrometric analysis of gangliosides was performed in negative ion multiple reaction monitoring mode using an ionspray temperature of 200 °C and voltage of −5000 V. Nitrogen was used as the collision gas at a pressure of 2 × 10⁻⁵ Torr. Concentrations of each molecular species were calculated by relating the peak areas of each species to the peak area of the corresponding internal standard using Analyst 1.6.2 software.
Mass spectrometric analysis of cholesterol and BMP was performed in positive ion multiple reaction monitoring mode using an ionspray temperature of 200 °C and voltage of 5000 V. Nitrogen was used as the collision gas at a pressure of 2 × 10⁻⁵ Torr. Relative cholesterol levels were determined by relating the peak area of C2 cholesterol to the peak area of C17 cholesterol internal standard. BMP molecular species were differentiated from phosphatidylglycerol by their molecular ion fragmentation in positive mode. This allowed identification of both acyl carbon chains for BMP. Concentrations of each molecular species were calculated by relating the peak areas of each species to the peak area of the corresponding internal standard using Analyst 1.6.2 software.

2.6. Tissue and Lavage Collection for Total Phospholipid Pool Analysis

Control and MPS IIIA mice (as detailed in Section 2.1) used in the phospholipid pool analysis were collected as part of a larger cohort designed to measure a phosphatidylcholine kinetics time course following intraperitoneal injection of D9 choline chloride (Ethics #AE1054). Here, we presented only the data from the 0 h time point, in which mice were not injected with the isotope. Following very deep anaesthesia that was administered via intraperitoneal injection of xylazine (10 mg/kg)/ketamine (100 mg/kg), the chest cavity was opened, blood collected from the heart, and a sample of liver collected. Plasma was separated and both plasma and liver samples were snap frozen for future phospholipid analysis. Both lungs were lavaged via tracheal cannulation and the BALF prepared and frozen as per Section 4.2. Lavage recovery was 84.5 ± 8.8% from n = 9 control, 14 MPS IIIA samples, which is similar to that reported previously [22]. The left lung lobe was snap frozen to use for lung tissue phospholipid analysis (n = 16 control, 14 MPS IIIA samples) and the right lung lobes were excised and chilled in 0.25 M sucrose to isolate lamellar bodies (no data shown). Samples were transported on dry ice to Southampton, UK, for mass spectrometry analysis.

2.7. Sample Preparation and Analysis—Total Phospholipids

Lavaged lung tissue, with 10 µL of the antioxidant butylated hydroxyl toludene (BHT) added, was homogenised in saline using a Heidolph Silent Crusher S prior to storing a −80 °C. Phospholipids were extracted from both lung tissue homogenates and BALF using the method of Bligh and Dyer [23]. BALF samples were thawed and 800 µL of each sample was removed before the addition of 10 µL of BHT. To the 800 µL aliquots each, of tissue homogenate and BALF, 100 µL of an internal standard mixture of synthetic lipids (Table 2) was added. Samples were vortexed prior to lipid extraction using a Freedom EVO 100 robotic liquid handling system (Tecan, Theale, UK). The robot was programmed to add 2 mL methanol, 2 mL dichloromethane (DCM) and 1 mL of distilled water to each sample and mixed well to allow for the formation of a biphasic mixture; the lower DCM layer containing phospholipids and an aqueous upper layer. Samples were centrifuged (3000 rpm, 10 min, 20 °C) and the lipid layer removed by the robot before being dried under a stream of warmed nitrogen gas (Ultravap, Porvair, Norfolk, UK) for 40 min. Samples were stored at −80 °C until they were analysed by mass spectrometry.
Mass spectrometry was performed on phospholipids using electrospray ionisation (ESI) (Waters XEVO TQ-MS). Dried BALF samples were dissolved in 1 mL 66% CH3OH, 30% DCM and 4% CHNO (300 mM in H2O). Two hundred µL was used from each sample to prepare a pooled Analytical Quality Control (AQC) sample for each genotype. The sample solution was infused using the loop injection method into the mass spectrometer (HP1100 Agilent HPLC) at 0.005 mL/min using 99% CH3OH with 1% acetic acid with a series of multiple injections. Diagnostic MS/MS scans were carried out in positive and negative mode (Table 3) and analysis was conducted as indicated in diagnostic MS/MS scans for head groups (Supplementary Materials—Table S1). Measuring time for each sample varied between 35 and 90 min with 5 min cleaning injection (60% methanol, 30% dichloromethane and 10% acetic acid) after every sample. The pooled AQC was run with between 5 to 6 samples for each mouse genotype and with each genotype at the start and at the end of each batch. This extended analysis time enabled a comprehensive range of diagnostic MS/MS scans to be performed, detailed below and summarised in Supplementary Materials—Table S1.
  • Positive and negative ESI scans were performed for each sample using an injection volume of 50 µL and an analysis time of 13 min, measuring the total number of ionised molecules in the samples. This was a control for the presence of any contaminants and overall signal intensity and were not used for ion peak assignments.
  • Diagnostic MS/MS precursor scans were performed with the second injection (100 µL) and analysis time of 22.40 min to quantify PC. Scans were based on the detection of the major collision-induced dissociation (CID) phosphorylcholine fragment ion, detected at m/z 184.
  • The third injection (100 µL, analysis 22.40 min) included neutral loss (NL) scans for the DPPC molecule and diagnostic scans for the other major phospholipid classes, P153 for acidic phospholipids, P241 for phosphatidylinositol (PI), NL141 for phosphatidylethanolamine (PE) and NL87 for phosphatidylserine (PS).
  • The final injection (100 µL, analysis 22.40 min) included precursor scans to determine the distributions of fatty acyl moieties. Each of the lipids indicated Supplementary Materials—Table S1) were detected by the indicated type of scan to provide a comprehensive analysis of unlabelled phospholipids.
For molecular species analysis mass spectrometry provided a generic formula based on the total number of carbon atoms and unsaturated double bonds in each lipid class (Supplementary Materials—Table S1). Based on previous analyses [24,25] and MS/MS fragmentation in negative ionisation to generate diagnostic fatty acyl residues, column 2 (Supplementary Materials—Table S2) identifies the most probable molecular structures. Here, designations are given as PXa:y/b:x for each phospholipid class, where X represents the headgroup base (e.g., choline or glycerol), a and b are the number of carbon atoms in the sn-1 and sn-2 fatty acyl residues and y and x are numbers of double bonds.

2.8. Captive Bubble Surfactometry (CBS)

BALF precipitant (n = 10 control, 6 MPS IIIA) was prepared by ultracentrifugation (Beckman Optima L-90K; SW65Ti rotor; 31,000 rpm; 4 °C; 1 h) and resuspended in ~10 µL supernatant and placed in a bath sonicator for 8 min. PC was assayed in duplicate using previously published enzymatic methods (Spinreact, St. Esteve de Bas, Girona, Spain) [26,27,28] and samples reconstituted with phosphate buffered saline to a PC concentration of 20 mg/mL. For CBS analysis ~200 nL of the surfactant suspension was applied to the surface of a 0.05 mL air bubble created inside a buffer-filled (5 mM Tris, 150 mM NaCl, pH 7 and 5% sucrose) thermostatically controlled (37 °C) chamber. The bubble was compressed and expanded periodically using hydrostatic pressure delivered by a piston. CBS mimics the respiratory cycle changes in alveolar volumes so that surface-active properties under dynamic compression-expansion conditions are measured at the air-liquid interface of the air bubble. Variations in the bubble shape were continuously recorded and analysed using the custom-designed CBS software, facilitating the calculation of volume, area and surface tension at all times [29]. For each sample, CBS measurements were carried out in triplicate at 37 °C according to the following protocol. After initial adsorption for 5 min, the chamber was sealed and the bubble expanded to 0.15 mL. Post-expansion adsorption was measured for another 5 min. Thereafter a single quasi-static compression cycle was completed to determine the bubble size limits for step-wise 20% compressions to a final minimum bubble size of ~15% of maximum. Thereafter, the bubble was cycled continuously for 30 cycles at 30 cycles/min. The changes in bubble shape were monitored continuously and related to changes in surface tension (γ).

2.9. Gene Expression Using Quantitative Real-Time PCR

Total RNA was extracted from ~50 mg lung tissue using Qiagen QIAzol Lysis Reagent and Qiagen RNeasy purification columns (Qiagen Pty Ltd., Doncaster, VIC, Australia) according to the manufacturer’s instructions and as previously described [30,31,32]. Total RNA was quantified using spectrophotometric measurements at 260 and 280 nm while the integrity of purified RNA was verified by assessment of the RNA bands run on an agarose gel stained with ethidium bromide.
cDNA was synthesised according to the manufacturer’s guidelines with a Superscript III First Strand Synthesis System (Invitrogen, Carlsbad, CA, USA), using 2 μg total diluted RNA, random hexamers, dNTP, DTT and Superscript III in a final volume of 20 μL. A no template control (NTC) containing no RNA transcript and a no amplification control (NAC) containing no Superscript III were used to check for contamination of reagents or genomic DNA, respectively [33].
Primer sets for target genes (surfactant proteins) and housekeeping genes were designed from the NCBI database (Table 4). All primer pairs were optimised and validated to determine the minimum primer concentration to yield the maximum response.
The geNorm component of the qBase 2.0 relative quantification model (Biogazelle) was used to select the most stable of the genes. Based on this model, ribosomal protein P0 (RpP0), tyrosine 3-monooxygenase/tryptophan 5-Monooxygenase Activation Protein Zeta (YWAHZ) and peptidylprolyl isomerase A (PPIA) were stably expressed across the control and MPS IIIA groups and hence were selected from the candidate reference genes (Table 4) to act as internal standards in the following real time PCR analyses, which followed the MIQE guidelines [32].
Gene expression was determined by qRT-PCR using Fast SYBR Green master mix (Applied Biosystems) in a final volume of 6 μL using a ViiA7 Fast Real-Time PCR machine (Applied Biosystems). Using DataAssist 3.0 (Life Technologies), all surfactant proteins (SP-A, -B, -C and -D) were normalised to the geometric mean of the three most stable housekeeping genes; RpPO, PPIA and YWHAZ. Each well on the qRT-PCR plate contained 1 μL of cDNA, 3 μL FastSYBRGreen Master Mix (2×), and 2 μL of forward and reverse primer (Table 4) mixed with differing amounts of H2O depending on the required final primer concentrations. NTCs for each primer set were included on each plate to check for non-specific amplification. The threshold was set within the exponential growth phase of the amplification curve and the corresponding cycle threshold (Ct) values were obtained to quantify each reaction. A standard curve was obtained by plotting Ct values against the log of cDNA template concentrations. Gene expression was determined by qBase 2.0 relative quantification analysis software (Biogazelle) and expressed as mean normalised expression (MNE).

2.10. Protein Expression Using Western Blot Analysis

Tissue lysate homogenisation for Western blot analysis was completed as per Section 2.2. Quantitative Western blot analysis for lung tissue and BALF samples were optimised using the methods, principles and guidelines described by Pillai-Kastoori et al. [34]. Optimal loading efficiency for each of the primary antibodies was determined using antibody validation and linear range analysis (Empiria Studio Software, Millennium Science, Mulgrave, VIC, Australia).
Samples for SP-A and -D analyses were reduced prior to sodium dodecyl sulfate polyacrylamide gel electrophoresis (SDS-PAGE) using 4–12% bis-tris gels (Thermo Scientific cat# NW04125BOX). Samples for SP-B were analysed under non-reducing conditions, and SP-C analysis under reducing conditions before SDS-PAGE using 16% tricine gels (Thermo Scientific cat# EC66955BOX). Protein transfer to PVDF membrane was performed using the Iblot2 transfer system (Thermo Scientific, Melbourne, VIC, Australia). Total protein analysis used Revert total protein stain (Millennium Science Cat#LCR-926-11021) and fluorescence imaging (700 nm) Odyssey® CLX, Millennium Science, Melbourne, VIC, Australia) (Kirshner & Gibbs, 2018) prior to blocking in Odyssey® TBS blocking buffer. Membranes were incubated overnight (4 °C, rocking) in primary antibody (SP-A Anti-human SP-A Rabbit polyclonal Thermo Scientific Cat#PA5-76699; SP-B Anti-Mature SP-B Rabbit polyclonal SevenHills Bioreagents Cat#WRAB48604; SP-C Anti-Mature SP-C Rabbit polyclonal SevenHills Bioreagents Cat#WRAB-MSPC; SP-D tissue Anti-mouse SP-D Rabbit polyclonal Chemicon International Cat#AB3434 and SP-D BALF Anti-SP-D Rabbit polyclonal Thermo Scientific Cat#PA5-81476). Membranes were then incubated in secondary antibody for 1 h (IRDye 800CW Donkey anti-rabbit IgG Millennium Science Cat#LCR-925-32213 or IRDye 800CW Goat anti-rabbit IgG Millenium Science Cat#LCR-925-32211). Image analysis was performed using the Odyssey® CLX and Image Studio™ Lite Quantification Software (Millennium Science, Melbourne, VIC, Australia). All samples were measured in triplicate. Post image analysis was performed using Image Studio™ Lite Quantification software. Surfactant protein was normalised to total protein and data were expressed as arbitrary units.

2.11. Statistics

Graphical representation and statistical analyses of data were performed using the software package GraphPad Prism 8.3.1 (GraphPad Software, San Diego, CA, USA. www.graphpad.com, accessed on 8 April 2021). As there was negligible HS present in the heterozygous control lung tissue, indicating that there is very little primary storage, the wildtype and heterozygous samples were combined to create a control group and compared with the MPS IIIA samples. Individual results for WT and heterozygous samples are provided in Supplementary Material—Table S3. Control and MPS IIIA groups were analysed using the two-tailed Students t-test, unless stated otherwise, and presented as mean ± SD; p < 0.05 was considered significant.

3. Results

3.1. Heparan Sulphate and Lipid Analyses by Liquid Chromatography Tandem Mass Spectrometry

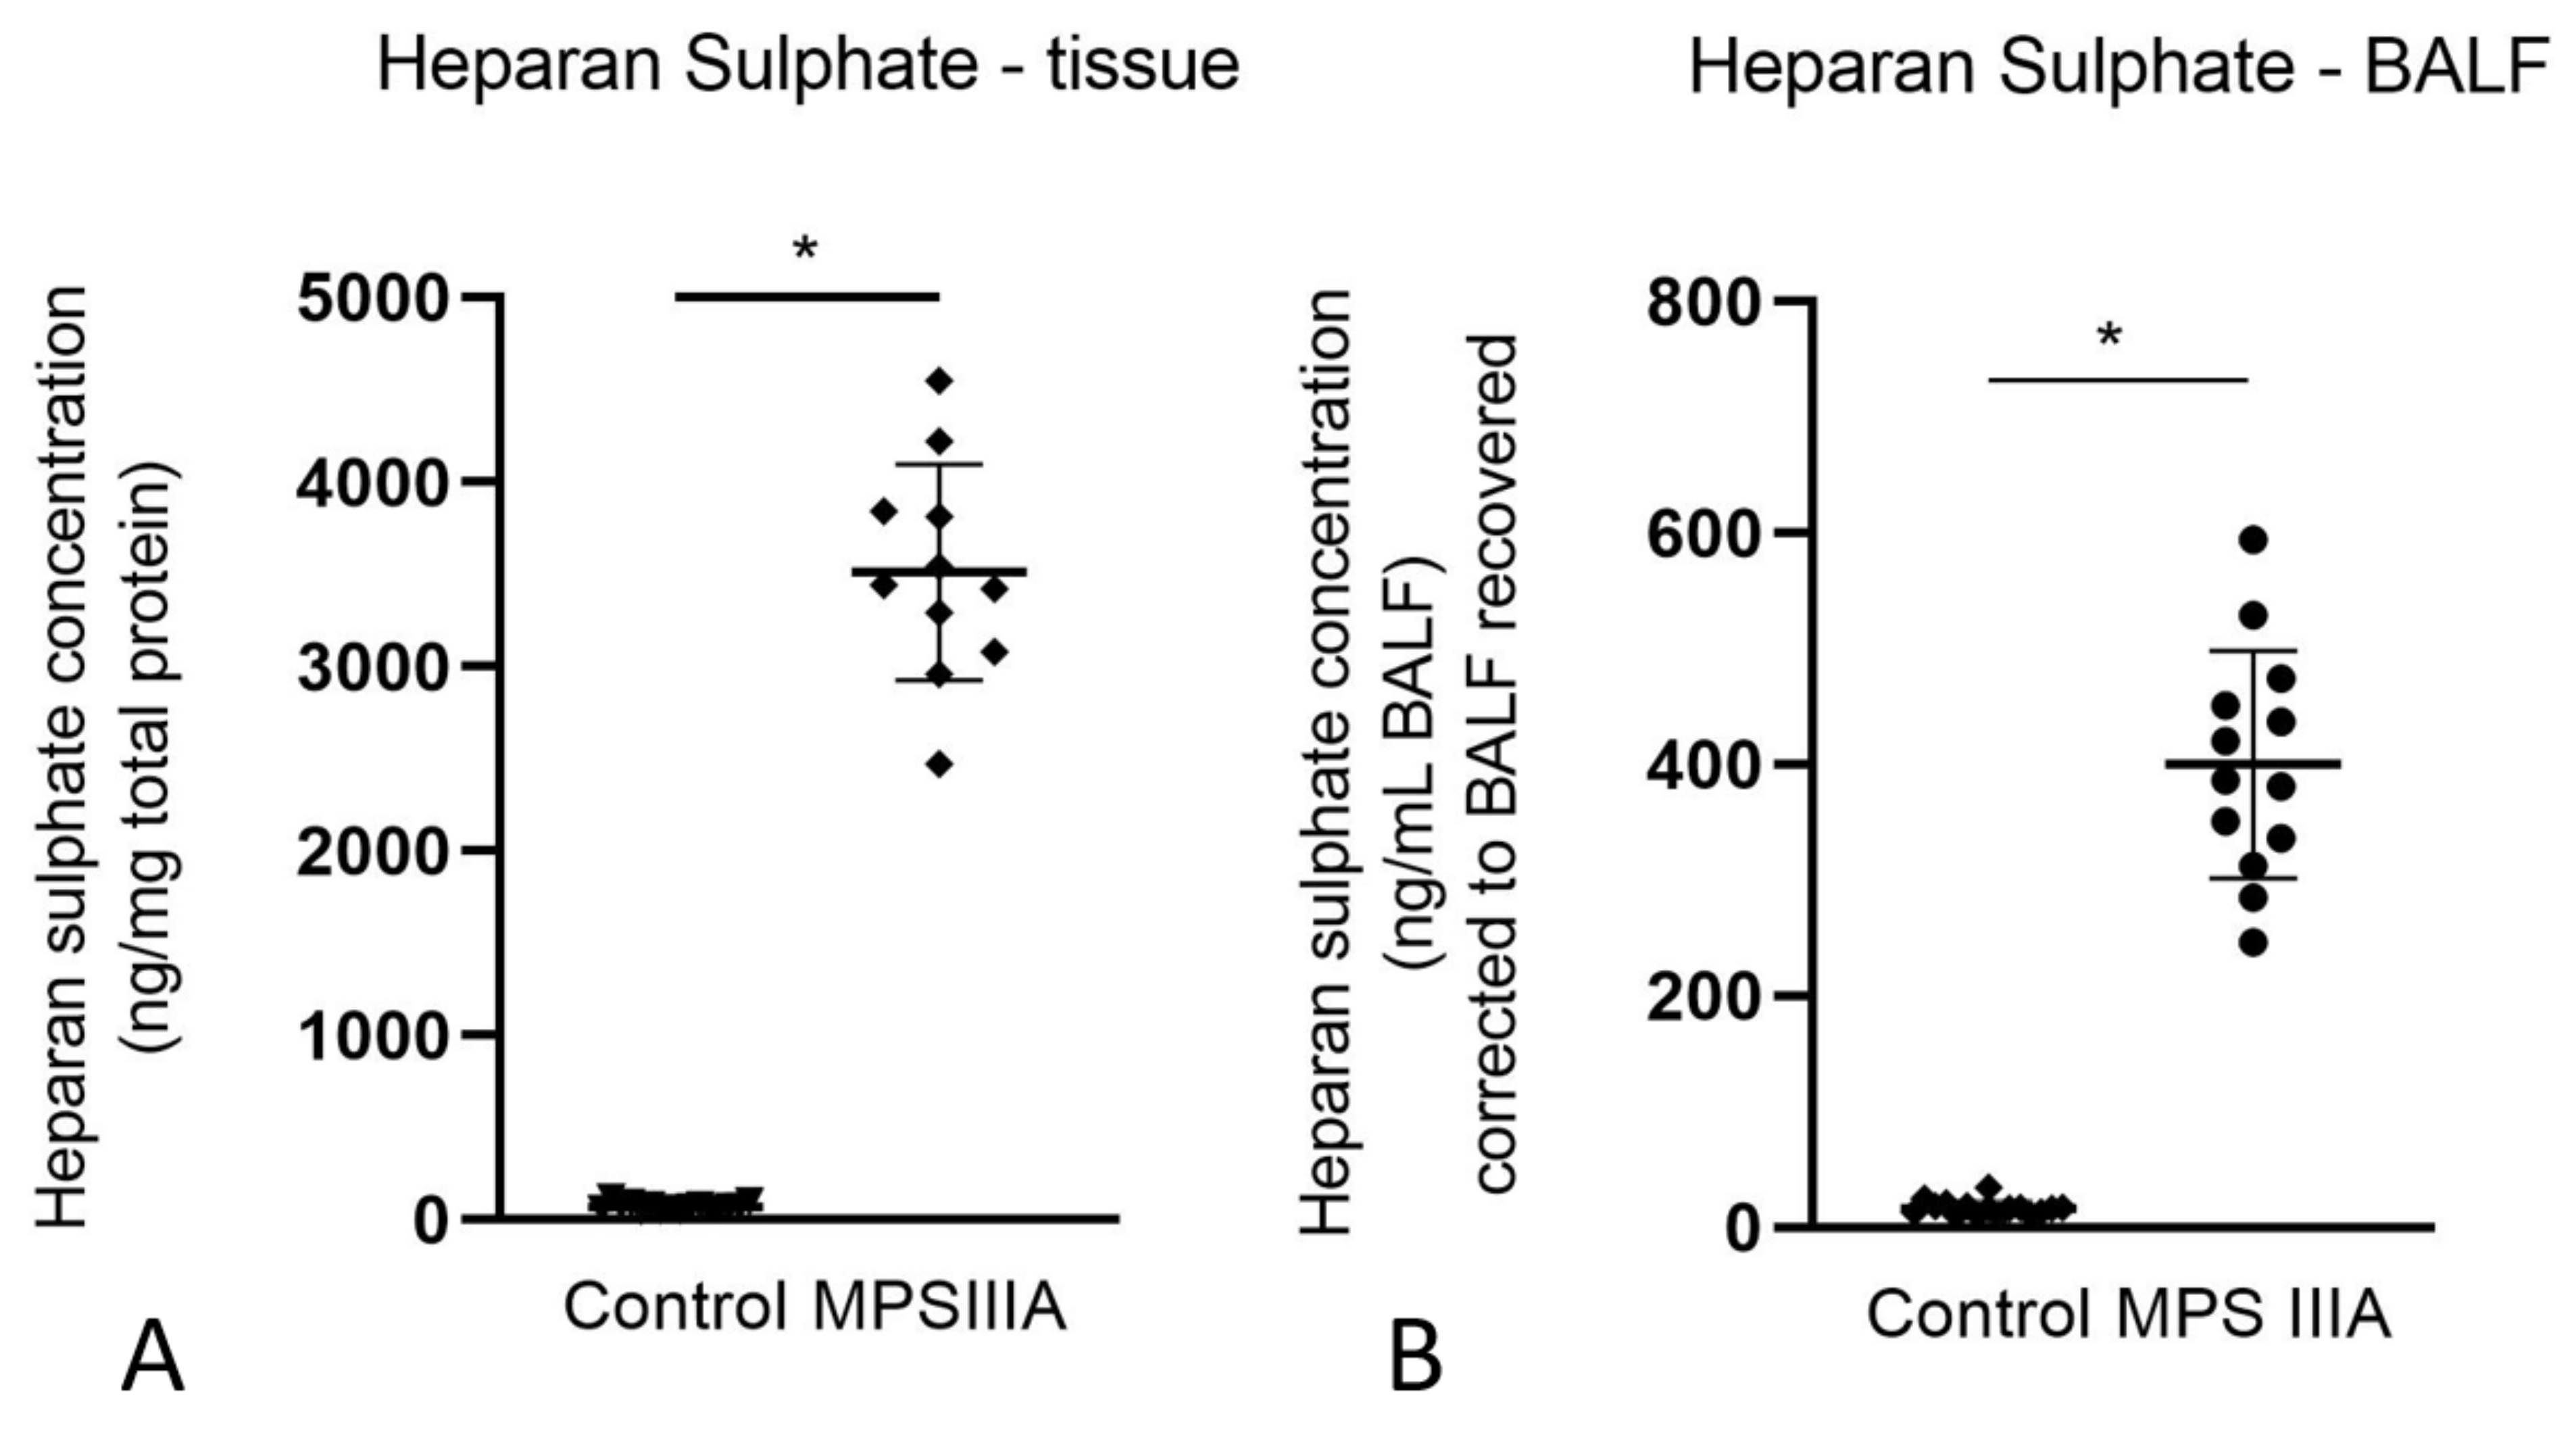
3.1.1. Presence of Heparan Sulphate (HS) in Lung Tissue and Bronchoalveolar Lavage Fluid (BALF)

The amount of HS in lung tissue (3511 ± 584.5 ng/mg protein, n =11) and BALF (400.2 ± 98.3 ng/mL BALF, n = 13) of MPS IIIA mice was significantly greater when compared to that of wild type (lung tissue: 64.85 ± 9.0 ng/mg protein, n = 9; BALF: 14.78 ± 4.0 ng/mL BALF) and heterozygous mice (75.13 ± 25.5 ng/mg protein, n = 9; BALF: 18.86 ± 8.2 ng/mL BALF, n = 7). As there was negligible difference in HS measures between wild type and heterozygous mice, we combined the HS measures for wild type and heterozygous mice to make a single control group for HS (Figure 1A,B). The data for wild type and heterozygous animals were combined into a single control group for all further analyses. The data (mean ± SD) for the individual and combined groups for all analytes are presented in Supplementary Materials—Table S3.

3.1.2. Alterations in Ganglioside Concentration in Lung Tissue

Gangliosides are sialic acid-containing glycosphingolipids. GM3 gangliosides contain three monosaccharide groups attached to a ceramide backbone that consists of a sphingoid base and a fatty acid linked by an amide bond. Different species of GM3 are determined by the fatty acid moieties, which are denoted as d18:1/A:x, where A is the number of carbon atoms and x is the number of double bonds in the fatty acid. The concentration of two of the GM3 ganglioside molecular species d18:1/16:0 and d18:1/22:0 were significantly increased in the lung tissue of MPS IIIA mice when compared to controls (Figure 2). There was no significant difference in the remaining GM3 molecular species nor in GM1 ganglioside concentration in lung tissue between control and MPS IIIA mice (Supplementary Materials—Table S3) and GM2 gangliosides were below the level of quantitation.

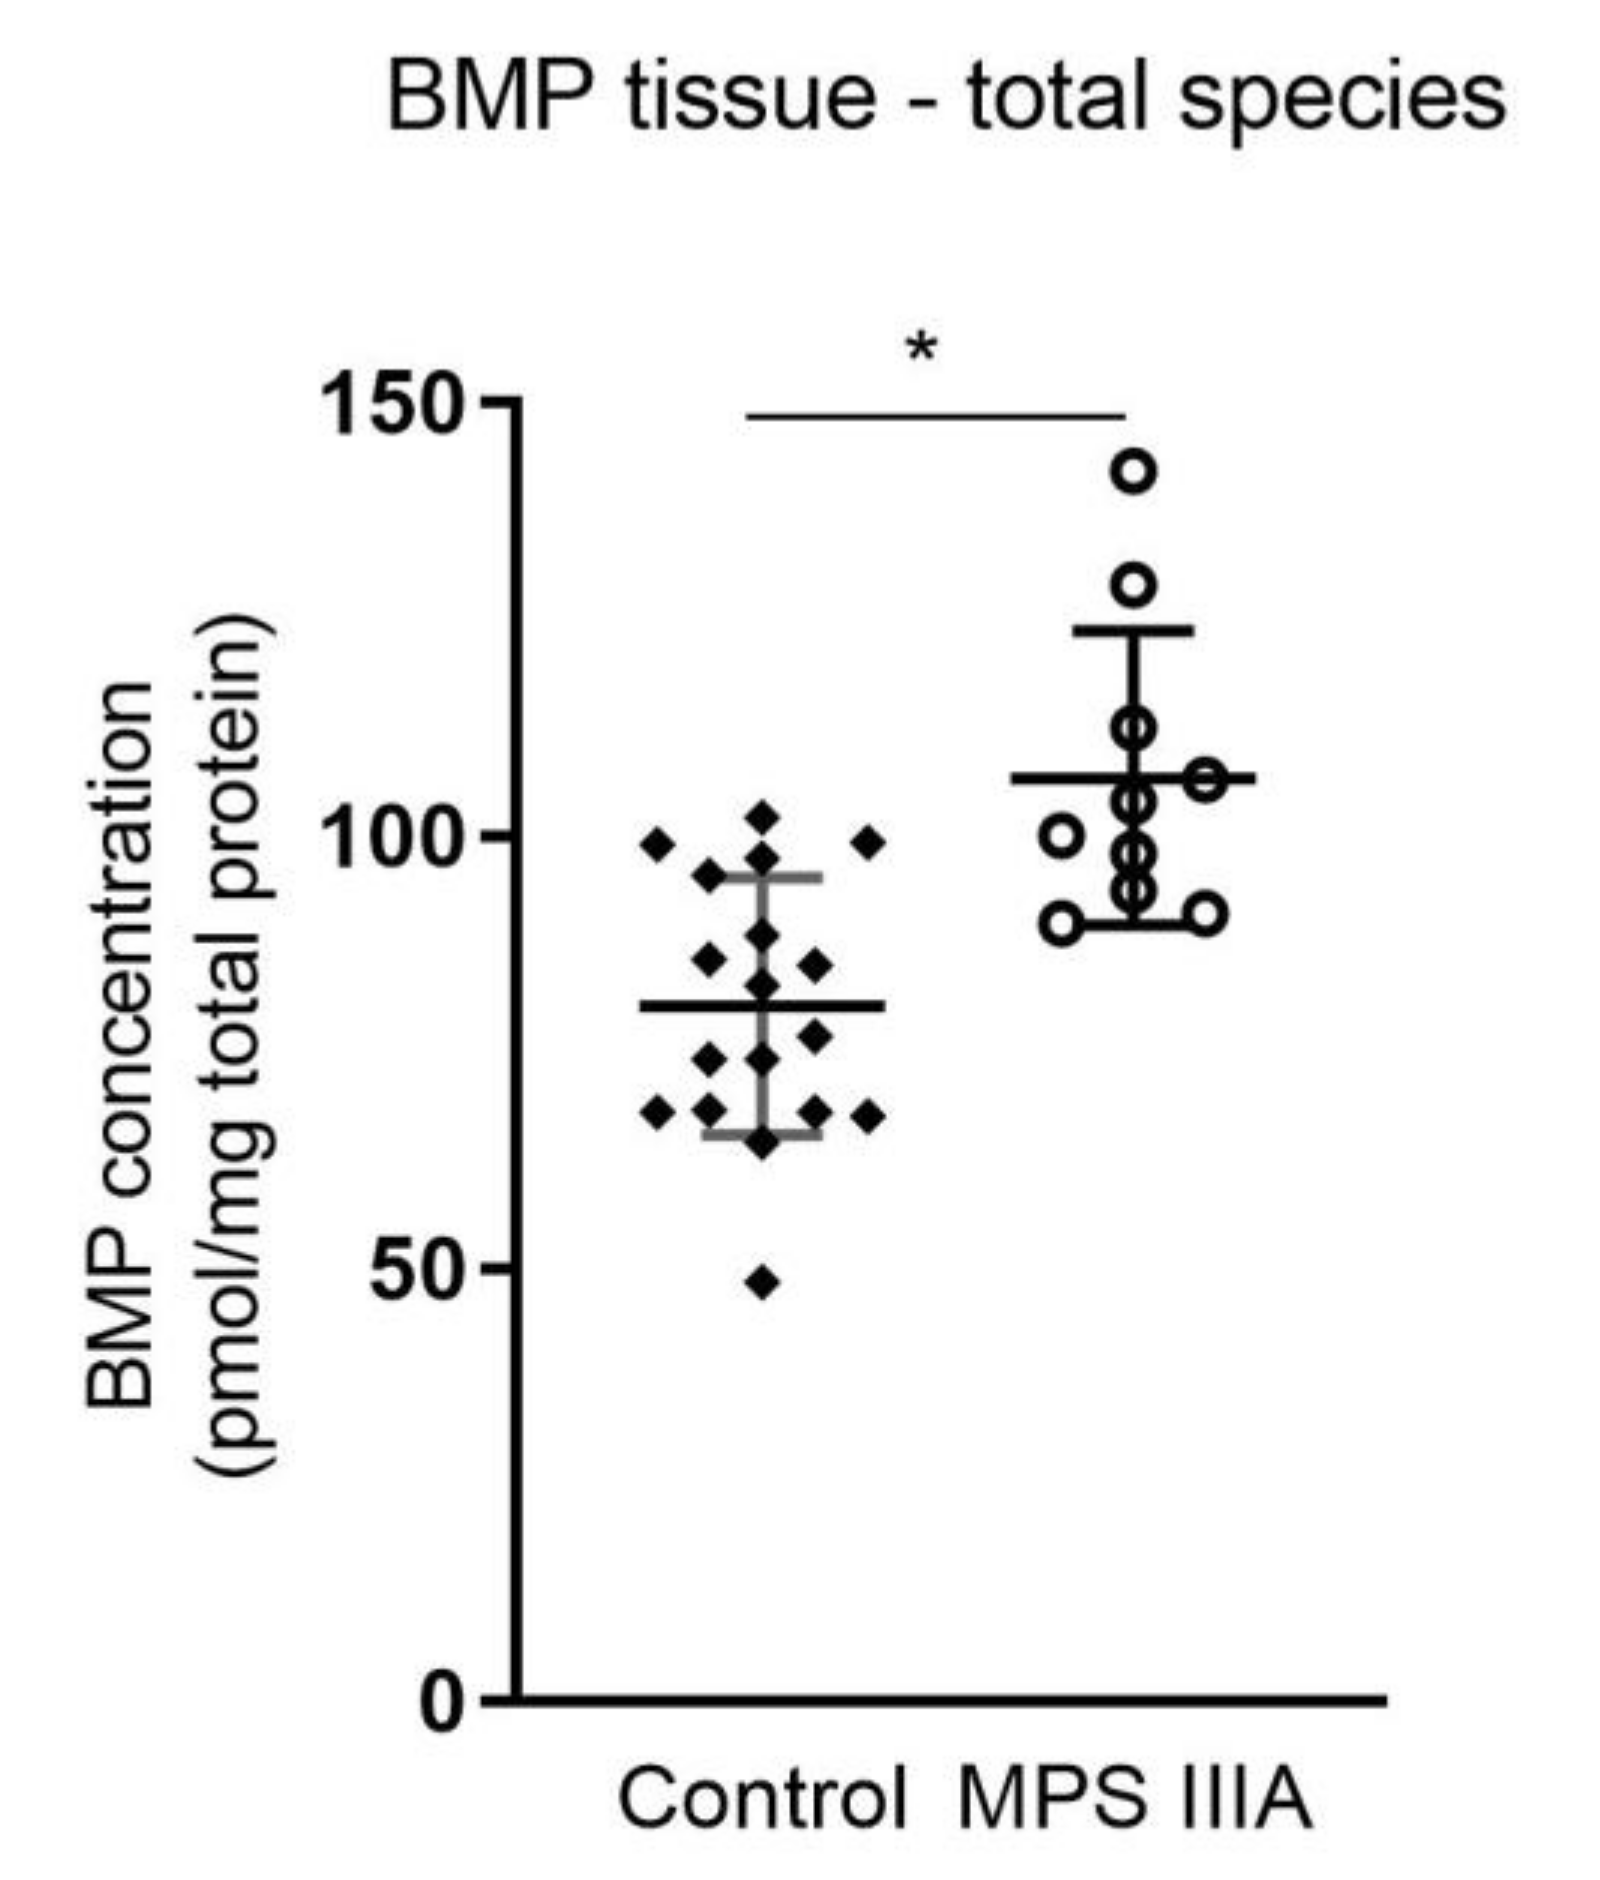
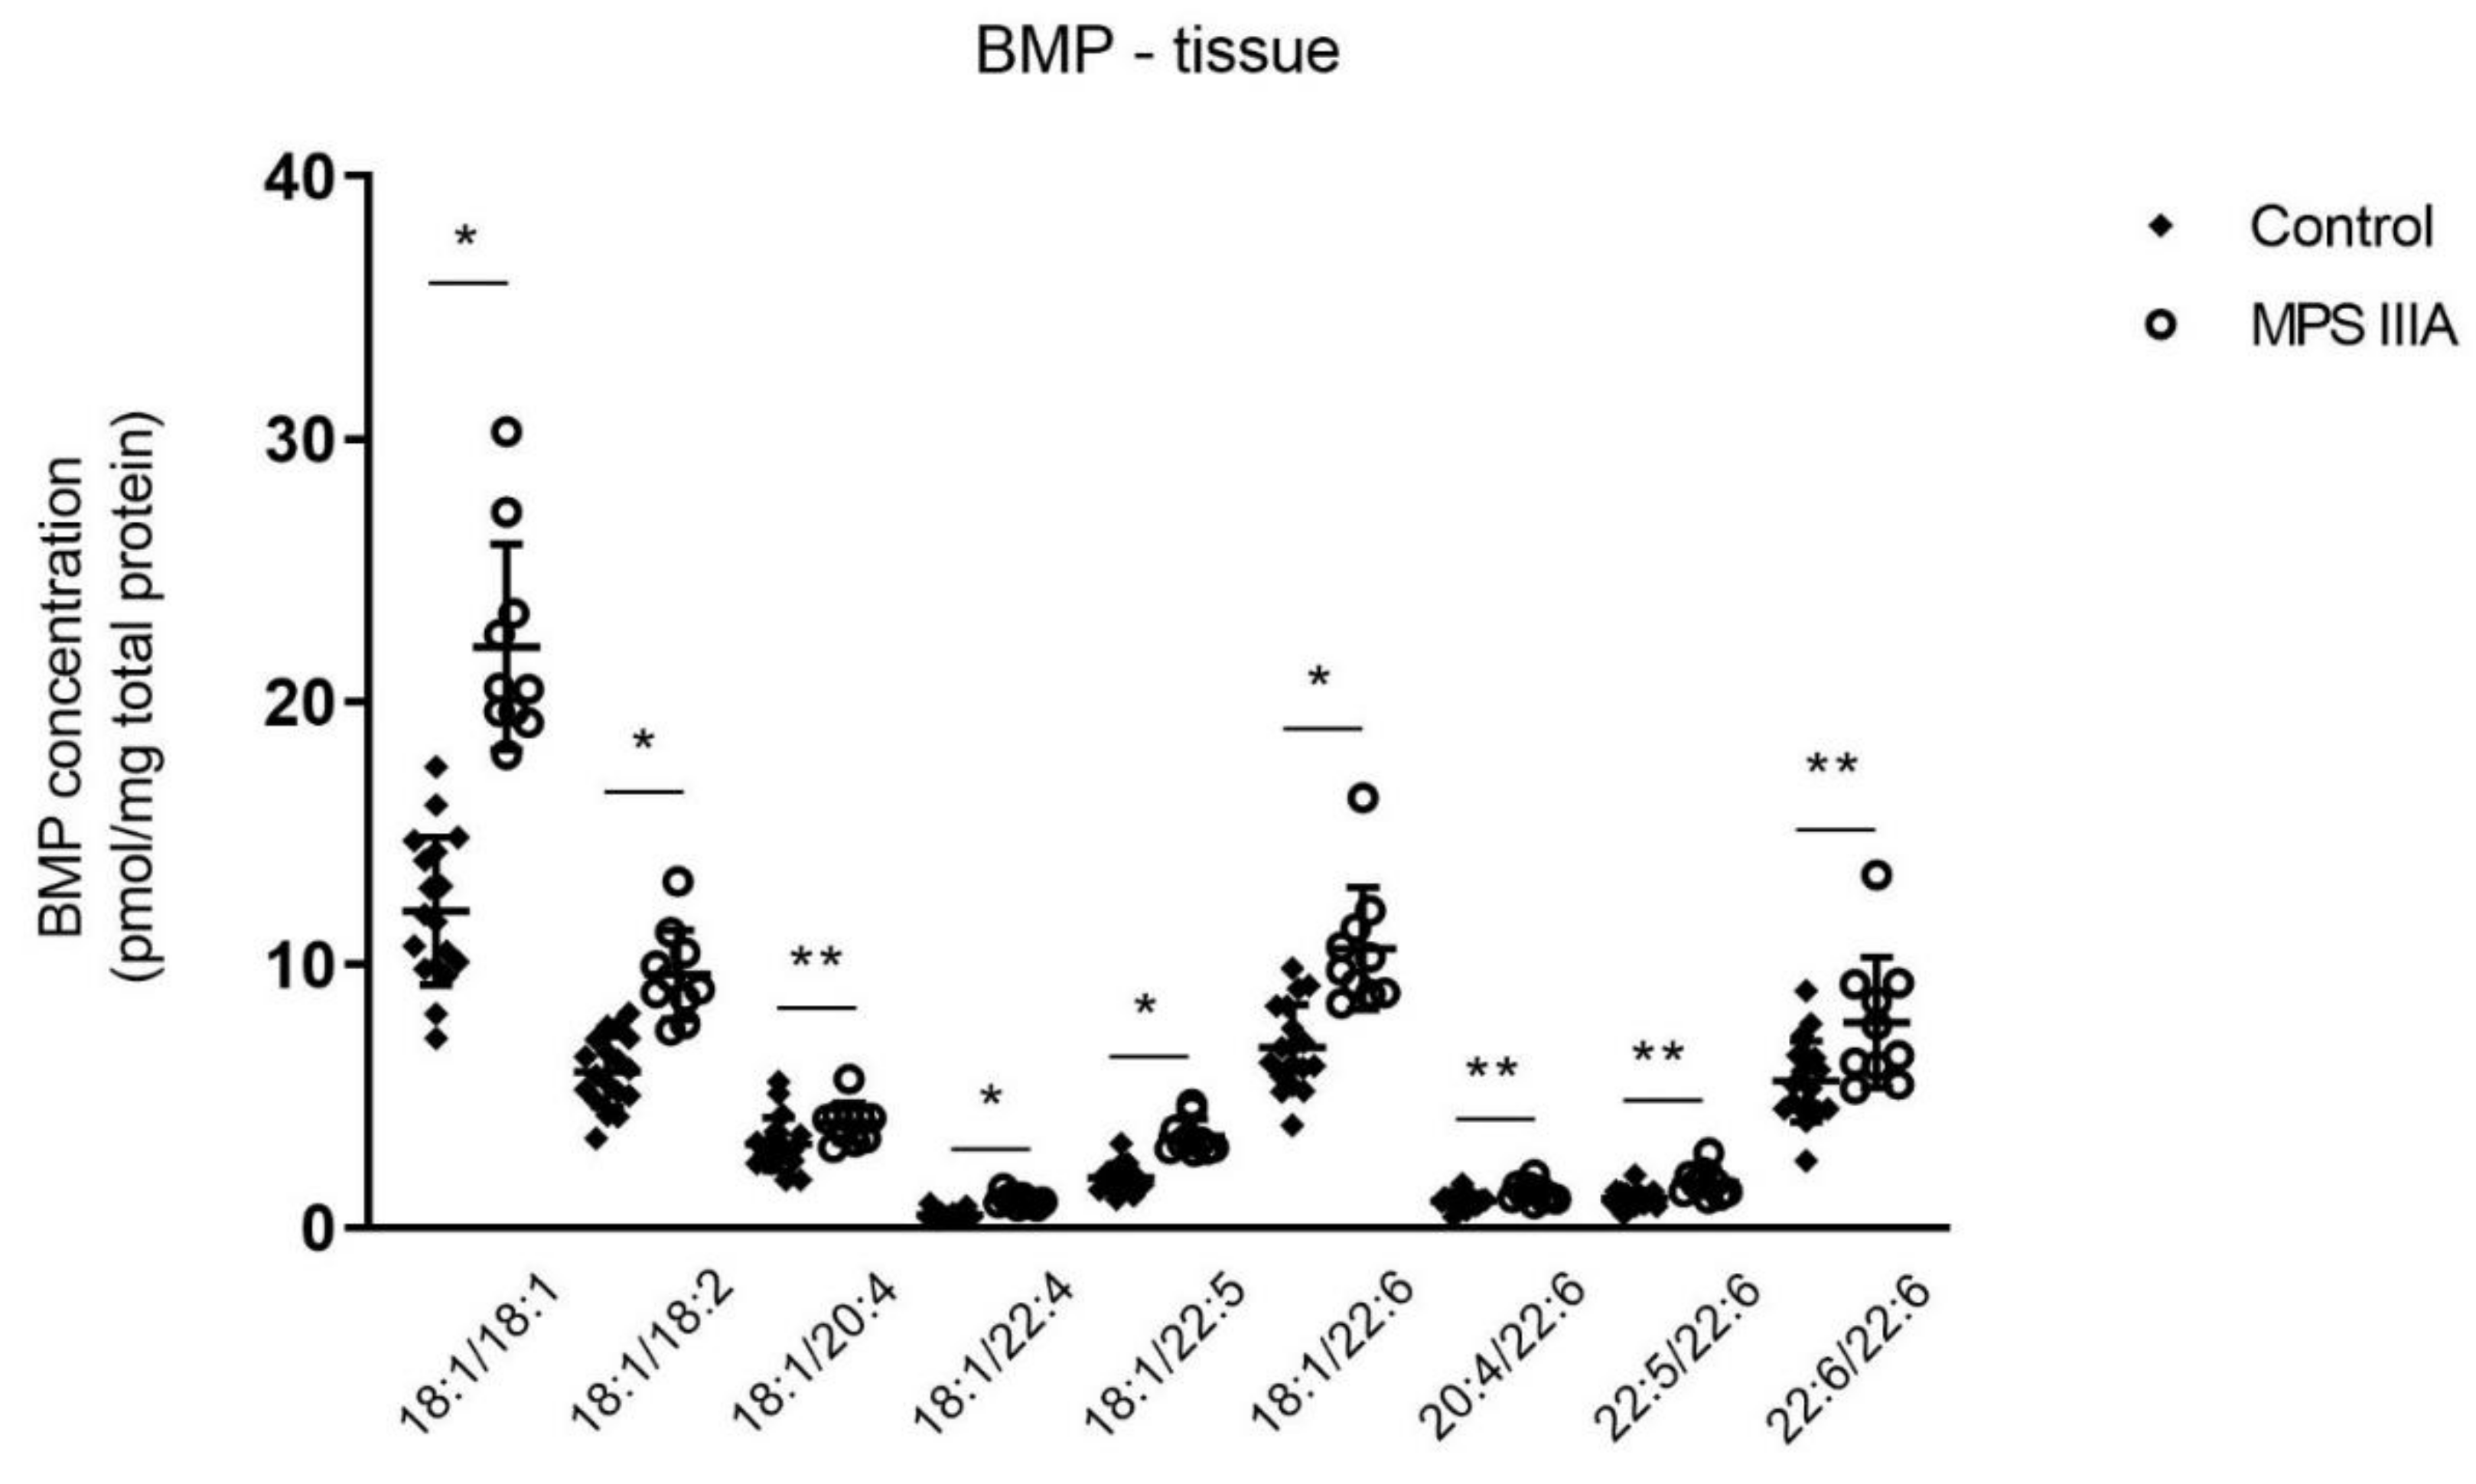
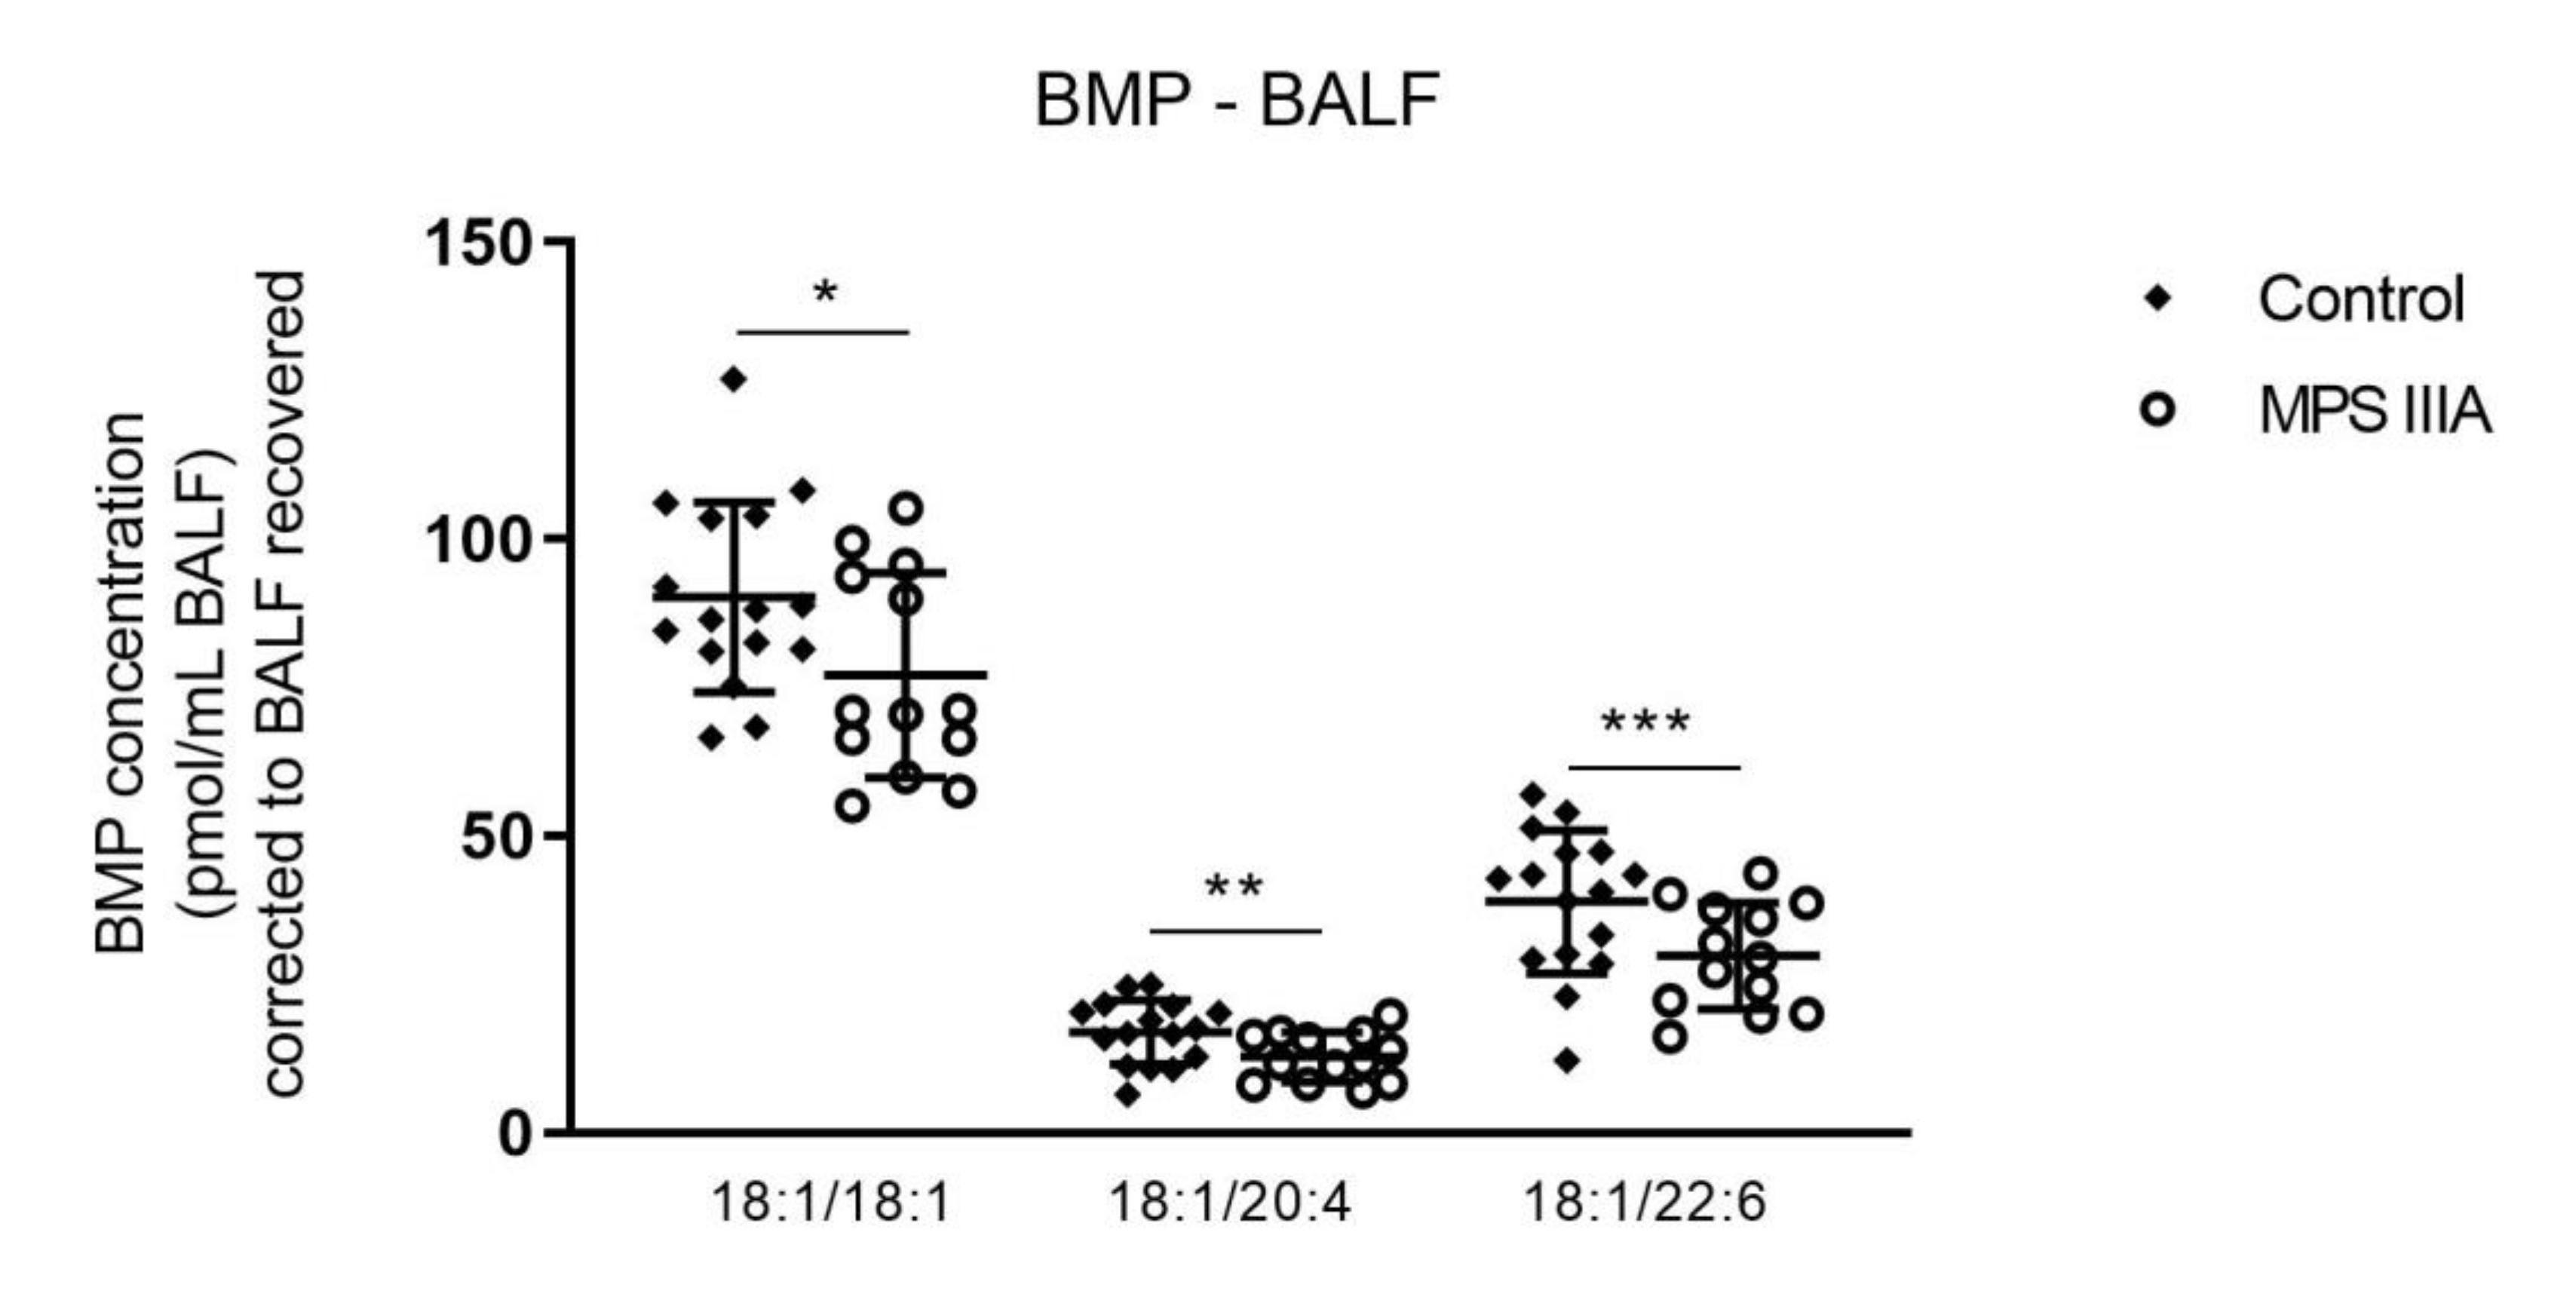
3.1.3. Alterations in Bis(Monoacylglycerol)Phosphate (BMP) Concentration in Lung Tissue and BALF

Total BMP measured in lung homogenates of 20-week old MPS IIIA mice showed a significant increase when compared to control mice (Figure 3). Further extrapolation of the data showed a significant increase in nine of sixteen molecular species (Figure 4, Supplementary Materials—Table S3).
There were no significant changes in the total amount of BMP measured in BALF of MPS IIIA mice when compared to control mice (Supplementary Materials—Table S3). However, further analysis of the subspecies of BMP showed significant decreases in three of seventeen molecular species examined when compared with control mice (Figure 5, Supplementary Materials—Table S3).

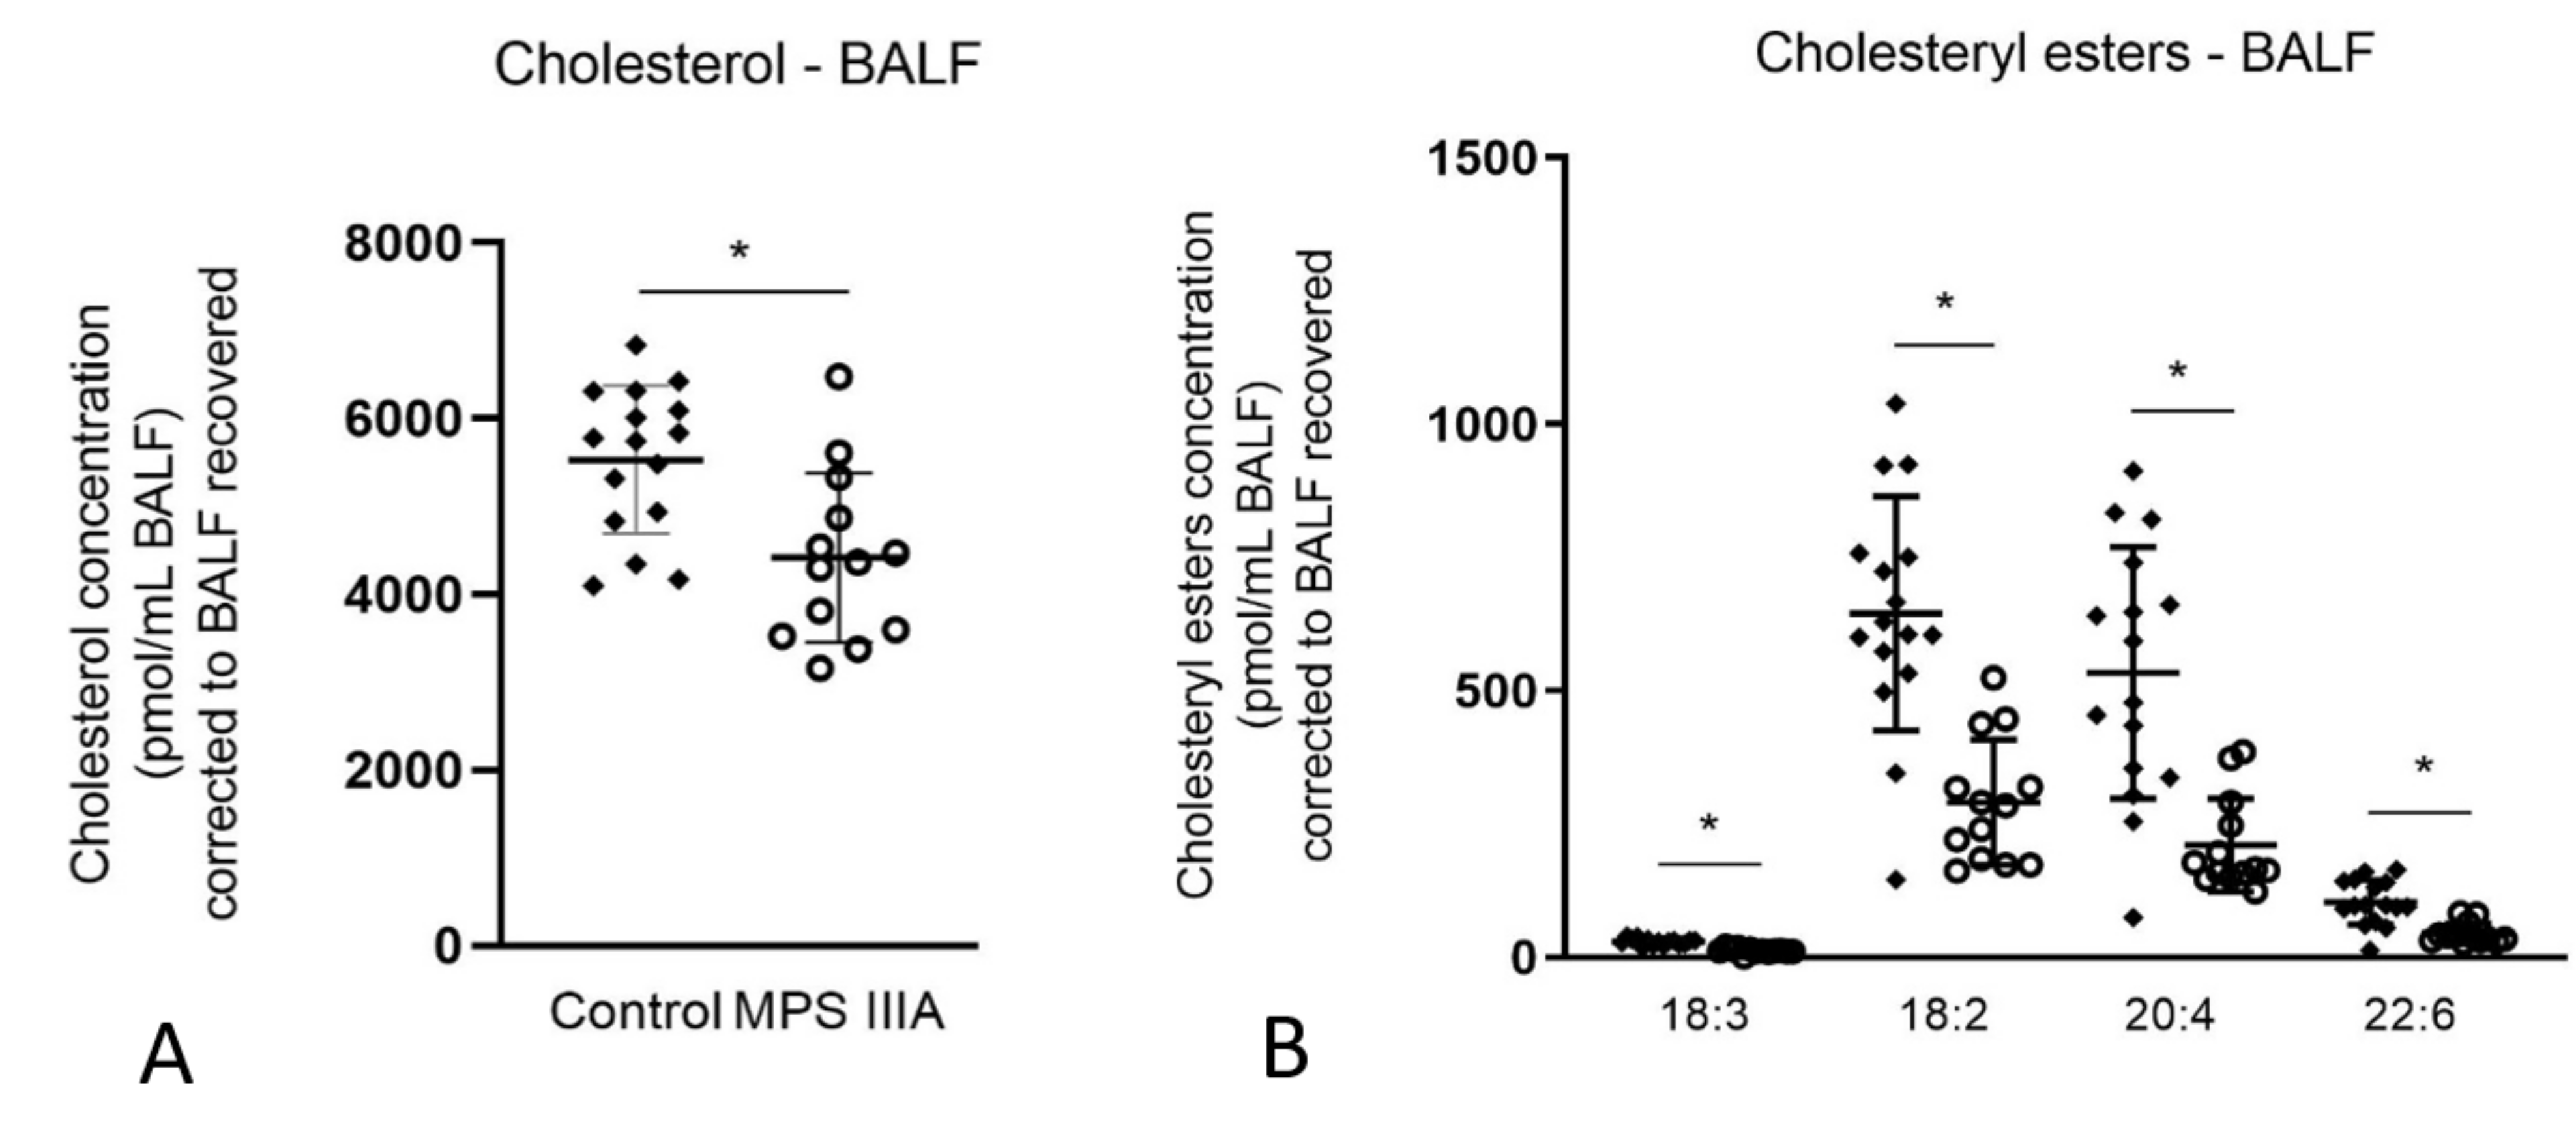
3.1.4. Alterations in Cholesterol Concentration in Lung Tissue and BALF

Total cholesterol measured in lung homogenates of MPS IIIA mice showed no significant difference when compared with control mice (Supplementary Material—Table S3). Total cholesterol measured in BALF of MPS IIIA mice showed a significant decrease when compared with control mice (Figure 6A). The decrease in BALF was further analysed, showing no difference in free cholesterol (Supplementary Materials—Table S3) and a significant decrease in cholesteryl esters in four species when compared to control mice (Figure 6B).

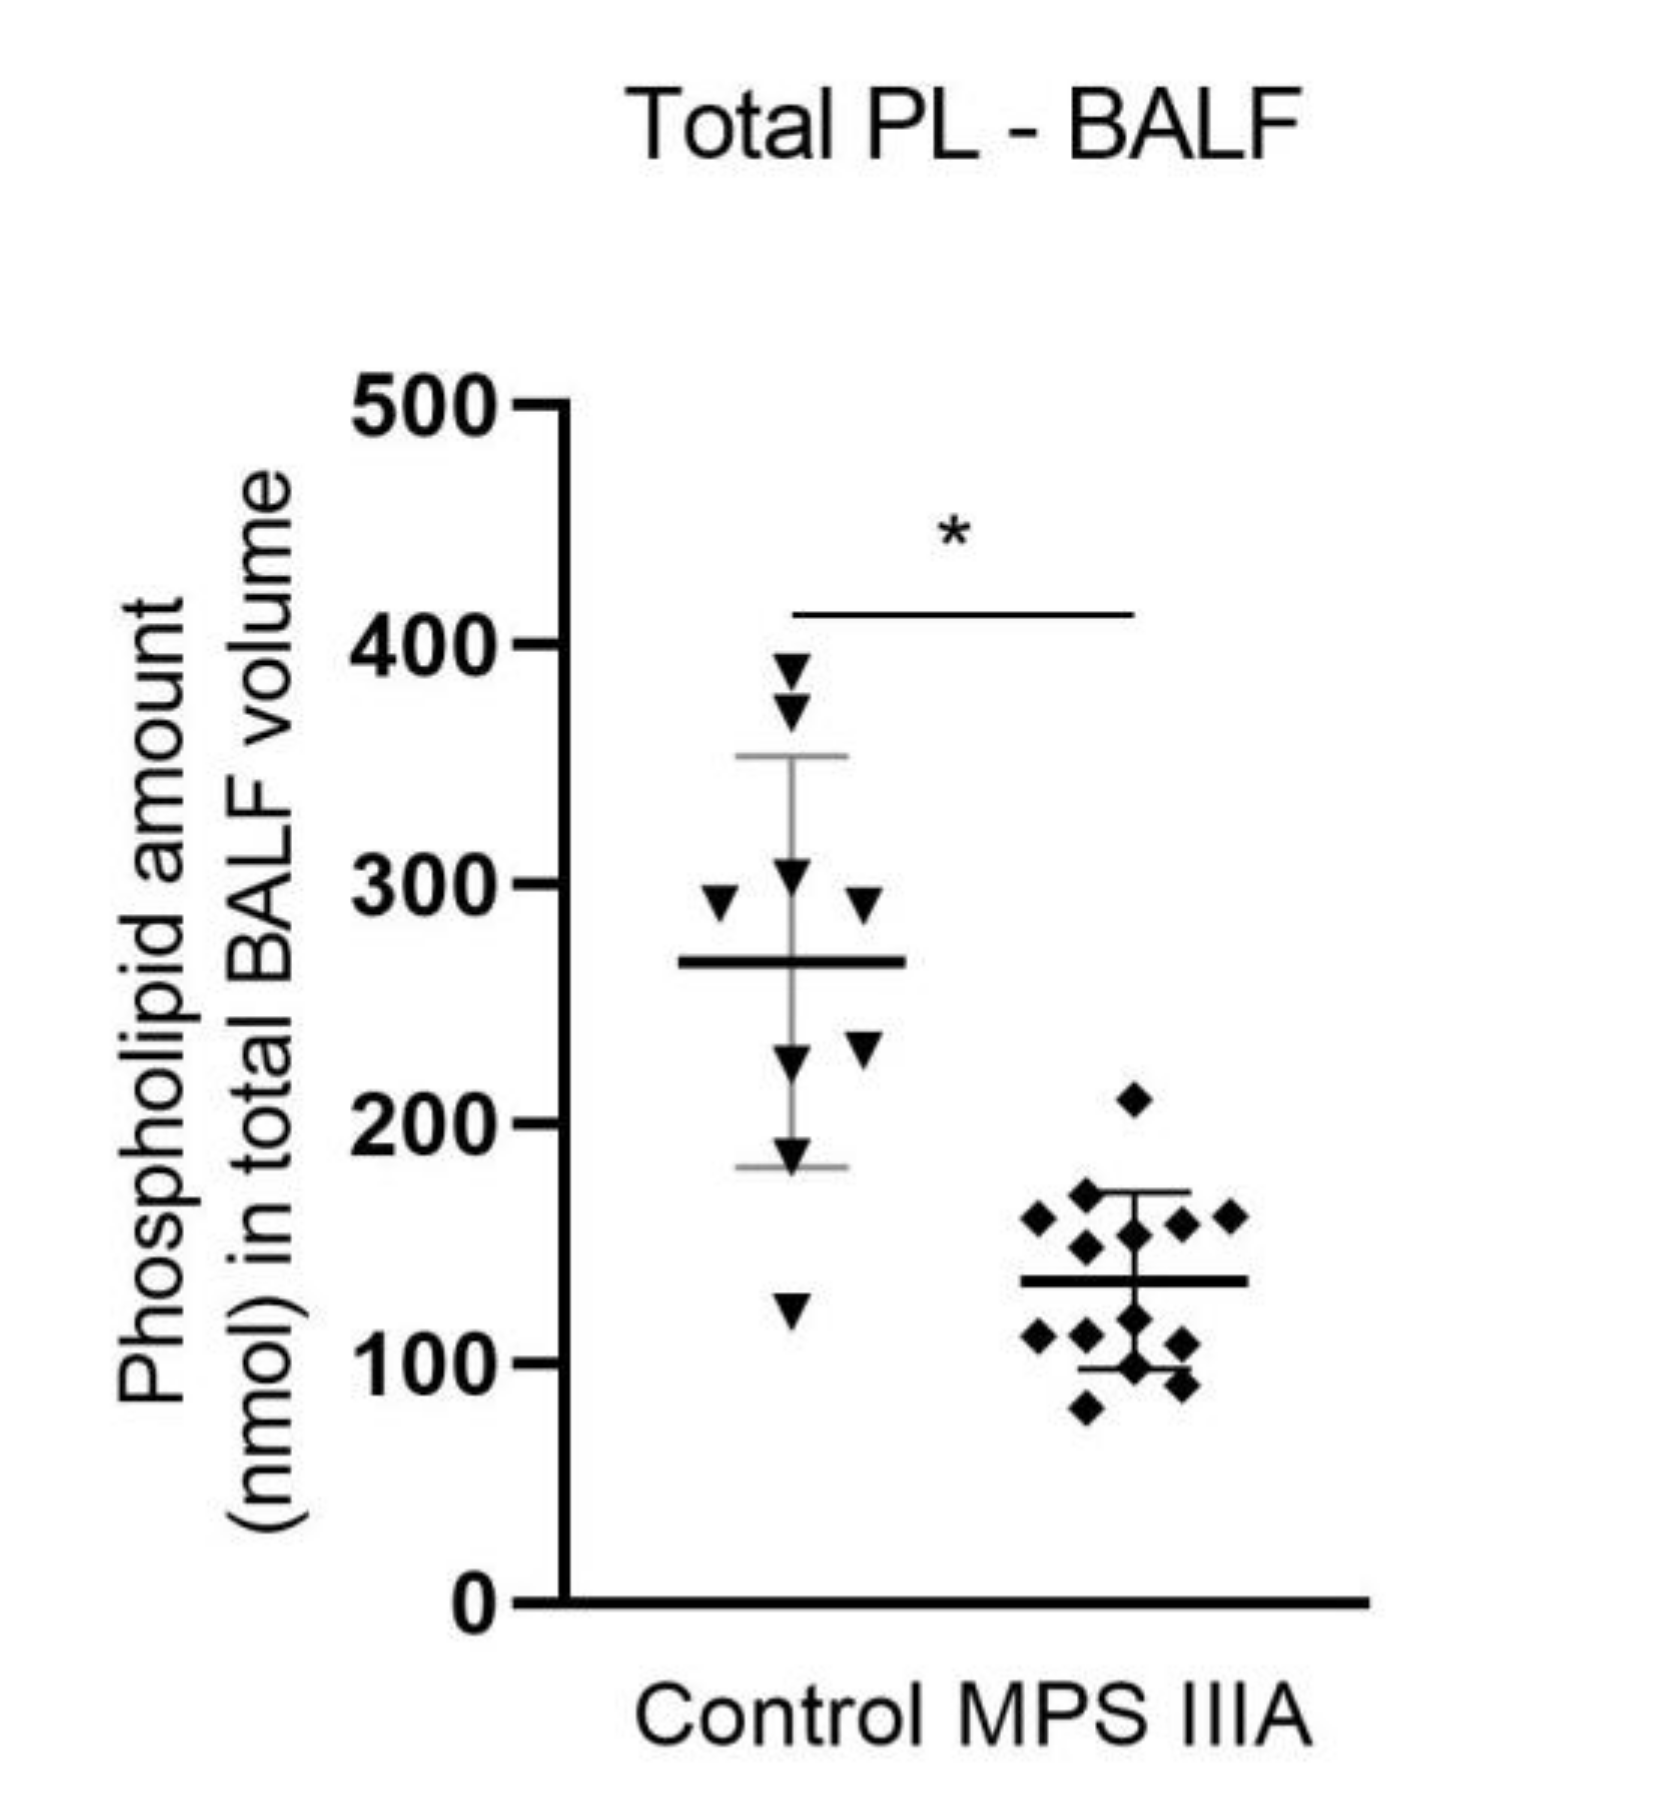
3.2. Phospholipid Composition and Alterations in Total Alveolar Phospholipid Pool Size

Individual phospholipid headgroup components were measured in control and MPS IIIA BALF. The relative percentage of the individual major phospholipids, phosphatidylcholine and phosphatidylglycerol, and the minor phospholipids, phosphatidylserine and sphingomyelin, as a percentage of the total phospholipid pool remained unchanged (Supplementary Materials—Table S3). There was a small increase in the % phosphatidylethanolamine (Supplementary Materials—Table S3). Phosphatidylcholine (PC) molecular species composition (% of total PL) was measured in BALF and lung tissue. Phosphatidylcholine molecular species composition remained unchanged in lung tissue (Supplementary Materials—Table S3); however, in BALF there was an increase and decrease in two different species, respectively (Supplementary Materials—Table S3). When all individual BALF phospholipid components were summed and expressed as nmol in the total lavage volume, there was a significant decrease of ~50% in the total pool size of alveolar surfactant in MPS IIIA mice (Figure 7).

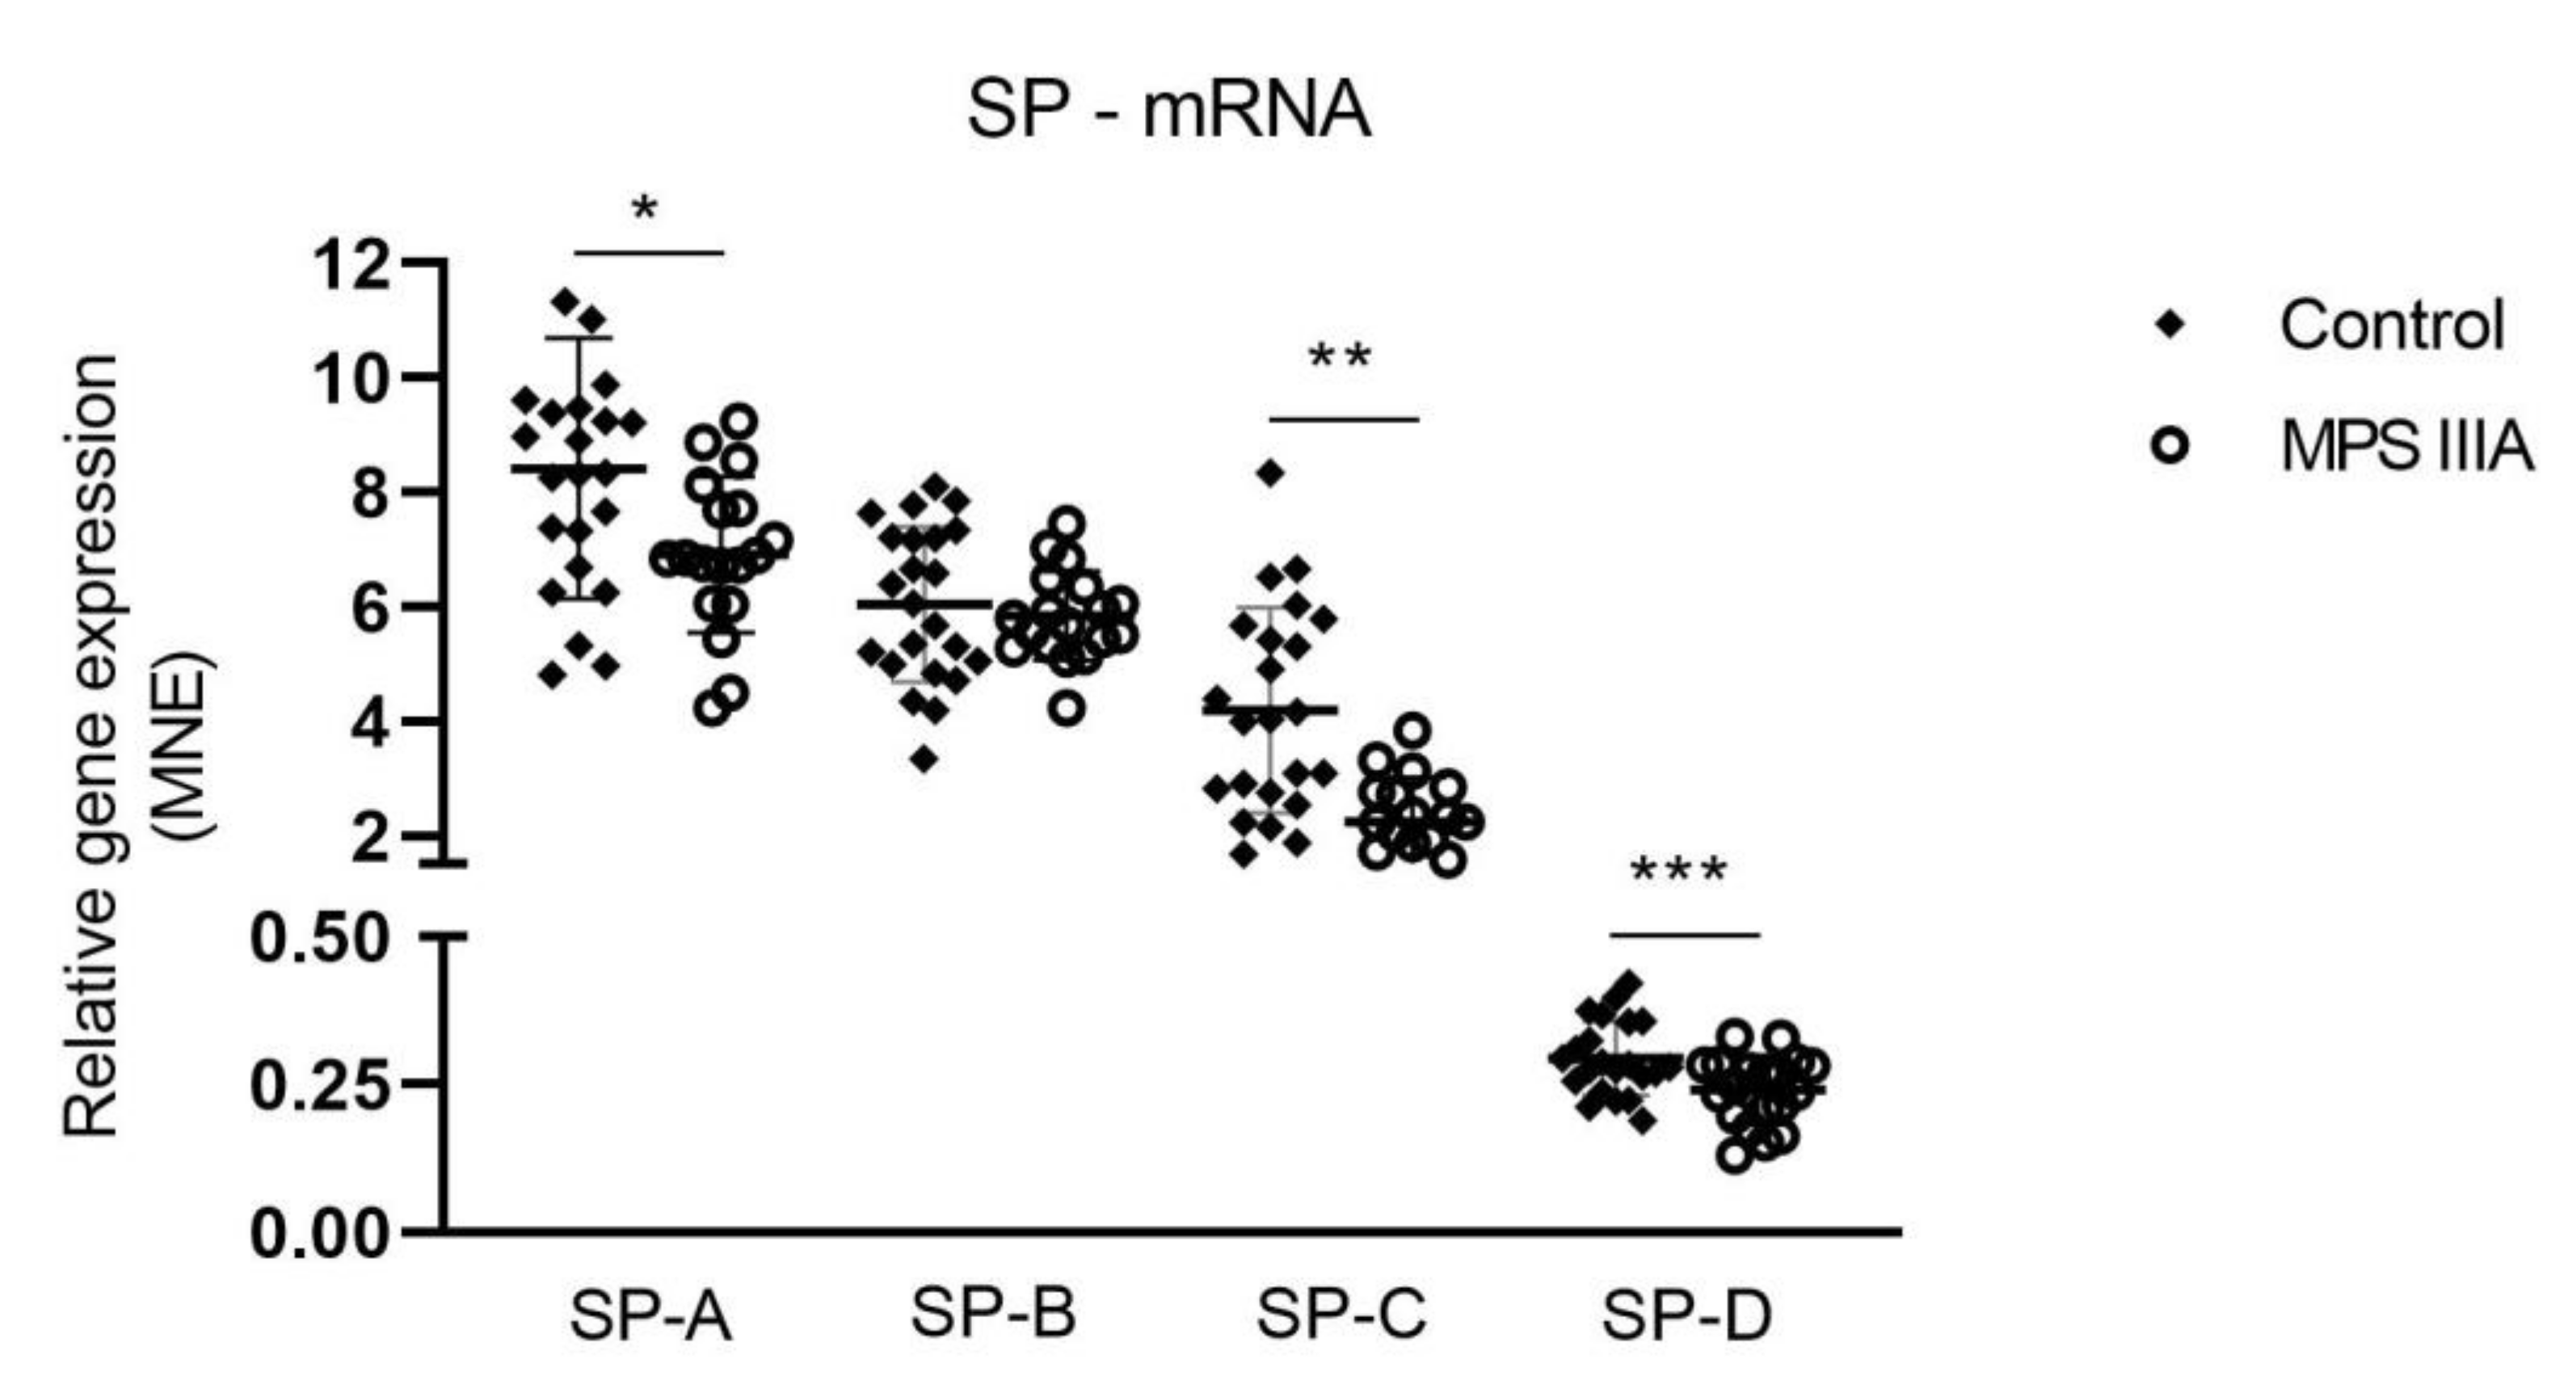
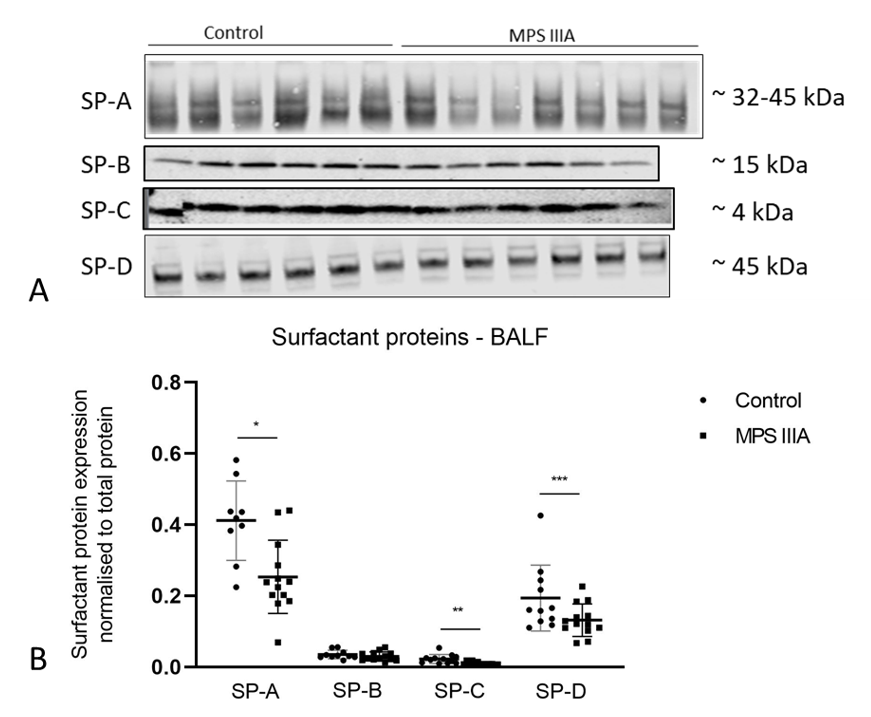
3.3. Surfactant Protein Gene Expression and Protein Analysis

There was a significant but modest decrease in the gene expression of SP-A, -C and -D in MPS IIIA lung tissue when compared to control tissue (Figure 8). A significant but modest decrease in the amount of SP-D protein was seen in MPS IIIA lung tissue but there was no change in the amount of SP-A, -B and -C (Figure 9). SP-A, -C and -D were significantly reduced in MPS IIIA BALF when compared to control BALF (Figure 10).

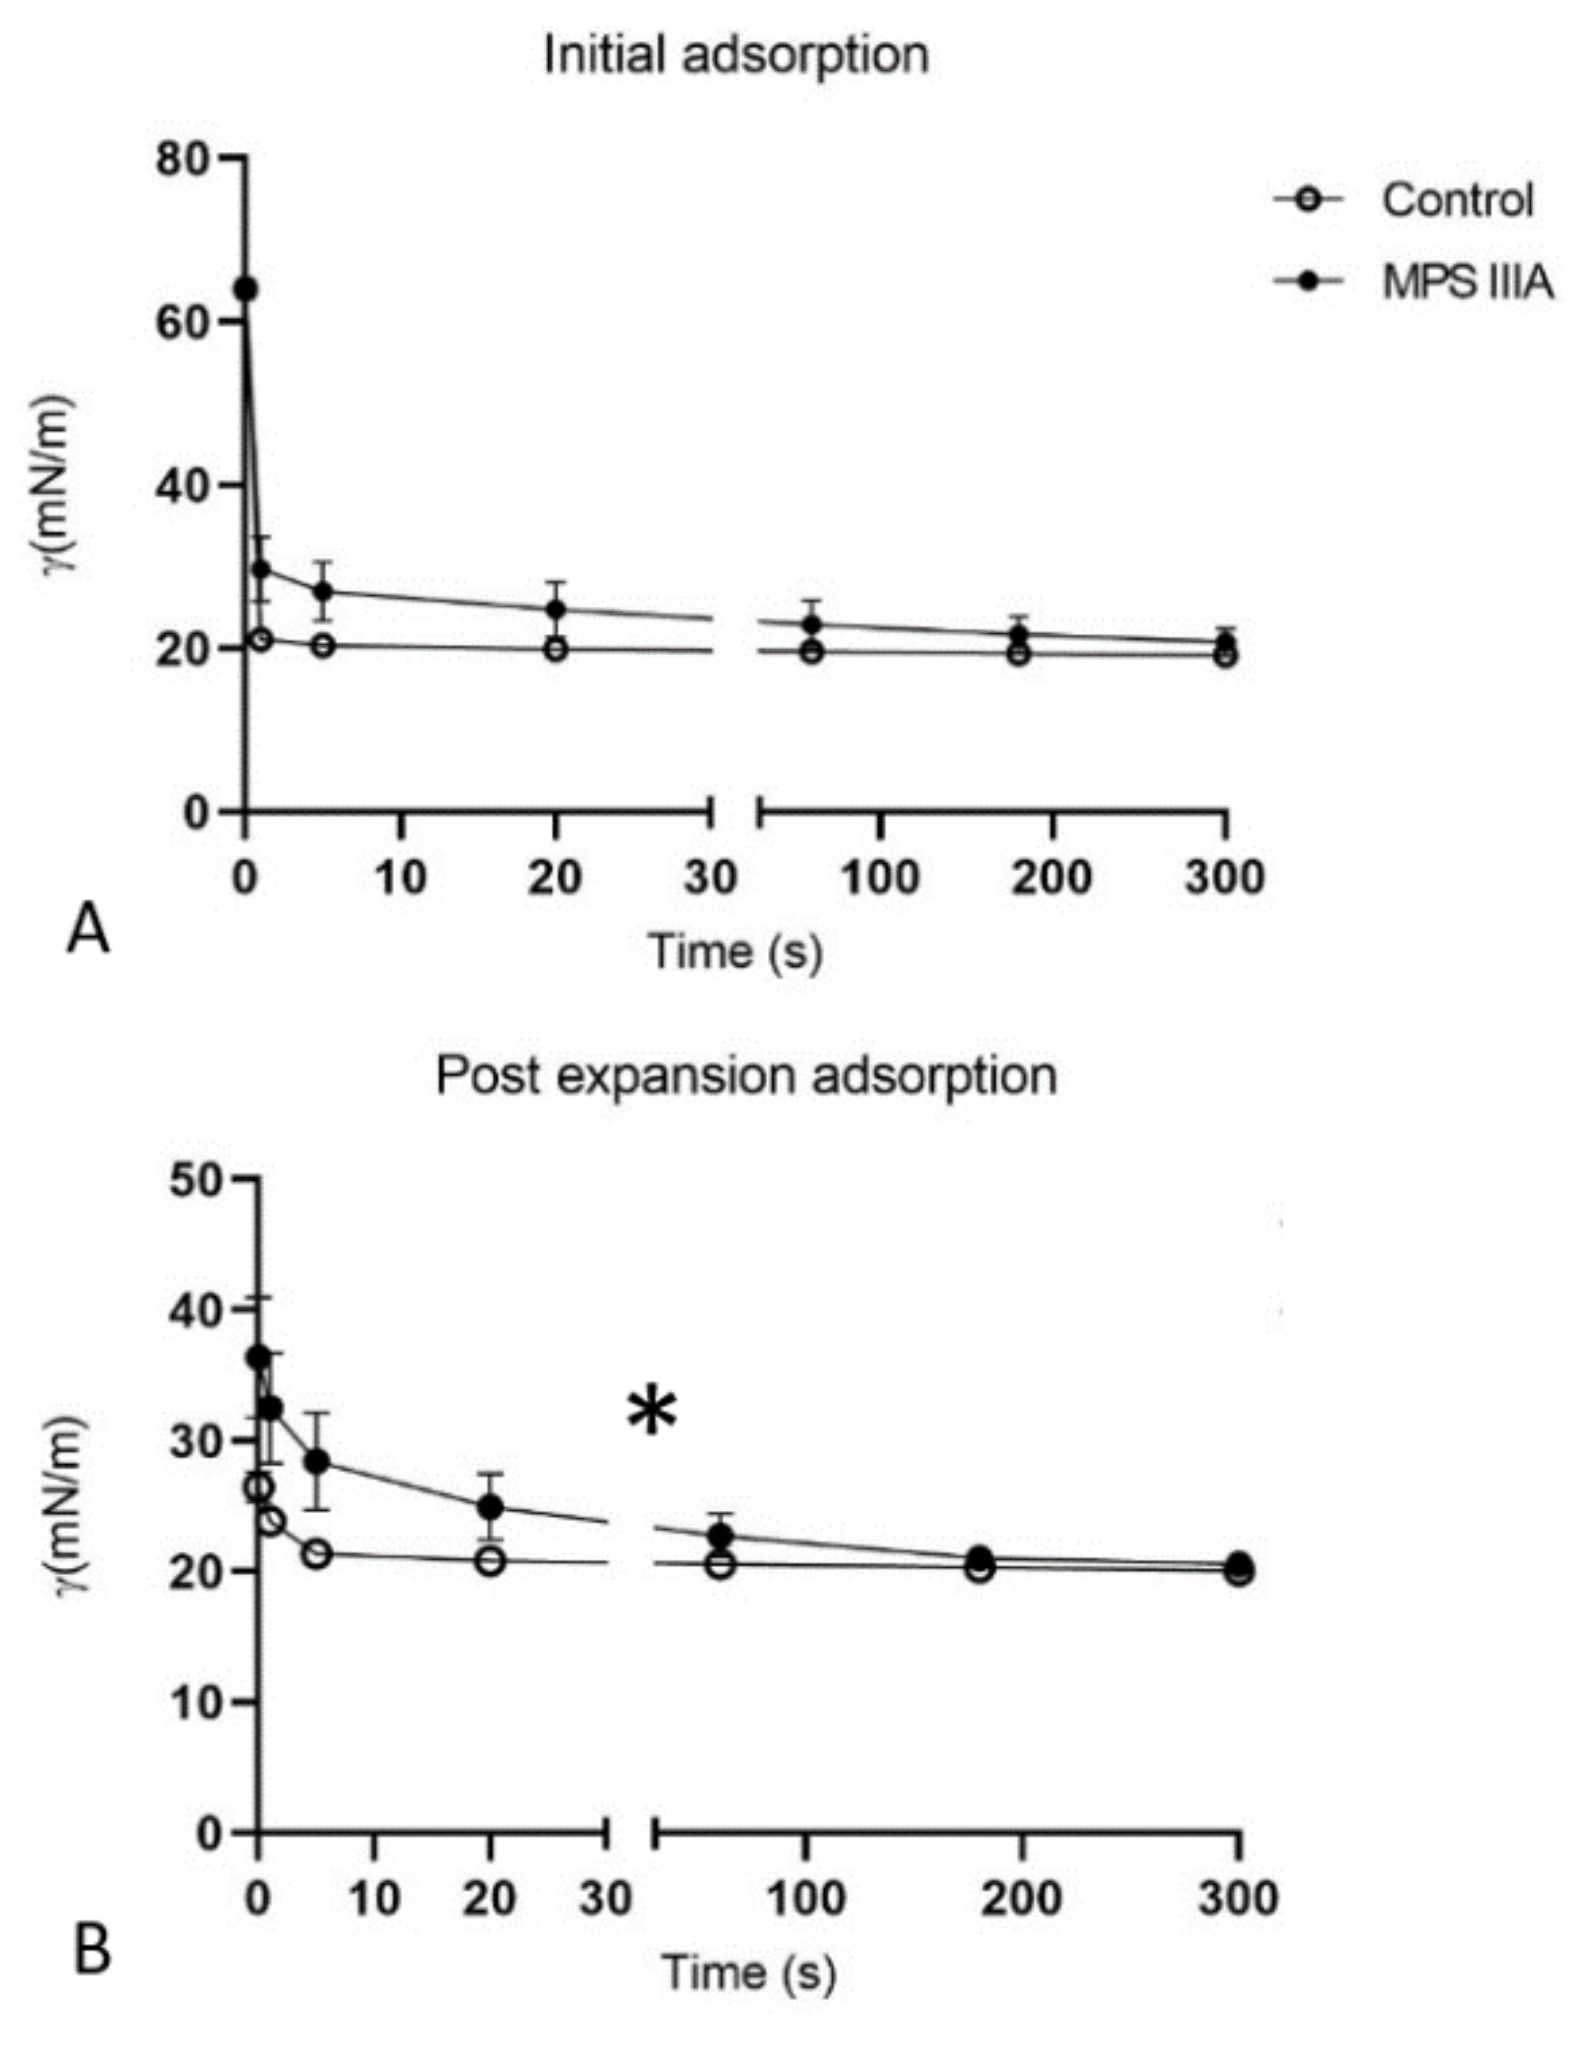
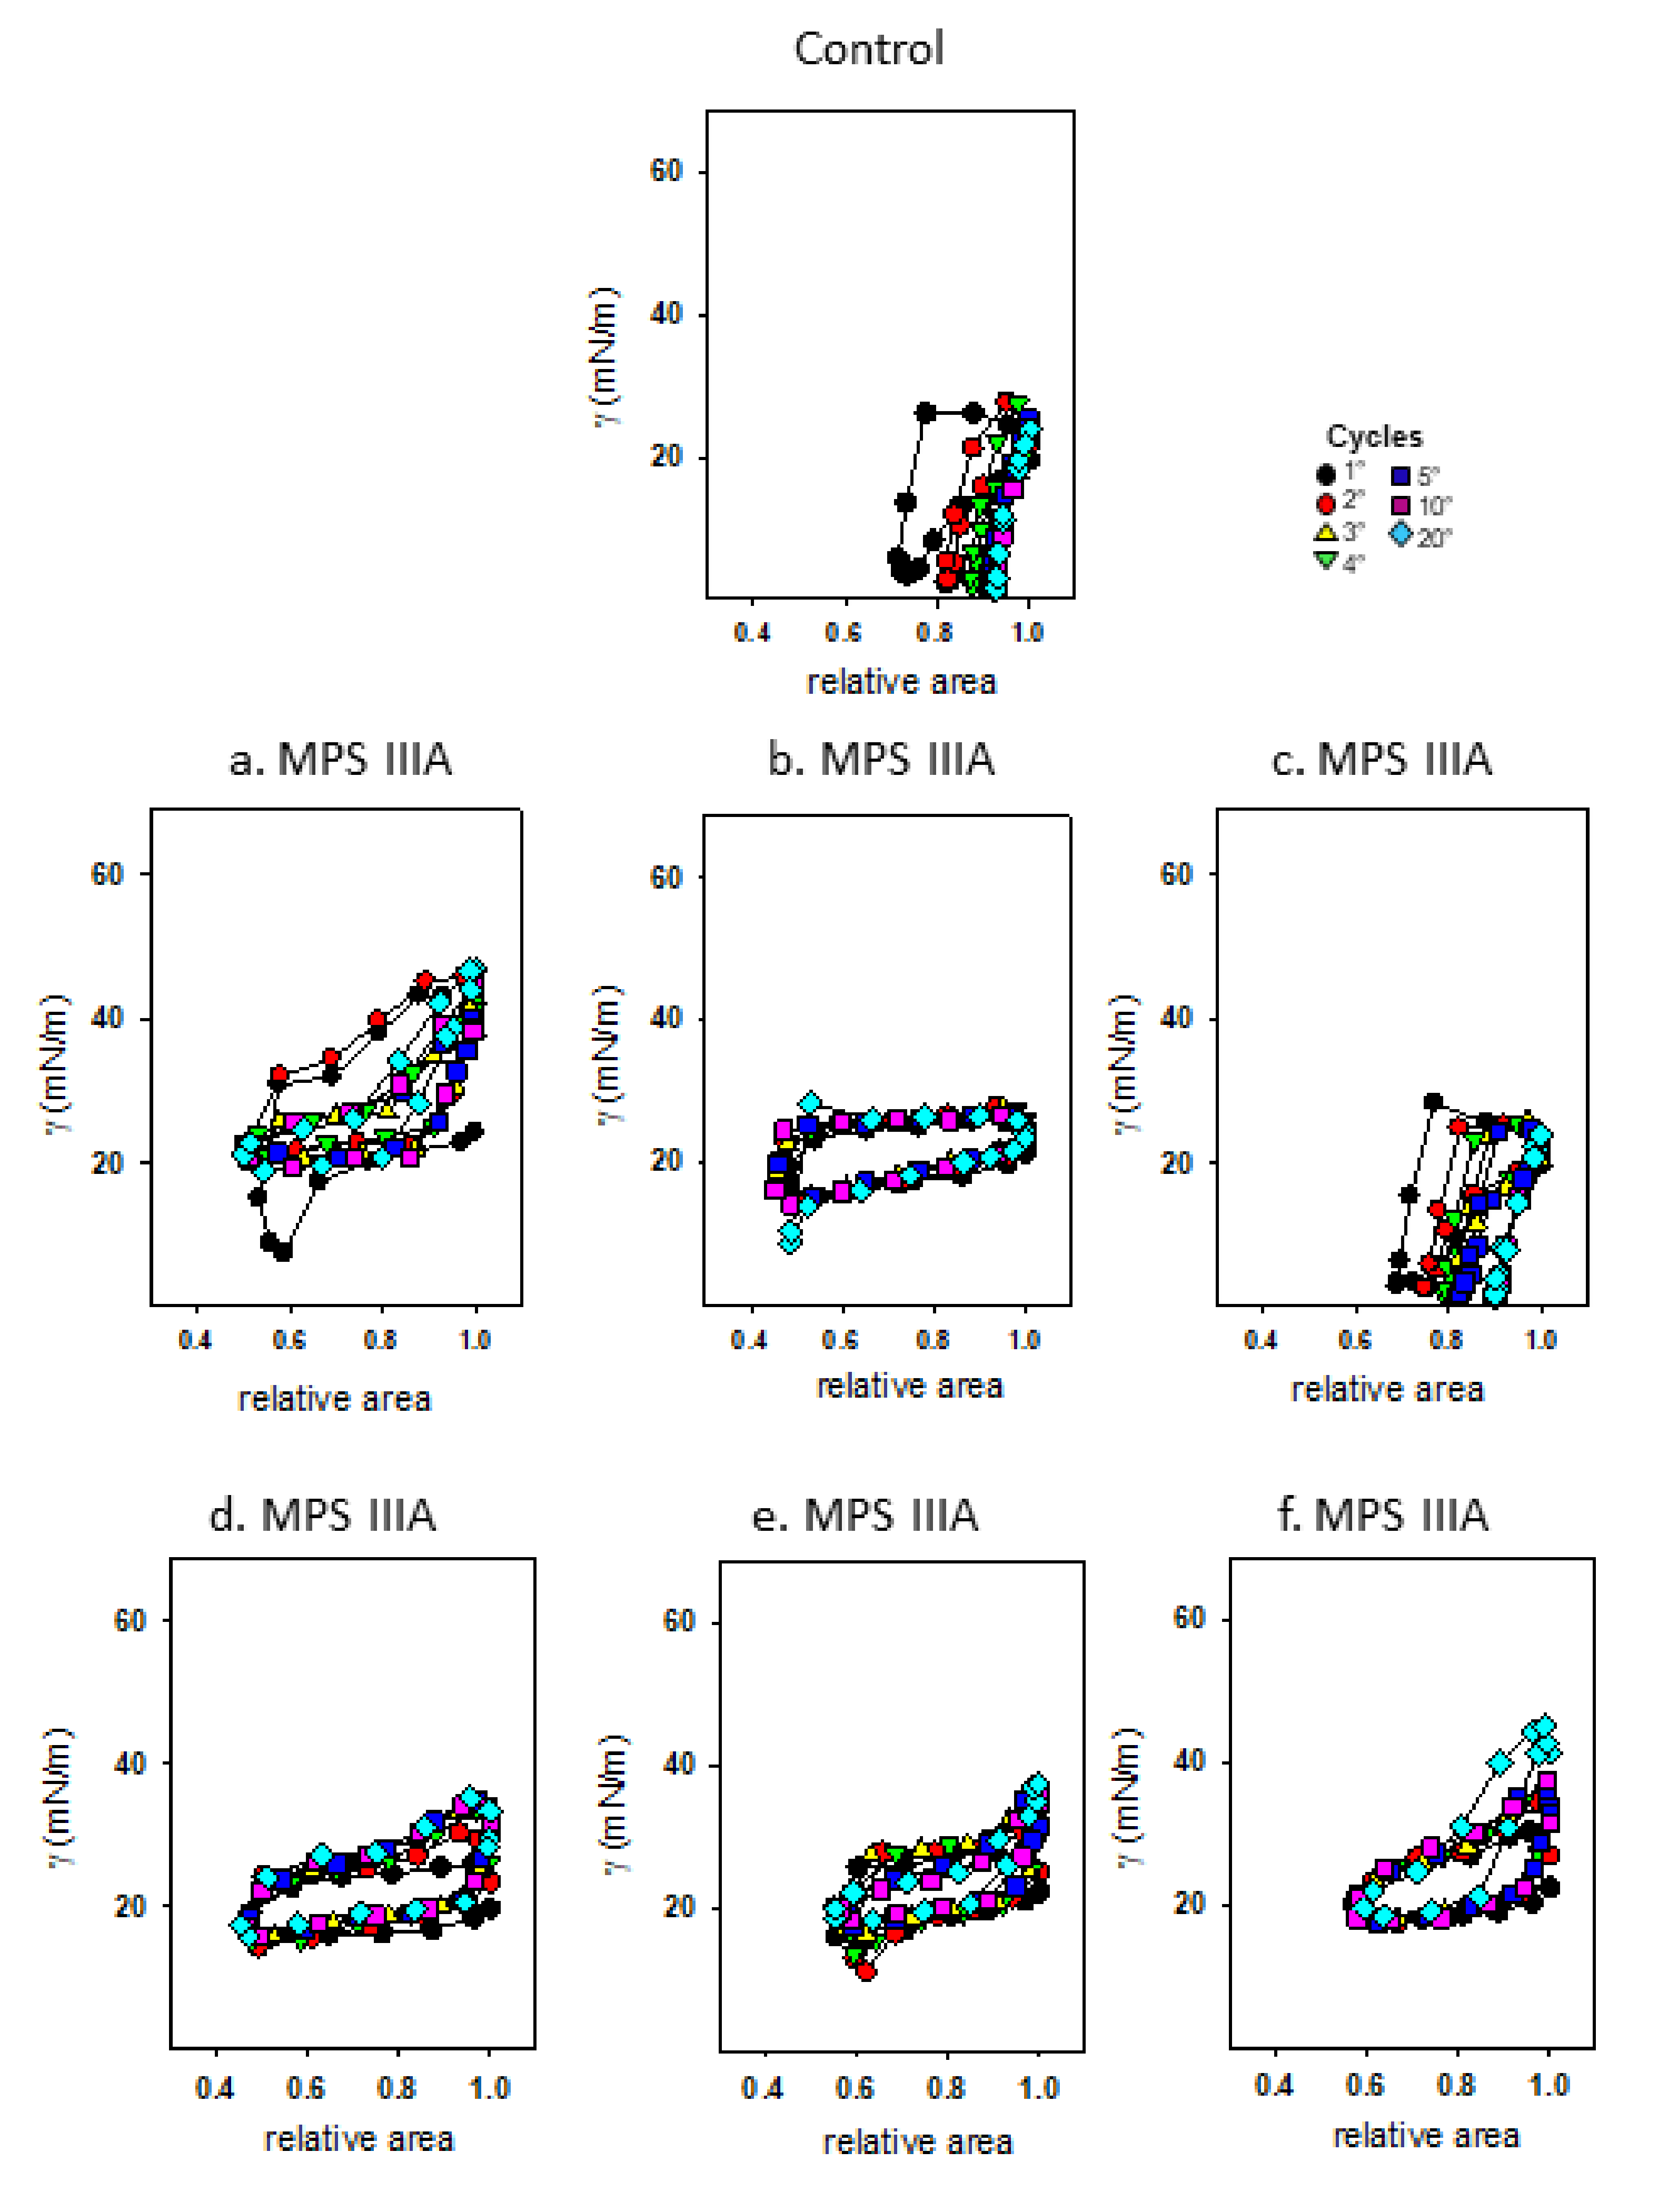
3.4. Captive Bubble Surfactometry

Captive bubble surfactometry was used to measure the rate of film formation upon initial adsorption (Figure 11A) and immediately following a sudden bubble expansion (Figure 11B), each over 5 min at 37 °C. Under these static conditions, surfactant demonstrated similar initial adsorption between control and MPS IIIA samples, lowering equilibrium surface tension (γeq) to ~20 mN/m (Figure 11A). However, surfactant from MPS IIIA animals demonstrated a decreased post expansion adsorption rate compared to surfactant from control mice (Figure 11B). Under dynamic conditions (30 cycles/min) the biophysical behaviour of MPS IIIA surfactant was highly variable (Figure 12) relative to control samples, with the surfactant of many diseased individual animals performing more poorly. Upon averaging the individual variables, it was evident that MPS IIIA surfactant was unable to reach a low surface tension at minimum bubble size (γmin) after 20 cycles (Figure 13A). Similarly, the surfactant of MPS IIIA animals also had a higher surface tension at maximum bubble size (γmax) during dynamic cycling (Figure 13B). In addition, the change in area required to reach γmin was significantly greater in MPS IIIA animals (Figure 13C). MPS IIIA samples also had higher compressibility (lower slopes) compared to control samples (Figure 13D), as well as an increased hysteresis (Figure 13E).

4. Discussion

MPS IIIA, a lysosomal storage disease with predominantly neurological pathology, is characterised by the primary storage of HS, and secondary storage of gangliosides GM2 and GM3 and cholesterol in the brain [4]. Similar changes in the lung have the potential to impair the function of the alveolar epithelium, thereby leading to changes in surfactant lipid and protein metabolism and hence the surface activity of the mixture acting at the alveolar air-liquid interface. We propose that this alveolar pathology may impact the susceptibility of MPS IIIA patients to respiratory infections and other pulmonary insults.
We reported an increase in HS in both lung tissue and alveolar surfactant of MPS IIIA mice compared with unaffected control mice. We have also found increases in ganglioside GM3 and BMP lipid species, decreases in surfactant proteins -A, -C and -D mRNA expression and a decrease in SP-D protein in lung tissue. Analysis of alveolar surfactant has shown a decrease in BMP and cholesterol and decreases in surfactant proteins -A, -C and -D. Furthermore, although there were no major changes in the phospholipid composition of alveolar surfactant, there was a 49.7% decrease in the total phospholipid pool size in the MPS IIIA mouse lung. Even though the experimental phospholipid concentration was kept constant in vitro, MPS IIIA mice also demonstrated reduced surface activity upon dynamic compression-expansion cycling. This is the first study to have demonstrated an impairment of surfactant composition and function in the mucopolysaccharidoses.

4.1. Heparan Sulphate Accumulation in Lung Tissue and the Alveolar Compartment

The many roles of HS are well defined in mammalian tissue where it is expressed ubiquitously in the extracellular matrix (ECM) and basement membrane of tissues, and on cell surfaces [36,37]. Heparan sulphate is involved in many physiological processes including cell signalling, cell adhesion, inflammation and immunity [38,39,40]. The role extends to help modulate the homeostasis of the parenchymal tissue of the lung [40,41], acting as a key structural component to maintain the efficient architecture and functioning of the lung; i.e., for alveolar walls to be thin for appropriate gas exchange, firm to prevent collapse of the alveolus, flexible to cope with volume changes during breathing [41] and as a regulator of signalling pathways [42,43]. When the breakdown of HS is compromised, as in MPS IIIA, it pre-empts major disturbances in the coordination of not only effector molecules, including growth factors and signalling factors, but extends to proteases and ECM molecules inherently impacting the structural integrity of the lung [44,45,46]. However, the effects of HS within the alveolar compartment itself have to our knowledge not previously been investigated.
The HS results in this study using butanolysis followed by LC-MS/MS [20] have shown negligible differences in HS lung tissue content between heterozygous and wild type mice, but a significant increase in MPS IIIA mice, which is similar to the results reported for MPS IIIA mice in a previous study [47]. Furthermore, we report for the first time a significant increase in the content of HS in the BALF of MPS IIIA mice when compared with that of either wild type or heterozygous mice. The presence of undegraded HS in secreted alveolar surfactant may alter or impact the distribution and function of the interfacial surfactant film components. It is possible that this excess substrate may have a similar impact as bacterial lipopolysaccharide (LPS), which is a major outer surface membrane component present in almost all Gram-negative bacteria, and that is capable of incorporating into the surfactant monolayer [48]. This destabilises the interfacial film and inactivates surfactant, therefore disrupting the ability of surfactant to regulate alveolar surface tension [48,49]. Alternatively, it may be possible that the anionic character of the HS polymer may affect the organisation of surfactant, for example by interacting with the cationic hydrophobic proteins, potentially limiting their availability to carry out their biophysical function. Certainly, our surface activity results support the suggestion that the accumulation of alveolar HS affects the organisation and/or behaviour of the surfactant film, therefore impeding its biophysical function and reducing surface activity. It is also worth considering that surfactant function can be inhibited or inactivated through the presence of other factors such as serum proteins [50], proteases, reactive oxygen and nitrogen species or as a consequence of acute lung injury or inflammation [51,52,53]. While pulmonary inflammation has not yet been investigated there is evidence of neural and systemic inflammation in MPS IIIA mice [54,55].

4.2. The Role of Pulmonary Surfactant

Pulmonary surfactant consists predominantly of phospholipids, the most abundant of which is dipalmitoylphosphatidylcholine (DPPC), other unsaturated phosphatidylcholine (PC) species, phosphatidylglycerol, phosphatidylinositol and other minor phospholipids, sphingomyelin and BMP, along with neutral lipids and cholesterol, triglycerides and free fatty acids. Together the phospholipids contribute > 90% of pulmonary surfactant composition, with the remaining approximately 8% consisting of surfactant proteins -A, -B, -C and -D [56]. Surfactant proteins -B and -C combine with phospho- and neutral lipids to provide structural integrity to the interfacial film whilst surfactant proteins -A and -D play an important role in innate immune function [57]. The unique structure of the surfactant lipo-protein film is essential to reduce the work of breathing by maintaining a sufficiently low alveolar surface tension and increasing lung compliance [49]. This lipid-rich mixture is synthesised in the alveolar epithelial type II cell and stored within lamellar bodies, which are modified lysosomes. In response to physical and chemical stimuli, lamellar bodies are exocytosed into the fluid lining of the alveoli, where they swell and unravel to form a membrane-based network from which the multi-layered pulmonary surfactant surface film is derived [58]. Regulation of the interfacial surface tension is achieved as the lipids adsorb to the air-liquid interface to form a surface-active film that lowers the surface tension. Given the biosynthetic origin of lamellar bodies, coupled with evidence of increased accumulation of HS in both tissue and BALF and of disruption to lipid synthesis leading to secondary lipid storage, we propose that there will be downstream effects on the surfactant system that may impact pulmonary surfactant function.

4.3. Alterations in Gangliosides, BMP and Cholesterol Composition

Gangliosides are acidic glycosphingolipids that contain one or more sialic acids [59] and are primarily regarded as neuronal material, with previous studies having shown an elevation of the gangliosides GM2 and GM3 in the brain of MPS IIIA mice [60] and very low expression in the healthy adult lung [61]. In mouse neuronal tissue GM3 appears to be co-localised with cholesterol and other glycosphingolipids in specialised lipid rafts [62,63]. For example, GM3 inhibits EGFR-tyrosine kinase to differing degrees depending on its sialic acid species. GM2 was below the level of quantitation in mouse lung tissue in this study, which is consistent with the findings of a recent mouse lung lipidomics study [61]. A significant increase in two of the subspecies of GM3 in MPS IIIA mouse lung tissue was recorded when compared with the control group. As well as being involved in the regulation of numerous cell biological events, including development, trafficking, signalling and cellular interactions, GM3 performs an anti-inflammation role. Studies of GM3 deficient mice reveal an exacerbation in inflammatory pathways in rheumatoid arthritis [63,64]. Gaucher disease is associated with increased insulin resistance and has evidence of increased GM3 concentrations in human plasma, although it is unknown if GM3 has any direct effect on inflammatory pathways in this disease [65,66,67]. There is also evidence of elevated levels of GM3 in mouse cerebellar brain cells in juvenile neuronal ceroid lipofuscinosis but the effect of this has not been determined [65]. There has been no evidence to suggest that GM3 in the lung is affected in either disease. The precise role of GM3 in lung tissue remains largely unknown [61].
The specific function of BMP in the lung is also largely unknown. However, in general it plays a significant role in cholesterol distribution [68,69] through the formation of lipid rafts, cell signalling and multivesicular body and small vesicle formation [70,71] in the late endosome-lysosome compartments of the cell. It is a structural isomer of phosphatidylglycerol and is most abundant in the endosome-lysosome system of the cell and generally localised to the membranes of multivesicular bodies [72]. BMP is negatively charged, facilitating the adhesion of soluble positively charged hydrolases and activator proteins, allowing them to degrade substrates at the inner membranes of the lysosome [72]. Thus, BMP has an important role in the regulation of lipid and membrane dynamics in the endosome-lysosome system and an excess of BMP may impair the sorting and dissociation of lysosomal hydrolase complex which affects downstream degradation processes [73]. We have reported for the first time an accumulation of BMP in MPS IIIA lung tissue, and a significant decrease in some BMP species within the alveolar compartment. The implications of the decrease in BMP and its function in surfactant are not entirely known, but our surface activity results suggest that the fluidity of the pulmonary surfactant film may be affected, potentially impairing normal function.
Cholesterol is an essential component of all cell membranes of all tissues, including lung tissue, and a critical modulator of pulmonary surfactant [72,74]. In combination with surfactant proteins -B and -C, cholesterol is embedded into the lipid bilayers of pulmonary surfactant thereby increasing the viscosity of the membrane [75], enabling pulmonary surfactant to reduce the work of breathing by stabilising alveolar surface tension and increasing lung compliance. Fluidity and viscosity must adjust rapidly in response to inspiration and expiration, relying on the properties of cholesterol to optimise the ordered surfactant film to recover quickly from disruption [75,76,77]. Without cholesterol, the lipid bilayer of pulmonary surfactant is disordered and results in compromised surface tension increasing the work of breathing [76,77]. Cholesterol levels are tightly regulated by transcriptional regulation of cholesterol biosynthesis and cellular uptake as well as by deposition of cholesterol into fat droplets in an esterified form; a type of storage [78]. We have found a significant decrease in total cholesterol in MPS IIIA BALF when compared with control samples. Interestingly, this was driven by a significant decrease in cholesteryl esters (CE) as there was no change in free cholesterol. Cholesteryl esters consist of a free cholesterol unit covalently linked to a long chain fatty acid rendering them more hydrophobic than free cholesterol. They reside in the surface-associated surfactant reservoir to be hydrolysed to enable adsorption of cholesterol to the surface-active layer [79,80]. Therefore, the reduction in CE may reduce the effectiveness of pulmonary surfactant, as well as affecting the availability for recruitment and distribution of free cholesterol into the film. A physiological level of cholesterol is required to promote the optimal level of adsorption of surfactant as both an overabundance and a reduction of cholesterol can inhibit surfactant adsorption [81]. The potential reduction in cholesterol availability suggested by our study may be reflected in the impaired surface activity we observed.

4.4. Total Alveolar Phospholipid Pool

For the pulmonary surfactant film to decrease surface tension it must be packed efficiently and maintain interfacial integrity so that during expiration the film is compressed to reduce surface tension to close to 0 mN/m. During inspiration and expansion the surface-active film recruits additional surface-active molecules from the aqueous hypophase [56,82]. The phospholipid pool must have a high turnover to maintain its size and quality as it is decreased by the degradation, oxidation and recycling at the air-liquid interface and refreshed by the secretion of surfactant stored in lamellar bodies [83]. The process of fusion of the lamellar bodies with the cell membrane, exocytosis of surfactant and formation of the surfactant film is a fundamental and lengthy process (seconds to minutes) when compared with endocytic functioning in other cells (milliseconds) [84,85]. Hence, a substantial phospholipid pool size and high turnover are essential to maintain the integrity of the surfactant film during the dynamic breathing process. A significant ~50% reduction in the total phospholipid pool was evident in MPS IIIA BALF when compared to control BALF. The surfactant proteins aid in the regulation of phospholipid pool size. Surfactant protein -A and -C promote the movement of surfactant phospholipids to the surfactant film [86,87], while surfactant proteins -B and -D have significant roles in maintaining surfactant pool sizes, with SP-D deficient mice demonstrating altered surfactant morphology [88,89,90,91,92,93]. The decrease in the phospholipid pool in MPS IIIA mice described here may have a significant impact on the function of pulmonary surfactant. Specifically, the phospholipid pool reduction may be detrimental to film integrity, and there may be further impairments to the film coupled with the reductions of the surfactant proteins compromising the ability to maintain and regulate the pool size.

4.5. Surfactant Proteins A-D

Surfactant proteins are synthesised by the alveolar epithelial type II cells where SP-B and -C are transported as they are progressively processed from larger precursors and packaged together with phospholipids from the endoplasmic reticulum to lamellar bodies by way of multivesicular bodies [94] before being secreted into the alveolar space. Surfactant proteins -A and -D are post-translationally modified in the endoplasmic reticulum and Golgi apparatus prior to being constitutively secreted to the hypophase [25,95] to aid in the formation of the highly flexible surfactant film. SP-B in the MPS IIIA mouse was the only surfactant protein maintained at a constant level, which likely reflects SP-B’s vital role in surfactant metabolism and function as evidenced by the fact that an SP-B null mutation is incompatible with life [96]. Conversely, the gene expression of the smaller hydrophobic protein, SP-C was reduced as was the amount of protein in BALF. SP-B and SP-C work closely together to modulate the lipid packing and spreading of the surfactant film to optimise the surface tension of the film during the respiratory cycle. However, while SP-B is critical to life, there is less dependence on SP-C in maintaining surfactant integrity as its levels can fluctuate without compromising function [97]. Functionality of the surfactant film is sustained in part due to SP-C in combination with cholesterol by inducing phase segregation into fluid ordered and fluid disordered sections up to a temperature of 37.5 °C [75,77,98]. SP-C enhances the expression of genes responsible for the metabolism and transport of cholesterol, therefore indirectly playing a role in modulating surfactant fluidity at physiological temperatures [75,99], but SP-C does not affect the phospholipid pool size [100]. Decreased SP-C may also have a deleterious effect on the structure of the septal wall in the ageing lung. Such structural changes are often the precursor to interstitial fibrosis that affects pulmonary mechanics [99,101]. SP-C also contributes to innate host defence in the pulmonary film, enhancing macrophage-mediated phagocytosis and clearance and limiting pulmonary inflammatory responses [99,102]. Deficiencies in SP-C are associated with severe respiratory pathologies [100,103,104,105,106] particularly in interstitial lung diseases in young children [107]. A concomitant reduction in both cholesterol and SP-C at the alveolar surface of MPS IIIA mice has the potential for a significant deleterious effect on the functioning of pulmonary surfactant by increasing the work of breathing and affecting host defence.
The larger surfactant proteins -A and -D are members of the collectin family of proteins and are integral to pulmonary innate immunity by interacting with immune cells, enhancing phagocytosis and killing by macrophages and neutrophils (for review see [35,57,108,109,110]). The reduction in the gene expression of SP-A and -D, the expression of SP-D protein in mouse lung tissue, and the amount of SP-A and -D in BALF, suggest that innate immunity would likely be compromised in the MPS IIIA mouse. As well as their role in innate immunity, SP-A and -D are integral in forming the interfacial surfactant film. Deletion of SP-A affects the adsorption of pulmonary surfactant to the interface and the formation of tubular myelin in the hypophase, hence compromising the integrity of the pulmonary surfactant film [111,112]. Furthermore, SP-D plays a role in regulating the surfactant pool size and ultrastructure of the pulmonary surfactant lining of the lung, with evidence of SP-D deficient mice showing an accumulation of surfactant phospholipids, but no change in surfactant proteins [85,89,90,91]. Interestingly, the alveolar epithelial type II cells of SP-D deficient mice contain giant disorganised lamellar bodies and simultaneously there is an increase in the phospholipid pool size and the appearance and number of foamy alveolar macrophages [89,93]. The re-introduction of SP-D corrects the alveolar macrophage changes [113], strongly suggesting that SP-D plays a significant role in the correct internalisation and recycling of spent surfactant. Hence, SP-A and -D play significant roles in the metabolism, formation of surface-active interfacial film and innate immunity, and therefore the reduced gene and protein expression will likely have a detrimental impact on pulmonary surfactant formation and the innate immune system in the alveolar compartment of the MPS IIIA mouse.

4.6. Surfactant Activity

The ability of the surfactant film to adsorb to the air-liquid interface, as it is expanded and compressed during the breathing cycles, is measured in vitro using captive bubble surfactometry (CBS). Pulmonary surfactant, adsorbed at the air-liquid interface, reduces surface tension (γ) from 70 mN/m (at 37 °C) to 20–25 mN/m (equilibrium surface tension, γeq) and then decreases further upon expiration to values of less than 2 mN/m [114]. Under static conditions, surfactant from MPS IIIA mice was able to reach the same equilibrium surface tension upon both initial adsorption and following post-expansion adsorption compared with that from control mice. However, the rate of surface tension reduction was slightly reduced in the post expansion adsorption maneuver, suggesting that there may be inhibitors present in the BALF preventing efficient recruitment and adsorption of new material to the expanding surface in order to rapidly reduce surface tension. Furthermore, upon dynamic cycling surfactant from MPS IIIA mice demonstrated significant increases in both γmin and γmax, further supporting the suggestion that surfactant activity was inhibited in the diseased mice. The findings of compromised surfactant activity were further supported by the increase in compressibility (ΔΠ/ΔA) (a low compressibility, i.e., a steeper slope indicates improved efficiency of surfactant to reduce surface tension upon compression), and increased hysteresis (an indirect measure of the work associated with surfactant reorganising itself at the air-liquid interface during compression-expansion cycles). These changes indicate that the surfactant film is not able to pack as tightly on the compression cycle in the MPS IIIA mice when compared to control mice, likely as a consequence of the inclusion of spurious components into the films. Energy efficient surfactant films have a low hysteresis, which is calculated as the area enclosed between the compression and expansion moieties of the isotherms [56]. However, the surfactant from MPS IIIA mice had a higher hysteresis, indicating that it required significantly more energy to decrease the surface tension to a minimum level in the dynamic cycles.
Although surfactant from MPS IIIA mice had reduced surfactant phospholipids and proteins, these factors are unlikely to explain the differences observed in surface activity. We adjusted the quantity of surfactant added to the CBS to maintain a consistent amount of total phospholipid. Because the surfactant proteins were similarly reduced in the MPS IIIA samples the composition of the analysed surfactant is not likely to have differed between control and MPS IIIA samples. Therefore, we propose that the likely contaminating factor that may be inhibiting surface activity is HS or some derivatives thereof, which increased 25-fold in BALF of MPS IIIA mice. The incorporation of macromolecules such as proteins and polysaccharides into the surfactant film has been shown to inhibit surface activity in vitro and in vivo as seen in acute respiratory distress syndrome [53,115,116,117]. However, the specific effect of HS on surface activity is unknown. Given that MPS IIIA patients are characterised by both neuro- and systemic inflammation [118], we cannot discount the possibility that there may also be other contaminating factors such as cytokines, e.g., C-reactive protein and other amine, peptide and lipid inflammatory mediators, which have also been shown to be potent inhibitors of surfactant [50,51]. Finally, the combination of both reduced surfactant quantities and reduced surface activity are likely to have highly detrimental effects on surfactant and lung function in MPS IIIA. Specifically, the higher surface tension and increased hysteresis in MPS IIIA surfactant during dynamic cycling indicate that expansion and compression cycles require more energy, potentially increasing the work of breathing [112,114,119].

5. Conclusions

We have described increased storage of HS, GM3 and BMP in MPS IIIA mouse lung tissue. Combined with decreased gene and protein expression of surfactant proteins, this demonstrates altered pulmonary surfactant synthesis in MPS IIIA mice. We have also described an increase in HS as an exogenous contaminant in alveolar surfactant. At the same time there was a decrease in BMP, cholesterol, total phospholipids and surfactant proteins -A, -C and -D in MPS IIIA alveolar surfactant, suggesting impaired secretion. Collectively these changes have contributed to a decrease in surface activity, which is likely to impact lung mechanics. The reduction, particularly in SP-A and SP-D, is also likely to negatively affect pulmonary innate immunity. This mouse model of Sanfilippo syndrome has, for the first time in any mucopolysaccharidosis, shown alterations in pulmonary surfactant contributing to respiratory dysfunction in the distal lung.

Supplementary Materials

Author Contributions

Conceptualisation, E.J.P.-L., S.O. and T.L.P.; methodology, E.J.P.-L., S.O., T.L.P., P.J.T., C.A., M.H.P., M.E., M.F.S., A.D.P., J.P.-G., J.L.M.; software, T.L.P., C.A., G.K., M.F.S.; validation and formal analysis, T.L.P., S.O., P.J.T., C.A., M.H.P. and G.K.; investigation, T.L.P., S.O., E.J.P.-L., P.J.T., M.F.S., C.A., M.H.P., G.K., M.E., A.D.P., J.L.M., J.P.-G.; resources, E.J.P.-L., S.O., M.F.S., J.L.M., J.P.-G. and A.D.P.; writing—original draft preparation, T.L.P.; writing—review and editing, E.J.P.-L. and S.O.; supervision, E.J.P.-L., S.O., P.J.T. project administration S.O.; funding acquisition S.O., E.J.P.-L., T.L.P. All authors have read and agreed to the published version of the manuscript.

Funding

Sansom Institute for Health Research Grant (SO and EPL), Research Training Program Fee Offset Scholarship (TP), Commonwealth Scholarships for South Australia Program (TP), Spanish Ministry of Science and Innovation and Regional Government of Madrid (C.A., M.E. and J.P.-G.).

Institutional Review Board Statement

The study was conducted according to the guidelines of the Australian Code for the care and use of animals for scientific purposes, and approved by the Animal Ethics Committee of the Women’s & Children’s Health Network (#AE1054 approved 6 December 2016 and # AEC1031/12/18 approved 18 April 2016).

Informed Consent Statement

Not applicable.

Data Availability Statement

The data presented in this study are available in this article and the associated supplementary material, i.e., Table S3.

Acknowledgments

The authors wish to thank Kim Hemsley and Adeline Lau for providing mice for the scavenge protocol from their MPS IIIA colony that were excess to requirements and to Sarah Tamang for assistance with animal maintenance. They thank Megan Quinn and Stacey Holman for assistance with RNA analysis and Alicia Benavente for assistance with sample preparation for captive bubble surfactometry.

Conflicts of Interest

The authors declare no conflict of interest.

References

  1. Cox, T.; Cachon-Gonzalez, M.B. The cellular pathology of lysosomal diseases. J. Pathol. 2012, 226, 241–254. [Google Scholar] [CrossRef]
  2. Valstar, M.J.; Marchal, J.P.; Grootenhuis, M.; Colland, V.; Wijburg, F.A. Cognitive development in patients with Mucopolysaccharidosis type III (Sanfilippo syndrome). Orphanet J. Rare Dis. 2011, 6, 43. [Google Scholar] [CrossRef] [Green Version]
  3. Valstar, M.; Ruijter, G.; Van Diggelen, O.; Poorthuis, B.; Wijburg, F. Sanfilippo syndrome: A mini-review. J. Inherit. Metab. Dis. 2008, 31, 240–252. [Google Scholar] [CrossRef]
  4. Neufeld, E.; Meunzer, J. The metabolic and molecular bases of inherited disease (Scriver, C.R., Beaudet, A.L., Sly, W.S., Valle, D., Childs, B., Kinzler, K.W., and Vogelstein, B. eds. 8th edn. Biochemistry 2001, 67, 611–612. [Google Scholar]
  5. Chiang, J.; Raiman, J.; Cutz, E.; Solomon, M.; Dell, S. Tachypnea of infancy as the first sign of Sanfilippo syndrome. Pediatrics 2014, 134, e884–e888. [Google Scholar] [CrossRef] [Green Version]
  6. Cleary, M.A.; Wraith, J.E. Management of mucopolysaccharidosis type III. Arch. Dis. Child. 1993, 69, 403–406. [Google Scholar] [CrossRef] [Green Version]
  7. Simonaro, C.M.; Guo, N.; DeAngelis, V.; Tomatsu, S.; Schuchman, E.H. Evaluation of pentosan polysulfate in mucopolysaccharidosis type IIIA mice. Mol. Genet. Metab. 2017, 120, S123. [Google Scholar] [CrossRef]
  8. Leighton, S.; Papsin, B.; Vellodi, A.; Dinwiddie, R.; Lane, R. Disordered breathing during sleep in patients with mucopolysaccharidoses. Int. J. Pediatric Otorhinolaryngol. 2001, 58, 127–138. [Google Scholar] [CrossRef]
  9. Lavery, C.; Hendriksz, C.J.; Jones, S.A. Mortality in patients with Sanfilippo syndrome. Orphanet J. Rare Dis. 2017, 12, 168. [Google Scholar] [CrossRef] [Green Version]
  10. Meyer, A.; Kossow, K.; Gal, A.; Mühlhausen, C.; Ullrich, K.; Braulke, T.; Muschol, N. Scoring evaluation of the natural course of Mucopolysaccharidosis Type IIIA (Sanfilippo Syndrome Type A). Pediatrics 2007, 120, e1255–e1261. [Google Scholar] [CrossRef] [Green Version]
  11. Mühlebach, M.S.; Wooten, W.; Muenzer, J. Respiratory manifestations in mucopolysaccharidoses. Paediatr. Respir. Rev. 2011, 12, 133–138. [Google Scholar] [CrossRef]
  12. Bush, D.; Sremba, L.; Lomax, K.; Lipsett, J.; Ketteridge, D.; Bratkovic, D.; Eachautegul-Colon, Y.; Welsfeld-Adams, J.; Galambos, C.; Lummus, S.; et al. Neonatal onset interstitial lung disease as a primary presenting manifestation of mucopolysaccharidosis type I. J. Inherit. Metab. Dis. Rep. 2018, 43, 71–77. [Google Scholar]
  13. Kurolap, A.; del Toro, M.; Spiegel, R.; Gutstein, A.; Shafir, G.; Cohen, I.J.; Barrabés, J.A.; Feldman, H.B. Gaucher disease type 3c: New patients with unique presentations and review of the literature. Mol. Genet. Metab. 2019, 127, 138–146. [Google Scholar] [CrossRef]
  14. Buccoliero, R.; Ginzburg, L.; Futerman, A.H. Elevation of lung surfactant phosphatidylcholine in mouse models of Sandhoff and of Niemann-Pick A disease. J. Inherit. Metab. Dis. 2004, 27, 641–648. [Google Scholar] [CrossRef]
  15. Buccoliero, R.; Palmeri, S.; Ciarleglio, G.; Collodoro, A.; De Santi, M.M.; Federico, A. Increased lung surfactant phosphatidylcholine in patients affected by lysosomal storage diseases. J. Inherit. Metab. Dis. 2007, 30, 983. [Google Scholar] [CrossRef]
  16. Griese, M.; Brasch, F.; Aldana, V.; Cabrera, M.; Goelnitz, U.; Ikonen, E.; Karam, B.; Liebisch, G.; Linder, M.; Lohse, P. Respiratory disease in Niemann-Pick type C2 is caused by pulmonary alveolar proteinosis. Clin. Genet. 2010, 77, 119–130. [Google Scholar] [CrossRef]
  17. Roszell, B.R.; Tao, J.-Q.; Yu, K.J.; Huang, S.; Bates, S.R. Characterization of the Niemann-Pick C pathway in alveolar type II cells and lamellar bodies of the lung. Am. J. Physiol. Lung Cell. Mol. Physiol. 2012, 302, L919–L932. [Google Scholar] [CrossRef] [Green Version]
  18. Crawley, A.C.; Gliddon, B.L.; Auclair, D.; Brodie, S.L.; Hirte, C.; King, B.M.; Fuller, M.; Hemsley, K.M.; Hopwood, J.J. Characterization of a C57BL/6 congenic mouse strain of mucopolysaccharidosis type IIIA. Brain Res. 2006, 1104, 1–17. [Google Scholar] [CrossRef]
  19. Bhaumik, M.; Muller, V.J.; Rozaklis, T.; Johnson, L.; Dobrenis, K.; Bhattacharyya, R.; Wurzelmann, S.; Finamore, P.; Hopwood, J.J.; Walkley, S.U.; et al. A mouse model for mucopolysaccharidosis type III A (Sanfilippo syndrome). Glycobiology 1999, 9, 1389–1396. [Google Scholar] [CrossRef]
  20. He, Q.Q.; Trim, P.J.; Lau, A.A.; King, B.M.; Hopwood, J.J.; Hemsley, K.M.; Snel, M.F.; Ferro, V. Synthetic disaccharide standards enable quantitative analysis of stored heparan sulfate in MPS IIIA murine brain regions. ACS Chem. Neurosci. 2019, 10, 3847–3858. [Google Scholar] [CrossRef]
  21. Folch, J.; Lees, M.; Sloane-Stanley, G. A simple method for the isolation and purification of total lipids from animal tissues. J. Biol. Chem. 1957, 226, 497–509. [Google Scholar] [CrossRef]
  22. Van Hoecke, L.; Job, E.R.; Saelens, X.; Roose, K. Bronchoalveolar lavage of murine lungs to analyze inflammatory cell infiltration. J. Vis. Exp. 2017. [Google Scholar] [CrossRef]
  23. Bligh, E.G.; Dyer, W.J. A rapid method of total lipid extraction and purification. Can. J. Biochem. Physiol. 1959, 37, 911–917. [Google Scholar] [CrossRef] [Green Version]
  24. Postle, A.D.; Henderson, N.G.; Koster, G.; Clark, H.W.; Hunt, A.N. Analysis of lung surfactant phosphatidylcholine metabolism in transgenic mice using stable isotopes. Chem. Phys. Lipids 2011, 164, 549–555. [Google Scholar] [CrossRef] [Green Version]
  25. Goss, V.; Hunt, A.N.; Postle, A.D. Regulation of lung surfactant phospholipid synthesis and metabolism. Biochim. Biophys. Acta (BBA) Mol. Cell Biol. Lipids 2013, 1831, 448–458. [Google Scholar] [CrossRef]
  26. Schürch, S.; Green, F.H.; Bachofen, H. Formation and structure of surface films: Captive bubble surfactometry. Biochim. Biophys. Acta 1998, 1408, 180–202. [Google Scholar] [CrossRef] [Green Version]
  27. Nanjee, M.N.; Gebre, A.K.; Miller, N.E. Enzymatic fluorometric procedure for phospholipid quantification with an automated microtiter plate fluorometer. Clin. Chem. 1991, 37, 868–874. [Google Scholar] [CrossRef]
  28. Naito, H.K.; David, J.A. Laboratory considerations: Determination of cholesterol, triglyceride, phospholipid, and other lipids in blood and tissues. Lab. Res. Methods Biol. Med. 1984, 10, 1–76. [Google Scholar]
  29. Schoel, W.M.; Schürch, S.; Goerke, J. The captive bubble method for the evaluation of pulmonary surfactant: Surface tension, area, and volume calculations. Biochim. Biophys. Acta (BBA) Gen. Subj. 1994, 1200, 281–290. [Google Scholar] [CrossRef]
  30. Soo, P.S.; Hiscock, J.; Botting, K.J.; Roberts, C.T.; Davey, A.K.; Morrison, J.L. Maternal undernutrition reduces P-glycoprotein in guinea pig placenta and developing brain in late gestation. Reprod. Toxicol. 2012, 33, 374–381. [Google Scholar] [CrossRef]
  31. McGillick, E.V.; Orgeig, S.; McMillen, I.C.; Morrison, J.L. The fetal sheep lung does not respond to cortisol infusion during the late canalicular phase of development. Physiol. Rep. 2013, 1, 1–15. [Google Scholar] [CrossRef]
  32. Bustin, S.A.; Benes, V.; Garson, J.A.; Hellemans, J.; Huggett, J.; Kubista, M.; Mueller, R.; Nolan, T.; Pfaffl, M.W.; Shipley, G.L.; et al. The MIQE Guidelines: Minimum information for publication of quantitative real-time PCR experiments. Clin. Chem. 2009, 55, 611–622. [Google Scholar] [CrossRef] [Green Version]
  33. Darby, J.R.T.; McMillen, I.C.; Morrison, J.L. Maternal undernutrition in late gestation increases IGF2 signalling molecules and collagen deposition in the right ventricle of the fetal sheep heart. J. Physiol. 2018, 596, 2345–2358. [Google Scholar] [CrossRef] [Green Version]
  34. Pillai-Kastoori, L.; Schutz-Geschwender, A.R.; Harford, J.A. A systematic approach to quantitative Western blot analysis. Anal. Biochem. 2020, 593, 113608. [Google Scholar] [CrossRef]
  35. Vieira, F.; Kung, J.W.; Bhatti, F. Structure, genetics and function of the pulmonary associated surfactant proteins A and D: The extra-pulmonary role of these C type lectins. Ann. Anat. Anat. Anz. 2017, 211, 184–201. [Google Scholar] [CrossRef]
  36. Davis, D.A.S.; Parish, C.R. Heparan sulfate: A ubiquitous glycosaminoglycan with multiple roles in immunity. Front. Immunol. 2013, 4, 470. [Google Scholar]
  37. Ochs, M.; Hegermann, J.; Lopez-Rodriguez, E.; Timm, S.; Nouailles, G.; Matuszak, J.; Simmons, S.; Witzenrath, M.; Kuebler, W.M. On Top of the Alveolar Epithelium: Surfactant and the Glycocalyx. Int. J. Mol. Sci. 2020, 21, 3075. [Google Scholar] [CrossRef]
  38. Stringer, S.E.; Gallagher, J.T. Heparan sulphate. Int. J. Biochem. Cell Biol. 1997, 29, 709–714. [Google Scholar] [CrossRef]
  39. Gallagher, J.T.; Lyon, M.; Steward, W.P. Structure and function of heparan sulphate proteoglycans. Biochem. J. 1986, 236, 313–325. [Google Scholar] [CrossRef] [Green Version]
  40. Lindahl, U.; Kjellén, L. Pathophysiology of heparan sulphate: Many diseases, few drugs. J. Intern. Med. 2013, 273, 555–571. [Google Scholar] [CrossRef] [Green Version]
  41. Smits, N.C.; Shworak, N.W.; Dekhuijzen, P.N.; van Kuppevelt, T.H. Heparan sulfates in the lung: Structure, diversity, and role in pulmonary emphysema. Anat. Rec. 2010, 293, 955–967. [Google Scholar] [CrossRef]
  42. Haeger, S.M.; Yang, Y.; Schmidt, E.P. Heparan sulfate in the developing, healthy, and injured lung. Am. J. Respir. Cell Mol. Biol. 2016, 55, 5–11. [Google Scholar] [CrossRef] [Green Version]
  43. Li, J.P.; Kusche-Gullberg, M. Heparan sulfate: Biosynthesis, structure, and function. In International Review of Cell and Molecular Biology; Jeon, K.W., Ed.; Academic Press: Amsterdam, The Netherlands, 2016; Volume 325, pp. 215–273. [Google Scholar]
  44. Yang, Y.; Schmidt, E.P. The endothelial glycocalyx. Tissue Barriers 2013, 1, e23494. [Google Scholar] [CrossRef] [Green Version]
  45. Haeger, S.M.; Liu, X.; Han, X.; McNeil, J.B.; Oshima, K.; McMurtry, S.A.; Yang, Y.; Ouyang, Y.; Zhang, F.; Nozik-Grayck, E.; et al. Epithelial heparan sulfate contributes to alveolar barrier function and is shed during lung injury. Am. J. Respir. Cell Mol. Biol. 2018, 59, 363–374. [Google Scholar] [CrossRef]
  46. LaRivière, W.B.; Schmidt, E.P. Chapter Two—The pulmonary endothelial glycocalyx in ARDS: A critical role for heparan sulfate. In Current Topics in Membranes; Belvitch, P., Dudek, S., Eds.; Academic Press: Amsterdam, The Netherlands, 2018; Volume 82, pp. 33–52. [Google Scholar]
  47. Maccari, F.; Sorrentino, N.C.; Mantovani, V.; Galeotti, F.; Fraldi, A.; Volpi, N. Glycosaminoglycan levels and structure in a mucopolysaccharidosis IIIA mice and the effect of a highly secreted sulfamidase engineered to cross the blood-brain barrier. Metab. Brain Dis. 2017, 32, 203–210. [Google Scholar] [CrossRef]
  48. Cañadas, O.; Keough, K.M.W.; Casals, C. Bacterial lipopolysaccharide promotes destabilization of lung surfactant-like films. Biophys. J. 2011, 100, 108–116. [Google Scholar] [CrossRef] [Green Version]
  49. Parra, E.; Pérez-Gil, J. Composition, structure and mechanical properties define performance of pulmonary surfactant membranes and films. Chem. Phys. Lipids 2015, 185, 153–175. [Google Scholar] [CrossRef]
  50. Krafft, M.P. Overcoming inactivation of the lung surfactant by serum proteins: A potential role for fluorocarbons? Soft Matter 2015, 11, 5982–5994. [Google Scholar] [CrossRef] [Green Version]
  51. Devendra, G.; Spragg, R.G. Lung surfactant in subacute pulmonary disease. Respir. Res. 2002, 3, 11. [Google Scholar] [CrossRef] [Green Version]
  52. Amigoni, A.; Pettenazzo, A.; Stritoni, V.; Circelli, M. Surfactants in acute respiratory distress syndrome in infants and children: Past, present and future. Clin. Drug Investig. 2017, 37, 729–736. [Google Scholar] [CrossRef] [Green Version]
  53. Gill, S.E.; Yamashita, C.M.; Veldhuizen, R.A. Lung remodeling associated with recovery from acute lung injury. Cell Tissue Res. 2017, 367, 495–509. [Google Scholar] [CrossRef]
  54. Archer, L.D.; Langford-Smith, K.J.; Bigger, B.W.; Fildes, J.E. Mucopolysaccharide diseases: A complex interplay between neuroinflammation, microglial activation and adaptive immunity. J. Inherit. Metab. Dis. 2014, 37, 1–12. [Google Scholar] [CrossRef]
  55. Bigger, B.; Boutin, H.; Wilkinson, F.; Holley, R.; Brough, D.; Pinteaux, E.; Parker, H. Mucopolysaccharidosis type IIIA storage substrate drives an innate immune neuro-inflammatory response. Mol. Genet. Metab. 2016, 120, S27–S28. [Google Scholar] [CrossRef]
  56. Lopez-Rodriguez, E.; Pérez-Gil, J. Structure-function relationships in pulmonary surfactant membranes: From biophysics to therapy. Biochim. Biophys. Acta (BBA) Biomembr. 2014, 1838, 1568–1585. [Google Scholar] [CrossRef] [Green Version]
  57. Reid, K.B.M. Functional roles of the lung surfactant proteins SP-A and SP-D in innate immunity. Immunobiology 1998, 199, 200–207. [Google Scholar] [CrossRef]
  58. Al-Saiedy, M.; Tarokh, A.; Nelson, S.; Hossini, K.; Green, F.; Ling, C.-C.; Prenner, E.J.; Amrein, M. The role of multilayers in preventing the premature buckling of the pulmonary surfactant. Biochim. Biophys. Acta (BBA) Biomembr. 2017, 1859, 1372–1380. [Google Scholar] [CrossRef]
  59. Svennerholm, L. The gangliosides. J. Lipid Res. 1964, 5, 145–155. [Google Scholar] [CrossRef]
  60. McGlynn, R.; Dobrenis, K.; Walkley, S.U. Differential subcellular localization of cholesterol, gangliosides, and glycosaminoglycans in murine models of mucopolysaccharide storage disorders. J. Comp. Neurol. 2004, 480, 415–426. [Google Scholar] [CrossRef]
  61. Dautel, S.E.; Kyle, J.E.; Clair, G.; Sontag, R.L.; Weitz, K.K.; Shukla, A.K.; Nguyen, S.N.; Kim, Y.-M.; Zink, E.M.; Luders, T.; et al. Lipidomics reveals dramatic lipid compositional changes in the maturing postnatal lung. Sci. Rep. 2017, 7, 40555. [Google Scholar] [CrossRef] [Green Version]
  62. Walkley, S.U. Secondary accumulation of gangliosides in lysosomal storage disorders. Semin. Cell Dev. Biol. 2004, 15, 433–444. [Google Scholar] [CrossRef]
  63. Tsukuda, Y.; Iwasaki, N.; Seito, N.; Kanayama, M.; Fujitani, N.; Shinohara, Y.; Kasahara, Y.; Onodera, T.; Suzuki, K.; Asano, T.; et al. Ganglioside GM3 Has an Essential Role in the Pathogenesis and Progression of Rheumatoid Arthritis. PLoS ONE 2012, 7, e40136. [Google Scholar] [CrossRef] [PubMed] [Green Version]
  64. Jou, I.; Lee, J.H.; Park, S.Y.; Yoon, H.J.; Joe, E.-H.; Park, E.J. Gangliosides trigger inflammatory responses via TLR4 in brain glia. Am. J. Pathol. 2006, 168, 1619–1630. [Google Scholar] [CrossRef] [PubMed] [Green Version]
  65. Somogyi, A.; Petcherski, A.; Beckert, B.; Huebecker, M.; Priestman, D.A.; Banning, A.; Cotman, S.L.; Platt, F.M.; Ruonala, M.O.; Tikkanen, R. Altered expression of ganglioside metabolizing enzymes results in GM3 ganglioside accumulation in cerebellar cells of a mouse model of juvenile neuronal ceroid lipofuscinosis. Int. J. Mol. Sci. 2018, 19, 625. [Google Scholar] [CrossRef] [PubMed] [Green Version]
  66. Langeveld, M.; Ghauharali, K.J.; Sauerwein, H.P.; Ackermans, M.T.; Groener, J.E.; Hollak, C.E.; Aerts, J.M.; Serlie, M.J. Type I Gaucher disease, a glycosphingolipid storage disorder, is associated with insulin resistance. J. Clin. Endocrinol. Metab. 2008, 93, 845–851. [Google Scholar] [CrossRef] [Green Version]
  67. Ghauharali-van der Vlugt, K.; Langeveld, M.; Poppema, A.; Kuiper, S.; Hollak, C.E.; Aerts, J.M.; Groener, J.E. Prominent increase in plasma ganglioside GM3 is associated with clinical manifestations of type I Gaucher disease. Clin. Chim. Acta 2008, 389, 109–113. [Google Scholar] [CrossRef]
  68. Hullin-Matsuda, F.; Luquain-Costaz, C.; Bouvier, J.; Delton-Vandenbroucke, I. Bis (monoacylglycero) phosphate, a peculiar phospholipid to control the fate of cholesterol: Implications in pathology. Prostaglandinsleukotrienes Essent. Fat. Acids 2009, 81, 313–324. [Google Scholar] [CrossRef]
  69. McCauliff, L.A.; Langan, A.; Li, R.; Ilnytska, O.; Bose, D.; Waghalter, M.; Lai, K.; Kahn, P.C.; Storch, J. Intracellular cholesterol trafficking is dependent upon NPC2 interaction with lysobisphosphatidic acid. eLife 2019, 8, e50832. [Google Scholar] [CrossRef]
  70. Frederick, T.E.; Chebukati, J.N.; Mair, C.E.; Goff, P.C.; Fanucci, G.E. Bis (monoacylglycero) phosphate forms stable small lamellar vesicle structures: Insights into vesicular body formation in endosomes. Biophys. J. 2009, 96, 1847–1855. [Google Scholar] [CrossRef] [Green Version]
  71. Wardhan, R.; Mudgal, P. Introduction to Biomembranes. In Textbook of Membrane Biology; Springer: Singapore, 2017; pp. 1–28. [Google Scholar] [CrossRef]
  72. Gallala, H.D.; Sandhoff, K. Biological function of the cellular lipid BMP—BMP as a key activator for cholesterol sorting and membrane digestion. Neurochem. Res. 2011, 36, 1594–1600. [Google Scholar] [CrossRef]
  73. Jabs, S.; Quitsch, A.; Käkelä, R.; Koch, B.; Tyynelä, J.; Brade, H.; Glatzel, M.; Walkley, S.; Saftig, P.; Vanier, M.T.; et al. Accumulation of bis(monoacylglycero)phosphate and gangliosides in mouse models of neuronal ceroid lipofuscinosis. J. Neurochem. 2008, 106, 1415–1425. [Google Scholar] [CrossRef]
  74. Yang, S.-T.; Kreutzberger, A.J.B.; Lee, J.; Kiessling, V.; Tamm, L.K. The role of cholesterol in membrane fusion. Chem. Phys. Lipids 2016, 199, 136–143. [Google Scholar] [CrossRef] [Green Version]
  75. Roldan, N.; Pérez-Gil, J.; Morrow, M.R.; García-Álvarez, B. Divide & Conquer: SurfactantpProtein SP-C and cholesterol modulate phase segregation in lung surfactant. Biophys. J. 2017, 113, 847–859. [Google Scholar] [CrossRef]
  76. Orgeig, S.; Daniels, C.B. The comparative biology of pulmonary surfactant: Past, present and future. Comp. Biochem. Physiol. Part A Mol. Integr. Physiol. 2001, 129, 75–89. [Google Scholar] [CrossRef]
  77. Orgeig, S.; Daniels, C.B. The roles of cholesterol in pulmonary surfactant: Insights from comparative and evolutionary studies. Comp. Biochem. Physiol. Part Amolecular Integr. Physiol. 2010, 129, 75–89. [Google Scholar] [CrossRef]
  78. Simons, K.; Ehehalt, R. Cholesterol, lipid rafts, and disease. J. Clin. Investig. 2002, 110, 597–603. [Google Scholar] [CrossRef]
  79. Veldhuizen, R.; Nag, K.; Orgeig, S.; Possmayer, F. The role of lipids in pulmonary surfactant. Biochim. Biophys. Acta 1998, 1408, 90–108. [Google Scholar] [CrossRef]
  80. Wüstneck, R.; Perez-Gil, J.; Wüstneck, N.; Cruz, A.; Fainerman, V.B.; Pison, U. Interfacial properties of pulmonary surfactant layers. Adv. Colloid Interface Sci. 2005, 117, 33–58. [Google Scholar] [CrossRef]
  81. Vockeroth, D.; Gunasekara, L.; Amrein, M.; Possmayer, F.; Lewis, J.F.; Veldhuizen, R.A.W. Role of cholesterol in the biophysical dysfunction of surfactant in ventilator-induced lung injury. Am. J. Physiol. Lung Cell. Mol. Physiol. 2010, 298, L117–L125. [Google Scholar] [CrossRef] [Green Version]
  82. Serrano, A.G.; Pérez-Gil, J. Protein–lipid interactions and surface activity in the pulmonary surfactant system. Chem. Phys. Lipids 2006, 141, 105–118. [Google Scholar] [CrossRef]
  83. Perez-Gil, J.; Weaver, T. Pulmonary surfactant pathophysiology: Current models and open questions. Physiology 2010, 25, 132–141. [Google Scholar] [CrossRef] [Green Version]
  84. Haller, T.; Ortmayr, J.; Friedrich, F.; Völkl, H.; Dietl, P. Dynamics of surfactant release in alveolar type II cells. Proc. Natl. Acad. Sci. USA 1998, 95, 1579–1584. [Google Scholar] [CrossRef] [Green Version]
  85. Ikegami, M.; Hull, W.M.; Yoshida, M.; Wert, S.E.; Whitsett, J.A. SP-D and GM-CSF regulate surfactant homeostasis via distinct mechanisms. Am. J. Physiol. Lung Cell. Mol. Physiol. 2001, 281, L697–L703. [Google Scholar] [CrossRef] [Green Version]
  86. Schürch, S.; Qanbar, R.; Bachofen, H.; Possmayer, F. The surface-associated surfactant reservoir in the alveolar lining. Neonatology 1995, 67 (Suppl. 1), 61–76. [Google Scholar] [CrossRef]
  87. Baumgart, F.; Ospina, O.L.; Mingarro, I.; Rodríguez-Crespo, I.; Pérez-Gil, J. Palmitoylation of pulmonary surfactant protein SP-C is critical for its functional cooperation with SP-B to sustain compression/expansion dynamics in cholesterol-containing surfactant films. Biophys. J. 2010, 99, 3234–3243. [Google Scholar] [CrossRef] [Green Version]
  88. Alcorn, J.L. Chapter 4—Pulmonary surfactant trafficking and homeostasis. In Lung Epithelial Biology in the Pathogenesis of Pulmonary Disease; Sidhaye, V.K., Koval, M., Eds.; Academic Press: Boston, MA, USA, 2017; pp. 59–75. [Google Scholar] [CrossRef]
  89. Korfhagen, T.R.; Sheftelyevich, V.; Burhans, M.S.; Bruno, M.D.; Ross, G.F.; Wert, S.E.; Stahlman, M.T.; Jobe, A.H.; Ikegami, M.; Whitsett, J.A. Surfactant protein-D regulates surfactant phospholipid homeostasis in vivo. J. Biol. Chem. 1998, 273, 28438–28443. [Google Scholar] [CrossRef] [Green Version]
  90. Ikegami, M.; Na, C.-L.; Korfhagen, T.R.; Whitsett, J.A. Surfactant protein D influences surfactant ultrastructure and uptake by alveolar type II cells. Am. J. Physiol.-Lung Cell. Mol. Physiol. 2005, 288, L552–L561. [Google Scholar] [CrossRef] [Green Version]
  91. Ikegami, M.; Grant, S.; Korfhagen, T.; Scheule, R.K.; Whitsett, J.A. Surfactant protein-D regulates the postnatal maturation of pulmonary surfactant lipid pool sizes. J. Appl. Physiol. 2009, 106, 1545–1552. [Google Scholar] [CrossRef] [Green Version]
  92. Martínez-Calle, M.; Olmeda, B.; Dietl, P.; Frick, M.; Pérez-Gil, J. Pulmonary surfactant protein SP-B promotes exocytosis of lamellar bodies in alveolar type II cells. FASEB J. 2018, 32, 4600–4611. [Google Scholar] [CrossRef] [Green Version]
  93. Botas, C.; Poulain, F.; Akiyama, J.; Brown, C.; Allen, L.; Goerke, J.; Clements, J.; Carlson, E.; Gillespie, A.M.; Epstein, C.; et al. Altered surfactant homeostasis and alveolar type II cell morphology in mice lacking surfactant protein D. Proc. Natl. Acad. Sci. USA 1998, 95, 11869–11874. [Google Scholar] [CrossRef] [PubMed] [Green Version]
  94. Weaver, T.E. Synthesis, processing and secretion of surfactant proteins B and C. Biochim. Biophys. Acta (BBA) Mol. Basis Dis. 1998, 1408, 173–179. [Google Scholar] [CrossRef] [Green Version]
  95. Voorhout, W.F.; Veenendaal, T.; Haagsman, H.P.; Weaver, T.E.; Whitsett, J.A.; van Golde, L.M.; Geuze, H.J. Intracellular processing of pulmonary surfactant protein B in an endosomal/lysosomal compartment. Am. J. Physiol. Lung Cell. Mol. Physiol. 1992, 263, L479–L486. [Google Scholar] [CrossRef] [PubMed]
  96. Nogee, L.M.; Garnier, G.; Dietz, H.C.; Singer, L.; Murphy, A.M.; deMello, D.E.; Colten, H.R. A mutation in the surfactant protein B gene responsible for fatal neonatal respiratory disease in multiple kindreds. J. Clin. Investig. 1994, 93, 1860–1863. [Google Scholar] [CrossRef] [PubMed]
  97. Danhaive, O.; Chapin, C.; Horneman, H.; Cogo, P.E.; Ballard, P.L. Surface film formation in vitro by infant and therapeutic surfactants: Role of surfactant protein B. Pediatric Res. 2015, 77, 340–346. [Google Scholar] [CrossRef] [PubMed] [Green Version]
  98. Bernardino de la Serna, J.; Perez-Gil, J.; Simonsen, A.C.; Bagatolli, L.A. Cholesterol Rules: Direct observation of the coexistend of two fluid phases in native pulmonary surfactant membranes at physiological temperatures. J. Biol. Chem. 2004, 279, 40715–40722. [Google Scholar] [CrossRef] [Green Version]
  99. Ruwisch, J.; Sehlmeyer, K.; Roldan, N.; Garcia-Alvarez, B.; Perez-Gil, J.; Weaver, T.E.; Ochs, M.; Knudsen, L.; Lopez-Rodriguez, E. Air space distension precedes spontaneous fibrotic remodeling and impaired cholesterol metabolism in the absence of surfactant protein C. Am. J. Respir. Cell Mol. Biol. 2020, 62, 466–478. [Google Scholar] [CrossRef]
  100. Glasser, S.W.; Burhans, M.S.; Korfhagen, T.R.; Na, C.-L.; Sly, P.D.; Ross, G.F.; Ikegami, M.; Whitsett, J.A. Altered stability of pulmonary surfactant in SP-C-deficient mice. Proc. Natl. Acad. Sci. USA 2001, 98, 6366–6371. [Google Scholar] [CrossRef] [Green Version]
  101. Kazzi, B.; Lederer, D.; Arteaga-Solis, E.; Saqi, A.; Chung, W.K. Recurrent diffuse lung disease due to surfactant protein C deficiency. Respir. Med. Case Rep. 2018, 25, 91–95. [Google Scholar] [CrossRef]
  102. Glasser, S.W.; Senft, A.P.; Whitsett, J.A.; Maxfield, M.D.; Ross, G.F.; Richardson, T.R.; Prows, D.R.; Xu, Y.; Korfhagen, T.R. Macrophage Dysfunction and Susceptibility to Pulmonary Pseudomonas aeruginosa Infection in Surfactant Protein C-Deficient Mice. J. Immunol. 2008, 181, 621–628. [Google Scholar] [CrossRef] [Green Version]
  103. Nogee, L.M.; Dunbar, A.E.; Wert, S.E.; Askin, F.; Hamvas, A.; Whitsett, J.A. A mutation in the surfactant protein C gene associated with familial interstitial lung disease. N. Engl. J. Med. 2001, 344, 573–579. [Google Scholar] [CrossRef]
  104. Nogee, L. Alterations in SP-B and SP-C expression in neonatal lung disease. Annu. Rev. Physiol. 2004, 66, 601–623. [Google Scholar] [CrossRef]
  105. Delestrain, C.; Blanchon, S.; Abbal, J.; Nattes, E.; Aissat, A.; Delattre, V.; Simon, S.; Tarze, A.; Bremont, F.; Epaud, R.; et al. A novel non-BRICHOS surfactant protein C mutation causing infantile interstitial lung disease is associated with reduced mature SP-C level. Eur. Respir. J. 2018, 52, PA633. [Google Scholar]
  106. Griese, M.; Lorenz, E.; Hengst, M.; Schams, A.; Wesselak, T.; Rauch, D.; Wittmann, T.; Kirchberger, V.; Escribano, A.; Schaible, T.; et al. Surfactant proteins in pediatric interstitial lung disease. Pediatric Res. 2016, 79, 34–41. [Google Scholar] [CrossRef] [Green Version]
  107. Hong, D.; Dai, D.; Liu, J.; Zhang, C.; Jin, T.; Shi, Y.; Jiang, G.; Mei, M.; Wang, L.; Qian, L. Clinical and genetic spectrum of interstitial lung disease in Chinese children associated with surfactant protein C mutations. Ital. J. Pediatrics 2019, 45, 117. [Google Scholar] [CrossRef]
  108. McCormack, F.X.; Whitsett, J.A. The pulmonary collectins, SP-A and SP-D, orchestrate innate immunity in the lung. J. Clin. Investig. 2002, 109, 707–712. [Google Scholar] [CrossRef]
  109. Kishore, U.; Greenhough, T.J.; Waters, P.; Shrive, A.K.; Ghai, R.; Kamran, M.F.; Bernal, A.L.; Reid, K.B.; Madan, T.; Chakraborty, T. Surfactant proteins SP-A and SP-D: Structure, function and receptors. Mol. Immunol. 2006, 43, 1293–1315. [Google Scholar] [CrossRef]
  110. Pastva, A.M.; Wright, J.R.; Williams, K.L. Immunomodulatory roles of surfactant proteins A and D: Implications in lung disease. Proc. Am. Thorac. Soc. 2007, 4, 252–257. [Google Scholar] [CrossRef] [Green Version]
  111. Schürch, S.; Possmayer, F.; Cheng, S.; Cockshutt, A.M. Pulmonary SP-A enhances adsorption and appears to induce surface sorting of lipid extract surfactant. Am. J. Physiol. Lung Cell. Mol. Physiol. 1992, 263, L210–L218. [Google Scholar] [CrossRef]
  112. Schürch, S.; Schurch, D.; Curstedt, T.; Robertson, B. Surface activity of lipid extract surfactant in relation to film area compression and collapse. J. Appl. Physiol. 1994, 77, 974–986. [Google Scholar] [CrossRef]
  113. Clark, H.; Palaniyar, N.; Strong, P.; Edmondson, J.; Hawgood, S.; Reid, K.B.M. Surfactant Protein D Reduces Alveolar Macrophage Apoptosis In Vivo. J. Immunol. 2002, 169, 2892–2899. [Google Scholar] [CrossRef] [Green Version]
  114. Autilio, C.; Pérez-Gil, J. Understanding the principle biophysics concepts of pulmonary surfactant in health and disease. Arch. Dis. Child. Fetal Neonatal Ed. 2019, 104, F443–F451. [Google Scholar] [CrossRef]
  115. Nag, K.; Rodriguez-Capote, K.; Panda, A.K.; Frederick, L.; Hearn, S.A.; Petersen, N.O.; Schürch, S.; Possmayer, F. Disparate effects of two phosphatidylcholine binding proteins, C-reactive protein and surfactant protein A, on pulmonary surfactant structure and function. Am. J. Physiol. Lung Cell. Mol. Physiol. 2004, 287, L1145–L1153. [Google Scholar] [CrossRef] [PubMed]
  116. Holm, B.A.; Wang, Z.; Notter, R.H. Multiple Mechanisms of Lung Surfactant Inhibition. Pediatric Res. 1999, 46, 85–93. [Google Scholar] [CrossRef] [PubMed] [Green Version]
  117. Kolomaznik, M.; Nova, Z.; Calkovska, A. Pulmonary surfactant and bacterial lipopolysaccharide: The interaction and its functional consequences. Physiol. Res. 2017, 66. [Google Scholar] [CrossRef] [PubMed]
  118. Viana, G.M.; Priestman, D.A.; Platt, F.M.; Khan, S.; Tomatsu, S.; Pshezhetsky, A.V. Brain Pathology in Mucopolysaccharidoses (MPS) Patients with Neurological Forms. J. Clin. Med. 2020, 9, 396. [Google Scholar] [CrossRef] [PubMed] [Green Version]
  119. Lewith, H.; Pandit, J.J. Lung ventilation and the physiology of breathing. Surgery 2020, 38, 233–239. [Google Scholar] [CrossRef]
Figure 1. Heparan sulphate analysis in control (i.e., wild type and heterozygous combined) and MPS IIIA mice. HS accumulation in lung homogenates (A) and BALF (B) of 20-week control and MPS IIIA mice. HS was measured by LC-MS/MS using an API 4000 QTrap mass spectrometer (ABSciex) coupled with Acquity UPLC (Waters Corp). Data for A and B are expressed as disaccharide concentration (ng/mg total protein and ng/mL BALF, respectively) and plotted as mean ± SD; * indicates a significant difference between control and MPS IIIA mice. Two-tailed Students t-tests, p < 0.0001, n = 17 control and 11 MPS IIIA samples for lung tissue, n = 16 control and 13 MPS IIIA samples for BALF.
Cells 10 00849 g001
Figure 2. Ganglioside analysis. Ganglioside GM3 concentration in lung homogenates of 20-week control and MPS IIIA mice. Ganglioside GM3 was measured by LC MS/MS using an API 4000 QTrap mass spectrometer (ABSciex) coupled with a Prominence HPLC (Shimadzu). Data are expressed as ganglioside concentration (pmol/mg total protein) to the GM standard (GM1 (d35) d18:1/18:0) and plotted as mean ± SD; two-tailed Students t-tests, * and ** indicate a significant difference between control and MPS IIIA mice, p < 0.0001 and 0.0077, respectively, n = 17 control and 11 MPS IIIA samples.
Cells 10 00849 g002
Figure 3. Total bis(monoacylglycerol)phosphate (BMP) analysis. Total BMP concentration in lung homogenates of 20-week control and MPS IIIA mice. Quantification of the BMP molecular species was measured by LC MS/MS using an API 4000 QTrap mass spectrometer (ABSciex) coupled with a Prominence HPLC (Shimadzu). Data are expressed as BMP concentration (pmol/mg total protein) to the BMP standard (BMP 14:0/14:0(Avanti 840445P)) and plotted as mean ± SD; two-tailed Students t-test * indicates a significant difference, p = 0.0002, two-tailed Students t-test; n = 18 control and 10 MPS IIIA samples.
Cells 10 00849 g003
Figure 4. Bis(monoacylglycerol)phosphate (BMP) molecular species analysis. BMP molecular species concentration in lung homogenates of 20-week control and MPS IIIA mice. Quantification of the BMP molecular species was measured by LC MS/MS using an API 4000 QTrap mass spectrometer (ABSciex) coupled with a Prominence HPLC (Shimadzu). Data are expressed as BMP concentration (pmol/mg total protein) to the BMP standard (BMP 14:0/14:0(Avanti 840445P)) and plotted as mean ± SD; two-tailed Students t-tests, * and ** indicate a significant difference, p < 0.0001 and <0.05, respectively between control and MPS IIIA mice; n = 18 control and 10 MPS IIIA samples.
Cells 10 00849 g004
Figure 5. Bis(monoacylglycerol)phosphate (BMP) analysis of BALF. Quantification of the BMP molecular species in 20-week control and MPS IIIA BALF. BMP was measured by LC MS/MS using an API 4000 QTrap mass spectrometer (ABSciex) coupled with a Prominence HPLC (Shimadzu). Data are expressed as BMP concentration (pmol/mL BALF) to the BMP standard (BMP 14:0/14:0 (Avanti 840445P)) and plotted as mean ± SD; two-tailed Students t-tests, *, ** and ***indicate a significant difference, p = 0.0430, 0.0300 and 0.0325, respectively between control and MPS IIIA mice; n = 17 control and 11 MPS IIIA samples.
Cells 10 00849 g005
Figure 6. Cholesterol analysis of BALF (A) and cholesteryl ester analysis of BALF (B). Quantification of cholesterol and the ester molecular species in 20-week control and MPS IIIA BALF were measured by LC MS/MS using an API 4000 QTrap mass spectrometer (ABSciex) coupled with a Prominence HPLC (Shimadzu). Data are expressed as concentration (pmol/mL BALF) to C17 Cholesteryl ester (Sigma C5384) and plotted as mean ± SD; two-tailed Students t-test, * indicates a significant difference, p < 0.0001 between control and MPS IIIA mice, n = 16 control and 13 MPS IIIA samples (A) and n = 15 control and 13 MPS IIIA samples (B).
Cells 10 00849 g006
Figure 7. Total phospholipid pool size analysis in BALF. Quantification of the phospholipid species in control and MPS IIIA BALF. Phospholipids were measured using electrospray ionisation mass spectrometry (ESI-MS) (Waters XEVO TQ-MS). Data are expressed as total phospholipids (nmol) in the total corrected BALF volume and plotted as mean ± SD; two-tailed Students t-test, * indicates a significant difference, p < 0.0001 between control and MPS IIIA mice; n = 9 control and 14 MPS IIIA samples.
Cells 10 00849 g007
Figure 8. Mean normalised expression (MNE) of surfactant proteins -A, -B, -C and -D mRNA. Relative gene expression of surfactant proteins in control and MPS IIIA lung tissue. Data expressed as MNE and plotted as mean ± SD; two-tailed Students t-tests; *, ** and *** indicate significant differences p = 0.0184, p = 0.0001 and p = 0.0073, respectively between control and MPS IIIA mice; n = 23 control and 18–19 MPS IIIA samples.
Cells 10 00849 g008
Figure 9. Protein expression of surfactant proteins -A, -B, -C and -D. (A) Representative Western blot images of part sets of control and MPS IIIA lung tissue samples probed for SP-A (primary antibody-rabbit Thermo Scientific PA5-76699), SP-B (primary antibody-rabbit SevenHills Bioreagents WRAB-48604), SP-C (primary antibody-rabbit SevenHills Bioreagents WRAB-MSPC) and SP-D (primary antibody-rabbit Chemicon AB3434). (B) Data normalised to total protein and presented as mean ± SD; two tailed Students t-tests, * indicates a significant difference, p = 0.0443 between control and MPS IIIA mice; n = 22 control, 17 MPS IIIA (SP-A analysis); 20 control, 16 MPS IIIA (SP-B analysis); 21 control, 18 MPS IIIA (SP-C analysis) and 22 control, 19 MPS IIIA (SP-D analysis) samples. Entire band height of SP-A measured from 32–45 kDa [35].
Cells 10 00849 g009
Figure 10. Protein expression of surfactant proteins -A, -B, -C and -D in BALF. (A) Representative Western blot images of part sets of SP-A, -C and -D samples pictured. Western blot analyses were performed with the following primary antibodies: SP-A (rabbit Thermo Scientific PA5-76695), SP-B (rabbit SevenHills Bioreagents WRAB-48604), SP-C (rabbit SevenHills Bioreagents WRAB-MSPC) and SP-D (rabbit Thermo Scientific PA5-51476). (B) Data normalised to total protein and presented as mean ± SD; significant differences are indicated * p = 0.0027, ** p = 0.0024 and *** p = 0.0438; two tailed Students t-test; n = 9 control, 13 MPS IIIA (SP-A analysis); 10 control, 13 MPS IIIA (SP-B analysis); 12 control, 13 MPS IIIA (SP-C analysis) and 11 control, 13 MPS IIIA (SP-D analysis) samples. Entire band height of SP-A measured from 32–45 kDa [35].
Cells 10 00849 g010
Figure 11. Captive bubble surfactometry of BALF samples under static conditions. Surfactant biophysical properties of control and MPS IIIA BALF under static conditions—initial adsorption (A) and post expansion adsorption (B). Data are expressed as γ (m/Nm) and plotted as mean ± SD; repeated measures ANOVA (A) p < 0.0001 (time effect); (B) * p = 0.0253 (disease effect), p < 0.0001(time effect) and there was an interaction between genotype and time; n = 10 control and 6 MPS IIIA samples.
Cells 10 00849 g011
Figure 12. Captive bubble surfactometry of BALF surfactant samples under dynamic conditions. Biophysical properties of representative control and each individual MPS IIIA surfactant sample subjected to dynamic compression-expansion cycling which mimics spontaneous respiratory cycles. The lower limb of the curve represents the compression of the bubble, and the upper limb of the curve was obtained upon expansion. Thirty cycles were performed at 30 cycles per min with cycles 1, 2, 3, 4, 5, 10 and 20 shown.
Cells 10 00849 g012
Figure 13. Biophysical properties of surfactant from BALF under dynamic compression cycling. Minimum (A) and maximum (B) surface tension of control and MPS IIIA BALF surfactant samples expressed as mN/m. MPS IIIA animals have higher minimum surface tension, p < 0.003 (A), and higher maximum surface tension, p < 0.0115 (B). (C) Relative area of compression required to reach γmin was calculated as the percentage of area reduction needed to decrease the surface tension to the minimum value. Change in relative area in the 1st, 10th and 20th cycles was increased in MPS IIIA samples, * p = 0.0003, ** p < 0.0001. (D) Compressibility (ΔP/ΔA) was calculated as the slope value of the line passing through the minimum and maximum points of compression (minimum and maximum areas of the bubble) in the dynamic cycling curve (the steeper the slope, i.e., the higher the value, the lower the surfactant compressibility). * p = 0.0006, ** p = 0.0001, *** p < 0.0001. (E) Hysteresis was calculated as the enclosed area between the compression and expansion segments of the isotherms. * p = 0.0015, ** p = 0.0076. Data plotted as mean ± SD; two-tailed Students t-tests used for all analyses; n = 10 control and 6 MPS IIIA samples.
Cells 10 00849 g013
Table 1. Chromatographic gradient used for the analysis of butanolic products of HS.
TimeSolvent A
(%)
Solvent B
(%)
Flow
(µL/min)
0.019910.350
2.009550.350
2.0180200.350
5.0075250.350
5.011990.350
7.509910.350
8.509910.350
Table 2. Internal standard composition 100 µL per sample.
Standard Namenmol Added to Each
Sample at Extraction
Dimyristoyl-phosphatidylcholine (DMPC)10
Dimyristoyl phosphatidylethanolamine (DMPE)4
Dimyristoyl phosphatidylserine (DMPS)2
Dimyristoyl phosphatidylglycerol (DMPG)2
Dimyristoyl phosphatidic acid (DMPA)1
Lysophosphatidylcholine (LPC17:0)1
Sphingomyelin (SM16:0)1
Ceramide 12:02
Triacylglycerol (TAG)10
Table 3. ESI Diagnostic MS/MS scans.
MSScanMS/MS ModeRange (m/z)
ES+aFull positive2–1300
ES-aFull Negative2–1300
ES-aPartial Negative400–900
a = first injection.
Table 4. qRT-PCR primer sequences and optimal primer concentrations for housekeeping genes and genes of interest.
GenePrimer Sequence (5′ → 3′)Accession
Numbers
ACTBFWD-AGCTGTGCTATGTTGCTC
REV-CACTTCATGATGGAATTGAATGTAG
BC138614.1
HPRT1FWD-GCTGGATTACATTAAAGCACTGAAT
REV-AAAGTTTGCATTGTTTTACCAGTGT
NM_013556
YWHAZFWD-TTGAGCAGAAGACGGAAGGT
REV-GAAGCATTGGGGATCAAGAA
NM_011740
PGK1FWD-GTCGTGATGAGGGTGGACTT
REV-TTTGATGCTTGGAACAGCAG
NM_008828
RpPo1FWD-CAACCCTGAAGTGCTTGACAT
REV-AGGCAGATGGATCAGCCA
NM_007475.5
PPIAFWD-ACCAAACACAAACGGTTCCC
REV-TGCCTTCTTTCACCTTCCCAAA
NM_008907.1
SP-AFWD-TTTCCACCAATGGGCAGTCA
REV-AGAAGCCCCATCCAGGTAGT
NM_023134
SP-BFWD-GCTACTGCTGCTTCCTACCC
REV-TGGCACAGGTCATTAGCTCC
NM_147779
SP-CFWD-GGAGCACCGGAAACTCAGAA
REV-GGAGCCGCTGGTAGTCATAC
NM_011359
SP-D FWD-AGCCCAACAACAATGGTGGA
REV-CACAGATAACAAGGCGCTGC
NM_009160
ACTB, β-actin; HPRT1, hypoxanthine phosphoribosyltransferase 1; YWHAZ; tyrosine 3-mono-oxygenase/tryptophan 5-mono-oxygenase activation protein; PGK1, phosphoglycerate kinase 1; RpP0, ribosomal protein P0 and PPIA, peptidylprolyl isomerase A. FWD, forward primer; REV, reverse primer. SP-A, surfactant protein-A; SP-B, surfactant protein-B; SP-C, surfactant protein-C; SP-D, surfactant protein-D. FWD, forward primer; REV, reverse primer.
Publisher’s Note: MDPI stays neutral with regard to jurisdictional claims in published maps and institutional affiliations.

