
Right Ventricle Remodeling Metabolic Signature in Experimental Pulmonary Hypertension Models of Chronic Hypoxia and Monocrotaline Exposure

 , , , , and
Abstract
:1. Introduction
2. Material and Methods
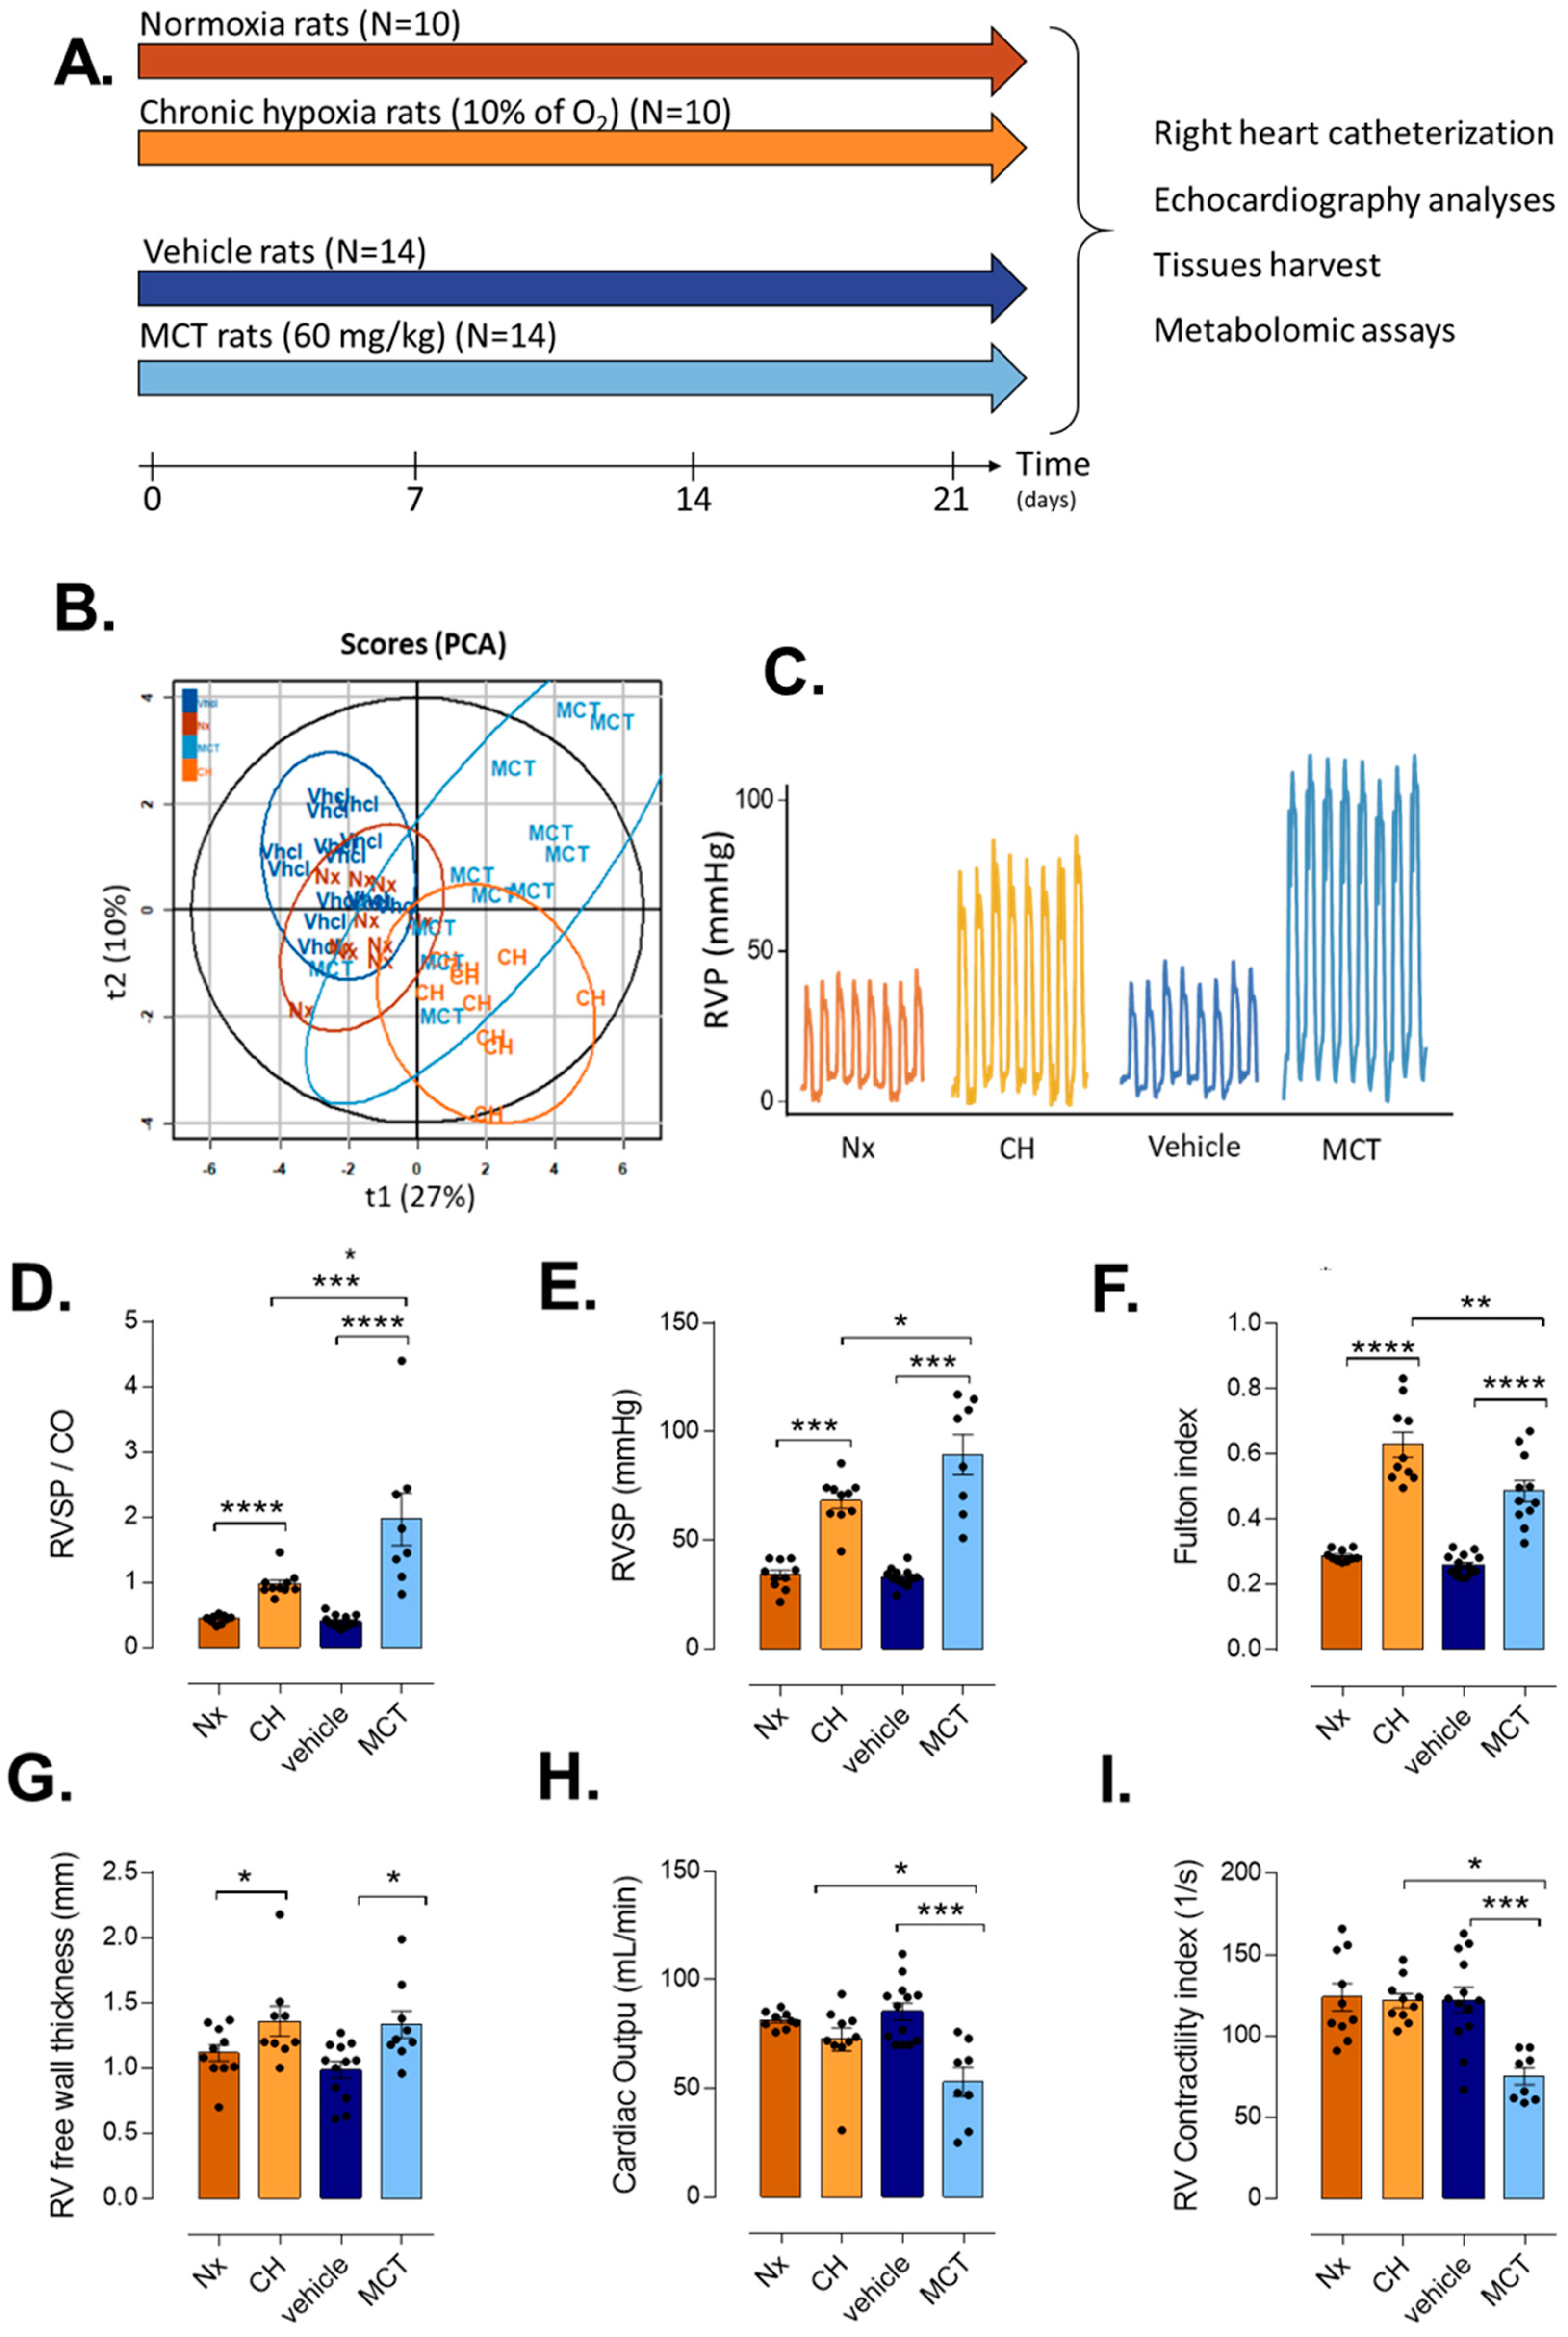
2.1. Animals
2.2. Echocardiographic Measurement
2.3. Right Heart Catheterization and Tissues Harvest
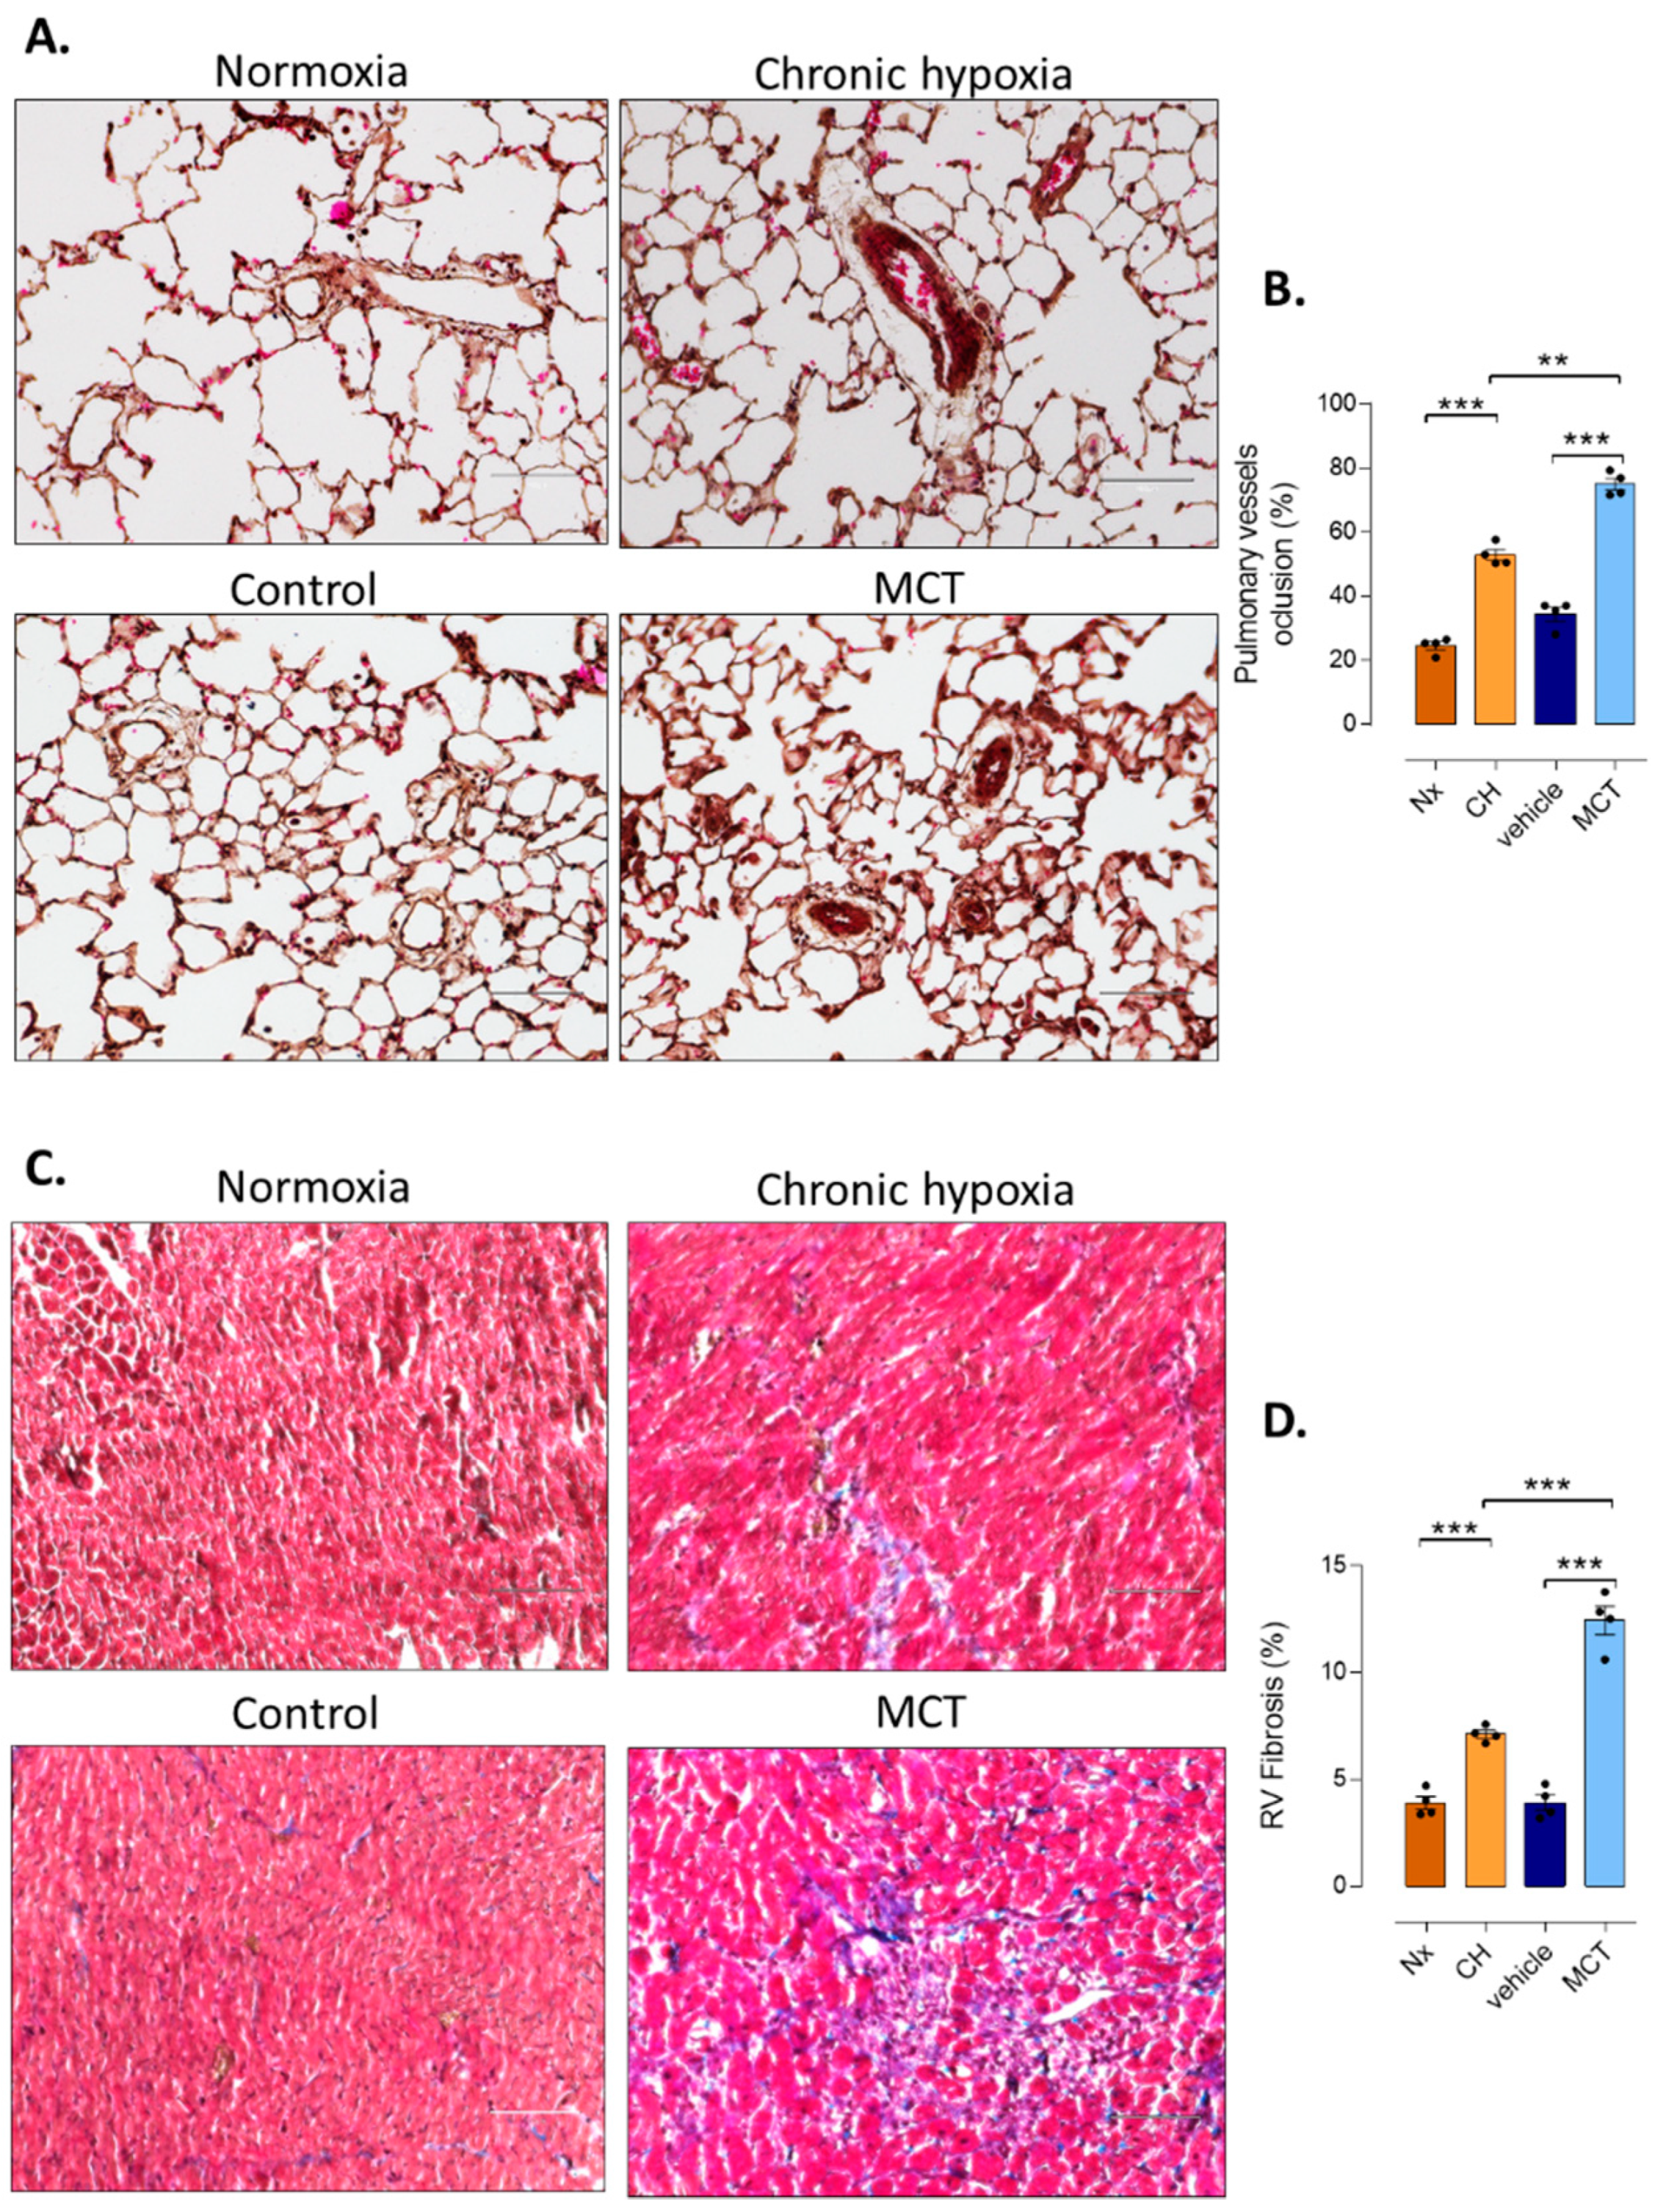
2.4. Pulmonary Vessel Remodeling Analysis
2.5. RV Fibrosis Assessment
2.6. Sample Preparation for LC-HRMS Analysis
2.7. LC-HRMS Conditions
2.8. Data Processing and Statistical Analysis
3. Results
3.1. RV Remodeling after CH and MCT-Exposure in Rats
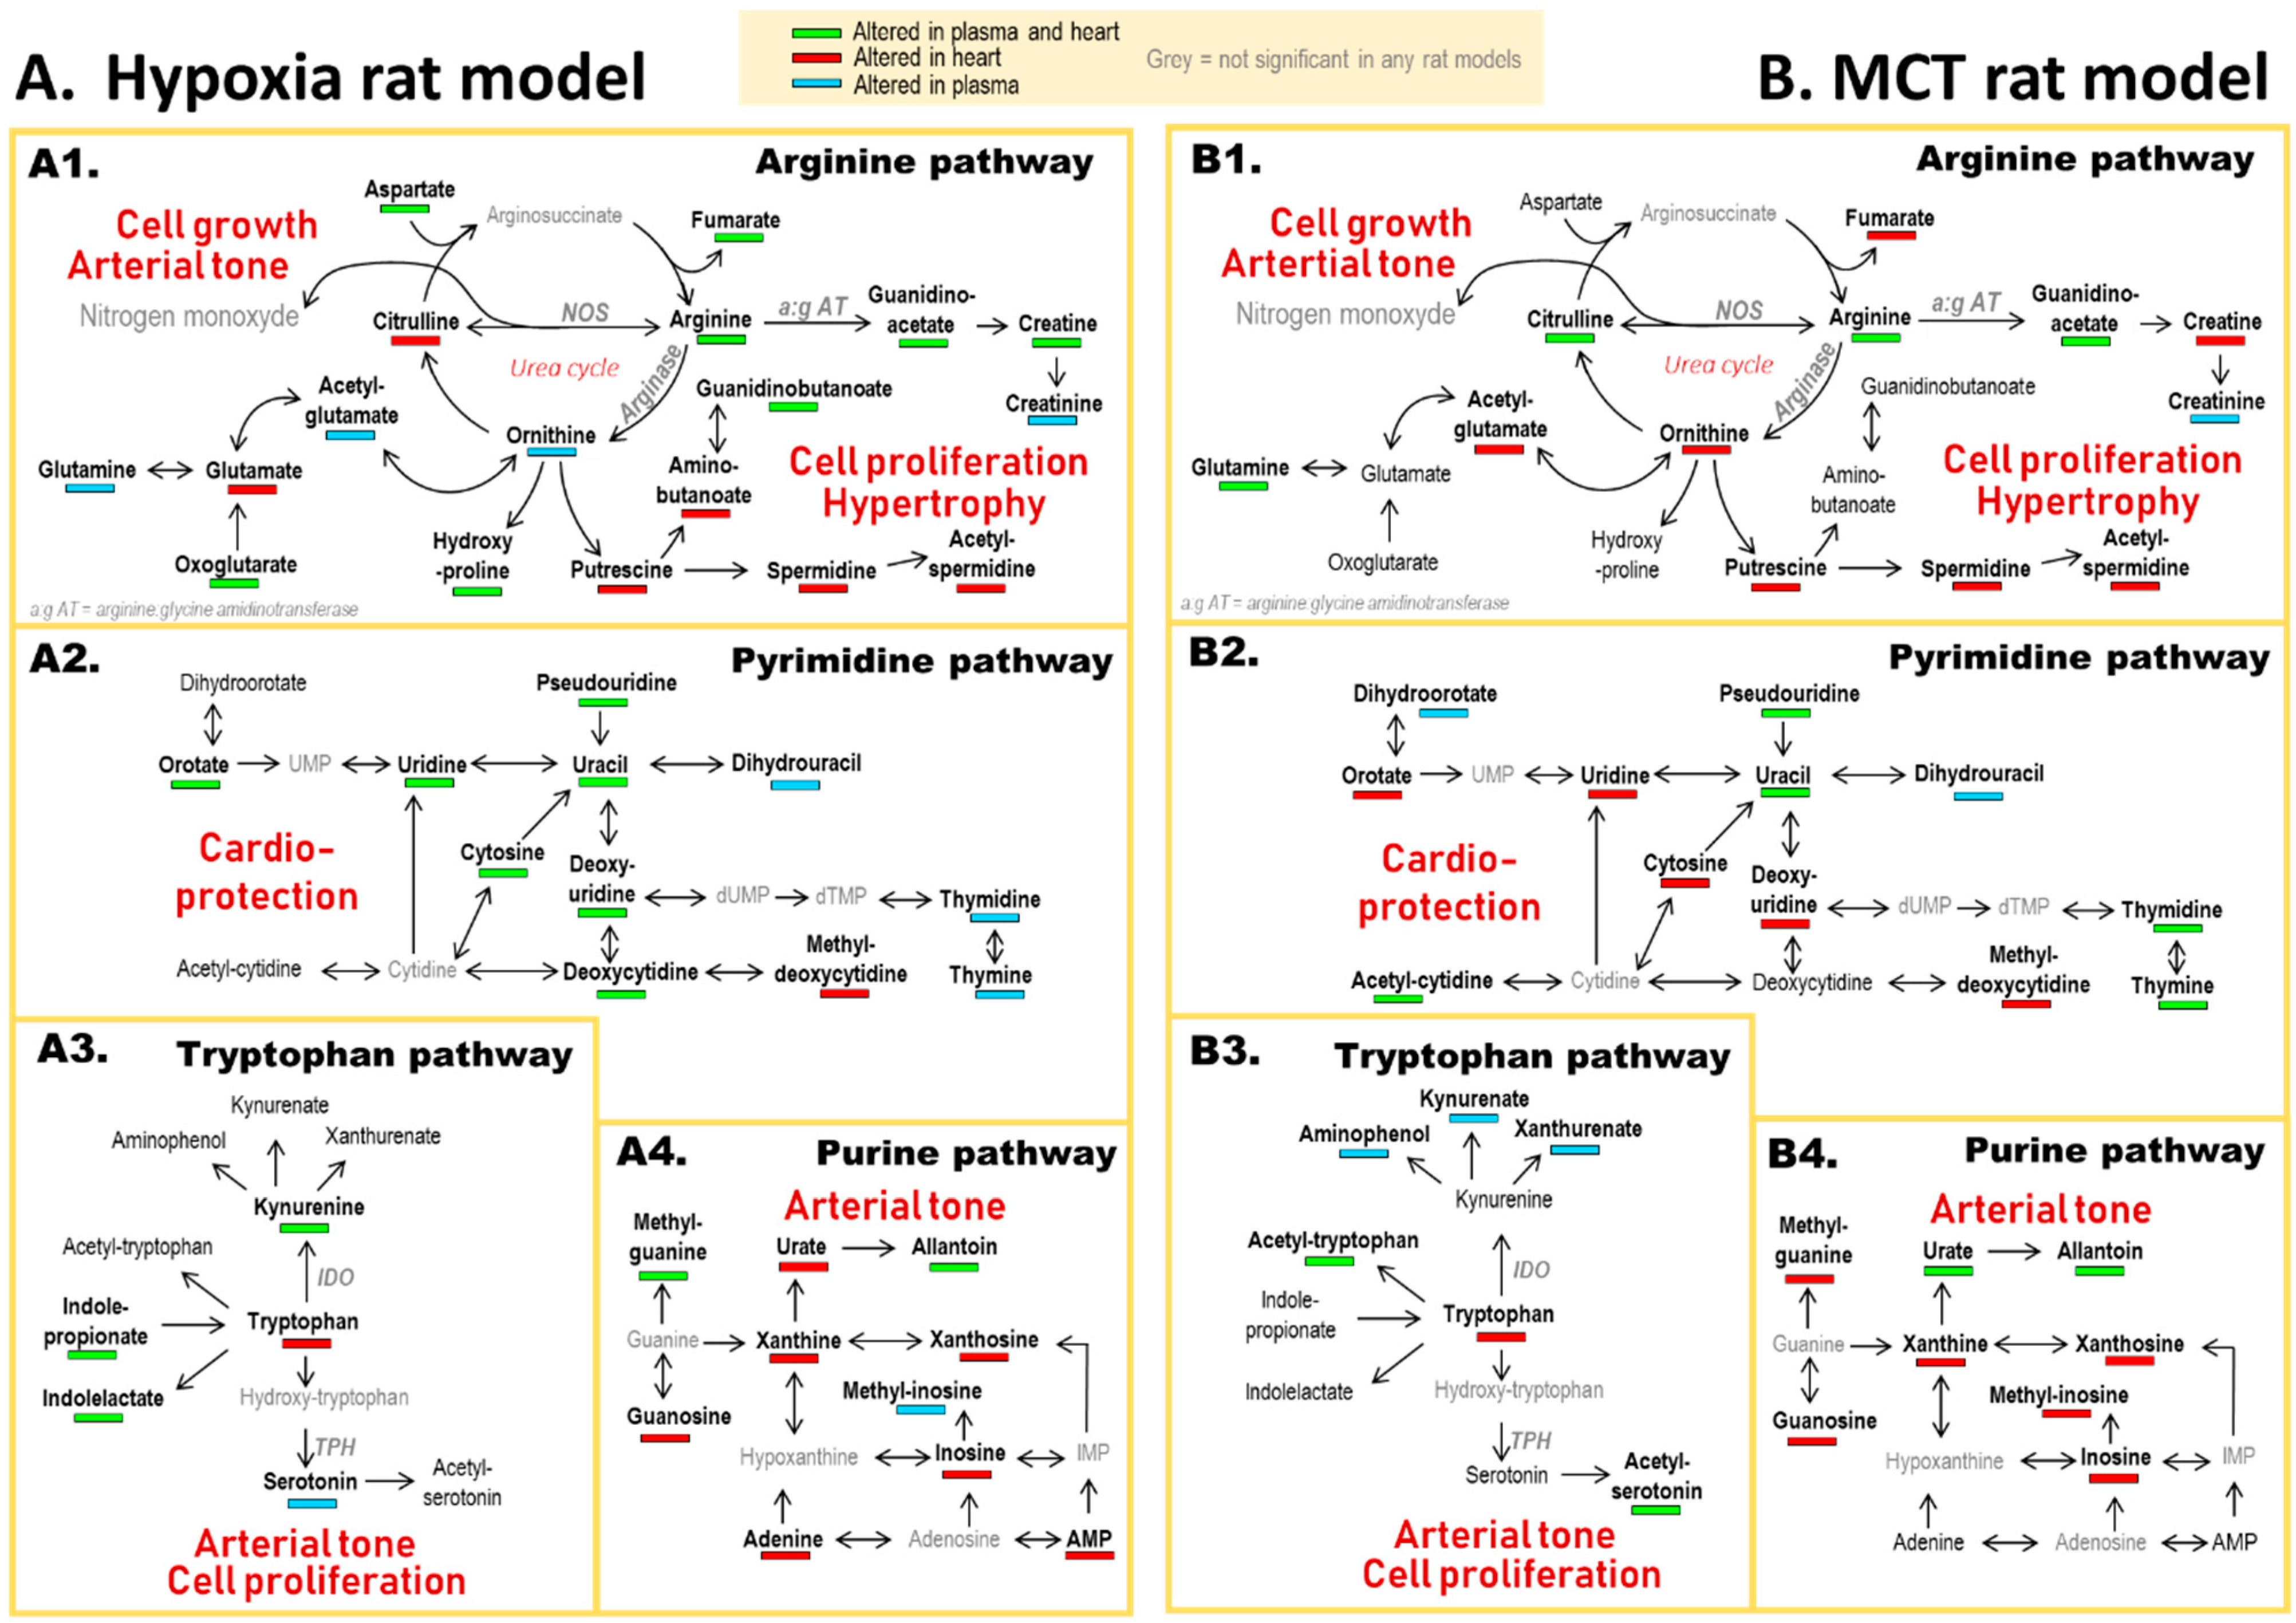
3.2. PH-Induced Cardiac Remodeling Associated with Alteration of Four Metabolic Pathways
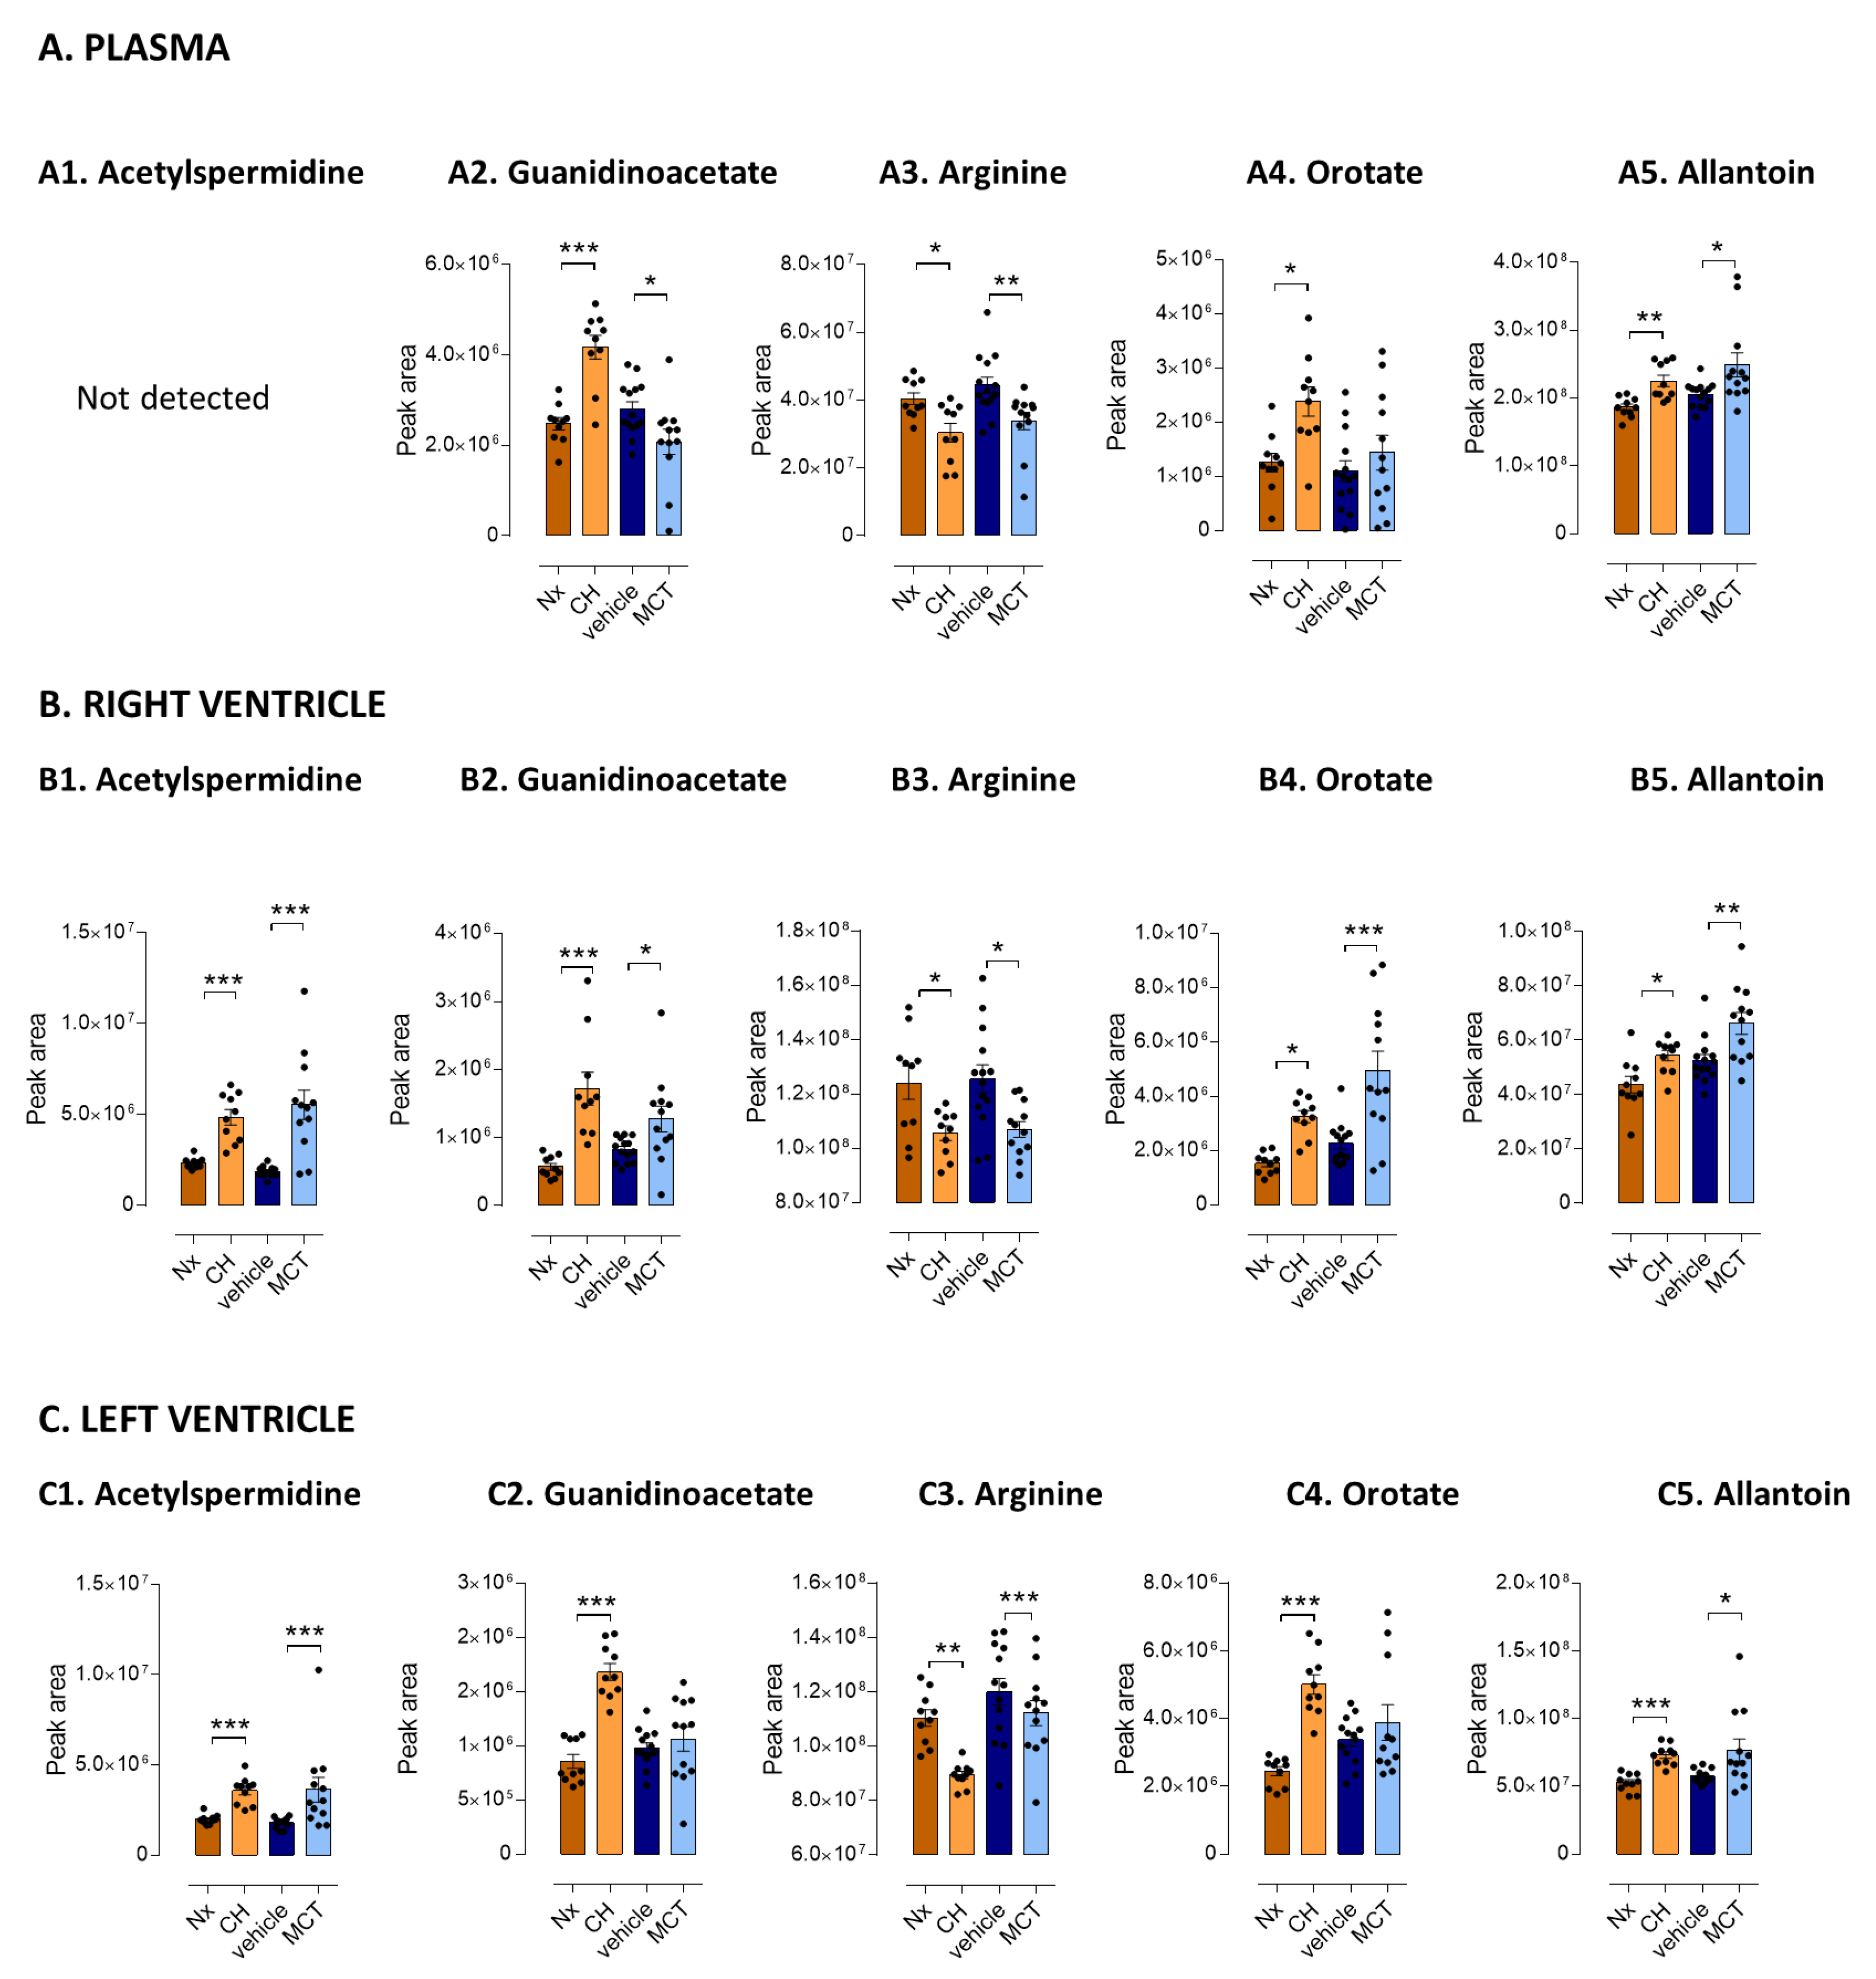
3.3. Five Metabolites as PH-Induced Cardiac Remodeling Metabolic Signature
3.4. Focus on Arginine Bioavailability and Enzymatic Activities
3.5. Correlation between Metabolic Signature and RV Function
4. Discussion
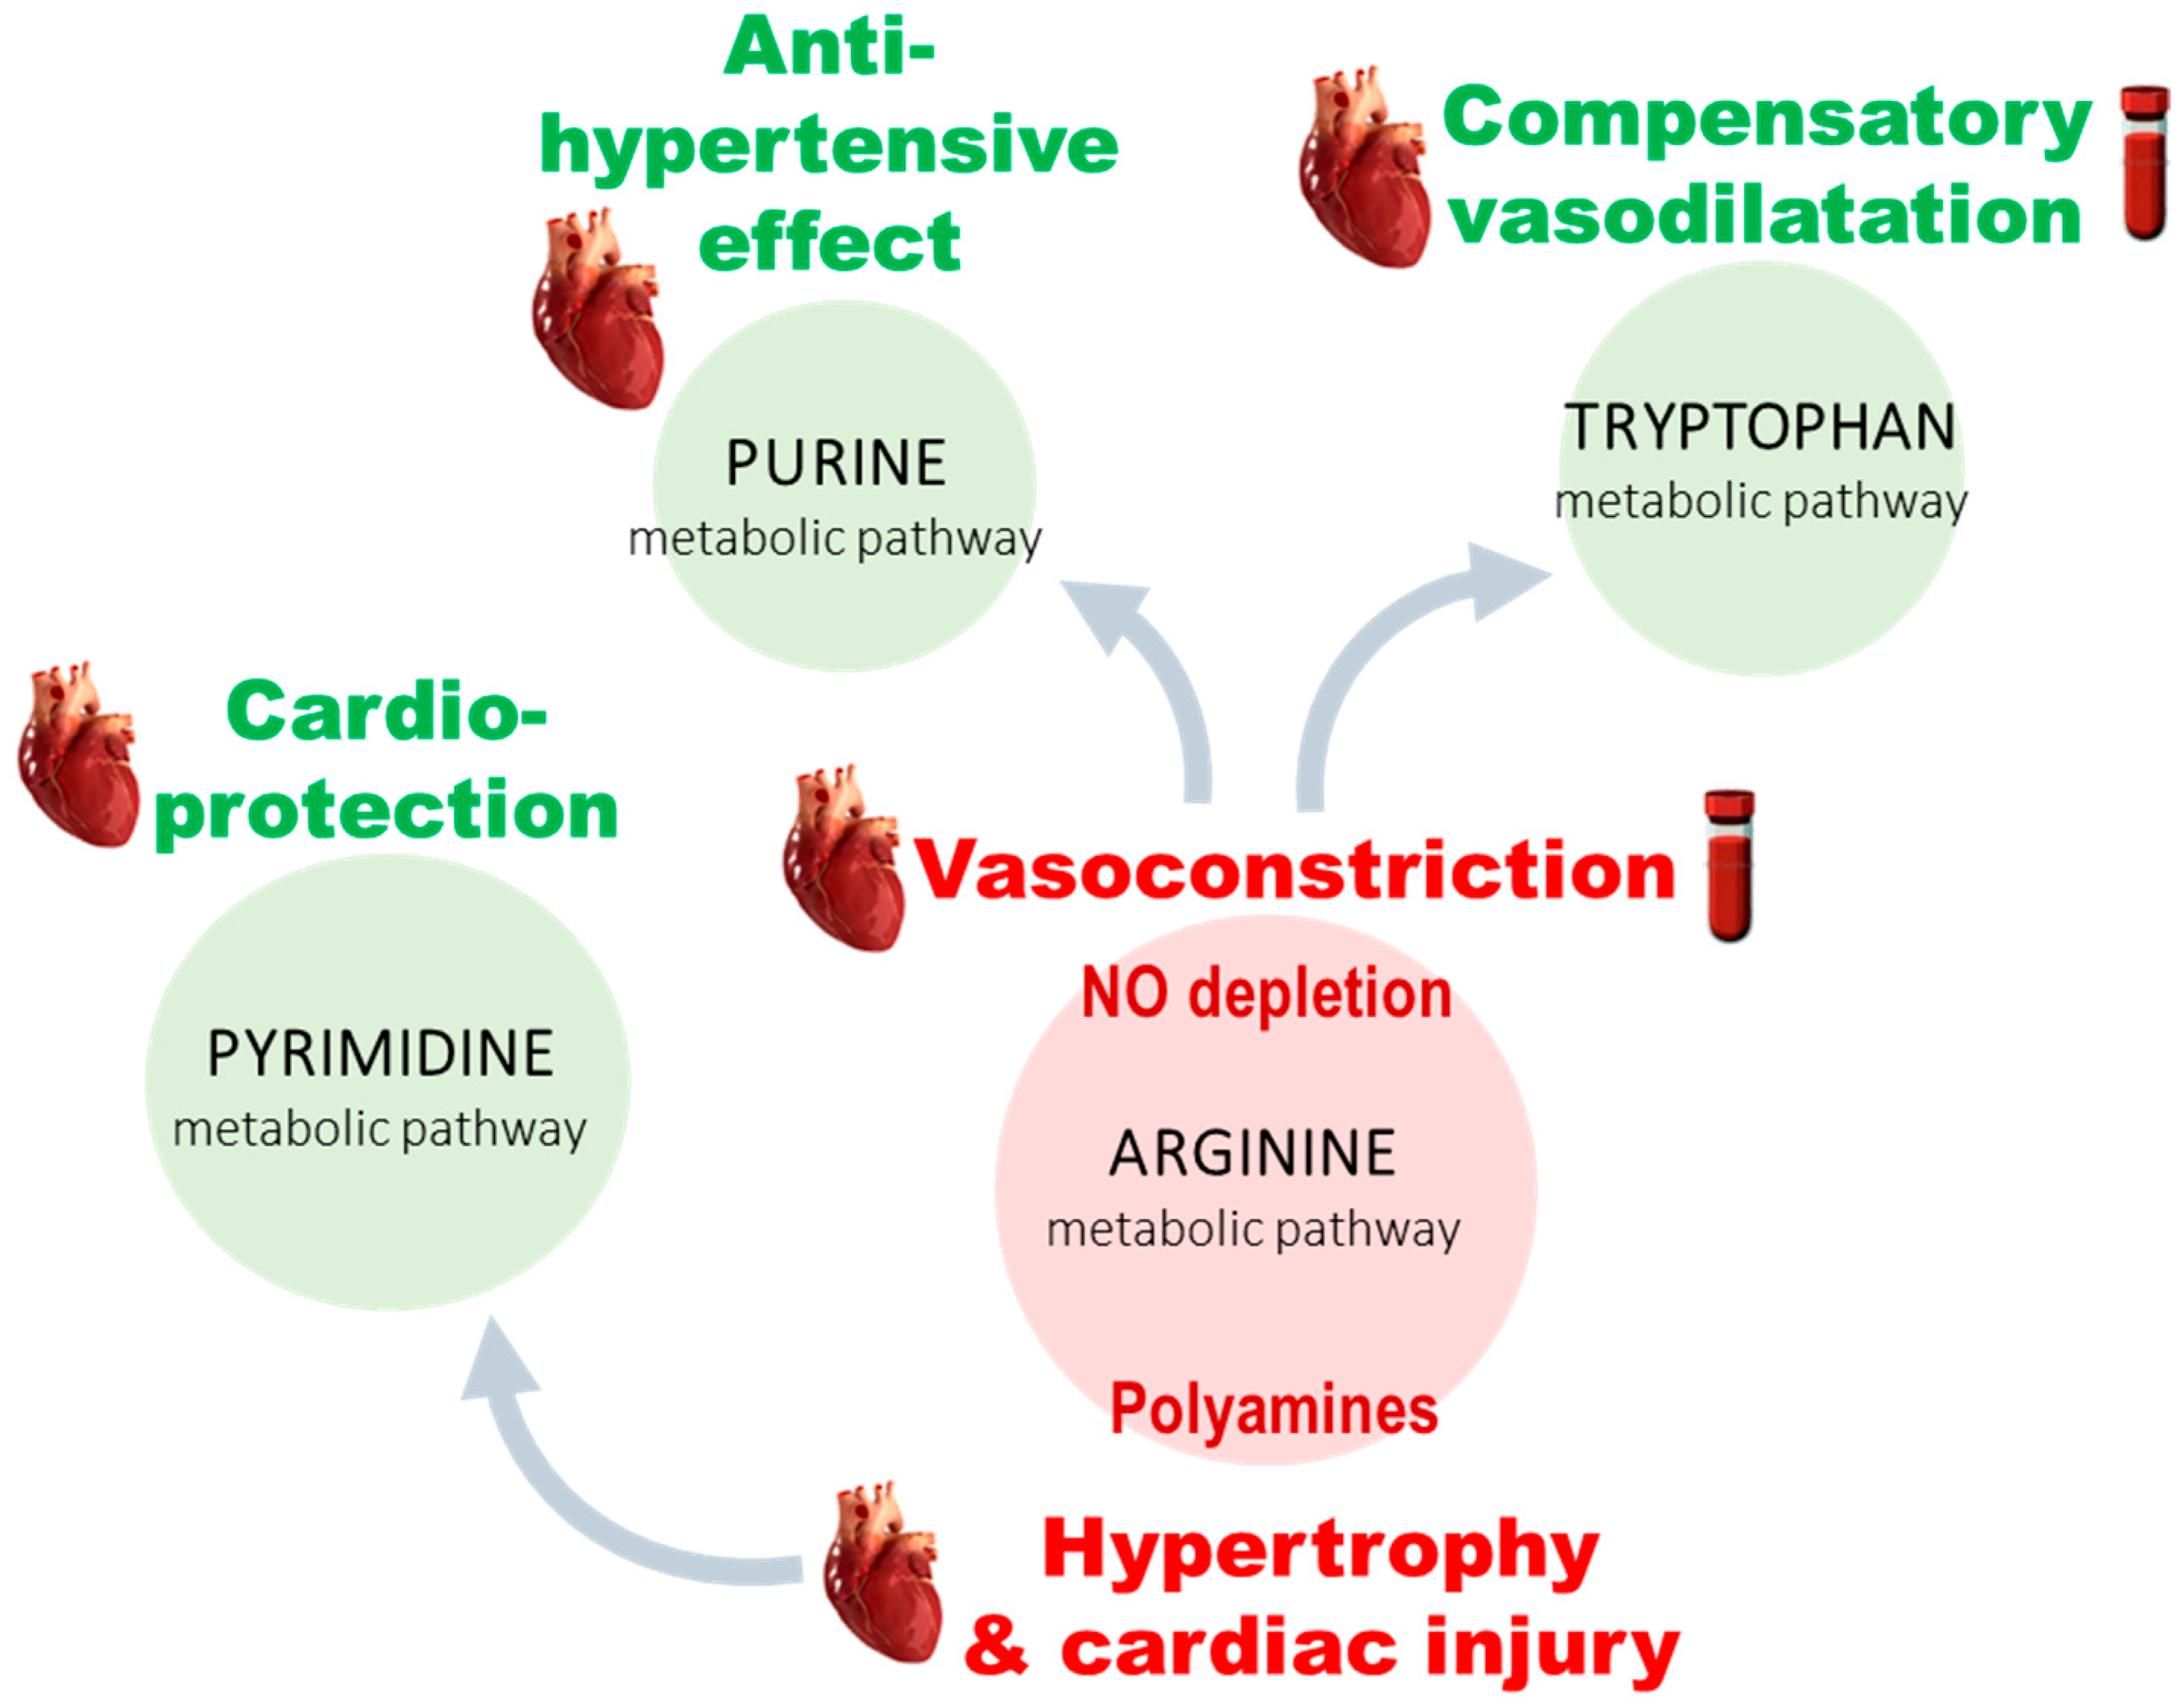
4.1. Arginine and Tryptophan Metabolic Pathways, a Duel for the Control of Pulmonary Arterial Tone in PH Plasma
4.2. A Balance between Vasoconstriction and Vasodilatation in the Heart
4.3. Polyamine Mediated Cardiac Hypertrophy
4.4. Metabolic Alteration Related to Cardioprotection
4.5. Limitations
Supplementary Materials
Author Contributions
Funding
Institutional Review Board Statement
Informed Consent Statement
Data Availability Statement
Conflicts of Interest
References
- Simonneau, G.; Montani, D.; Celermajer, D.; Denton, C.P.; Gatzoulis, M.A.; Krowka, M.; Williams, P.G.; Souza, R. Haemodynamic definitions and updated clinical classification of pulmonary hypertension. Eur. Respir. J. 2019, 53, 1801913. [Google Scholar] [CrossRef] [PubMed]
- Humbert, M.; Lau, E.; Montani, D.; Jaïs, X.; Sitbon, O.; Simonneau, G. Advances in Therapeutic Interventions for Patients with Pulmonary Arterial Hypertension. Circulation 2014, 130, 2189–2208. [Google Scholar] [CrossRef] [PubMed] [Green Version]
- Konstantinides, S.V.; Torbicki, A.; Agnelli, G.; Danchin, N.; Fitzmaurice, D.; Galiè, N.; Gibbs, J.S.R.; Huisman, M.V.; Humbert, M.; Kucher, N.; et al. 2014 ESC Guidelines on the diagnosis and management of acute pulmonary embolism: The Task Force for the Diagnosis and Management of Acute Pulmonary Embolism of the European Society of Cardiology (ESC) Endorsed by the European Respiratory Society (ERS). Eur. Heart J. 2014, 35, 3033–3073. [Google Scholar] [PubMed] [Green Version]
- Noordegraaf, A.V.; Chin, K.M.; Haddad, F.; Hassoun, P.M.; Hemnes, A.R.; Hopkins, S.R.; Kawut, S.M.; Langleben, D.; Lumens, J.; Naeije, R. Pathophysiology of the right ventricle and of the pulmonary circulation in pulmonary hypertension: An update. Eur. Respir. J. 2019, 53, 1801900. [Google Scholar] [CrossRef] [PubMed]
- Ghio, S.; Gavazzi, A.; Campana, C.; Inserra, C.; Klersy, C.; Sebastiani, R.; Arbustini, E.; Recusani, F.; Tavazzi, L. Independent and additive prognostic value of right ventricular systolic function and pulmonary artery pressure in patients with chronic heart failure. J. Am. Coll. Cardiol. 2001, 37, 183–188. [Google Scholar] [CrossRef] [Green Version]
- Konstam, M.A.; Kiernan, M.S.; Bernstein, D.; Bozkurt, B.; Jacob, M.; Kapur, N.K.; Kociol, R.D.; Lewis, E.F.; Mehra, M.R.; Pagani, F.D.; et al. Evaluation and Management of Right-Sided Heart Failure: A Scientific Statement From the American Heart Association. Circulation 2018, 137, e578–e622. [Google Scholar] [CrossRef]
- Ryan, J.J.; Huston, J.; Kutty, S.; Hatton, N.D.; Bowman, L.; Tian, L.; Herr, J.E.; Johri, A.M.; Archer, S.L. Right Ventricular Adaptation and Failure in Pulmonary Arterial Hypertension. Can. J. Cardiol. 2015, 31, 391–406. [Google Scholar] [CrossRef] [Green Version]
- De Veerdonk, M.C.V.; Bogaard, H.J.; Voelkel, N.F. The right ventricle and pulmonary hypertension. Heart Fail. Rev. 2016, 21, 259–271. [Google Scholar] [CrossRef]
- Sun, X.-Q.; Abbate, A.; Bogaard, H.-J. Role of cardiac inflammation in right ventricular failure. Cardiovasc. Res. 2017, 113, 1441–1452. [Google Scholar] [CrossRef] [Green Version]
- Junot, C.; Fenaille, F.; Colsch, B.; Bécher, F. High resolution mass spectrometry based techniques at the crossroads of metabolic pathways: High Resolution Mass Spectrometry for Metabolomics. Mass Spectrom. Rev. 2014, 33, 471–500. [Google Scholar] [CrossRef]
- Rhodes, C.; Ghataorhe, P.; Wharton, J.; Rue-Albrecht, K.C.; Hadinnapola, C.; Watson, G.; Bleda, M.; Haimel, M.; Coghlan, G.; Corris, P.A.; et al. Plasma Metabolomics Implicates Modified Transfer RNAs and Altered Bioenergetics in the Outcomes of Pulmonary Arterial Hypertension. Circulation 2017, 135, 460–475. [Google Scholar] [CrossRef] [PubMed]
- Lewis, G.D.; Ngo, D.; Hemnes, A.R.; Farrell, L.; Domos, C.; Pappagianopoulos, P.P.; Dhakal, B.P.; Souza, A.; Shi, X.; Pugh, M.E.; et al. Metabolic Profiling of Right Ventricular-Pulmonary Vascular Function Reveals Circulating Biomarkers of Pulmonary Hypertension. J. Am. Coll. Cardiol. 2016, 67, 174–189. [Google Scholar] [CrossRef] [PubMed] [Green Version]
- Nemutlu, E.; Zhang, S.; Xu, Y.Z.; Terzic, A.; Zhong, L.; Dzeja, P.D.; Cha, Y.M. Cardiac Resynchronization Therapy Induces Adaptive Metabolic Transitions in the Metabolomic Profile of Heart Failure. J. Card. Fail. 2015, 21, 460–469. [Google Scholar] [CrossRef] [Green Version]
- Zheng, H.-K.; Zhao, J.-H.; Yan, Y.; Lian, T.-Y.; Ye, J.; Wang, X.-J.; Wang, Z.; Jing, Z.-C.; He, Y.-Y.; Yang, P. Metabolic reprogramming of the urea cycle pathway in experimental pulmonary arterial hypertension rats induced by monocrotaline. Respir. Res. 2018, 19, 94. [Google Scholar] [CrossRef] [Green Version]
- Zhao, J.-H.; He, Y.-Y.; Guo, S.-S.; Yan, Y.; Wang, Z.; Ye, J.; Zhang, J.-L.; Wang, Y.; Pang, X.-B.; Xie, X.-M.; et al. Circulating Plasma Metabolomic Profiles Differentiate Rodent Models of Pulmonary Hypertension and Idiopathic Pulmonary Arterial Hypertension Patients. Am. J. Hypertens. 2019, 32, 1109–1117. [Google Scholar] [CrossRef] [PubMed]
- Boudah, S.; Olivier, M.-F.; Aros-Calt, S.; Oliveira, L.; Fenaille, F.; Tabet, J.-C.; Junot, C. Annotation of the human serum metabolome by coupling three liquid chromatography methods to high-resolution mass spectrometry. J. Chromatogr. B 2014, 966, 34–47. [Google Scholar] [CrossRef]
- Lambert, M.; Capuano, V.; Boet, A.; Tesson, L.; Bertero, T.; Nakhleh, M.K.; Remy, S.; Anegon, I.; Pechoux, C.; Hautefort, A.; et al. Characterization of Kcnk3 -Mutated Rat, a Novel Model of Pulmonary Hypertension. Circ. Res. 2019, 125, 678–695. [Google Scholar] [CrossRef]
- Quiñones, M.A.; Otto, C.M.; Stoddard, M.; Waggoner, A.; Zoghbi, W.A. Recommendations for quantification of Doppler echocardiography: A report from the Doppler quantification task force of the nomenclature and standards committee of the American Society of Echocardiography. J. Am. Soc. Echocardiogr. 2002, 15, 167–184. [Google Scholar] [CrossRef] [Green Version]
- Tan, C.; Rubenson, D.; Srivastava, A.; Mohan, R.; Smith, M.R.; Billick, K.; Bardarian, S.; Heywood, J.T. Left ventricular outflow tract velocity time integral outperforms ejection fraction and Doppler-derived cardiac output for predicting outcomes in a select advanced heart failure cohort. Cardiovasc. Ultrasound 2017, 15, 18. [Google Scholar] [CrossRef]
- Pozzoli, M.; Capomolla, S.; Cobelli, F.; Tavazzi, L. Reproducibility of Doppler indices of left ventricular systolic and diastolic function in patients with severe chronic heart failure. Eur. Heart J. 1995, 16, 194–200. [Google Scholar] [CrossRef]
- Mowat, D.H.R.; Haites, N.E.; Rawles, J.M. Aortic blood velocity measurement in healthy adults using a simple ultrasound technique. Cardiovasc. Res. 1983, 17, 75–80. [Google Scholar] [CrossRef]
- Giacomoni, F.; Le Corguille, G.; Monsoor, M.; Landi, M.; Pericard, P.; Pétéra, M.; Duperier, C.; Tremblay-Franco, M.; Martin, J.F.; Jacob, D.; et al. Gene expression Workflow4Metabolomics: A collaborative research infrastructure for computational metabolomics. Bioinformatics 2015, 31, 1493–1495. [Google Scholar] [CrossRef] [Green Version]
- Fiehn, O.; Robertson, D.; Griffin, J.; Van Der Werf, M.; Nikolau, B.; Morrison, N.; Sumner, L.W.; Goodacre, R.; Hardy, N.W.; Taylor, C.; et al. The metabolomics standards initiative (MSI). Metabolomics 2007, 3, 175–178. [Google Scholar] [CrossRef]
- Kanehisa, M.; Goto, S. KEGG: Kyoto Encyclopedia of Genes and Genomes. Nucleic Acids Res. 2000, 28, 27–30. [Google Scholar] [CrossRef]
- Zhao, Y.D.; Chu, L.; Lin, K.; Granton, E.; Yin, L.; Peng, J.; Hsin, M.; Wu, L.; Yu, A.; Waddell, T.; et al. A Biochemical Approach to Understand the Pathogenesis of Advanced Pulmonary Arterial Hypertension: Metabolomic Profiles of Arginine, Sphingosine-1-Phosphate, and Heme of Human Lung. PLoS ONE 2015, 10, e0134958. [Google Scholar] [CrossRef] [Green Version]
- Shao, F.-J.; Ying, Y.-T.; Tan, X.; Zhang, Q.-Y.; Liao, W.-T. Metabonomics Profiling Reveals Biochemical Pathways Associated with Pulmonary Arterial Hypertension in Broiler Chickens. J. Proteome Res. 2018, 17, 3445–3453. [Google Scholar] [CrossRef]
- Maarsingh, H.; Pera, T.; Meurs, H. Arginase and pulmonary diseases. Naunyn-Schmiedeberg’s Arch. Pharmacol. 2008, 378, 171–184. [Google Scholar] [CrossRef] [Green Version]
- Xu, W.; Kaneko, F.T.; Zheng, S.; Comhair, S.A.A.; Janocha, A.J.; Goggans, T.; Thunnissen, F.B.J.M.; Farver, C.; Hazen, S.L.; Jennings, C.; et al. Increased arginase II and decreased NO synthesis in endothelial cells of patients with pulmonary arterial hypertension. FASEB J. 2004, 18, 1746–1748. [Google Scholar] [CrossRef] [Green Version]
- Pearson, D.L.; Dawling, S.; Walsh, W.F.; Haines, J.L.; Christman, B.W.; Bazyk, A.; Scott, N.; Summar, M.L. Neonatal pulmonary hypertension: Urea-cycle intermediates, nitric oxide production, and carbamoyl-phosphate synthetase function. N. Engl. J. Med. 2001, 344, 1832–1838. [Google Scholar] [CrossRef]
- Antigny, F.; Mercier, O.; Humbert, M.; Sabourin, J. Excitation-contraction coupling and relaxation alteration in right ventricular remodelling caused by pulmonary arterial hypertension. Arch. Cardiovasc. Dis. 2020, 113, 70–84. [Google Scholar] [CrossRef]
- Atkinson, J.E.; Olson, J.W.; Altiere, R.J.; Gillespie, M.N. Evidence that hypoxic pulmonary vascular remodeling in rats is polyamine depedent. J. Appl. Physiol. 1987, 62, 1562–1568. [Google Scholar] [CrossRef]
- Choi, Y.H.; Park, H.Y. Anti-inflammatory effects of spermidine in lipopolysaccharide-stimulated BV2 microglial cells. J. Biomed. Sci. 2012, 19, 31. [Google Scholar] [CrossRef] [PubMed] [Green Version]
- Dorfmuller, P.; Perros, F.; Balabanian, K.; Humbert, M. Inflammation in pulmonary arterial hypertension. Eur. Respir. J. 2003, 22, 358–363. [Google Scholar] [CrossRef] [PubMed] [Green Version]
- Papapetropoulos, A.; Madri, J.A.; Sessa, W.C. Nitric oxide production contributes to the angiogenic properties of vascular endothelial growth factor in human endothelial cells. J. Clin. Investig. 1997, 100, 3131–3139. [Google Scholar] [CrossRef]
- DDhaun, N.; Vachiéry, J.-L.; Benza, R.L.; Naeije, R.; Hwang, L.-J.; Liu, X.; Teal, S.; Webb, D.J. Endothelin antagonism and uric acid levels in pulmonary arterial hypertension: Clinical associations. J. Heart Lung Transplant. 2014, 33, 521–527. [Google Scholar] [CrossRef] [PubMed]
- Girgis, R.E.; Champion, H.C.; Diette, G.B.; Johns, R.A.; Permutt, S.; Sylvester, J.T. Decreased Exhaled Nitric Oxide in Pulmonary Arterial Hypertension: Response to bosentan therapy. Am. J. Respir. Crit. Care Med. 2005, 172, 352–357. [Google Scholar] [CrossRef]
- Kaneko, F.T.; Arroliga, A.C.; Dweik, R.A.; Comhair, S.A.; Laskowski, D.; Oppedisano, R.; Thomassen, M.J.; Erzurum, S.C. Biochemical Reaction Products of Nitric Oxide as Quantitative Markers of Primary Pulmonary Hypertension. Am. J. Respir. Crit. Care Med. 1998, 158, 917–923. [Google Scholar] [CrossRef] [PubMed]
- Kaluarachchi, D.C.; Smith, C.J.; Klein, J.M.; Murray, J.C.; Dagle, J.M.; Ryckman, K.K. Polymorphisms in urea cycle enzyme genes are associated with persistent pulmonary hypertension of the newborn. Pediatric Res. 2017, 83, 142–147. [Google Scholar] [CrossRef]
- Thomas, S.R.; Mohr, D.; Stocker, R. Nitric Oxide Inhibits Indoleamine 2,3-Dioxygenase Activity in Interferon-y Primed Mononuclear Phagocytes. J. Biol. Chem. 1994, 269, 14457–14464. [Google Scholar] [CrossRef]
- Xiao, Y.; Christou, H.; Liu, L.; Visner, G.; Mitsialis, S.A.; Kourembanas, S.; Liu, H. Endothelial Indoleamine 2,3-Dioxygenase Protects against Development of Pulmonary Hypertension. Am. J. Respir. Crit. Care Med. 2013, 188, 482–491. [Google Scholar] [CrossRef] [Green Version]
- Lederer, D.J.; Horn, E.M.; Rosenzweig, E.B.; Karmally, W.; Jahnes, M.; Barst, R.J.; Kawut, S.M. Plasma serotonin levels are normal in pulmonary arterial hypertension. Pulm. Pharmacol. Ther. 2008, 21, 112–114. [Google Scholar] [CrossRef] [PubMed] [Green Version]
- Eddahibi, S.; Humbert, M.; Fadel, E.; Raffestin, B.; Darmon, M.; Capron, F.; Simonneau, G.; Dartevelle, P.; Hamon, M.; Adnot, S. Serotonin transporter overexpression is responsible for pulmonary artery smooth muscle hyperplasia in primary pulmonary hypertension. J. Clin. Investig. 2001, 108, 1109–1111. [Google Scholar] [CrossRef]
- Nagaya, N.; Uematsu, M.; Satoh, T.; Kyotani, S.; Sakamaki, F.; Nakanishi, N.; Yamagishi, M.; Kunieda, T.; Miyatake, K. Serum Uric Acid Levels Correlate with the Severity and the Mortality of Primary Pulmonary Hypertension. Am. J. Respir. Crit. Care Med. 1999, 160, 487–492. [Google Scholar] [CrossRef] [PubMed]
- Voelkel, M.A.; Wynne, K.M.; Badesch, D.B.; Groves, B.M.; Voelkel, N.F. Hyperuricemia in Severe Pulmonary Hypertension. Chest 2000, 117, 19–24. [Google Scholar] [CrossRef] [PubMed] [Green Version]
- Farthing, D.E.; Farthing, C.A.; Xi, L. Inosine and hypoxanthine as novel biomarkers for cardiac ischemia: From bench to point-of-care. Exp. Biol. Med. 2015, 240, 821–831. [Google Scholar] [CrossRef]
- Leyva, F.; Anker, S.; Swan, J.W.; Godsland, I.F.; Wingrove, C.S.; Chua, T.-P.; Stevenson, J.C.; Coats, A.S. Serum uric acid as an index of impaired oxidative metabolism in chronic heart failure. Eur. Heart J. 1997, 18, 858–865. [Google Scholar] [CrossRef] [PubMed] [Green Version]
- Hyldebrandt, J.A.; Støttrup, N.B.; Frederiksen, C.A.; Heiberg, J.; Birkler, R.I.D.; Johannsen, M.; Schmidt, M.R.; Ravn, H.B. Citric Acid Cycle Metabolites Predict the Severity of Myocardial Stunning and Mortality in Newborn Pigs. Pediatr. Crit. Care Med. 2016, 17, e567–e574. [Google Scholar] [CrossRef] [PubMed]
- Chen, M.-F.; Tsai, J.-T.; Chen, L.-J.; Wu, T.-P.; Yang, J.-J.; Yin, L.-T.; Yang, Y.-L.; Chiang, T.-A.; Lu, H.-L.; Wu, M.-C. Antihypertensive Action of Allantoin in Animals. BioMed Res. Int. 2014, 2014, 1–6. [Google Scholar] [CrossRef]
- Wang, Y.; Liu, H.; McKenzie, G.; Witting, P.K.; Stasch, J.P.; Hahn, M.; Changsirivathanathamrong, D.; Wu, B.J.; Ball, H.J.; Thomas, S.R.; et al. Kynurenine is an endothelium-derived relaxing factor produced during inflammation. Nat. Med. 2010, 16, 279–285. [Google Scholar] [CrossRef] [Green Version]
- Caldarera, C.M.; Casti, A.; Rossoni, C.; Visioli, O. Polyamines and noradrenaline following myocardial hypertrophy. J. Mol. Cell. Cardiol. 1971, 3, 121–126. [Google Scholar] [CrossRef]
- Meana, C.; Rubín, J.M.; Bordallo, C.; Suarez, L.; Bordallo, J.; Sanchez, M. Correlation between endogenous polyamines in human cardiac tissues and clinical parameters in patients with heart failure. J. Cell. Mol. Med. 2016, 20, 302–312. [Google Scholar] [CrossRef] [PubMed]
- Giordano, E.; Flamigni, F.; Guarnieri, C.; Muscari, C.; Pignatti, C.; Stefanelli, C.; Tantini, B.; Caldarera, C.M. Polyamines in Cardiac Physiology and Disease. Open Heart Fail. J. 2010, 3, 25–30. [Google Scholar] [CrossRef]
- Flamigni, F.; Rossoni, C.; Stefanelli, C.; Caldarera, C.M. Polyamine metabolism and function in the heart. J. Mol. Cell. Cardiol. 1986, 18, 3–11. [Google Scholar] [CrossRef]
- Stryeck, S.; Birner-Gruenberger, R.; Madl, T. Integrative metabolomics as emerging tool to study autophagy regulation. Microb. Cell 2017, 4, 240–258. [Google Scholar] [CrossRef] [PubMed] [Green Version]
- Li, Z.; Wang, J.; Yang, X. Functions of Autophagy in Pathological Cardiac Hypertrophy. Int. J. Biol. Sci. 2015, 11, 672–678. [Google Scholar] [CrossRef] [PubMed] [Green Version]
- Huang, C.-J.; Moczydlowski, E. Cytoplasmic Polyamines as Permeant Blockers and Modulators of the Voltage-Gated Sodium Channel. Biophys. J. 2001, 80, 1262–1279. [Google Scholar] [CrossRef] [Green Version]
- Williams, K. Modulation and Block of Ion Channels: A New Biology of Polyamines. Cell. Signal. 1997, 9, 1–13. [Google Scholar] [CrossRef]
- Pottosin, I.; Velarde-Buendía, A.M.; Bose, J.; Fuglsang, A.T.; Shabala, S. Polyamines cause plasma membrane depolarization, activate Ca2+-, and modulate H+-ATPase pump activity in pea roots. J. Exp. Bot. 2014, 65, 2463–2472. [Google Scholar] [CrossRef] [PubMed] [Green Version]
- Athwal, G.S.; Huber, S.C. Divalent cations and polyamines bind to loop 8 of 14-3-3 proteins, modulating their interaction with phosphorylated nitrate reductase. Plant J. 2002, 29, 119–129. [Google Scholar] [CrossRef] [Green Version]
- Rajan, S.; Preisig-Müller, R.; Wischmeyer, E.; Nehring, R.; Hanley, P.J.; Renigunta, V.; Musset, B.; Schlichthörl, G.; Derst, C.; Karschin, A.; et al. Interaction with 14-3-3 proteins promotes functional expression of the potassium channels TASK-1 and TASK-3. J. Physiol. 2002, 545, 13–26. [Google Scholar] [CrossRef]
- Kilisch, M.; Lytovchenko, O.; Arakel, E.C.; Bertinetti, D.; Schwappach, B. A dual phosphorylation switch controls 14-3-3-dependent cell surface expression of TASK-1. J. Cell Sci. 2016, 129, 831–842. [Google Scholar] [CrossRef] [Green Version]
- Lambert, M.; Boet, A.; Rucker-Martin, C.; Mendes-Ferreira, P.; Capuano, V.; Hatem, S.; Adão, R.; Brás-Silva, C.; Hautefort, A.; Michel, J.-B.; et al. Loss of KCNK3 is a hallmark of RV hypertrophy/dysfunction associated with pulmonary hypertension. Cardiovasc. Res. 2018, 114, 880–893. [Google Scholar] [CrossRef] [PubMed] [Green Version]
- Smoleński, R.T.; De Jong, J.W.; Janssen, M.; Lachno, D.R.; Żydowo, M.M.; Tavenier, M.; Huizer, T.; Yacoub, M.H. Formation and Breakdown of Uridine in Ischemic Hearts of Rats and Humans. J. Mol. Cell. Cardiol. 1993, 25, 67–74. [Google Scholar] [CrossRef] [PubMed]
- Rosenfeldt, F.L. Editorial: Metabolic Supplementation with Orotic Acid and Magnesium Orotate. Cardiovasc. Drugs Ther. 1998, 12, 147–152. [Google Scholar] [CrossRef]
- Richards, S.M.; Conyers, R.A.; Fisher, J.L.; Rosenfeldt, F.L. Cardioprotection by Orotic Acid: Metabolism and Mechanism of Action. J. Mol. Cell. Cardiol. 1997, 29, 3239–3250. [Google Scholar] [CrossRef]
- Muntean, D.M.; Firă-Mladinescu, O.; Mirica, N.S.; Duicu, O.M.; Trancotă, S.L.; Sturza, A. Metabolic therapy: Cardioprotective effects of orotic acid and its derivatives. Biomed. Rev. 2010, 21, 47–55. [Google Scholar] [CrossRef] [Green Version]
- Porto, L.C.J.; De Castro, C.H.; Savergnini, S.S.Q.; Santos, S.H.S.; Ferreira, A.V.M.; Cordeiro, L.M.D.S.; Sobrinho, D.B.D.S.; Santos, R.A.S.; De Almeida, A.P.; Botion, L.M. Improvement of the energy supply and contractile function in normal and ischemic rat hearts by dietary orotic acid. Life Sci. 2012, 90, 476–483. [Google Scholar] [CrossRef] [PubMed] [Green Version]


| Normoxia (Nx) | CH-PH | Nx vs. CH-PH | Vehicle | MCT-PH | Vhcl vs. MCT-PH | CH-PH vs. MCT-PH | ||
|---|---|---|---|---|---|---|---|---|
| (Vhcl) | ||||||||
| Morphometric | Body weight (g) | 259.8 ± 19.14 | 228 ± 19.22 | ** | 277.64 ± 22.82 | 249.27 ± 56.16 | ns | * |
| Parameters | RV weight (mg) | 173.6 ± 13.43 | 381.2 ± 81.79 | *** | 154.33 ± 17.4 | 268.27 ± 70.6 | *** | ** |
| LV + Septum weight (mg) | 603.3 ± 56.57 | 606.6 ± 64.14 | ns | 595.2 ± 37.4 | 554.73 ± 111.69 | ns | ns | |
| Fulton’s index | 0.29 ± 0.02 | 0.63 ± 0.12 | *** | 0.26 ± 0.03 | 0.49 ± 0.11 | *** | * | |
| TAPSE (mm) | 0.24 ± 0.05 | 0.26 ± 0.06 | ns | 0.3 ± 0.01 | 0.23 ± 0.04 | ** | ns | |
| RV Parameters | VTI-PA | 6.38 ± 0.62 | 5.65 ± 0.56 | * | 6.63 ± 0.76 | 4.29 ± 1.21 | *** | * |
| PA diam (mm) | 2.44 ± 0.15 | 2.26 ± 0.24 | ns | 2.4 ± 0.2 | 2.29 ± 0.28 | ns | ns | |
| PAAT (ms) | 34.3 ± 3.56 | 27 ± 3.6 | ** | 32.43 ± 1.71 | 23.44 ± 4.05 | *** | ns | |
| RVET (ms) | 78.6 ± 5.88 | 80.7 ± 5.98 | ns | 80.71 ± 5.63 | 76.22 ± 7.04 | ns | ns | |
| Cycle length (ms) | 159.1 ± 10.32 | 160.2 ± 8.6 | ns | 154.5 ± 21.21 | 170.44 ± 16.05 | ns | ns | |
| RV free wall thickness (mm) | 1.12 ± 0.16 | 1.36 ± 0.23 | * | 0.99 ± 0.18 | 1.33 ± 0.23 | ** | ns | |
| RV_FS (%) | 47.94 ± 8.16 | 39.02 ± 11.18 | ns | 44.13 ± 6.66 | 32.65 ± 14.76 | ns | ns | |
| VTI-Ao | 5.9 ± 0.92 | 5.57 ± 0.72 | ns | 8.16 ± 0.91 | 5.88 ± 1.29 | *** | ns | |
| LV Parameters | LV free wall thickness (mm) | 1.53 ± 0.24 | 1.85 ± 0.24 | * | 1.64 ± 0.17 | 1.48 ± 0.17 | ns | ** |
| LV_FS (%) | 49.16 ± 8.79 | 48.11 ± 8.21 | ns | 41.47 ± 6.8 | 48.89 ± 8.13 | ns | ns | |
| Closed Chest Heart | RVS.P (mmHg) | 34.1 ± 6.7 | 68.26 ± 10.83 | *** | 32.83 ± 4.01 | 89.46 ± 26.02 | *** | * |
| Catheterization | HR (beat/min) | 346.6 ± 48.09 | 376.4 ± 43.29 | ns | 346.62 ± 43.26 | 333.38 ± 39.75 | ns | ns |
| MaxdPdt (mmHg/s) | 2629.61 ± 1444.89 | 4448.63 ± 1990.74 | * | 3422.57 ± 627.95 | 6913.86 ± 1317.87 | *** | * | |
| MindPdt (mmHg/s) | −1095.54 ± 428.09 | −2265.96 ± 921.23 | ** | −1385.43 ± 306.83 | −2194.57 ± 568.54 | *** | ns | |
| CO (ml/min) | 81.55 ± 3.82 | 72.56 ± 16.57 | ns | 85.35 ± 14.13 | 53 ± 18.84 | *** | * | |
| PVR | 0.44 ± 0.06 | 0.98 ± 0.19 | *** | 0.4 ± 0.09 | 1.97 ± 1.14 | *** | * | |
| EDP (mmHg) | 4.92 ± 3.02 | 12.79 ± 11.53 | * | 4.68 ± 1.96 | 17.34 ± 7.72 | *** | ns | |
| RV Contractility index (s−1) | 123.9 ± 26.46 | 121.7 ± 13.63 | ns | 122.08 ± 28.22 | 75.25 ± 14.7 | *** | *** |
| Fold Change (PH/CTRL) and Significance | |||||||
|---|---|---|---|---|---|---|---|
| CH vs. Normoxia | MCT vs. Vehicle | ||||||
| Plasma | RV | LV | Plasma | RV | LV | ||
| Arginine metabolic pathway | Spermidine a | ns | 1.50 * | 1.27 *** | ns | 1.33 ** | ns |
| Acetyl-spermidine a | ns | 2.08 *** | 1.80 *** | ns | 2.97 *** | 2.02 ** | |
| Putrescine a | ns | 1.87 *** | 1.67 *** | ns | 1.75 *** | ns | |
| Guanidinoacetate a | 1.68 *** | 3.01 *** | 1.97 *** | 0.74 * | 1.54 * | ns | |
| Arginine a | 0.75 * | 0.85 * | 0.81 *** | 0.76 ** | 0.85 ** | ns | |
| Creatine a | 0.72 ** | 0.79 *** | 0.77 *** | ns | 0.88 ** | 0.91 *** | |
| Fumarate a | 1.55 * | ns | 1.23 *** | ns | 1.43 * | ns | |
| Ornithine a | 1.34 *** | ns | ns | ns | 1.57 ** | ns | |
| Creatinine a | 1.15 *** | ns | ns | 1.17 ** | ns | ns | |
| Aspartate a | 1.40 ** | 1.26 * | ns | ns | ns | ns | |
| Oxoglutarate a | 1.56 *** | 0.75 * | ns | ns | ns | ns | |
| Guanidinobutanoate a | 1.94 *** | ns | 1.15 * | ns | ns | ns | |
| N-acetyl-glutamate a | 1.58 ** | ns | ns | ns | ns | 1.5 * | |
| Glutamine a | 1.36 *** | ns | ns | 0.89 * | 0.86 ** | ns | |
| Citrulline a | ns | ns | 0.88 * | 0.87 * | 0.85 * | 0.80 ** | |
| Aminobutanoate a | ns | ns | 0.89 * | ns | ns | ns | |
| Glutamate a | ns | ns | 0.90 * | ns | ns | ns | |
| Trans-4-L-hydroxy-proline a | 1.1 * | ns | 0.85 * | ns | ns | ns | |
| Pyrimidine metabolic pathway | Orotate a | 1.87 ** | 2.13 *** | 2.05 *** | ns | 2.18 ** | ns |
| Pseudouridine a | 1.20 *** | 1.27 ** | 1.19 * | 1.09 * | 1.28 ** | 1.29 * | |
| Uridine a | 1.50 * | 1.25 * | ns | ns | 1.26 * | ns | |
| Uracil a | 1.31 * | ns | 1.25 ** | 1.76 * | 1.28 ** | ns | |
| Thymidine a | 1.60 *** | ns | ns | 1.45 ** | 1.25 * | ns | |
| Thymine a | 1.30 ** | ns | ns | 1.51 * | 1.47 ** | ns | |
| Deoxyuridine a | 1.39 *** | ns | 1.24 *** | ns | 1.41 * | ns | |
| Dihydrouracil a | 1.28 ** | ns | ns | 1.66 ** | ns | ns | |
| Cytosine a | 1.27 ** | 1.19 ** | 1.18 * | ns | 1.19 * | ns | |
| Deoxycytidine a | 1.32 *** | 1.20 * | 1.28 ** | ns | ns | ns | |
| Acetyl-cytidine a | ns | ns | ns | 1.37 * | 1.64 ** | 1.49 * | |
| 5-Methyldeoxycytidine a | ns | 1.45 * | 1.55 ** | ns | 1.59 ** | ns | |
| Dihydroorotate | ns | ns | ns | 1.60 * | ns | ns | |
| Purine metabolism | Allantoin a | 1.21 ** | 1.24 * | 1.39 *** | 1.21 * | 1.26 ** | 1.34 * |
| 7-Methyl-guanine a | 1.18 * | 1.23 * | 1.24 ** | ns | 1.46 ** | 1.51 * | |
| Methyl-inosine a | 1.23 * | ns | ns | ns | 1.46 * | ns | |
| Xanthosine a | nr | 1.38 * | ns | nr | 1.90 ** | ns | |
| Xanthine a | nr | ns | 1.12 * | nr | 1.18 * | ns | |
| Inosine a | nr | ns | 0.92 *** | nr | 0.90 ** | 0.94 * | |
| Guanosine a | nr | ns | 0.85 * | nr | 0.71 *** | 0.82 * | |
| Adenine a | nr | 0.67 * | ns | nr | ns | ns | |
| 5’AMP a | nr | 1.18 * | ns | nr | ns | ns | |
| Urate a | ns | ns | 1.28 * | 2.50 * | 1.8 * | ns | |
| Tryptophan metabolic pathway | Indole-propionate a | 1.60 * | 1.81 * | 2.11 ** | ns | ns | ns |
| Indolelactate a | 0.55 *** | 0.65 * | ns | ns | ns | ns | |
| Kynurenine a | 1.28 * | ns | 1.34 * | ns | ns | ns | |
| Tryptophan a | ns | ns | 1.15 * | ns | 1.32 ** | ns | |
| Tyrosine a | ns | ns | ns | 1.33 * | 1.34 ** | 1.21 * | |
| Phenylalanine a | 0.82 *** | ns | ns | ns | 1.28 * | ns | |
| Acetyl-serotonin | ns | ns | ns | 0.57 ** | 1.54 ** | 1.88 * | |
| Serotonin | 0.63 * | nr | nr | ns | nr | nr | |
| Xanthurenate a | ns | nr | nr | 1.39 * | nr | nr | |
| Aminophenol | ns | ns | ns | 0.59 * | ns | ns | |
| Kynurenate a | ns | ns | ns | 1.58 * | ns | ns | |
| N-acetyl-tryptophan a | ns | ns | ns | 1.51 * | ns | 2.47 * | |
| SPEARMAN CH-PH vs. Normoxia | SPEARMAN MCT-PH vs. Vehicle | ||||||||||||||||||||||||||||||||
|---|---|---|---|---|---|---|---|---|---|---|---|---|---|---|---|---|---|---|---|---|---|---|---|---|---|---|---|---|---|---|---|---|---|
| RVS.P | RV Weight | Fulton’s Index | PVR | PAAT | RVS.P | RV weight | Fulton’s Index | PVR | PAAT | ||||||||||||||||||||||||
| Name | m/z | RT (min) | Ion | PL | RV | LV | PL | RV | LV | PL | RV | LV | PL | RV | LV | PL | RV | LV | PL | RV | LV | PL | RV | LV | PL | RV | LV | PL | RV | LV | PL | RV | LV |
| Arginine | 175.1187 | 0.7 | [M+H]+ | −0.51 * | −0.53 * | −0.74 *** | −0.48 * | ns | −0.72 *** | ns | ns | −0.63 ** | ns | ns | −0.81 *** | ns | ns | 0.51 * | −0.54 * | −0.54 ** | ns | ns | −0.42 * | ns | −0.53 ** | −0.58 ** | ns | −0.46 * | −0.51 * | ns | 0.66 *** | 0.43 * | ns |
| Creatine | 130.0623 | 7.6 | [M−H]− | −0.66 ** | −0.76 *** | −0.81 *** | −0.7 *** | −0.71 *** | −0.85 *** | −0.67 ** | −0.64 ** | −0.79 *** | −0.51 * | −0.76 *** | −0.86 *** | 0.52 * | 0.69 *** | 0.75 *** | ns | −0.44 * | −0.66 ** | ns | −0.58 ** | −0.7 *** | ns | −0.61 ** | −0.73 *** | ns | −0.47 * | −0.75 *** | ns | ns | 0.7 *** |
| Guanidinoacetate | 116.0466 | 8.3 | [M−H]− | 0.69 *** | 0.79 *** | 0.77 *** | 0.71 *** | 0.87 *** | 0.78 *** | 0.7 *** | 0.85 *** | 0.73 *** | 0.65 ** | 0.83 *** | 0.82 *** | ns | −0.76 *** | −0.75 *** | ns | 0.47 * | ns | ns | 0.63 *** | 0.4 * | ns | 0.47 * | ns | ns | 0.57 ** | ns | 0.44 * | ns | ns |
| Aspartate | 132.0302 | 8.20 | [M−H]− | 0.54 * | 0.55 * | 0.54 * | 0.69 *** | 0.56 * | 0.45 * | 0.59 ** | 0.54 * | 0.47 * | 0.73 *** | 0.51 * | ns | −0.5 * | ns | ns | ns | 0.56 ** | ns | ns | 0.4 * | ns | ns | ns | ns | ns | 0.46 * | ns | ns | ns | 0.48 * |
| Fumarate | 115.0035 | 8.8 | [M−H]− | 0.51 * | ns | 0.56 ** | 0.47 * | 0.45 * | 0.61 ** | ns | ns | 0.55 * | 0.6 ** | 0.55 * | 0.75 *** | ns | ns | −0.57 ** | ns | 0.64 ** | ns | ns | 0.53 ** | ns | ns | 0.53 ** | ns | ns | 0.66 ** | ns | ns | ns | ns |
| Oxoglutarate | 145.0140 | 8.6 | [M−H]− | 0.66 ** | ns | ns | 0.69 ** | −0.46 * | ns | 0.64 ** | −0.5 * | ns | 0.76 *** | −0.59 ** | ns | −0.52 * | 0.44 * | ns | ns | ns | ns | ns | ns | ns | ns | ns | ns | ns | ns | ns | ns | ns | ns |
| N-acetyl-glutamate | 188.0563 | 8 | [M−H]− | 0.53 * | ns | ns | 0.5 * | ns | ns | ns | −0.52 * | ns | 0.48 * | −0.48 * | ns | ns | ns | ns | ns | ns | ns | ns | ns | ns | ns | ns | ns | ns | ns | ns | ns | ns | ns |
| Spermidine | 146.1651 | 0.6 | [M+H]+ | ns | 0.52 * | 0.79 *** | 0.5 * | 0.6 ** | 0.75 *** | ns | 0.57 ** | 0.82 *** | 0.6 ** | 0.57 * | 0.83 *** | ns | ns | −0.59 ** | ns | 0.6 ** | ns | 0.44 * | 0.5 * | ns | 0.43 * | 0.64 *** | ns | ns | 0.66 ** | ns | ns | −0.64 *** | −0.42 * |
| Acetyl-spermidine | 188.1755 | 0.7 | [M+H]+ | ns | 0.74 *** | 0.73 *** | ns | 0.82 *** | 0.74 *** | ns | 0.79 *** | 0.78 *** | ns | 0.8 *** | 0.84 *** | ns | −0.66 ** | −0.68 ** | ns | 0.63 ** | 0.61 ** | ns | 0.69 *** | 0.54 ** | ns | 0.83 *** | 0.77 *** | ns | 0.69 *** | 0.69 *** | ns | −0.78 *** | −0.68 *** |
| Glutamine | 145.0616 | 7.7 | [M−H]− | 0.70 *** | ns | ns | 0.6 ** | ns | ns | 0.74 *** | ns | ns | 0.6 ** | ns | ns | −0.69 *** | ns | ns | ns | ns | ns | ns | −0.44 * | ns | ns | −0.58 ** | ns | ns | −0.48 * | ns | ns | 0.48 * | ns |
| Citrulline | 174.088 | 8.1 | [M−H]− | ns | ns | −0.52 * | ns | ns | ns | ns | ns | ns | ns | ns | ns | ns | ns | 0.46 * | ns | ns | ns | ns | ns | ns | ns | ns | −0.51 ** | ns | ns | ns | ns | ns | 0.46 * |
| Guanidinobutanoate | 146.0922 | 0.9 | [M+H]+ | 0.82 *** | ns | ns | 0.85 *** | ns | ns | 0.78 *** | 0.46 * | 0.57 * | 0.85 *** | ns | ns | −0.55 * | ns | ns | ns | ns | ns | ns | ns | ns | ns | ns | ns | ns | ns | ns | ns | ns | ns |
| Putrescine | 89.1072 | 0.7 | [M+H]+ | ns | 0.80 *** | 0.78 *** | ns | 0.76 *** | 0.69 *** | ns | 0.76 *** | 0.79 *** | ns | 0.82 *** | 0.79 *** | ns | −0.7 *** | −0.72 *** | ns | 0.56 ** | ns | ns | 0.56 ** | ns | ns | 0.72 *** | ns | ns | 0.58 ** | ns | ns | −0.47 * | ns |
| Creatinine | 112.0516 | 3.5 | [M−H]− | 0.62 ** | ns | ns | 0.6 ** | ns | ns | 0.7 *** | ns | ns | 0.73 *** | ns | ns | −0.53 * | ns | ns | ns | ns | ns | 0.46 * | ns | ns | 0.55 ** | ns | ns | ns | ns | ns | −0.54 ** | ns | ns |
| Ornithine | 131.083 | 9.6 | [M−H]− | 0.56 * | ns | ns | 0.5 * | ns | ns | 0.69 *** | ns | ns | 0.65 ** | ns | ns | −0.49 * | ns | ns | ns | 0.77 *** | ns | ns | 0.75 *** | ns | ns | 0.64 *** | ns | ns | 0.81 *** | ns | ns | −0.46 * | ns |
| Aminobutanoate | 102.0561 | 8.4 | [M−H]− | ns | −0.48 * | ns | ns | ns | −0.54 * | ns | ns | −0.56 * | ns | −0.49 * | ns | ns | 0.45 * | 0.59 ** | ns | ns | ns | ns | ns | ns | ns | ns | ns | ns | ns | ns | ns | ns | ns |
| Glutamate | 146.0455 | 8.3 | [M−H]− | ns | ns | ns | ns | ns | −0.55 * | ns | ns | −0.57 ** | ns | ns | ns | ns | ns | 0.59 ** | ns | ns | ns | ns | ns | ns | ns | ns | ns | ns | ns | ns | ns | ns | ns |
| Trans-4-L-hydroxy-proline | 130.0509 | 7.8 | [M−H]− | ns | ns | ns | ns | ns | ns | ns | ns | ns | ns | ns | ns | ns | ns | 0.68 ** | ns | ns | ns | ns | ns | ns | −0.45 * | ns | ns | ns | ns | ns | ns | ns | 0.43 * |
| Orotate | 155.0097 | 4.8 | [M−H]− | 0.69 *** | 0.81 *** | 0.75 *** | 0.7 *** | 0.9 *** | 0.76 *** | 0.57 * | 0.82 *** | 0.73 *** | 0.8 *** | 0.9 *** | 0.83 *** | −0.65 ** | −0.72 *** | −0.63 ** | ns | 0.58 ** | ns | ns | ns | ns | ns | 0.54 ** | ns | ns | 0.64 ** | ns | ns | −0.46 * | ns |
| Cytosine | 112.0503 | 0.9 | [M+H]+ | 0.78 *** | 0.53 * | 0.55 * | 0.83 *** | 0.67 ** | 0.51 * | 0.56 * | 0.55 * | ns | 0.85 *** | 0.62 ** | 0.5 * | −0.52 * | −0.68 ** | ns | ns | ns | ns | ns | ns | ns | ns | ns | ns | ns | 0.46 * | ns | ns | ns | ns |
| Deoxycytidine | 228.0975 | 0.9 | [M+H]+ | 0.80 *** | 0.5 * | 0.71 *** | 0.87 *** | 0.61 ** | 0.71 *** | 0.63 ** | 0.46 * | 0.52 * | 0.89 *** | 0.66 ** | 0.73 *** | −0.59 ** | ns | ns | ns | ns | −0.52 * | ns | ns | ns | ns | ns | ns | ns | ns | ns | ns | ns | ns |
| Deoxyuridine | 227.0672 | 2.8 | [M−H]− | 0.74 *** | ns | 0.47 * | 0.69 *** | ns | 0.48 * | 0.68 ** | ns | ns | 0.8 *** | ns | 0.47 * | ns | ns | ns | ns | 0.6 ** | ns | ns | 0.69 *** | 0.54 ** | ns | 0.62 *** | 0.5 * | ns | 0.59 ** | ns | ns | −0.49 * | ns |
| Pseudouridine | 243.0619 | 5.8 | [M−H]− | 0.56 * | 0.51 * | 0.51 * | 0.59 ** | 0.58 ** | 0.49 * | 0.65 ** | 0.5 * | ns | 0.68 ** | 0.61 ** | 0.52 * | −0.49 * | −0.46 * | ns | ns | 0.7 *** | ns | 0.41 * | 0.48 * | ns | 0.45 * | 0.62 *** | 0.49* | ns | 0.67 *** | ns | ns | −0.67 *** | ns |
| Uridine | 243.0618 | 3.8 | [M−H]− | 0.57 ** | ns | ns | 0.48 * | ns | ns | ns | ns | ns | 0.59 ** | ns | ns | ns | ns | ns | ns | 0.5 * | ns | ns | 0.66 *** | ns | ns | 0.62 *** | ns | ns | 0.46 * | ns | ns | ns | ns |
| Thymidine | 243.0971 | 1.9 | [M+H]+ | 0.74 *** | ns | ns | 0.78 *** | ns | ns | 0.63 ** | ns | ns | 0.81 *** | ns | ns | −0.57 ** | ns | ns | ns | 0.6 ** | ns | 0.45 * | ns | ns | 0.61 ** | 0.47 * | ns | ns | 0.57 ** | ns | −0.46 * | −0.63 *** | ns |
| Thymine | 125.036 | 2.3 | [M−H]− | 0.65 ** | ns | ns | 0.66 ** | ns | ns | 0.64 ** | ns | ns | 0.58 * | ns | ns | ns | ns | ns | 0.46 * | 0.66 *** | ns | 0.47 * | 0.4 * | ns | 0.62 *** | 0.58 ** | ns | ns | 0.62 ** | ns | −0.58 ** | −0.64 *** | ns |
| Uracil | 111.0198 | 2.9 | [M−H]− | 0.48 * | ns | 0.61 ** | 0.48 * | ns | 0.54 * | ns | ns | 0.45 * | 0.51 * | ns | 0.5 * | ns | ns | ns | ns | 0.67 *** | ns | ns | 0.56 ** | ns | 0.45 * | 0.53 ** | ns | ns | 0.71 *** | ns | −0.62 ** | −0.58 ** | ns |
| 5-methyldeoxycytidine | 242.1132 | 1 | [M+H]+ | ns | 0.45 * | 0.6 ** | ns | 0.46 * | 0.52 * | ns | 0.55 * | 0.52 * | ns | 0.46 * | 0.6 ** | ns | ns | −0.49 * | 0.55 ** | 0.63 ** | ns | ns | 0.42 * | ns | ns | 0.42 * | ns | ns | 0.73 *** | ns | ns | −0.59 ** | ns |
| Acetyl-cytidine | 286.103 | 2 | [M+H]+ | ns | ns | ns | ns | ns | ns | ns | ns | ns | ns | ns | ns | ns | ns | ns | 0.51 * | 0.6 ** | ns | ns | ns | ns | ns | 0.59 ** | 0.46 * | 0.53 * | 0.66 ** | ns | −0.49 * | −0.72 *** | −0.46 * |
| Dihydrouracil | 115.0502 | 0.8 | [M+H]+ | 0.62 ** | −0.52 * | −0.46 * | 0.69 ** | −0.56 * | −0.61 ** | 0.47 * | −0.49 * | −0.59 ** | 0.65 ** | −0.57 * | −0.56 * | ns | 0.79 *** | ns | 0.6 ** | −0.45 * | ns | 0.47 * | ns | ns | 0.65 *** | ns | ns | 0.53 * | −0.51 * | ns | −0.55 ** | ns | ns |
| Dihydroorotate | 157.0253 | 5.5 | [M−H]− | ns | −0.52 * | ns | ns | −0.56 * | ns | ns | −0.49 * | ns | ns | −0.57 * | ns | ns | 0.79 *** | ns | 0.53 * | −0.45 * | ns | 0.42 * | ns | ns | 0.51 ** | ns | ns | 0.56 ** | −0.51 * | ns | −0.75 *** | ns | ns |
| Allantoin | 157.0364 | 7.2 | [M−H]− | 0.69 *** | 0.53 * | 0.80 *** | 0.68 ** | 0.58 ** | 0.81 *** | 0.5 * | 0.5 * | 0.74 *** | 0.72 *** | 0.55 * | 0.85 *** | ns | ns | −0.61 ** | ns | 0.64 ** | 0.53 * | ns | ns | ns | ns | 0.49 * | 0.57 ** | ns | 0.71 *** | 0.61 ** | −0.55 ** | −0.66 *** | −0.46 * |
| 7-methyl-guanine | 164.0579 | 3.5 | [M−H]− | ns | ns | 0.68 ** | 0.45 * | 0.51 * | 0.67 ** | 0.57 * | 0.48 * | 0.52 * | 0.49 * | ns | 0.71 *** | ns | ns | −0.53 * | ns | 0.65 *** | 0.43 * | ns | 0.44 * | ns | ns | 0.58 ** | 0.53 ** | ns | 0.63 ** | ns | ns | −0.57 ** | ns |
| Methyl-inosine | 283.1033 | 1.7 | [M+H]+ | 0.65 ** | ns | ns | 0.52 * | ns | ns | ns | ns | ns | 0.56 * | ns | ns | ns | ns | ns | ns | 0.68 *** | ns | ns | 0.41 * | ns | ns | 0.49 * | ns | ns | 0.66 ** | ns | ns | −0.47 * | ns |
| Inosine | 269.0876 | 1.2 | [M+H]+ | nr | ns | −0.63 ** | nr | ns | −0.7 *** | nr | ns | −0.83 *** | nr | ns | −0.65 ** | nr | ns | 0.65 ** | nr | −0.58 ** | ns | nr | −0.57 ** | ns | nr | −0.65 *** | ns | nr | −0.59 ** | ns | nr | ns | 0.46 * |
| Guanosine | 282.0841 | 6 | [M−H]− | nr | ns | ns | nr | ns | ns | nr | ns | ns | nr | ns | ns | nr | 0.57 ** | ns | nr | ns | ns | nr | −0.51 ** | ns | nr | −0.57 ** | ns | nr | ns | −0.46 * | nr | 0.49 * | ns |
| Xanthosine | 283.0679 | 6.4 | [M−H]− | nr | ns | ns | nr | ns | ns | nr | 0.46 * | ns | nr | 0.51 * | ns | nr | −0.46 * | ns | nr | 0.51 * | ns | nr | 0.52 ** | ns | nr | 0.61 ** | ns | nr | 0.52 * | ns | nr | −0.65 *** | ns |
| Xanthine | 153.0405 | 1 | [M+H]+ | nr | ns | ns | nr | ns | ns | nr | ns | ns | nr | 0.49 * | ns | nr | −0.51 * | −0.46 * | nr | ns | ns | nr | ns | ns | nr | 0.39 * | ns | nr | ns | ns | nr | −0.51 * | ns |
| Urate | 169.0352 | 1 | [M+H]+ | ns | ns | ns | ns | ns | 0.49 * | ns | ns | 0.53 * | ns | ns | 0.65 ** | ns | ns | ns | ns | ns | ns | ns | 0.46 * | ns | ns | 0.51 ** | ns | ns | ns | ns | ns | −0.42 * | ns |
| Adenine | 136.0616 | 0.9 | [M+H]+ | nr | −0.62 ** | ns | nr | −0.54 * | ns | nr | −0.59 ** | ns | nr | ns | ns | nr | 0.51 * | ns | nr | ns | ns | nr | ns | ns | nr | ns | ns | nr | ns | ns | nr | ns | ns |
| 5’-AMP | 348.0697 | 0.9 | [M+H]+ | nr | −0.51 * | ns | nr | −0.49 * | ns | nr | ns | ns | nr | −0.49 * | ns | nr | 0.71 *** | ns | nr | ns | ns | nr | ns | ns | nr | ns | ns | nr | ns | ns | nr | ns | ns |
| Indole-propionate | 188.0714 | 2.3 | [M−H]− | ns | ns | 0.5 * | ns | 0.49 * | 0.58 ** | ns | ns | 0.6 ** | ns | 0.47 * | 0.67 ** | ns | ns | −0.57 ** | ns | 0.49 * | ns | ns | ns | ns | ns | ns | ns | ns | 0.49 * | 0.46 * | ns | ns | ns |
| Indolelactate | 204.0664 | 2.8 | [M−H]− | −0.68 *** | −0.49 * | ns | −0.64 ** | ns | ns | −0.57 * | ns | ns | −0.52 * | ns | ns | 0.66 ** | 0.48 * | ns | −0.43 * | ns | ns | ns | ns | ns | ns | ns | ns | ns | ns | ns | ns | ns | ns |
| Kynurenine | 209.0918 | 1.9 | [M+H]+ | 0.63 ** | ns | 0.61 ** | 0.7 *** | ns | 0.63 ** | 0.64 ** | ns | 0.54 * | 0.74 *** | ns | 0.69 ** | ns | ns | ns | ns | ns | ns | ns | ns | ns | ns | ns | ns | ns | ns | ns | ns | ns | ns |
| Tryptophan | 203.0822 | 4.5 | [M−H]− | ns | ns | 0.5 * | ns | ns | 0.5 * | ns | ns | 0.45 * | ns | ns | 0.53 * | ns | ns | −0.54 * | ns | 0.5 * | ns | −0.44 * | ns | ns | −0.6 ** | ns | ns | ns | 0.49 * | ns | 0.58 ** | ns | ns |
| Tyrosine | 182.0808 | 1.1 | [M+H]+ | ns | ns | ns | ns | ns | ns | ns | ns | ns | ns | ns | ns | ns | ns | ns | 0.64 ** | 0.5 * | ns | 0.56 ** | ns | ns | 0.48 * | ns | ns | 0.68 *** | 0.53 * | 0.59 ** | −0.46 * | −0.56 ** | ns |
| Phenylalanine | 164.0714 | 3.2 | [M−H]− | −0.81 *** | ns | ns | −0.8 *** | ns | ns | −0.7 *** | ns | ns | −0.76 *** | ns | ns | 0.7 *** | ns | ns | ns | 0.53 * | ns | ns | ns | ns | ns | 0.43 * | ns | ns | 0.48 * | ns | ns | −0.58 ** | ns |
| Acetyl-serotonin | 219.1127 | 5.1 | [M+H]+ | ns | ns | ns | ns | ns | ns | ns | ns | ns | ns | ns | ns | ns | ns | ns | ns | 0.44* | ns | −0.4 * | 0.54 ** | ns | −0.50 ** | 0.61 ** | ns | ns | ns | 0.45 * | 0.65 *** | ns | ns |
| Serotonin | 160.0755 | 1.5 | [M+H−NH3]+ | −0.58 ** | nr | nr | −0.51 * | nr | nr | −0.6 ** | nr | nr | ns | nr | nr | 0.52 * | nr | nr | −0.44 * | nr | nr | ns | nr | nr | −0.42 * | nr | nr | −0.44 * | nr | nr | 0.71 *** | nr | nr |
| Xanthurenate | 206.0447 | 4.1 | [M+H]+ | ns | nr | nr | ns | nr | nr | ns | nr | nr | ns | nr | nr | ns | nr | nr | ns | nr | nr | ns | nr | nr | ns | nr | nr | ns | nr | nr | −0.48 * | nr | nr |
| Aminophenol | 110.0598 | 1 | [M+H]+ | ns | ns | ns | ns | ns | ns | ns | ns | ns | ns | ns | ns | ns | 0.54 * | ns | ns | ns | ns | ns | ns | ns | −0.49 * | ns | ns | −0.47 * | ns | ns | 0.56 ** | ns | ns |
| Kynurenate | 190.0496 | 4.5 | [M+H]+ | ns | ns | ns | ns | ns | ns | ns | ns | ns | ns | ns | ns | ns | ns | ns | ns | ns | ns | ns | ns | ns | ns | ns | ns | ns | ns | ns | ns | ns | ns |
| N-acetyl-tryptophan | 247.1074 | 6 | [M+H]+ | ns | ns | ns | ns | ns | ns | ns | ns | ns | ns | ns | ns | ns | ns | ns | 0.72 *** | ns | ns | 0.59 ** | ns | ns | 0.5 ** | ns | ns | 0.62 ** | ns | ns | ns | ns | ns |
| Caption | −0.6 < R or R > 0.6 | −0.7 < R or R > 0.7 | −0.8 < R or R > 0.8 | ||||||||||||||||||||||||||||||
Publisher’s Note: MDPI stays neutral with regard to jurisdictional claims in published maps and institutional affiliations. |
© 2021 by the authors. Licensee MDPI, Basel, Switzerland. This article is an open access article distributed under the terms and conditions of the Creative Commons Attribution (CC BY) license (https://creativecommons.org/licenses/by/4.0/).
Share and Cite
Hautbergue, T.; Antigny, F.; Boët, A.; Haddad, F.; Masson, B.; Lambert, M.; Delaporte, A.; Menager, J.-B.; Savale, L.; Pavec, J.L.; et al. Right Ventricle Remodeling Metabolic Signature in Experimental Pulmonary Hypertension Models of Chronic Hypoxia and Monocrotaline Exposure. Cells 2021, 10, 1559. https://0-doi-org.brum.beds.ac.uk/10.3390/cells10061559
Hautbergue T, Antigny F, Boët A, Haddad F, Masson B, Lambert M, Delaporte A, Menager J-B, Savale L, Pavec JL, et al. Right Ventricle Remodeling Metabolic Signature in Experimental Pulmonary Hypertension Models of Chronic Hypoxia and Monocrotaline Exposure. Cells. 2021; 10(6):1559. https://0-doi-org.brum.beds.ac.uk/10.3390/cells10061559
Chicago/Turabian StyleHautbergue, Thaïs, Fabrice Antigny, Angèle Boët, François Haddad, Bastien Masson, Mélanie Lambert, Amélie Delaporte, Jean-Baptiste Menager, Laurent Savale, Jérôme Le Pavec, and et al. 2021. "Right Ventricle Remodeling Metabolic Signature in Experimental Pulmonary Hypertension Models of Chronic Hypoxia and Monocrotaline Exposure" Cells 10, no. 6: 1559. https://0-doi-org.brum.beds.ac.uk/10.3390/cells10061559