Article

High-Fat Diet Alters the Retinal Transcriptome in the Absence of Gut Microbiota

1
Department of Ophthalmology and Visual Science, University of Chicago, Chicago, IL 60637, USA
2
Center for Research Informatics, University of Chicago, Chicago, IL 60637, USA
3
Department of Medicine, University of Chicago, Chicago, IL 60637, USA
4
Department of Pathology, University of Chicago, Chicago, IL 60637, USA
5
Department of Ophthalmology and Visual Science, Yale University School of Medicine, New Haven, CT 06437, USA
6
Department of Animal Biologics and Metabolism, University of Wisconsin, Madison, WI 53706, USA
7
Knapp Center for Biomedical Discovery, Department of Medicine, Microbiome Medicine Program, University of Chicago, Chicago, IL 60637, USA
*
Author to whom correspondence should be addressed.
Submission received: 12 July 2021 / Revised: 9 August 2021 / Accepted: 11 August 2021 / Published: 18 August 2021
(This article belongs to the Special Issue The Retina in Health and Disease)

Abstract

:
The relationship between retinal disease, diet, and the gut microbiome has shown increasing importance over recent years. In particular, high-fat diets (HFDs) are associated with development and progression of several retinal diseases, including age-related macular degeneration (AMD) and diabetic retinopathy. However, the complex, overlapping interactions between diet, gut microbiome, and retinal homeostasis are poorly understood. Using high-throughput RNA-sequencing (RNA-seq) of whole retinas, we compare the retinal transcriptome from germ-free (GF) mice on a regular diet (ND) and HFD to investigate transcriptomic changes without influence of gut microbiome. After correction of raw data, 53 differentially expressed genes (DEGs) were identified, of which 19 were upregulated and 34 were downregulated in GF-HFD mice. Key genes involved in retinal inflammation, angiogenesis, and RPE function were identified. Enrichment analysis revealed that the top 3 biological processes affected were regulation of blood vessel diameter, inflammatory response, and negative regulation of endopeptidase. Molecular functions altered include endopeptidase inhibitor activity, protease binding, and cysteine-type endopeptidase inhibitor activity. Human and mouse pathway analysis revealed that the complement and coagulation cascades are significantly affected by HFD. This study demonstrates novel data that diet can directly modulate the retinal transcriptome independently of the gut microbiome.

1. Introduction

Over the last several decades, there is increasing evidence that diet and nutrient intake contribute to the pathophysiology of retinal diseases, including age-related macular degeneration (AMD), diabetic retinopathy (DR), and glaucoma [1,2,3,4]. The retina is one of the most metabolically active tissues in the body, and with its rich store of polyunsaturated fats, is vulnerable to oxidative, metabolic, and fatty acid perturbances [5,6]. In particular, multiple research groups have linked high-fat diets (HFDs) and fat-specific intake with increased prevalence of intermediate or advanced AMD, the leading cause of blindness in the developed world [7,8,9,10]. HFDs have been shown to replicate or exacerbate features of retinal disease through various proposed mechanisms: lipid signaling, metabolic dysfunction, vascularization, and inflammatory regulation [11]. Compared to mice fed on conventional or low-fat diets, HFD-fed mice exhibit impaired retinal sensitivity, greater macrophage/microglial cell activation, altered retinal fatty acid composition, and hallmark features of AMD such as choroidal neovascularization (CNV) and sub-retinal pigment epithelium (RPE) deposits [12,13,14,15]. HFDs also can lead to systemic changes such as hypercholesteremia and hyperinsulinemia, paving the way for retinal disease risk factors like obesity and diabetes [16]. HFD-induced vascular changes in the eye have also been reported, including changes in permeability and formation of acellular capillaries, though these effects are not consistent across studies [16,17]. Use of electroretinograms (ERGs) support the notion that HFDs can negatively affect function of several retinal cell types, including photoreceptors, bipolar cells, and retinal ganglion cells [16]. Altogether, a small but growing body of literature suggests that HFDs alter the retina and its microenvironment.
Recent studies suggest that the effects of HFDs in retinal diseases may be in part mediated through the gut microbiome [18]. The human gut microbiome is comprised of trillions of microbiota that live within our gastrointestinal tracts. These microbes can maintain and alter health homeostasis, playing diverse roles in immune regulation, metabolism, drug processing, and intercellular signaling [19]. This rapidly growing body of literature has linked the gut microbiome with anatomically distant sites, including the heart, liver, brain, and lungs [20,21,22,23]. Research regarding the gut microbiome’s role in ocular tissues, particularly in the retina, has only recently begun [24,25]. These pioneering studies have revealed functional and compositional differences in the gut microbiome in patients with retinal diseases such as primary open-angle glaucoma (POAG), neovascular AMD, retinal artery occlusion (RAO), and retinopathy of prematurity (ROP) [26,27,28,29]. Our team has previously shown that modulating the gut microbiome impacts the retinal transcriptome across many biological pathways implicated in retinal disease [30]. Other investigators have found that gut microbiota can alter retinal lipid composition, as well as systemic factors such as endotoxemia and immune response that may set the stage for retinal pathophysiology [31,32]. Due to their location in the gastrointestinal system and intimate communication with human cell types, gut microbiota may be responsible for mediating many of the observed effects of HFD on the retina. For example, Andriessen et al. recently showed that a HFD modifies gut microbiota composition, which consequently exacerbates laser-induced CNV [18]. Other studies have also shown that HFD-fed mice exhibit altered gut microbiomes, such as reduced diversity and a decreased Bacteroidetes-to-Firmicutes ratio [33,34,35].
Taken together, there seems to be a connection between HFD, the gut microbiome, and retinal homeostasis. Nevertheless, whether and how HFD affects the retina in the absence of gut microbiome remain unknown. In this study, we sought to distinguish these overlapping components, and investigate whether HFD directly alters the retinal transcriptome in the absence of gut microbiome by using germ-free mice and high-throughput RNA-sequencing. Given the complexity of genetic and environmental factors that contribute to retinal disease progression, understanding how diet impacts retinal biology at the transcriptional level could help identify underlying mechanisms of how diet can affect retinal diseases, which ultimately could lead to discovery of novel targets for preventative or therapeutic interventions to treat ocular diseases.

2. Materials and Methods

2.1. Animals and Diets

Mouse experiments were approved by the University of Chicago Institutional Animal Care and Use Committee and conducted according to ophthalmic and vision research guidelines set by the Association for Research in Vision and Ophthalmology (ARVO). This study used germ-free (GF) C57B1/6 adult male mice, which were housed in the Gnotobiotic Research Animal Facility at the University of Chicago. At 7 weeks of age, GF mice were fed ad libitum either a normal diet (ND) or high-fat diet (HFD) for 8 consecutive weeks. The HFD consisted of 23% saturated fat. Environmental conditions, including humidity and temperature, adhered to The Guide for the Care and Use of Laboratory Animals, 8th edition, and mice were subjected to a standard 12-h light cycle. At 15 weeks of age, the mice were euthanized by carbon dioxide and subsequent cervical dislocation. Samples were immediately placed on ice and processed for RNA-sequencing.

2.2. Sterility Monitoring

In order to provide a sterile environment, GF mice were housed in positive-pressure incubators at the University of Chicago’s Gnotobiotic Research Animal Facility and fed diets which had been irradiated and autoclaved at 250 °F for 30 min. Germ-free status was assessed as described previously [36]. Briefly, fecal samples were collected weekly, and cultured aerobically at 37 °C and 42 °C and anaerobically at 37 °C. Cultures were checked after 1, 2, 3, and 5 days had passed—no positive cultures were identified during the study. Additionally, fecal samples were screened for contamination by DNA extraction and quantitative real-time polymerase chain reaction (PCR) using universal bacterial primers for the 16 S RNA-encoding gene (IDT, 8 F was 5′-AGA GTT TGA TCC TGG CTC AG-3′, and 338 R was 5′-TGC TGC CTC CCG TAG GAG T-3′).

2.3. RNA Extraction

Whole mouse retinas were isolated on ice from freshly enucleated eyes, with all equipment, surfaces, and tubes treated with RNase decontamination solution (Thermo Fisher Scientific, Waltham, MA, USA) prior to use. Dissected retinas were stored in RNAlater solution (Thermo Fisher Scientific, Waltham, MA, USA) at −80 °C until RNA extraction using the RNeasy kit from Qiagen (Qiagen, Hilden, Germany). Concentrations were quantified using a Nanodrop (Thermo Fisher Scientific, Waltham, MA, USA) before sequencing.

2.4. RNA Sequencing

RNA from eight samples was used for analysis (four per diet group). The quality was evaluated using a Bioanalyzer at the University of Chicago Genomics Core and was confirmed to meet appropriate RNA integrity numbers (RIN). Next, cDNA libraries were constructed using TruSeq RNA Sample Prep kits (Illumina, San Diego, CA, USA) to generate 100-bp paired-end reads, which were indexed for multiplexing and then sequenced using PE100bp on the NovaSeq 6000 System (Illumina, San Diego, CA, USA). Data was provided in FASTQ format and analyzed in R.

2.5. Statistical Analysis

The secondary analysis of sequence data was performed on Globus Genomics, an enhanced, cloud-based analytical platform that provides access to different versions of Next-Generation Sequence analysis tools and workflow capabilities. Tools such as STAR, featureCounts, and Limma were run from within the Globus Genomics platform. We used STAR (version 2.4.2 a, Stanford University, Stanford, CA, USA) aligner default parameters to align the RNA-seq reads to the reference mouse genome (GRCm38) for all eight samples. The raw gene expression count matrix was then generated by featureCounts (version subread-1.4.6-p1). The gene annotation was obtained from the Gencode vM23. STAR default parameter for the maximum mismatches is 10 which is optimized based on mammalian genomes and recent RNA-seq data.
Significant DEGs with a p-value < 0.01 and LogFC > 1 were extracted for further downstream analysis. Filtering for DEGs with low expression (count-per-million < 10) was performed using edgeR [37,38]. The enrichment analysis in EnrichR suite took both the upregulated and downregulated DEGs in GF and extracted the over-represented gene ontology functional classification (molecular functions, biological processes, and cellular component). The significance of the association between the datasets and bio functions were measured using a ratio of the number of genes from the dataset that map to the pathway divided by the total number of genes in that pathway. This enrichment analysis was based on mouse-to-human orthologs. A list of all DEGs and their p-values is available in Table 1 and Table 2.

3. Results

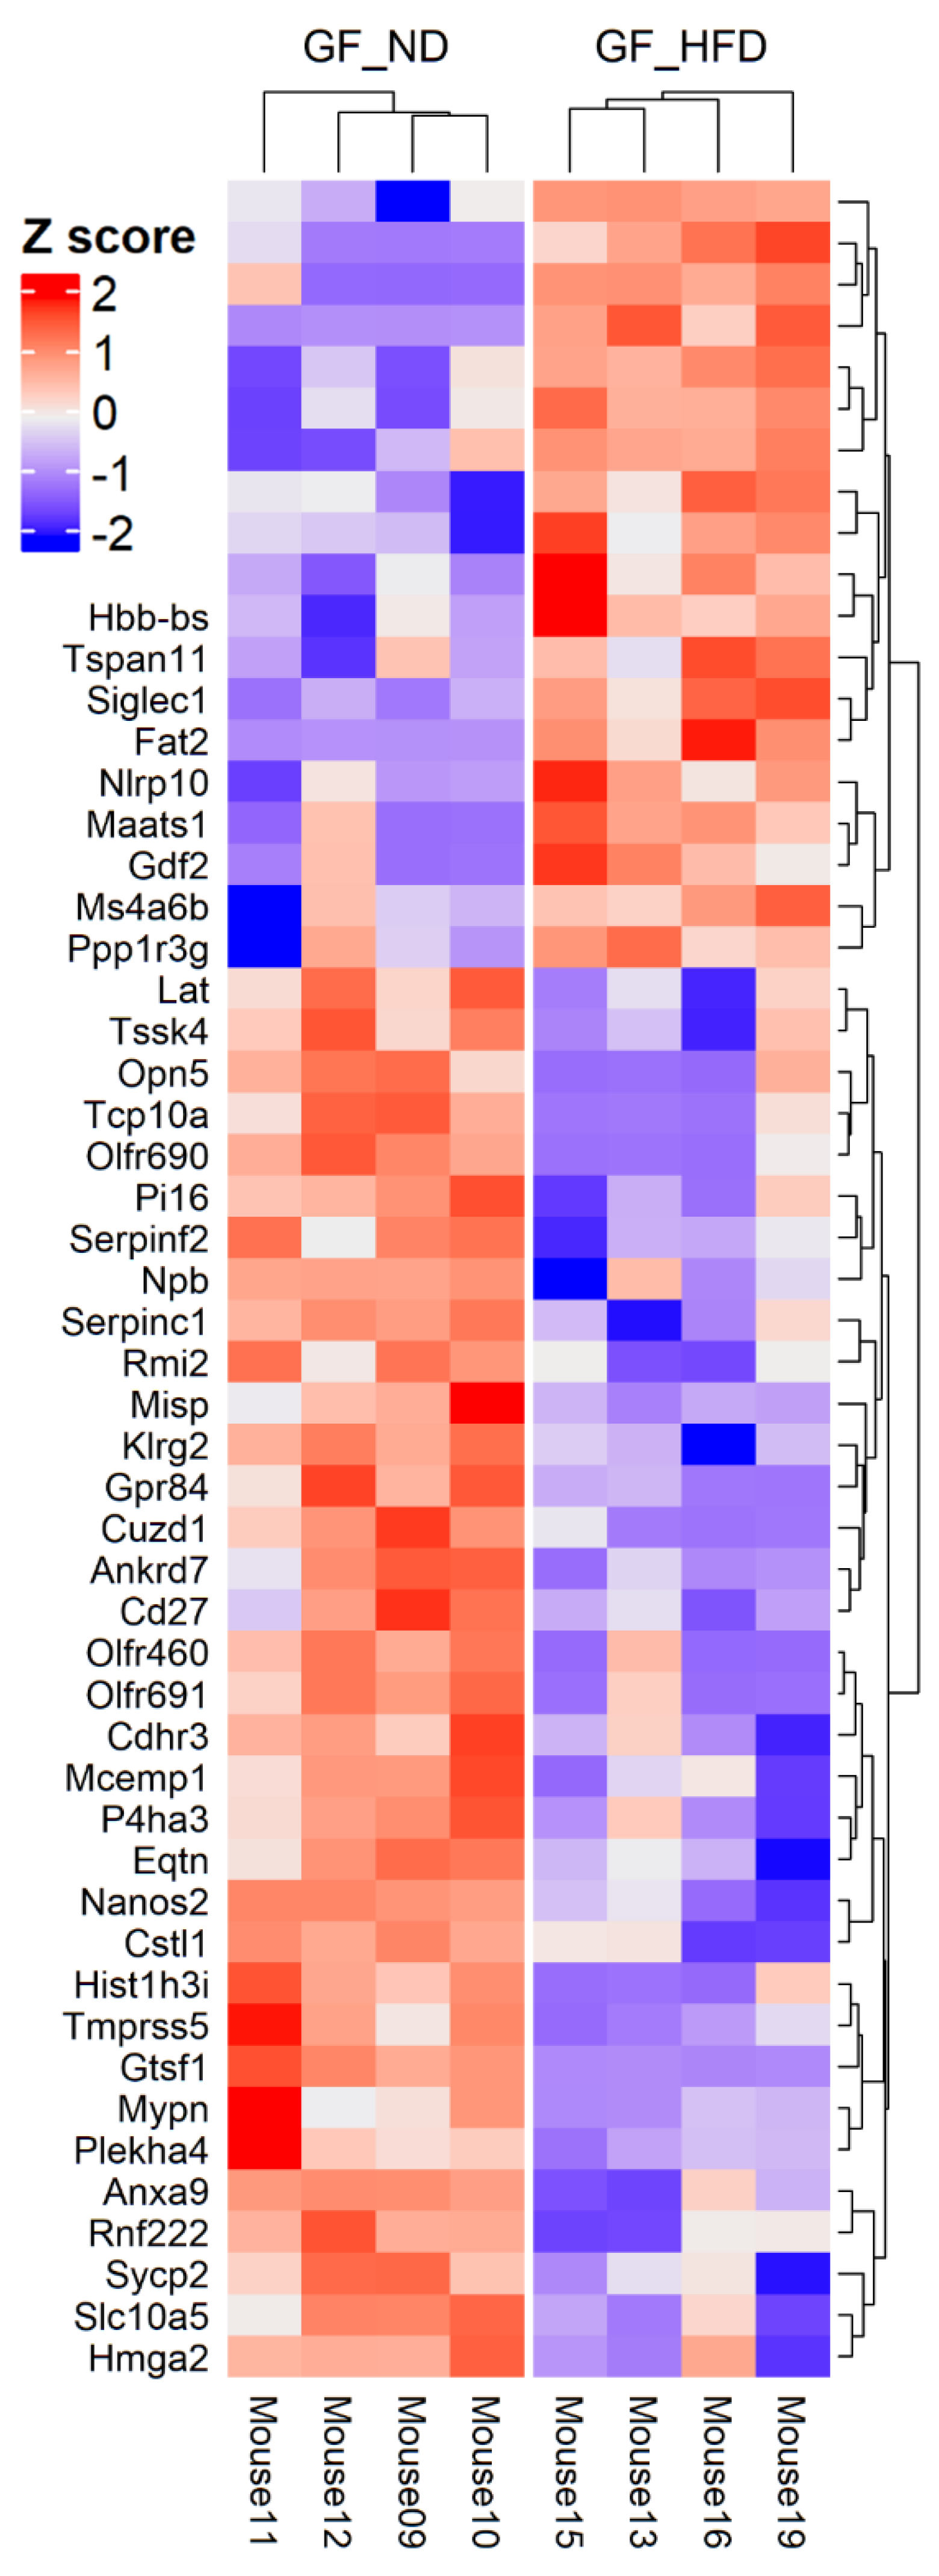
3.1. HFD Is Associated with Differential Retinal Gene Expression in the Absence of the Microbiome

To compare the effect of a high-fat diet on the retinal transcriptome, we performed high-throughput RNA-seq analysis of mouse retinas from the GF-ND and GF-HFD. We sequenced four whole retinas from both experimental groups (n = 4 eyes from 4 different mice, controlled for age and sex). After the correction of the raw data to remove background noise, 19,681 genes were selected for differential gene analysis (Supplementary Table S1). DEGs were selected based on a stringent p-value cutoff < 0.01 and logFC > 1. Comparison between the two groups identifies 53 DEGs, of which 19 are upregulated and 34 are downregulated in the GF-HFD mice group. The National Center for Biotechnology Information (NCBI) gene database was used to filter pseudogenes and uncharacterized cDNA to compile a list of protein-coding genes only. A heatmap was plotted to show the hierarchical clustering of the DEGs (Figure 1). The sequencing data suggests that HFD is associated with changes in the retinal transcriptome in the absence of the microbiome. Detailed list and statistics of the upregulated and downregulated DEGs are available in Table 1 and Table 2.

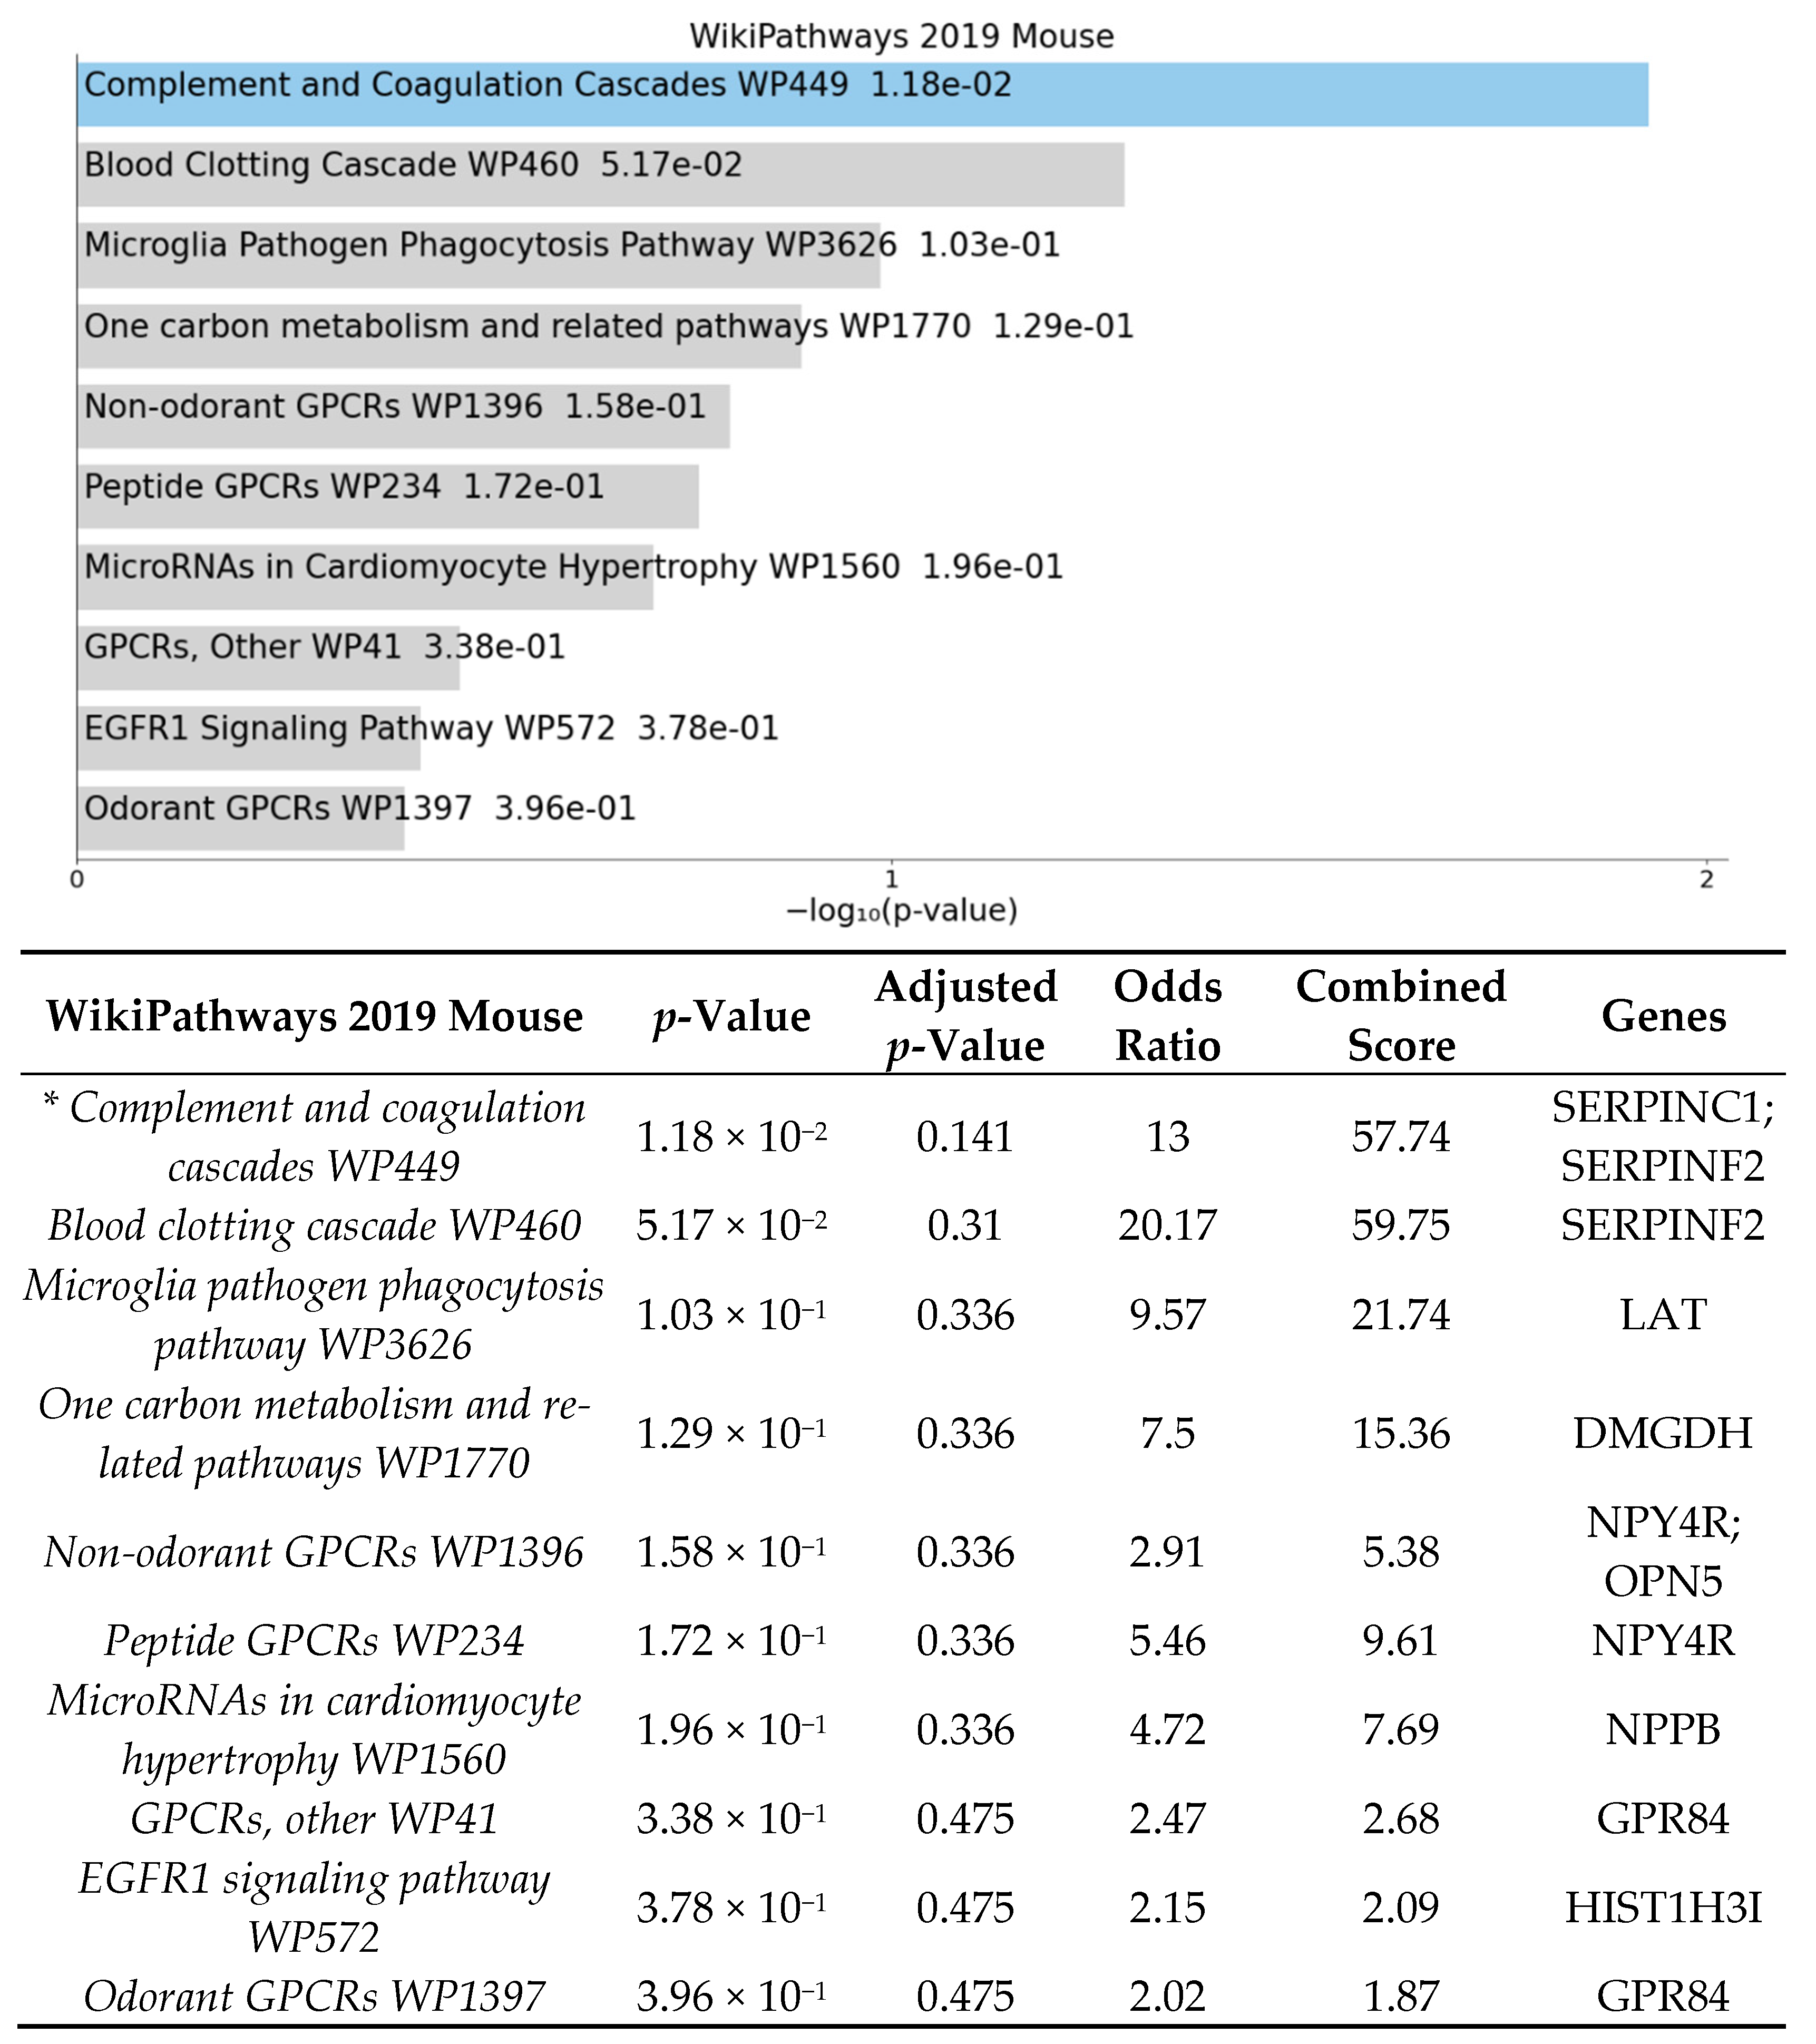
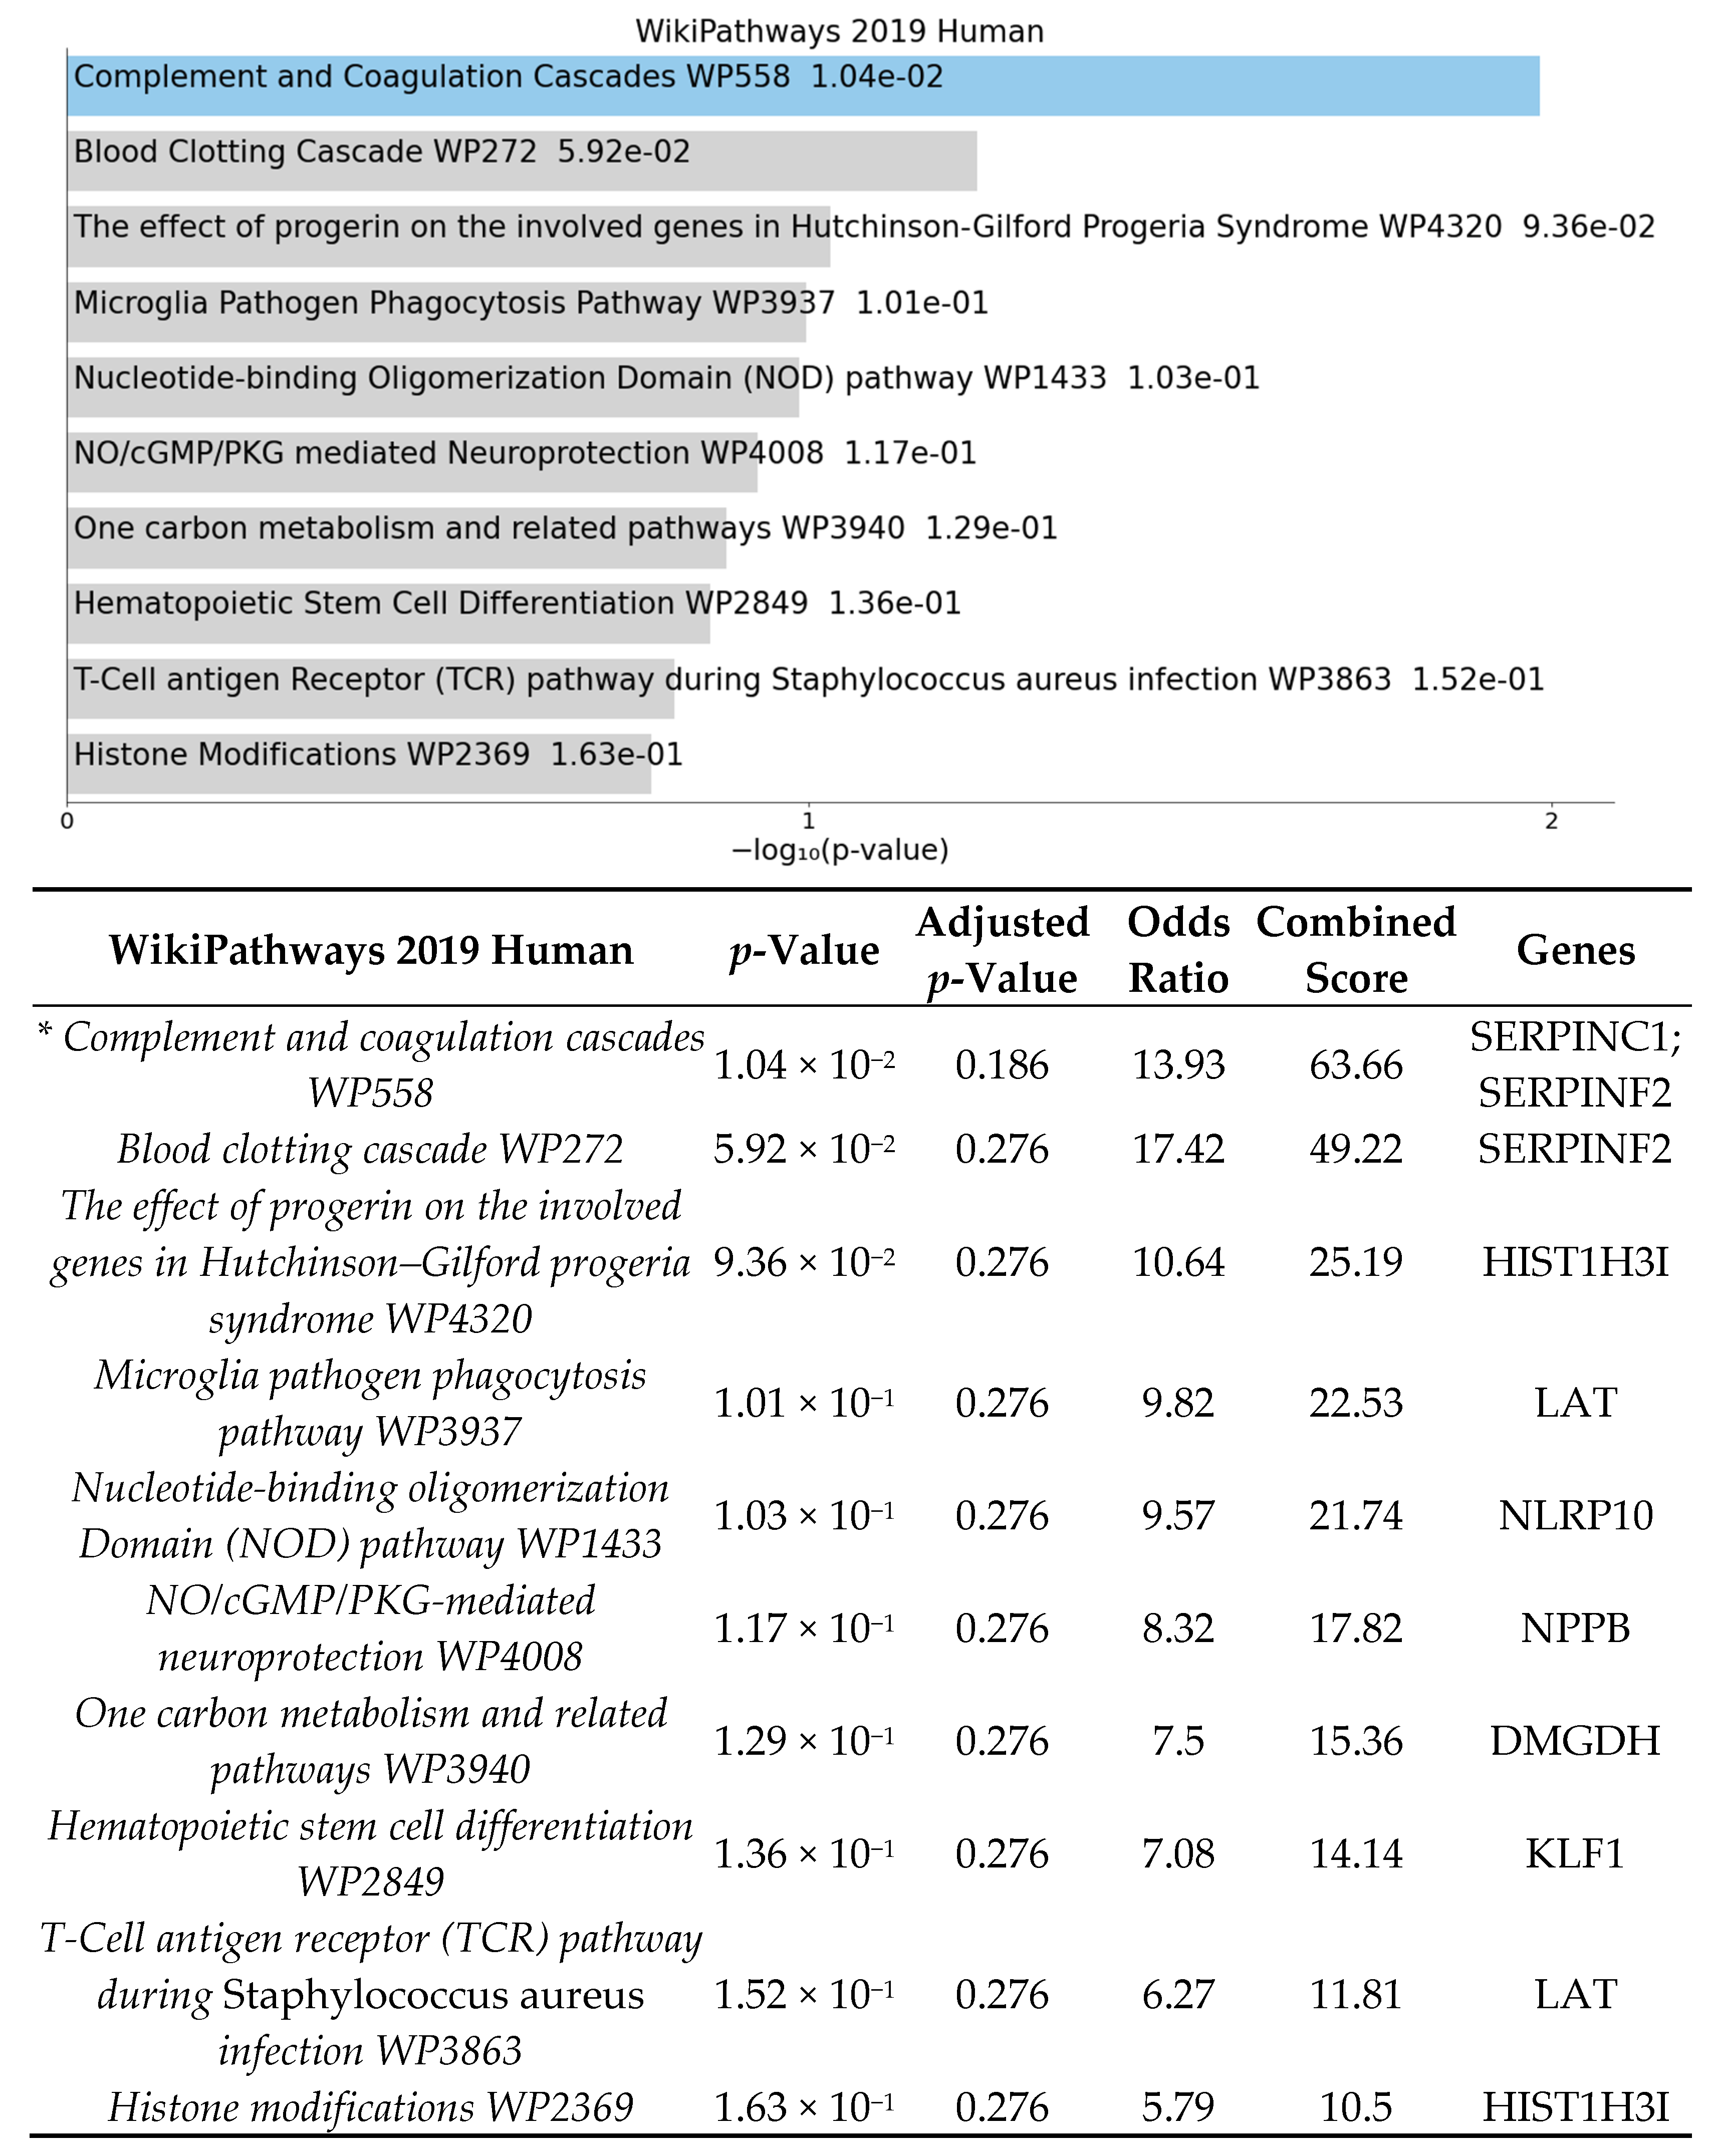
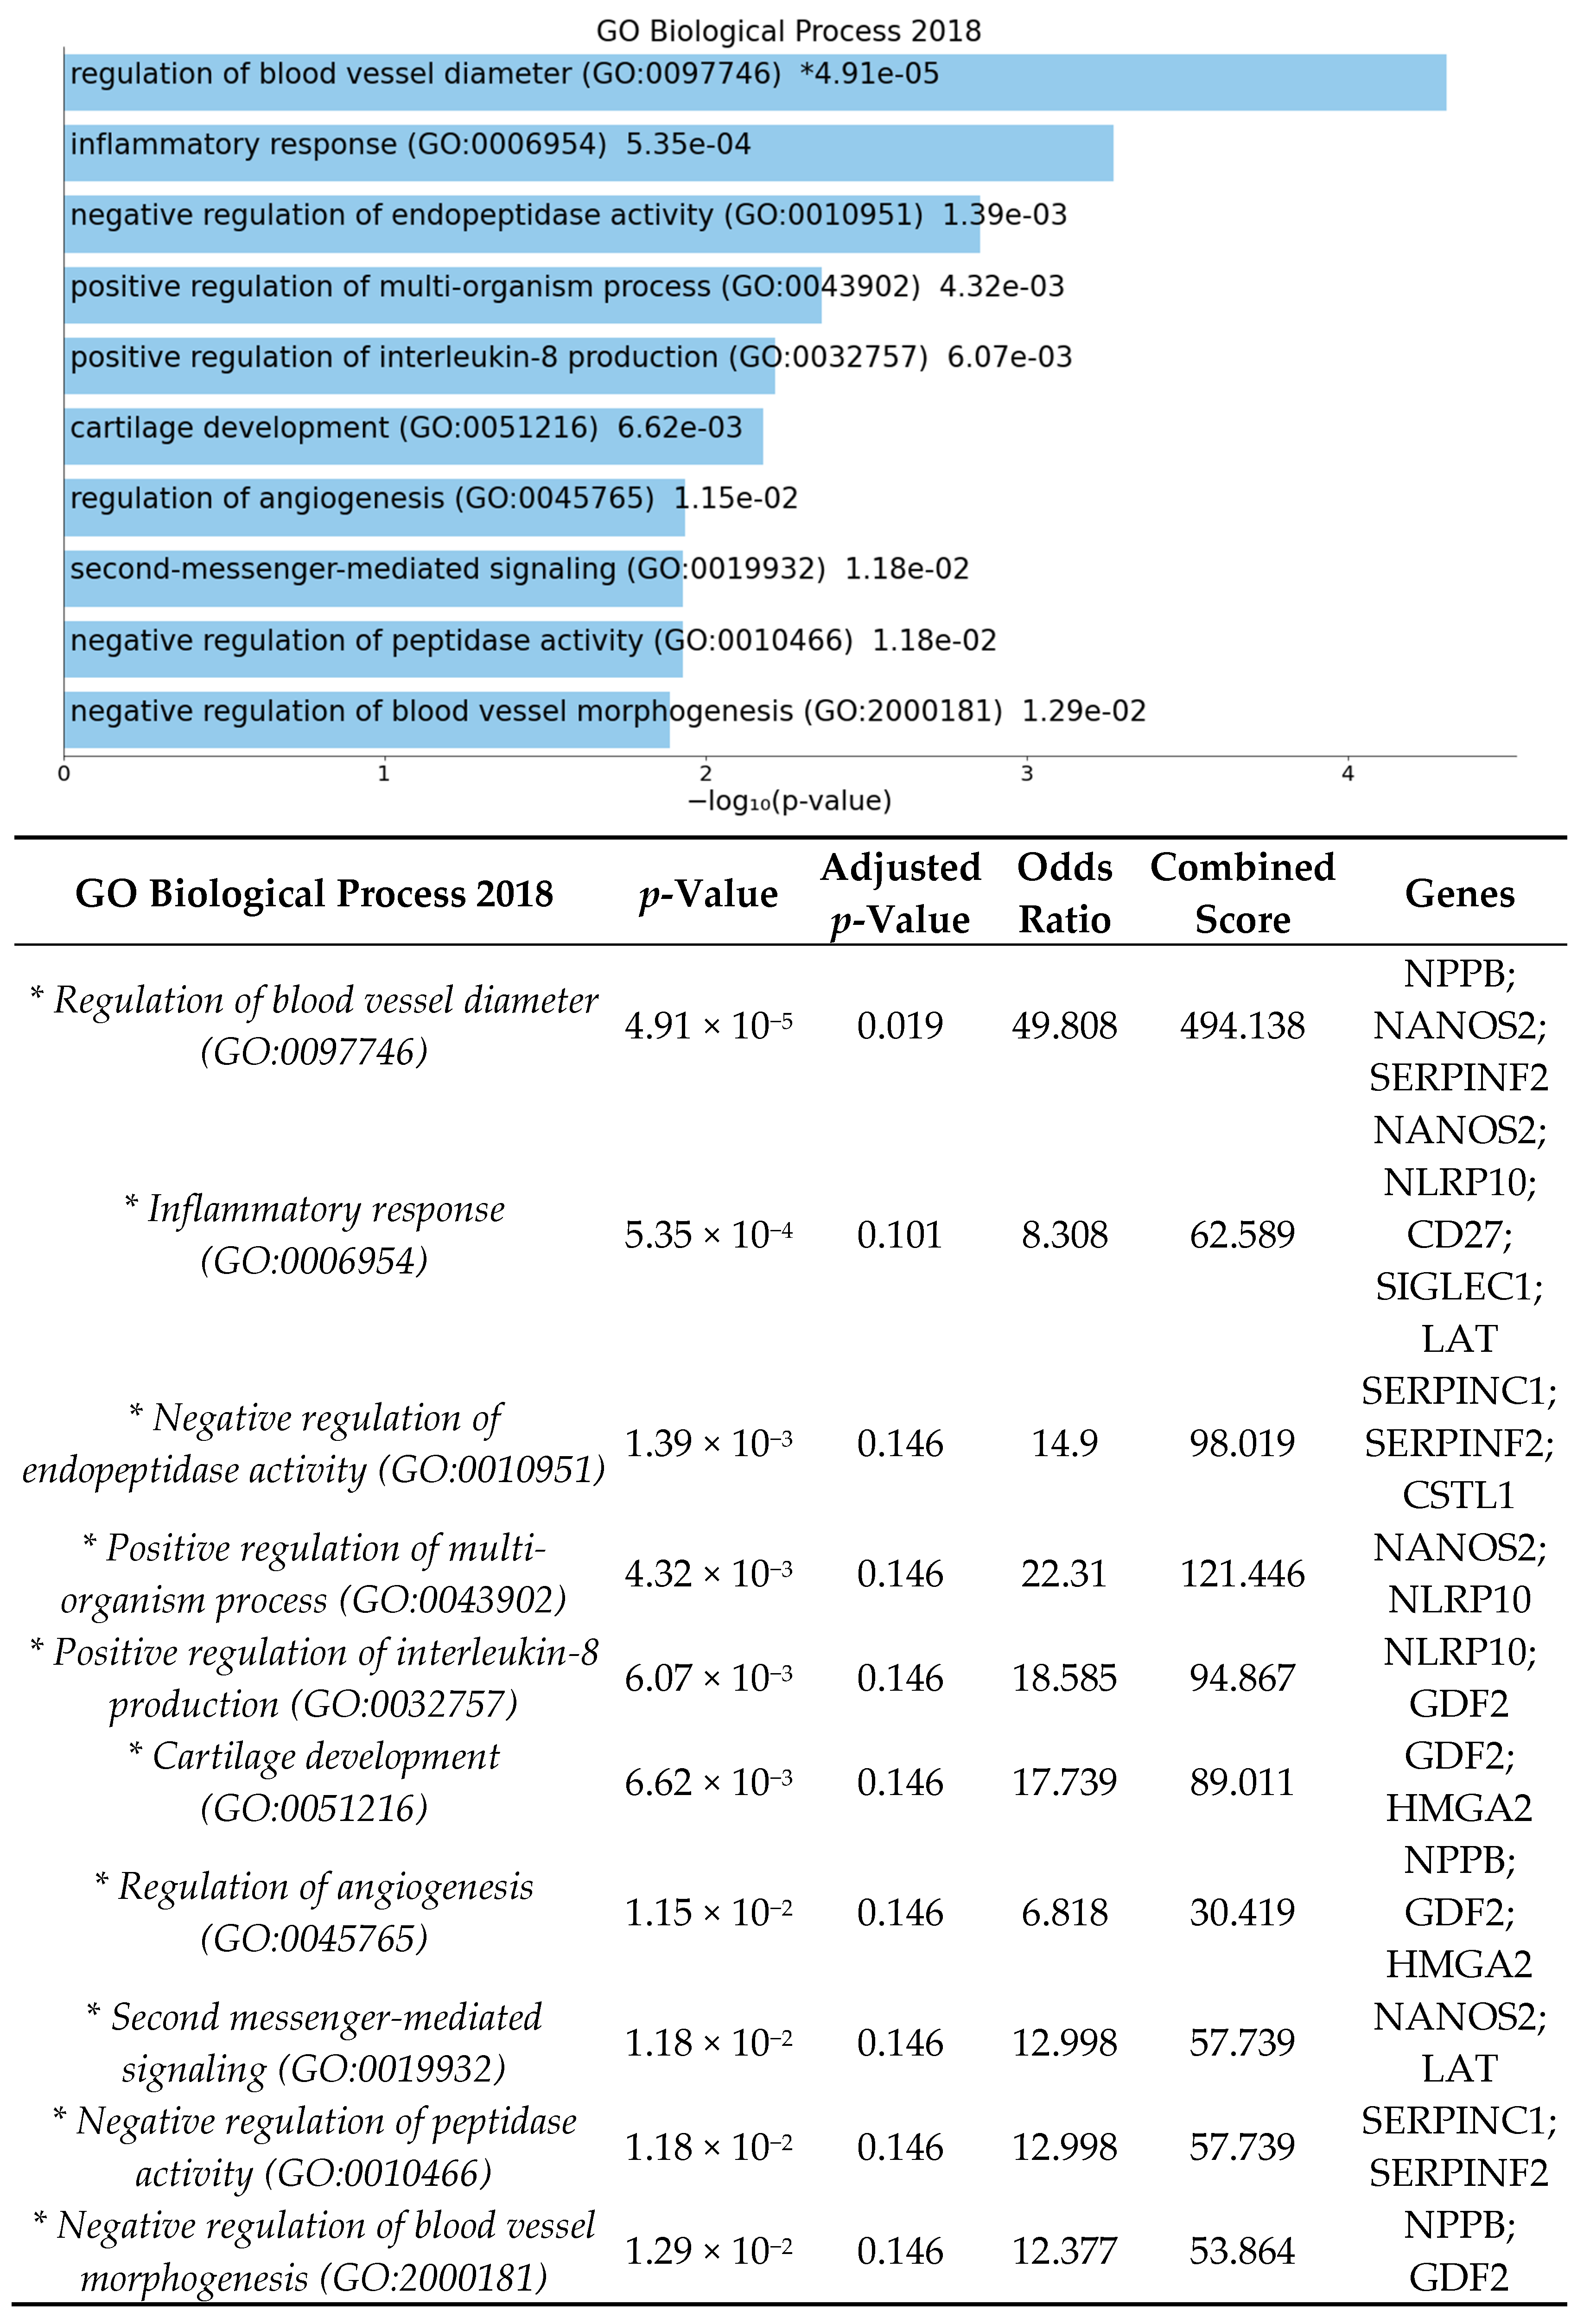
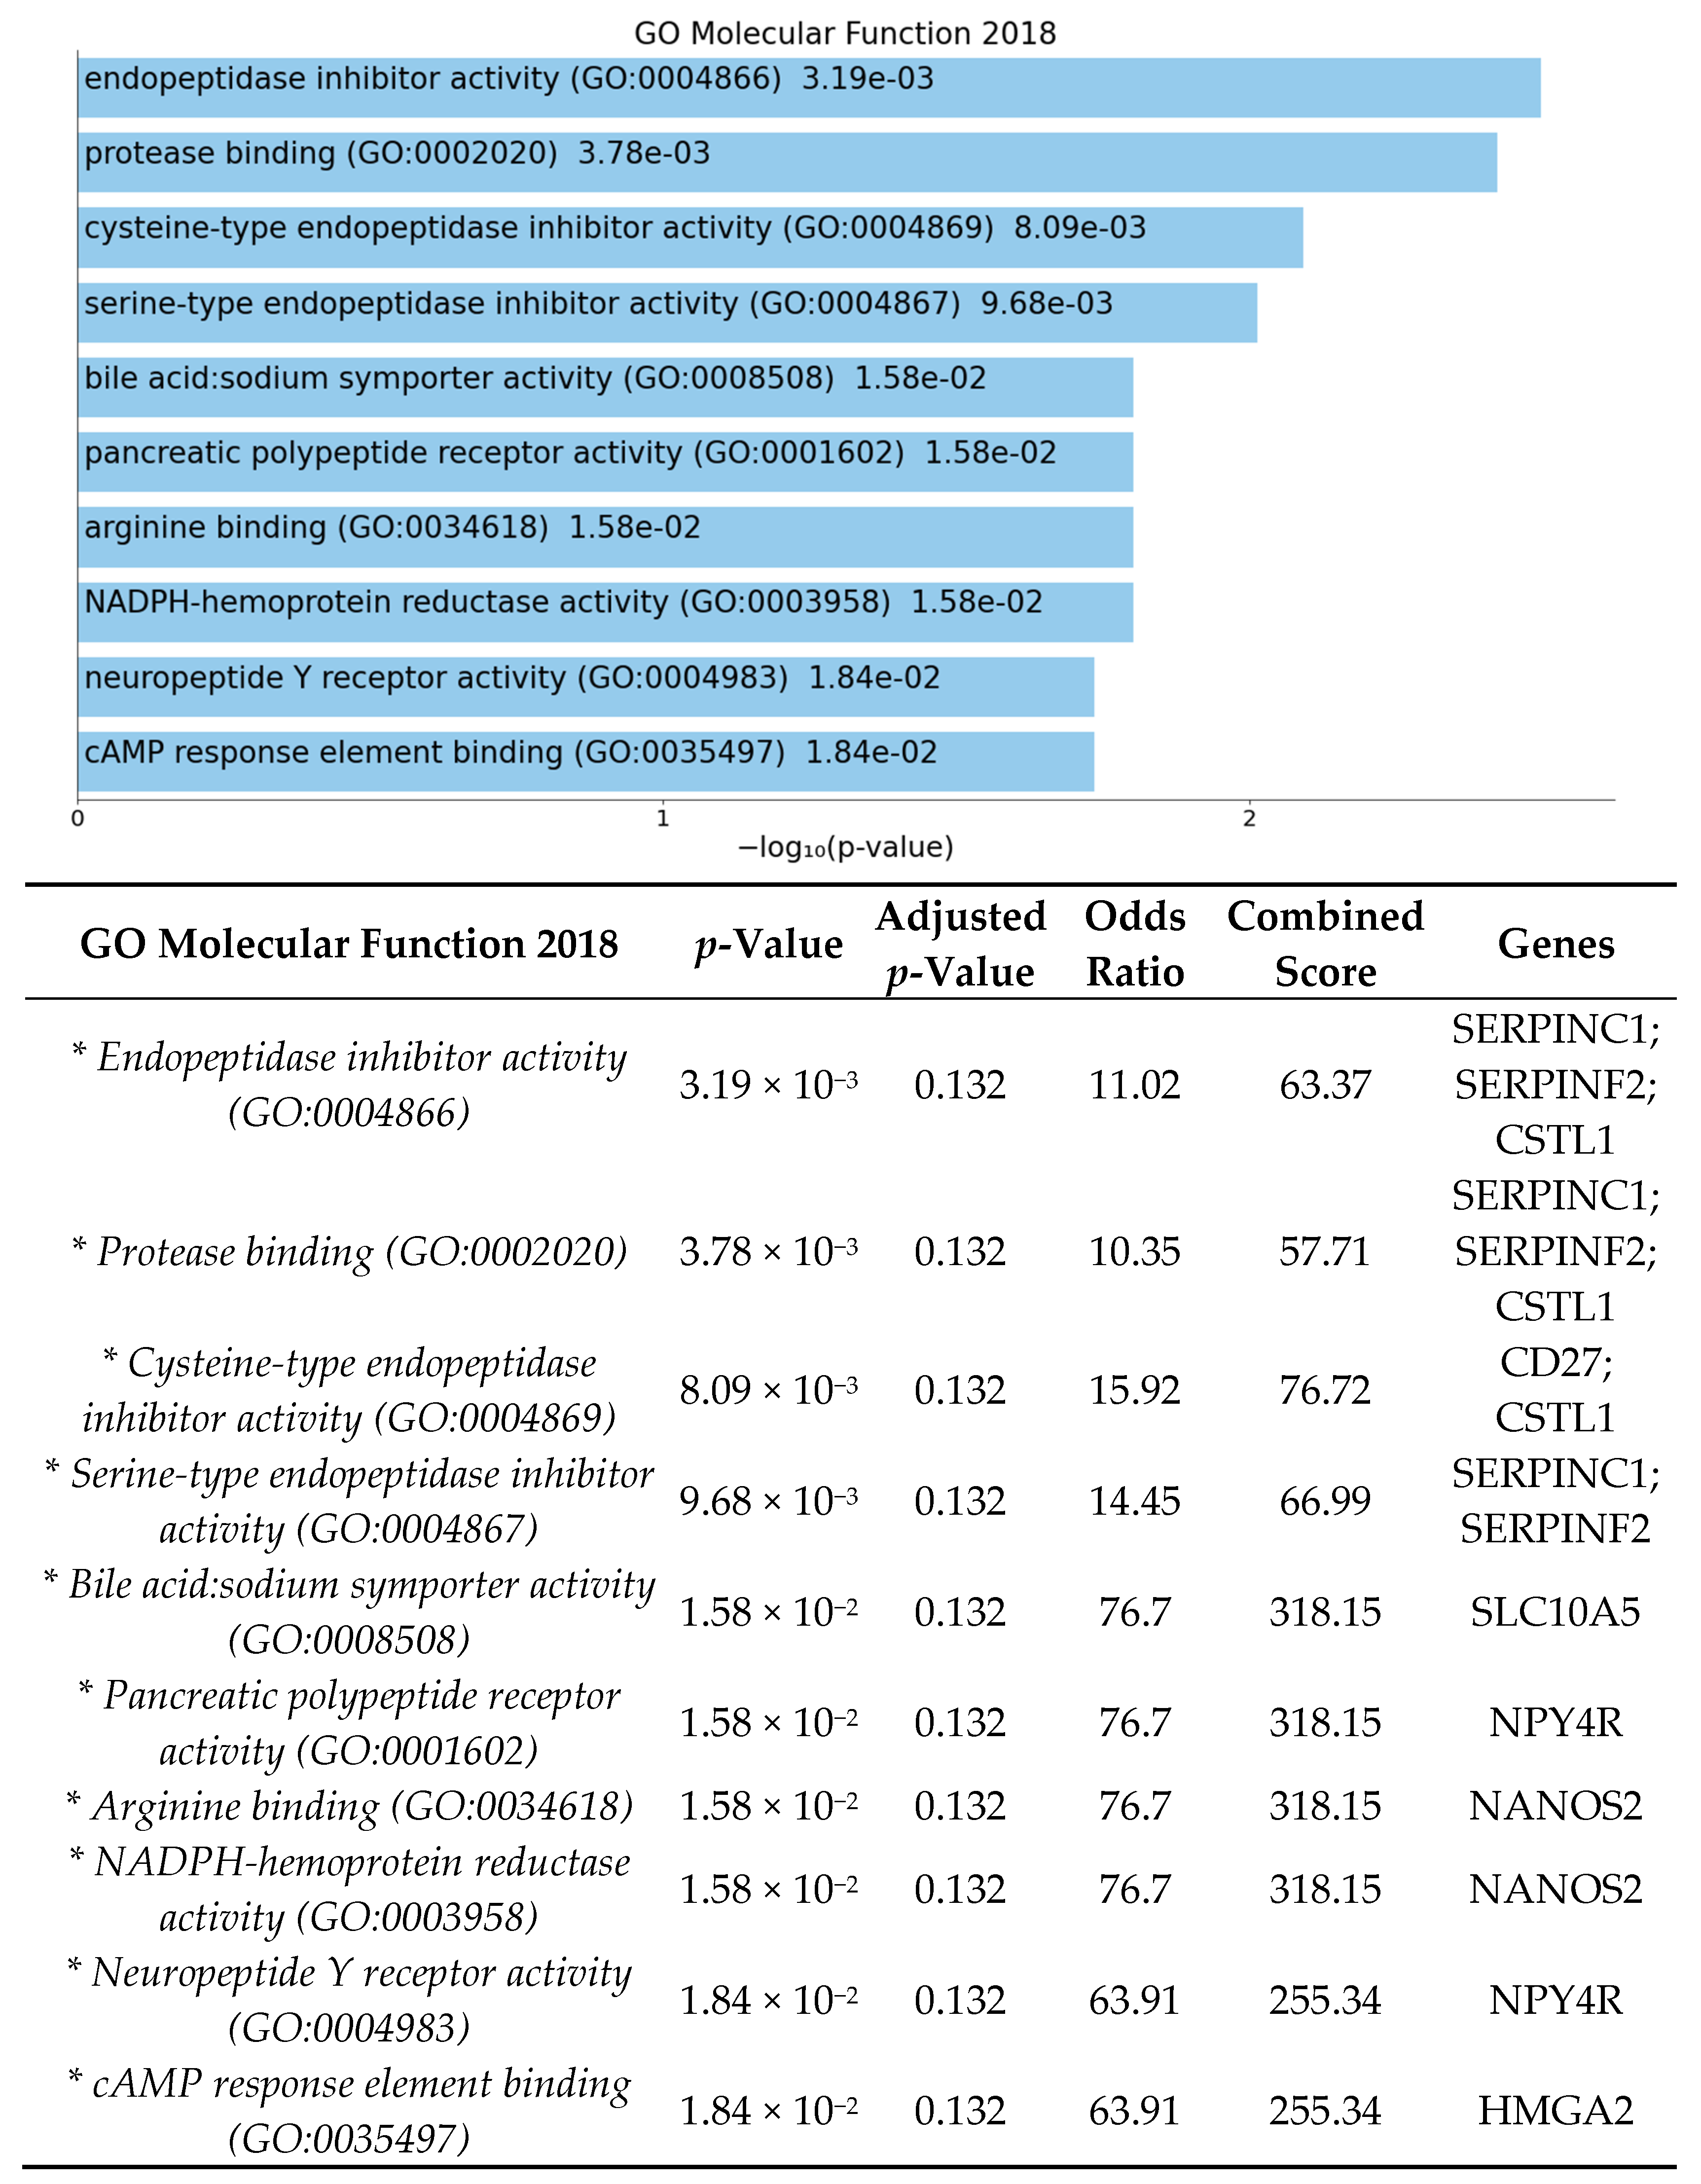
3.2. Significant Biologic Functions and Processes Are Overrepresented by Functional Enrichment Analysis

The enrichment analysis for gene ontology and pathways was performed using EnrichR [39,40,41]. Enrichment analysis was done to identify over-represented biological functions and classes from statistically significant differentially expressed genes. Human and mouse pathway analysis revealed that complement and coagulation cascades were significantly affected by HFD (Figure 2 and Figure 3). The analysis also shows that the top 3 biological processes are regulation of blood vessel diameter, inflammatory response, and negative regulation of endopeptidase (Figure 4). Molecular functions altered include endopeptidase inhibitor activity, protease binding, and cysteine-type endopeptidase inhibitor activity (Figure 5).

4. Discussion

To our knowledge, this is the first study to use high-throughput RNA sequencing of whole retinas from GF mice to demonstrate that high-fat diet alone is associated with changes in the retinal transcriptome in the absence of gut microbiome. Diet is a highly modifiable risk factor for development of vision threatening diseases, and understanding the relationship between diet and ocular pathology is a promising avenue for intervention. However, the biological pathways connecting diet to ocular disease are poorly understood and there is limited literature investigating the pathways involved.
Multiple clinical studies have demonstrated that diet plays a critical role in retinal health and contributes to diseases including age-related macular degeneration, diabetic retinopathy, and primary open angle glaucoma [42,43,44]. For example, recently published data from the AREDS study group reported that higher intake of saturated fatty acids, monounsaturated fatty acids, and oleic acid were associated with significant increased risk of progression to late AMD [45]. Supporting this, our team has previously published data showing that high-fat diet increased lesion size, vascular leakage, and sub-RPE deposits of laser-induced choroidal neovascularization in both wild-type and apolipoprotein E-deficient mice [15]. Recent evidence has suggested that the effects of high-fat diet on retinal disease are mediated by the gut microbiome. High-fat diets can cause gut microbial dysbiosis altering intestinal permeability and leading to low-grade inflammation with release of pro-angiogenic factors which may exacerbate ocular diseases such as proliferative diabetic retinopathy and neovascular AMD [18].
To further elucidate the biological connections between the diet–gut–retina axis, we aimed to investigate how diet affects the retinal transcriptome independently of the gut microbiome [30]. Germ-free mice, raised without exposure to any microbes, provide an ideal model to investigate this hypothesis [46]. In this study, we used GF mice fed a high-fat diet compared to a normal diet to explore retinal transcriptome changes induced by diet alone. After analysis of 19,681 total DEGs with removal of pseudogenes, 53 significant DEGs with LogFC > 1 were identified between groups (Figure 1). Enrichment analysis shows pathways involved in complement and coagulation cascades, inflammatory response, regulation of angiogenesis and blood vessel morphology, and endopeptidase inhibitor activity (Figure 2) were significantly affected by high-fat diet in germ-free mice.

4.1. High-Fat Diet May Affect Expression of Genes Involved in Inflammatory Pathways in Germ-Free Mice

Enrichment analysis of significant DEGs demonstrated that complement and coagulation cascades were significantly affected by high-fat diet (Figure 2). The complement and coagulation cascades are activated in response to retinal inflammation and vascular injury and have been highly implicated in retinal disease, especially in development of age-related macular degeneration, with multiple ongoing clinical trials currently being investigated [47,48,49]. Additional biological pathways identified were involved in inflammatory response, positive regulation of interleukin-8, protease binding, and regulation of endopeptidase activity (Figure 4 and Figure 5). Our results demonstrate that DEGs in pathways involved in retinal inflammation were significantly affected by high-fat diet (Table 1 and Table 2). C1qtnf2 is a member of the C1q and tumor necrosis factor related-protein (CTRP) superfamily reported to be involved in retinal inflammation and associated with late-onset retinal degeneration [50,51]. High expression of CTRPs has been reported in the drusen of human donor eyes with AMD [52]. Additionally, the CTRP family has reported to mediate glucose-induced oxidative stress and apoptosis in RPE cells [53]. Ifi204 (interferon gamma inducible protein) is a cytosolic DNA sensor involved in initiation of a type 1 interferon response and activation of the inflammasome pathway in response to bacterial or viral infection [54,55]. Multiple genes involved in activation of local ocular inflammatory response, including Ifi204, have been identified as mediators of retinal aging [56,57]. The H3 family of histones (including Hist1h3i) may be important in epigenetic modifications that promote a persistent pro-inflammatory state in diabetic retinopathy [58,59]. Multiple classes of histone genes are involved in regulation of the nucleosome and have been shown to be actively transcribed in both developing and aging retinal neurons [60]. Serpinc1 and Serpinf2 are members of the serine protease inhibitor (serpin) family, which were also found to be downregulated in our study. Proteins in the serpin family include endopeptidases that have been reported to be important in inhibiting angiogenesis and retinal cell death [61,62]. Proteomics analysis has identified multiple proteins in the serpin family including both Serpinc1 and Serpinf2 as potential serum biomarkers of retinal inflammation in diabetic retinopathy [63]. Additionally, VEGF is involved in the negative regulation of cysteine-type endopeptidase activity required for the apoptotic process [64].

4.2. High-Fat Diet May Influence Genes and Pathways Involved in Angiogenesis in Germ-Free Mice

Enrichment pathway analysis of the significant DEGs showed that pathways involved in regulation of angiogenesis, blood vessel diameter, and blood vessel morphogenesis (Figure 4) were affected by high-fat diet in germ-free mice. Bioactive lipids have been shown to be involved in regulation of pathologic retinal angiogenesis [65]. Our results identified several DEGs involved in regulation of angiogenesis (Table 1 and Table 2). Fat2 (FAT-like cadherin 2) was the most highly upregulated gene identified and has not previously been described in the retina [66]. The cadherin superfamily is involved in maintaining the blood–retinal barrier and cell migration during angiogenesis [67,68]. Neuropsin (Opn5) is expressed in retinal ganglion cells and has to been reported to mediate light-dependent retinal vascular development and mediate photoentrainment of circadian rhythm [69,70]. Nppb (Natriuretic peptide B) is involved in retinal response to hypoxia and may be an important regular of retinal vascular permeability [71,72].

4.3. High-Fat Diet May Affect Expression of Genes Involved in RPE Function and Ciliogenesis in Germ-Free Mice

Our data also suggest that high-fat diet may regulate expression of several genes involved RPE function and ciliogenesis in germ-free mice. Multiple DEGs related to olfactory receptor expression in the mouse retina (Olfr460, Olfr690, and Olfr691) were found to be affected by high-fat diet. Recent literature using RNA-sequencing of human retina has demonstrated that olfactory receptors are expressed in human retina in the retinal pigment epithelium, photoreceptor inner segments, ganglion cell layer, bipolar cells, and horizontal cells [73]. Retinal olfactory receptors may be important in retinal repair involving retinal pigment epithelium and retinal neurons [74,75]. Olfactory receptor expression is hypothesized to induce RPE proliferation and migration [76]. Gtsf1 (gametocyte specific factor 1) was also identified as highly downregulated by high-fat diet in the retina of germ-free mice and has not previously been reported to be expressed in the retina. Gtsf1 is involved in retrotransposon suppression in germ cells to prevent genomic instability [77]. Retrotransposons are also reported to be involved in propagation of Alu retroelements which may contribute to RPE cell death in age-related macular degeneration [78]. Cstl1 (cystatin-like 1) was also identified to be downregulated by high-fat diet; however, the specific function of Cstl1 is currently unknown. Other members of the cystatin superfamily, notably cystatin C, are highly expressed in the RPE and are associated with increased risk of AMD and Alzheimer’s disease [79,80,81,82]. Deup1 (deuterostome assembly protein 1) is an important component of the deuterosome involved in ciliogenesis [83]. While the exact role of Deup1 in the retina has not been determined, defects in primary cilium function in photoreceptors and the RPE leads to retinal degeneration as part of several syndromic ciliopathies like Bardet-Beidl syndrome and Alstrom syndrome [84]. Maats1 (Cilia and Flagella associated protein 91) has been identified as an important component of sperm flagellum structure and has not previously been described in the retina [85]. Mutations in the cilia and flagella-associated protein family have been linked with retinitis pigmentosa in familial amyotrophic lateral sclerosis [86].

4.4. Additional Genes and Pathways of Retinal Transcriptome Affected by High-Fat Diet in Germ-Free Mice

Several neuroendocrine related pathways including pancreatic polypeptide receptor activity and neuropeptide Y receptor activity were found to be affected by high-fat diet in germ-free mice.
Npy4r (neuropeptide Y receptor) is expressed in human retinal RPE and glial cells, and it is involved in neuronal calcium release, neuroprotection, and proliferation of glial cells [87]. Clinically, polymorphisms in NPY have been associated with increased risk of type 2 diabetes and development of diabetic retinopathy [88,89]. Neuropeptide b (Npb) is a relatively novel neuropeptide associated with regulation of the neuroendocrine system, pain processing, stress, and feeding behaviors [90]. Npb is widely expressed in the central nervous system, but expression has not previously been described in the retina [91].
Several identified significant DEGs have not previously been reported to be expressed in the retina. Rmi2 is involved in genome stability and has been reported to be associated with development of multiple types of cancer [92,93,94]. The physiologic role of Rnf222 has not been described currently; however, other members of the ring finger protein family have been associated with cerebral vascular diseases like Moyamoya disease and atherosclerotic stroke [95]. Cuzd1 (CUB and zona pellucida-like domains 1) has been reported to mediate epithelial proliferation of the mammary gland during pregnancy [96]. Cuzd1 has also been identified in human embryonic stems cells [97]. Single nucleotide polymorphisms (SNPs) in Cuzd1 have been associated with risk of age-related macular degeneration [98]. Dmgdh (dimethylglycine dehydrogenase) is involved in choline metabolism important in neurotransmitter and phospholipid biosynthesis [99]. Dmgdh was identified as part of a set of differentially expressed genes in the mitochondrial transcriptome human retinas with diabetic retinopathy [100]. Nanos2 (nanos C2HC-type zinc finger 2) is involved in germ cell differentiation and was also identified as differentially expressed in the retinal transcriptome of a mouse model of diabetic retinopathy [101].

5. Conclusions and Limitations

This study demonstrates novel data that suggest diet may modulate the retinal transcriptome in the absence of the gut microbiome. Unbiased analysis of the retinal transcriptome using high-throughput RNA-sequencing identified genes and pathways involved in retinal inflammation, angiogenesis, and RPE function, whose expression was influenced by HFD in the absence of gut microbiome. These genes and pathways may be involved in complex diet-microbiome-retina axis interactions that have only recently been recognized to play roles in retinal physiology and retinal disease pathogenesis.
Our study is limited to RNA-sequencing alone, and confirmatory studies of protein expression or activity were outside the scope of this investigation. The goal of our study was to use germ-free mice and RNA-sequencing technology to provide an unbiased characterization of the effects of HFD on global retinal gene expression in the absence of gut microbiome, as well as to identify potential novel targets within the retinal transcriptome that may guide future investigation on the diet-microbiome-retina axis.
Future studies with quantitative RT-PCR, proteomics, or functional assays are needed to further investigate potential functional pathways affected by HFD. In addition, studies using animal models of retinal diseases should include protein markers of angiogenesis and retinal apoptosis using multiplex assays, ELISA, Western blotting, or flow cytometry to better characterize how the genes and pathways revealed by high-throughput RNA-sequencing may be modulated by HFD. Applying a multiomics approach towards investigating the diet-microbiome-retina axis will be critical to delineate the effects of HFD on protein function, retinal cell physiology, and retinal disease pathogenesis [102].
While the germ-free mouse model is considered the gold-standard for microbiome studies, our conclusions are limited due to changes in baseline physiologic parameters that were altered by lack of microbiome in these mice. Retinal transcriptome changes identified in germ-free mice may be influenced by changes in immune development, metabolism, and digestion affected by the absence of microbiome.
Dietary modification is an easily modifiable risk factor, and understanding the interaction between diet, gut microbiome, and retinal disease has the potential to advance our understanding of vision-threatening diseases. Delineating these complex interactions could lead to the discovery of novel targets for intervention. While much of the focus has been on alterations to the gut microbiome as a key effector in disease pathogenesis, we present novel data suggesting that diet may affect retinal gene transcription when the microbiome is absent.
However, the microbiome-dependent and microbiome-independent effects of HFD on the retinal transcriptome remain unclear. The gut microbiome is an important mediator of the effects of diet on the retinal transcriptome, and it is currently unclear if these effects are overall protective or deleterious. Pathways in the retinal transcriptome affected by high-fat diet could be both attenuated or exacerbated by the presence of the gut microbiome, and these interactions are still poorly understood.
Despite the limitations, our study provides novel insight about potential pathways that could be involved in the diet–microbiome–retina axis and furthers our understanding of how diet may regulate disease pathogenesis and severity. Future studies are needed to define the precise role of diet in retinal diseases and to elucidate the complex, overlapping relationships in the diet–microbiome–retina axis and its involvement in retinal disease pathobiology.

Supplementary Materials

The following are available online at https://0-www-mdpi-com.brum.beds.ac.uk/article/10.3390/cells10082119/s1, Table S1 provides all 19,681 genes selected for DEG analysis.

Author Contributions

Conceptualization and methodology was carried out by D.S. (Dimitra Skondra) and E.B.C. Bioinformatics and formal validation of data was performed by B.X., M.D., D.D., U.N. and D.S. (Dinanath Sulakhe). Experimental procedures were carried out by U.N., A.M., with assistance by V.L. Original manuscript draft preparation was performed by D.D., U.N. and J.X. with review and editing by D.S. (Dimitra Skondra). Funding acquisition was from D.S. (Dimitra Skondra) with contributions by E.B.C., S.M.H. and J.X. All authors have read and agreed to the published version of the manuscript.

Funding

This research was funded by BrightFocus Foundation “Role of high fat diet and gut microbiome in macular degeneration” (Dimitra Skondra, M2018042), NIDDK P30 (E.B.C., DK42086), The University of Chicago Women’s Board (Dimitra Skondra), and the Illinois Society for the Prevention of Blindness (Dimitra Skondra, FP067271-01-PR and J.X., FP105447).

Institutional Review Board Statement

All animal experiments were performed in strict accordance with the recommendations in the Guide for the Care and Use of Laboratory Animals of the National Institutes of Health and approved by University of Chicago IACUC (#72557).

Informed Consent Statement

Not applicable.

Data Availability Statement

Complete dataset of identified DEGs is available in Supplementary Table S1.

Acknowledgments

We thank University of Chicago Core Genomics team, Peter Fabier and Mikayla Marchuk, for helping with RNA sequencing. Gnotobiotic Research Animal Facility (GRAF) staff (Betty Theriault and Melanie Spedale) and Donna Arvans for care of the germ-free animals and Chang lab members Candace Cham, Xiaorong Zhu, Jason Koval, and Amal Kambal.

Conflicts of Interest

The authors declare no conflict of interest. The funders had no role in the design of the study; in the collection, analyses, or interpretation of data; in the writing of the manuscript; or in the decision to publish the results.

References

  1. Kang, J.H.; Willett, W.C.; Rosner, B.A.; Buys, E.; Wiggs, J.L.; Pasquale, L.R. Association of Dietary Nitrate Intake With Primary Open-Angle Glaucoma: A Prospective Analysis From the Nurses’ Health Study and Health Professionals Follow-up Study. JAMA Ophthalmol. 2016, 134, 294–303. [Google Scholar] [CrossRef] [PubMed] [Green Version]
  2. Kang, J.H.; Pasquale, L.R.; Willett, W.C.; Rosner, B.A.; Egan, K.M.; Faberowski, N.; Hankinson, S.E. Dietary Fat Consumption and Primary Open-Angle Glaucoma. Am. J. Clin. Nutr. 2004, 79, 755–764. [Google Scholar] [CrossRef] [PubMed] [Green Version]
  3. Weikel, K.A.; Chiu, C.-J.; Taylor, A. Nutritional Modulation of Age-Related Macular Degeneration. Mol. Asp. Med. 2012, 33, 318–375. [Google Scholar] [CrossRef] [PubMed] [Green Version]
  4. Rinninella, E.; Mele, M.C.; Merendino, N.; Cintoni, M.; Anselmi, G.; Caporossi, A.; Gasbarrini, A.; Minnella, A.M. The Role of Diet, Micronutrients and the Gut Microbiota in Age-Related Macular Degeneration: New Perspectives from the Gut–Retina Axis. Nutrients 2018, 10, 1677. [Google Scholar] [CrossRef] [Green Version]
  5. Zemski Berry, K.A.; Gordon, W.C.; Murphy, R.C.; Bazan, N.G. Spatial Organization of Lipids in the Human Retina and Optic Nerve by MALDI Imaging Mass Spectrometry. J. Lipid Res. 2014, 55, 504–515. [Google Scholar] [CrossRef] [Green Version]
  6. Wong-Riley, M.T.T. Energy Metabolism of the Visual System. Eye Brain 2010, 2, 99–116. [Google Scholar] [CrossRef] [Green Version]
  7. Chiu, C.-J. The Relationship of Major American Dietary Patterns to Age-Related Macular Degeneration. Am. J. Ophthalmol. 2014, 158, 118–127. [Google Scholar] [CrossRef] [PubMed] [Green Version]
  8. Parekh, N.; Voland, R.P.; Moeller, S.M.; Blodi, B.A.; Ritenbaugh, C.; Chappell, R.J.; Wallace, R.B.; Mares, J.A.; CAREDS Research Study Group. Association between Dietary Fat Intake and Age-Related Macular Degeneration in the Carotenoids in Age-Related Eye Disease Study (CAREDS): An Ancillary Study of the Women’s Health Initiative. Arch. Ophthalmol. 2009, 127, 1483–1493. [Google Scholar] [CrossRef] [PubMed] [Green Version]
  9. Bressler, N.M. Age-Related Macular Degeneration Is the Leading Cause of Blindness. JAMA 2004, 291, 1900–1901. [Google Scholar] [CrossRef] [PubMed]
  10. Chong, E.W.-T.; Robman, L.D.; Simpson, J.A.; Hodge, A.M.; Aung, K.Z.; Dolphin, T.K.; English, D.R.; Giles, G.G.; Guymer, R.H. Fat Consumption and Its Association with Age-Related Macular Degeneration. Arch. Ophthalmol. 2009, 127, 674–680. [Google Scholar] [CrossRef] [PubMed] [Green Version]
  11. Clarkson-Townsend, D.A.; Douglass, A.J.; Singh, A.; Allen, R.S.; Uwaifo, I.N.; Pardue, M.T. Impacts of High Fat Diet on Ocular Outcomes in Rodent Models of Visual Disease. Exp. Eye Res. 2021, 204, 108440. [Google Scholar] [CrossRef]
  12. Chang, R.C.-A.; Shi, L.; Huang, C.C.-Y.; Kim, A.J.; Ko, M.L.; Zhou, B.; Ko, G.Y.-P. High-Fat Diet-Induced Retinal Dysfunction. Investig. Ophthalmol. Vis. Sci. 2015, 56, 2367–2380. [Google Scholar] [CrossRef] [Green Version]
  13. Lee, J.-J.; Wang, P.-W.; Yang, I.-H.; Huang, H.-M.; Chang, C.-S.; Wu, C.-L.; Chuang, J.-H. High-Fat Diet Induces Toll-like Receptor 4-Dependent Macrophage/Microglial Cell Activation and Retinal Impairment. Investig. Ophthalmol. Vis. Sci. 2015, 56, 3041–3050. [Google Scholar] [CrossRef] [Green Version]
  14. Albouery, M.; Buteau, B.; Grégoire, S.; Martine, L.; Gambert, S.; Bron, A.M.; Acar, N.; Chassaing, B.; Bringer, M.-A. Impact of a High-Fat Diet on the Fatty Acid Composition of the Retina. Exp. Eye Res. 2020, 196, 108059. [Google Scholar] [CrossRef] [PubMed]
  15. Skondra, D.; She, H.; Zambarakji, H.J.; Connolly, E.; Michaud, N.; Chan, P.; Kim, I.K.; Gragoudas, E.S.; Miller, J.W.; Hafezi-Moghadam, A. Effects of ApoE Deficiency, Aging and High Fat Diet on Laser-Induced Choroidal Neovascularization and Bruch’s Membrane-RPE Interface Morphology. Investig. Ophthalmol. Vis. Sci. 2007, 48, 1768. [Google Scholar]
  16. Asare-Bediako, B.; Noothi, S.K.; Li Calzi, S.; Athmanathan, B.; Vieira, C.P.; Adu-Agyeiwaah, Y.; Dupont, M.; Jones, B.A.; Wang, X.X.; Chakraborty, D.; et al. Characterizing the Retinal Phenotype in the High-Fat Diet and Western Diet Mouse Models of Prediabetes. Cells 2020, 9, 464. [Google Scholar] [CrossRef] [PubMed] [Green Version]
  17. Mohamed, I.N.; Hafez, S.S.; Fairaq, A.; Ergul, A.; Imig, J.D.; El-Remessy, A.B. Thioredoxin-Interacting Protein Is Required for Endothelial NLRP3 Inflammasome Activation and Cell Death in a Rat Model of High-Fat Diet. Diabetologia 2014, 57, 413–423. [Google Scholar] [CrossRef] [PubMed]
  18. Andriessen, E.M.; Wilson, A.M.; Mawambo, G.; Dejda, A.; Miloudi, K.; Sennlaub, F.; Sapieha, P. Gut Microbiota Influences Pathological Angiogenesis in Obesity-driven Choroidal Neovascularization. EMBO Mol. Med. 2016, 8, 1366–1379. [Google Scholar] [CrossRef]
  19. Jandhyala, S.M.; Talukdar, R.; Subramanyam, C.; Vuyyuru, H.; Sasikala, M.; Reddy, D.N. Role of the Normal Gut Microbiota. World J. Gastroenterol. WJG 2015, 21, 8787–8803. [Google Scholar] [CrossRef] [PubMed]
  20. Fujimura, K.E.; Lynch, S.V. Microbiota in Allergy and Asthma and the Emerging Relationship with the Gut Microbiome. Cell Host Microbe 2015, 17, 592–602. [Google Scholar] [CrossRef] [Green Version]
  21. Mohajeri, M.H.; Fata, G.L.; Steinert, R.E.; Weber, P. Relationship between the Gut Microbiome and Brain Function. Nutr. Rev. 2018, 76, 481–496. [Google Scholar] [CrossRef]
  22. Tang, W.H.W.; Kitai, T.; Hazen, S.L. Gut Microbiota in Cardiovascular Health and Disease. Circ. Res. 2017, 120, 1183–1196. [Google Scholar] [CrossRef] [PubMed] [Green Version]
  23. Ma, J.; Zhou, Q.; Li, H. Gut Microbiota and Nonalcoholic Fatty Liver Disease: Insights on Mechanisms and Therapy. Nutrients 2017, 9, 1124. [Google Scholar] [CrossRef] [PubMed]
  24. Rowan, S.; Taylor, A. The Role of Microbiota in Retinal Disease. Adv. Exp. Med. Biol. 2018, 1074, 429–435. [Google Scholar] [PubMed]
  25. Rowan, S.; Jiang, S.; Korem, T.; Szymanski, J.; Chang, M.-L.; Szelog, J.; Cassalman, C.; Dasuri, K.; McGuire, C.; Nagai, R.; et al. Involvement of a Gut-Retina Axis in Protection against Dietary Glycemia-Induced Age-Related Macular Degeneration. Proc. Natl. Acad. Sci. USA 2017, 114, E4472–E4481. [Google Scholar] [CrossRef] [PubMed] [Green Version]
  26. Gong, H.; Zhang, S.; Li, Q.; Zuo, C.; Gao, X.; Zheng, B.; Lin, M. Gut Microbiota Compositional Profile and Serum Metabolic Phenotype in Patients with Primary Open-Angle Glaucoma. Exp. Eye Res. 2020, 191, 107921. [Google Scholar] [CrossRef] [PubMed]
  27. Zinkernagel, M.S.; Zysset-Burri, D.C.; Keller, I.; Berger, L.E.; Leichtle, A.B.; Largiadèr, C.R.; Fiedler, G.M.; Wolf, S. Association of the Intestinal Microbiome with the Development of Neovascular Age-Related Macular Degeneration. Sci. Rep. 2017, 7, 40826. [Google Scholar] [CrossRef] [Green Version]
  28. Zysset-Burri, D.C.; Keller, I.; Berger, L.E.; Neyer, P.J.; Steuer, C.; Wolf, S.; Zinkernagel, M.S. Retinal Artery Occlusion Is Associated with Compositional and Functional Shifts in the Gut Microbiome and Altered Trimethylamine-N-Oxide Levels. Sci. Rep. 2019, 9, 15303. [Google Scholar] [CrossRef]
  29. Skondra, D.; Rodriguez, S.H.; Sharma, A.; Gilbert, J.; Andrews, B.; Claud, E.C. The Early Gut Microbiome Could Protect against Severe Retinopathy of Prematurity. J. AAPOS Off. Publ. Am. Assoc. Pediatr. Ophthalmol. Strabismus 2020, 24, 236–238. [Google Scholar] [CrossRef]
  30. Nadeem, U.; Xie, B.; Movahedan, A.; D’Souza, M.; Barba, H.; Deng, N.; Leone, V.A.; Chang, E.; Sulakhe, D.; Skondra, D. High Throughput RNA Sequencing of Mice Retina Reveals Metabolic Pathways Involved in the Gut-Retina Axis. bioRxiv 2020. [Google Scholar] [CrossRef]
  31. Orešič, M.; Seppänen-Laakso, T.; Yetukuri, L.; Bäckhed, F.; Hänninen, V. Gut Microbiota Affects Lens and Retinal Lipid Com-Position. Exp. Eye Res. 2009, 89, 604–607. [Google Scholar] [CrossRef]
  32. Belkaid, Y.; Hand, T.W. Role of the Microbiota in Immunity and Inflammation. Cell 2014, 157, 121–141. [Google Scholar] [CrossRef] [Green Version]
  33. Do, M.H.; Lee, E.; Oh, M.-J.; Kim, Y.; Park, H.-Y. High-Glucose or -Fructose Diet Cause Changes of the Gut Microbiota and Metabolic Disorders in Mice without Body Weight Change. Nutrients 2018, 10, 761. [Google Scholar] [CrossRef] [Green Version]
  34. Murphy, E.A.; Velazquez, K.T.; Herbert, K.M. Influence of High-Fat Diet on Gut Microbiota: A Driving Force for Chronic Disease Risk. Curr. Opin. Clin. Nutr. Metab. Care 2015, 18, 515–520. [Google Scholar] [CrossRef]
  35. David, L.A.; Maurice, C.F.; Carmody, R.N.; Gootenberg, D.B.; Button, J.E.; Wolfe, B.E.; Ling, A.V.; Devlin, A.S.; Varma, Y.; Fischbach, M.A.; et al. Diet Rapidly and Reproducibly Alters the Human Gut Microbiome. Nature 2014, 505, 559–563. [Google Scholar] [CrossRef] [PubMed] [Green Version]
  36. Theriault, B.; Wang, Y.; Chen, L.; Vest, A.; Bartman, C.; Alegre, M.-L. Long-Term Maintenance of Sterility After Skin Transplantation in Germ-Free Mice. Transplant. Direct 2015, 1, e28. [Google Scholar] [CrossRef] [PubMed]
  37. Chen, Y.; Lun, A.T.L.; Smyth, G.K. From Reads to Genes to Pathways: Differential Expression Analysis of RNA-Seq Experiments Using Rsubread and the EdgeR Quasi-Likelihood Pipeline. F1000Research 2016, 5, 1438. [Google Scholar] [PubMed] [Green Version]
  38. Robinson, M.D.; McCarthy, D.J.; Smyth, G.K. edgeR: A Bioconductor Package for Differential Expression Analysis of Digital Gene Expression Data. Bioinformatics 2010, 26, 139–140. [Google Scholar] [CrossRef] [Green Version]
  39. Xie, Z.; Bailey, A.; Kuleshov, M.V.; Clarke, D.J.B.; Evangelista, J.E.; Jenkins, S.L.; Lachmann, A.; Wojciechowicz, M.L.; Kropiwnicki, E.; Jagodnik, K.M.; et al. Gene Set Knowledge Discovery with Enrichr. Curr. Protoc. 2021, 1, e90. [Google Scholar] [CrossRef]
  40. Kuleshov, M.V. Enrichr: A comprehensive gene set enrichment analysis web server 2016 update. Nucleic Acids Res. 2016, 44, 90–97. [Google Scholar] [CrossRef] [Green Version]
  41. Chen, E.Y.; Tan, C.M.; Kou, Y.; Duan, Q.; Wang, Z.; Meirelles, G.V.; Clark, N.R.; Ma’ayan, A. Enrichr: Interactive and Collaborative HTML5 Gene List Enrichment Analysis Tool. BMC Bioinform. 2013, 14, 128. [Google Scholar] [CrossRef] [PubMed] [Green Version]
  42. Keenan, T.D.; Agrón, E.; Mares, J.; Clemons, T.E.; van Asten, F.; Swaroop, A.; Chew, E.Y.; Age-Related Eye Disease Studies (AREDS) 1 and 2 Research Groups. Adherence to the Mediterranean Diet and Progression to Late Age-Related Macular Degeneration in the Age-Related Eye Disease Studies 1 and 2. Ophthalmology 2020, 127, 1515–1528. [Google Scholar] [CrossRef]
  43. Dow, C.; Mancini, F.; Rajaobelina, K.; Boutron-Ruault, M.-C.; Balkau, B.; Bonnet, F.; Fagherazzi, G. Diet and Risk of Diabetic Retinopathy: A Systematic Review. Eur. J. Epidemiol. 2018, 33, 141–156. [Google Scholar] [CrossRef] [PubMed]
  44. Wang, Y.E.; Tseng, V.L.; Yu, F.; Caprioli, J.; Coleman, A.L. Association of Dietary Fatty Acid Intake With Glaucoma in the United States. JAMA Ophthalmol. 2018, 136, 141–147. [Google Scholar] [CrossRef] [PubMed] [Green Version]
  45. Agrón, E.; Mares, J.; Clemons, T.E.; Swaroop, A.; Chew, E.Y.; Keenan, T.D.L.; AREDS and AREDS2 Research Groups. Dietary Nutrient Intake and Progression to Late Age-Related Macular Degeneration in the Age-Related Eye Disease Studies 1 and 2. Ophthalmology 2021, 128, 425–442. [Google Scholar] [CrossRef] [PubMed]
  46. Kennedy, E.A.; King, K.Y.; Baldridge, M.T. Mouse Microbiota Models: Comparing Germ-Free Mice and Antibiotics Treatment as Tools for Modifying Gut Bacteria. Front. Physiol. 2018, 9, 1534. [Google Scholar] [CrossRef] [PubMed] [Green Version]
  47. Boyer, D.S.; Schmidt-Erfurth, U.; Lookeren Campagne, M.; Henry, E.C.; Brittain, C. The Pathophysiology of Geographic Atrophy Secondary to Age-Related Macular Degeneration and the Complement Pathway as a Therapeutic Target. Retina 2017, 37, 819–835. [Google Scholar] [CrossRef] [PubMed]
  48. Lorés-Motta, L.; Paun, C.C.; Corominas, J.; Pauper, M.; Geerlings, M.J.; Altay, L.; Schick, T.; Daha, M.R.; Fauser, S.; Hoyng, C.B.; et al. Genome-Wide Association Study Reveals Variants in CFH and CFHR4 Associated with Systemic Complement Activation: Implications in Age-Related Macular Degeneration. Ophthalmology 2018, 125, 1064–1074. [Google Scholar] [CrossRef] [Green Version]
  49. Kassa, E.; Ciulla, T.A.; Hussain, R.M.; Dugel, P.U. Complement Inhibition as a Therapeutic Strategy in Retinal Disorders. Expert Opin. Biol. Ther. 2019, 19, 335–342. [Google Scholar] [CrossRef]
  50. Lee, J.; Yoo, J.H.; Kim, H.S.; Cho, Y.K.; Lee, Y.L.; Lee, W.J.; Park, J.-Y.; Jung, C.H. C1q/TNF-Related Protein-9 Attenuates Palmitic Acid-Induced Endothelial Cell Senescence via Increasing Autophagy. Mol. Cell. Endocrinol. 2021, 521, 111114. [Google Scholar] [CrossRef]
  51. Chavali, V.R.M.; Sommer, J.R.; Petters, R.M.; Ayyagari, R. Identification of a Promoter for the Human C1q-Tumor Necrosis Factor–Related Protein-5 Gene Associated with Late-Onset Retinal Degeneration. Investig. Ophthalmol. Vis. Sci. 2010, 51, 5499–5507. [Google Scholar] [CrossRef] [PubMed] [Green Version]
  52. Shinomiya, K.; Mukai, A.; Yoneda, K.; Ueno, M.; Sotozono, C.; Kinoshita, S.; Hamuro, J. The High Expression of C1q and Tumor Necrosis Factor- Related Protein (CTRP) 6, a New Complement Regulatory Factor, in the Drusen of Age-Related Macular Degeneration Eyes. Investig. Ophthalmol. Vis. Sci. 2016, 57, 5013. [Google Scholar]
  53. Cheng, Y.; Qi, Y.; Liu, S.; Di, R.; Shi, Q.; Li, J.; Pei, C. C1q/TNF-Related Protein 9 Inhibits High Glucose-Induced Oxidative Stress and Apoptosis in Retinal Pigment Epithelial Cells Through the Activation of AMPK/Nrf2 Signaling Pathway. Cell Transplant. 2020, 29, 963689720962052. [Google Scholar] [CrossRef] [PubMed]
  54. Unterholzner, L.; Keating, S.E.; Baran, M.; Horan, K.A.; Jensen, S.B.; Sharma, S.; Sirois, C.M.; Jin, T.; Latz, E.; Xiao, T.S.; et al. IFI16 Is an Innate Immune Sensor for Intracellular DNA. Nat. Immunol. 2010, 11, 997–1004. [Google Scholar] [CrossRef] [Green Version]
  55. Chen, W.; Yu, S.-X.; Zhou, F.-H.; Zhang, X.-J.; Gao, W.-Y.; Li, K.-Y.; Liu, Z.-Z.; Han, W.-Y.; Yang, Y.-J. DNA Sensor IFI204 Contributes to Host Defense Against Staphylococcus Aureus Infection in Mice. Front. Immunol. 2019, 10, 474. [Google Scholar] [CrossRef] [PubMed]
  56. Chen, M.; Muckersie, E.; Forrester, J.V.; Xu, H. Immune Activation in Retinal Aging: A Gene Expression Study. Investig. Ophthalmol. Vis. Sci. 2010, 51, 5888–5896. [Google Scholar] [CrossRef] [PubMed]
  57. Chen, M.; Luo, C.; Zhao, J.; Devarajan, G.; Xu, H. Immune Regulation in the Aging Retina. Prog. Retin. Eye Res. 2019, 69, 159–172. [Google Scholar] [CrossRef] [Green Version]
  58. Zhong, Q.; Kowluru, R.A. Role of Histone Acetylation in the Development of Diabetic Retinopathy and the Metabolic Memory Phenomenon. J Cell Biochem. 2010, 110, 1306–1313. [Google Scholar] [CrossRef] [Green Version]
  59. Villeneuve, L.M.; Reddy, M.A.; Lanting, L.L.; Wang, M.; Meng, L.; Natarajan, R. Epigenetic Histone H3 Lysine 9 Methylation in Metabolic Memory and Inflammatory Phenotype of Vascular Smooth Muscle Cells in Diabetes. Proc. Natl. Acad. Sci. USA 2008, 105, 9047–9052. [Google Scholar] [CrossRef] [Green Version]
  60. Banday, A.R.; Baumgartner, M.; Al Seesi, S.; Karunakaran, D.K.P.; Venkatesh, A.; Congdon, S.; Lemoine, C.; Kilcollins, A.M.; Mandoiu, I.; Punzo, C.; et al. Replication-Dependent Histone Genes Are Actively Transcribed in Differentiating and Aging Retinal Neurons. Cell Cycle 2014, 13, 2526–2541. [Google Scholar] [CrossRef] [PubMed] [Green Version]
  61. Steele, F.R.; Chader, G.J.; Johnson, L.V.; Tombran-Tink, J. Pigment Epithelium-Derived Factor: Neurotrophic Activity and Identification as a Member of the Serine Protease Inhibitor Gene Family. Proc. Natl. Acad. Sci. USA 1993, 90, 1526–1530. [Google Scholar] [CrossRef] [Green Version]
  62. He, X.; Cheng, R.; Benyajati, S.; Ma, J.-X. PEDF and Its Roles in Physiological and Pathological Conditions: Implication in Diabetic and Hypoxia-Induced Angiogenic Diseases. Clin. Sci. 2015, 128, 805–823. [Google Scholar] [CrossRef] [PubMed] [Green Version]
  63. Youngblood, H.; Robinson, R.; Sharma, A.; Sharma, S. Proteomic Biomarkers of Retinal Inflammation in Diabetic Retinopathy. Int. J. Mol. Sci. 2019, 20, 4755. [Google Scholar] [CrossRef] [PubMed] [Green Version]
  64. Kou, B.; Ni, J.; Vatish, M.; Singer, D.R.J. Xanthine Oxidase Interaction with Vascular Endothelial Growth Factor in Human Endothelial Cell Angiogenesis. Microcirculation 2008, 15, 251–267. [Google Scholar] [CrossRef] [PubMed]
  65. Elmasry, K.; Ibrahim, A.S.; Abdulmoneim, S.; Al-Shabrawey, M. Bioactive Lipids and Pathological Retinal Angiogenesis. Br. J. Pharmacol. 2019, 176, 93–109. [Google Scholar] [CrossRef] [PubMed] [Green Version]
  66. Sadeqzadeh, E.; Bock, C.E.; Thorne, R.F. Sleeping Giants: Emerging Roles for the Fat Cadherins in Health and Disease. Med. Res. Rev. 2014, 34, 190–221. [Google Scholar] [CrossRef] [PubMed]
  67. Horne-Badovinac, S. Fat-like Cadherins in Cell Migration—Leading from Both the Front and the Back. Curr. Opin. Cell Biol. 2017, 48, 26–32. [Google Scholar] [CrossRef]
  68. Cao, J.; Ehling, M.; März, S.; Seebach, J.; Tarbashevich, K.; Sixta, T.; Pitulescu, M.E.; Werner, A.-C.; Flach, B.; Montanez, E.; et al. Polarized Actin and VE-Cadherin Dynamics Regulate Junctional Remodelling and Cell Migration during Sprouting Angiogenesis. Nat. Commun. 2017, 8, 2210. [Google Scholar] [CrossRef] [PubMed] [Green Version]
  69. Nguyen, M.-T.T. An Opsin 5–Dopamine Pathway Mediates Light-Dependent Vascular Development in the Eye. Nat. Cell Biol. 2019, 21, 420–429. [Google Scholar] [CrossRef]
  70. Buhr, E.D.; Yue, W.W.S.; Ren, X.; Jiang, Z.; Liao, H.-W.R.; Mei, X.; Vemaraju, S.; Nguyen, M.-T.; Reed, R.R.; Lang, R.A.; et al. Neuropsin (OPN5)-Mediated Photoentrainment of Local Circadian Oscillators in Mammalian Retina and Cornea. Proc. Natl. Acad. Sci. USA 2015, 112, 13093–13098. [Google Scholar] [CrossRef] [Green Version]
  71. Aaltonen, V.; Kinnunen, K.; Jouhilahti, E.-M.; Peltonen, J.; Nikinmaa, M.; Kaarniranta, K.; Arjamaa, O. Hypoxic Conditions Stimulate the Release of B-Type Natriuretic Peptide from Human Retinal Pigment Epithelium Cell Culture. Acta Ophthalmol. (Copenh.) 2014, 92, 740–744. [Google Scholar] [CrossRef] [PubMed]
  72. Rollín, R.; Mediero, A.; Roldán-Pallarés, M.; Fernández-Cruz, A.; Fernández-Durango, R. Natriuretic Peptide System in the Human Retina. Mol. Vis. 2004, 10, 15–22. [Google Scholar]
  73. Jovancevic, N.; Wunderlich, K.A.; Haering, C.; Flegel, C.; Maßberg, D.; Weinrich, M.; Weber, L.; Tebbe, L.; Kampik, A.; Gisselmann, G.; et al. Deep Sequencing of the Human Retinae Reveals the Expression of Odorant Receptors. Front. Cell. Neurosci. 2017, 11, 3. [Google Scholar] [CrossRef] [Green Version]
  74. Pavan, B.; Capuzzo, A.; Dalpiaz, A. Potential Therapeutic Effects of Odorants through Their Ectopic Receptors in Pigmented Cells. Drug Discov. Today 2017, 22, 1123–1130. [Google Scholar] [CrossRef]
  75. Pavan, B.; Dalpiaz, A. Retinal Pigment Epithelial Cells as a Therapeutic Tool and Target against Retinopathies. Drug Discov. Today 2018, 23, 1672–1679. [Google Scholar] [CrossRef]
  76. Jovancevic, N.; Khalfaoui, S.; Weinrich, M.; Weidinger, D.; Simon, A.; Kalbe, B.; Kernt, M.; Kampik, A.; Gisselmann, G.; Gelis, L.; et al. Odorant Receptor 51E2 Agonist β-Ionone Regulates RPE Cell Migration and Proliferation. Front. Physiol. 2017, 8, 888. [Google Scholar] [CrossRef] [Green Version]
  77. Yoshimura, T.; Watanabe, T.; Kuramochi-Miyagawa, S.; Takemoto, N.; Shiromoto, Y.; Kudo, A.; Kanai-Azuma, M.; Tashiro, F.; Miyazaki, S.; Katanaya, A.; et al. Mouse GTSF1 Is an Essential Factor for Secondary PiRNA Biogenesis. EMBO Rep. 2018, 19, e42054. [Google Scholar] [CrossRef]
  78. Fukuda, S.; Varshney, A.; Fowler, B.J.; Wang, S.-B.; Narendran, S.; Ambati, K.; Yasuma, T.; Magagnoli, J.; Leung, H.; Hirahara, S.; et al. Cytoplasmic Synthesis of Endogenous Alu Complementary DNA via Reverse Transcription and Implications in Age-Related Macular Degeneration. Proc. Natl. Acad. Sci. USA 2021, 118, e2022751118. [Google Scholar] [CrossRef] [PubMed]
  79. Zurdel, J.; Finckh, U.; Menzer, G.; Nitsch, R.M.; Richard, G. CST3 Genotype Associated with Exudative Age Related Macular Degeneration. Br. J. Ophthalmol. 2002, 86, 214–219. [Google Scholar] [CrossRef] [PubMed]
  80. Crawford, F.C.; Freeman, M.J.; Schinka, J.A.; Abdullah, L.I.; Gold, M.; Hartman, R.; Krivian, K.; Morris, M.D.; Richards, D.; Duara, R.; et al. A Polymorphism in the Cystatin C Gene Is a Novel Risk Factor for Late-Onset Alzheimer’s Disease. Neurology 2000, 55, 763–768. [Google Scholar] [CrossRef] [PubMed]
  81. Butler, J.M.; Sharif, U.; Ali, M.; McKibbin, M.; Thompson, J.P.; Gale, R.; Yang, Y.C.; Inglehearn, C.; Paraoan, L. A Missense Variant in CST3 Exerts a Recessive Effect on Susceptibility to Age-Related Macular Degeneration Resembling Its Association with Alzheimer’s Disease. Hum. Genet. 2015, 134, 705–715. [Google Scholar] [CrossRef] [Green Version]
  82. Carlsson, E.; Supharattanasitthi, W.; Jackson, M.; Paraoan, L. Increased Rate of Retinal Pigment Epithelial Cell Migration and Pro-Angiogenic Potential Ensuing From Reduced Cystatin C Expression. Investig. Ophthalmol. Vis. Sci. 2020, 61, 9. [Google Scholar] [CrossRef]
  83. Yamamoto, S.; Yabuki, R.; Kitagawa, D. Biophysical and Biochemical Properties of Deup1 Self-Assemblies: A Potential Driver for Deuterosome Formation during Multiciliogenesis. Biol. Open 2021, 10, bio056432. [Google Scholar] [CrossRef]
  84. Bujakowska, K.M.; Liu, Q.; Pierce, E.A. Photoreceptor Cilia and Retinal Ciliopathies. Cold Spring Harb. Perspect. Biol. 2017, 9, a028274. [Google Scholar] [CrossRef]
  85. Martinez, G.; Beurois, J.; Dacheux, D.; Cazin, C.; Bidart, M.; Kherraf, Z.-E.; Robinson, D.R.; Satre, V.; Le Gac, G.; Ka, C.; et al. Biallelic Variants in MAATS1 Encoding CFAP91, a Calmodulin-Associated and Spoke-Associated Complex Protein, Cause Severe Astheno-Teratozoospermia and Male Infertility. J. Med. Genet. 2020, 57, 708–716. [Google Scholar] [CrossRef] [PubMed]
  86. Kurashige, T.; Morino, H.; Matsuda, Y.; Mukai, T.; Murao, T.; Toko, M.; Kume, K.; Ohsawa, R.; Torii, T.; Tokinobu, H.; et al. Retinitis Pigmentosa Prior to Familial ALS Caused by a Homozygous Cilia and Flagella-Associated Protein 410 Mutation. J. Neurol. Neurosurg. Psychiatry 2020, 91, 220–222. [Google Scholar] [CrossRef] [PubMed]
  87. Santos-Carvalho, A.; Ambrósio, A.F.; Cavadas, C. Neuropeptide Y System in the Retina: From Localization to Function. Prog. Retin. Eye Res. 2015, 47, 19–37. [Google Scholar] [CrossRef]
  88. Jaakkola, U.; Pesonen, U.; Vainio-Jylhä, E.; Koulu, M.; Pöllönen, M.; Kallio, J. The Leu7Pro Polymorphism of Neuropeptide Y Is Associated with Younger Age of Onset of Type 2 Diabetes Mellitus and Increased Risk for Nephropathy in Subjects with Diabetic Retinopathy. Exp. Clin. Endocrinol. Diabetes Off. J. Ger. Soc. Endocrinol. Ger. Diabetes Assoc. 2006, 114, 147–152. [Google Scholar] [CrossRef]
  89. Koulu, M.; Movafagh, S.; Tuohimaa, J.; Jaakkola, U.; Kallio, J.; Pesonen, U.; Geng, Y.; Karvonen, M.K.; Vainio-Jylhä, E.; Pöllönen, M.; et al. Neuropeptide Y and Y2-Receptor Are Involved in Development of Diabetic Retinopathy and Retinal Neovascularization. Ann. Med. 2004, 36, 232–240. [Google Scholar] [CrossRef] [PubMed]
  90. Dvorakova, M.C. Distribution and Function of Neuropeptides W/B Signaling System. Front. Physiol. 2018, 9, 981. [Google Scholar] [CrossRef]
  91. Singh, G.; Davenport, A.P. Neuropeptide B and W: Neurotransmitters in an Emerging G-Protein-Coupled Receptor System. Br. J. Pharmacol. 2006, 148, 1033–1041. [Google Scholar] [CrossRef] [PubMed] [Green Version]
  92. Zhan, W.; Liu, Y.; Gao, Y.; Gong, R.; Wang, W.; Zhang, R.; Wu, Y.; Kang, T.; Wei, D. RMI2 Plays Crucial Roles in Growth and Metastasis of Lung Cancer. Signal Transduct. Target. Ther. 2020, 5, 1–3. [Google Scholar] [CrossRef] [PubMed]
  93. Liu, J.; Nie, S.; Gao, M.; Jiang, Y.; Wan, Y.; Ma, X.; Zhou, S.; Cheng, W. Identification of EPHX2 and RMI2 as Two Novel Key Genes in Cervical Squamous Cell Carcinoma by an Integrated Bioinformatic Analysis. J. Cell. Physiol. 2019, 234, 21260–21273. [Google Scholar] [CrossRef]
  94. Hudson, D.F.; Amor, D.J.; Boys, A.; Butler, K.; Williams, L.; Zhang, T.; Kalitsis, P. Loss of RMI2 Increases Genome Instability and Causes a Bloom-Like Syndrome. PLoS Genet. 2016, 12, e1006483. [Google Scholar] [CrossRef] [PubMed] [Green Version]
  95. Choi, E.; Lee, H.; Chung, J.; Seo, W.; Kim, G.; Ki, C.; Kim, Y.; Bang, O.Y. Ring Finger Protein 213 Variant and Plaque Characteristics, Vascular Remodeling, and Hemodynamics in Patients With Intracranial Atherosclerotic Stroke: A High-Resolution Magnetic Resonance Imaging and Hemodynamic Study. J. Am. Heart Assoc. 2019, 8, e011996. [Google Scholar] [CrossRef]
  96. Mapes, J.; Li, Q.; Kannan, A.; Anandan, L.; Laws, M.; Lydon, J.P.; Bagchi, I.C.; Bagchi, M.K. CUZD1 Is a Critical Mediator of the JAK/STAT5 Signaling Pathway That Controls Mammary Gland Development during Pregnancy. PLoS Genet. 2017, 13, e1006654. [Google Scholar] [CrossRef] [PubMed] [Green Version]
  97. Brink, T.C.; Sudheer, S.; Janke, D.; Jagodzinska, J.; Jung, M.; Adjaye, J. The Origins of Human Embryonic Stem Cells: A Biological Conundrum. Cells Tissues Organs 2008, 188, 9–22. [Google Scholar] [CrossRef] [PubMed]
  98. Schmidt, S.; Hauser, M.A.; Scott, W.K.; Postel, E.A.; Agarwal, A.; Gallins, P.; Wong, F.; Chen, Y.S.; Spencer, K.; Schnetz-Boutaud, N.; et al. Cigarette Smoking Strongly Modifies the Association of LOC387715 and Age-Related Macular Degeneration. Am. J. Hum. Genet. 2006, 78, 852–864. [Google Scholar] [CrossRef] [Green Version]
  99. Wortmann, S.B.; Mayr, J.A. Choline-related-inherited metabolic diseases—A mini review. J. Inherit. Metab. Dis. 2019, 42, 237–242. [Google Scholar] [CrossRef] [Green Version]
  100. Govindarajan, G.; Mathews, S.; Srinivasan, K.; Ramasamy, K.; Periasamy, S. Establishment of Human Retinal Mitoscriptome Gene Expression Signature for Diabetic Retinopathy Using Cadaver Eyes. Mitochondrion 2017, 36, 150–181. [Google Scholar] [CrossRef]
  101. Kandpal, R.P.; Rajasimha, H.K.; Brooks, M.J.; Nellissery, J.; Wan, J.; Qian, J.; Kern, T.S.; Swaroop, A. Transcriptome Analysis Using next Generation Sequencing Reveals Molecular Signatures of Diabetic Retinopathy and Efficacy of Candidate Drugs. Mol. Vis. 2012, 18, 1123–1146. [Google Scholar]
  102. Manzoni, C.; Kia, D.A.; Vandrovcova, J.; Hardy, J.; Wood, N.W.; Lewis, P.A.; Ferrari, R. Genome, Transcriptome and Proteome: The Rise of Omics Data and Their Integration in Biomedical Sciences. Brief. Bioinform. 2018, 19, 286–302. [Google Scholar] [CrossRef]
Figure 1. Heatmap with hierarchal clustering demonstrating 53 differentially expressed genes (DEGs) with a logFC greater than 1 and p-value < 0.01 between germ-free mice on normal diet (GF-ND, n = 4) and germ-free mice on high-fat diet (GF-HFD, n = 4). Z-score is calculated from LogFC with red and blue indicating upregulated and downregulated genes, respectively.
Cells 10 02119 g001
Figure 2. Gene list enrichment analysis of significant DEGs between GF-HFD mice (n = 4) and GF-ND mice (n = 4) using EnrichR. The bar graph shows a ranked list by p-value of the top 10 over-represented mouse pathways with significant pathways indicated in blue (p-value < 0.05). The corresponding table demonstrates detailed statistics and involved genes with significant pathways indicated by an asterisk (p-value < 0.05).
Cells 10 02119 g002
Figure 3. Gene list enrichment analysis of significant DEGs between GF-HFD mice (n = 4) and GF-ND mice (n = 4) using EnrichR. The bar graph shows a ranked list by p-value of the top 10 over-represented human pathways with significant pathways indicated in blue (p-value < 0.05). The corresponding table demonstrates detailed statistics and involved genes with significant pathways indicated by an asterisk (p-value < 0.05).
Cells 10 02119 g003
Figure 4. Gene list enrichment analysis of significant DEGs between GF-HFD mice (n = 4) and GF-ND mice (n = 4) using EnrichR. The bar graph shows a ranked list by p-value of the top 10 over-represented biological processes with significant processes indicated in blue (p-value < 0.05). The corresponding table demonstrates detailed statistics and involved genes with significant processes indicated by an asterisk (p-value < 0.05).
Cells 10 02119 g004
Figure 5. Gene list enrichment analysis of significant DEGs between GF-HFD mice (n = 4) and GF-ND mice (n = 4) using EnrichR. The bar graph shows a ranked list by p-value of the top 10 over-represented molecular functions with significant functions indicated in blue (p-value < 0.05). The corresponding table demonstrates detailed statistics and involved genes with significant functions indicated by an asterisk (p-value < 0.05).
Cells 10 02119 g005
Table 1. Differentially expressed genes upregulated by high-fat diet (HFD).
GeneLogFCp-ValueProtein
Fat24.0843.13 × 10−5FAT atypical cadherin 2
Npy4r3.5181.10 × 10−4Neuropeptide Y receptor Y4-2
C1qtnf23.2489.57 × 10−4C1q And TNF-related 2
Deup13.1331.81 × 10−4Deuterostome assembly protein 1
Ifi2042.8815.62 × 10−3Interferon gamma inducible protein
Siglec12.8453.57 × 10−4Sialic acid-binding Ig-like lectin 1
Mrap2.7241.02 × 10−3Melanocortin 2 receptor accessory protein
Dmgdh2.6722.89 × 10−3Dimethylglycine dehydrogenase
Maats12.4338.70 × 10−3Cilia and flagella-associated protein 91
Nppb2.3454.83 × 10−3Natriuretic-peptide B
Klf11.8892.77 × 10−4Kruppel-like factor 1
Hba-a21.8677.19 × 10−3Hemoglobin subunit alpha 2
Ppp1r3g1.7358.87 × 10−3Protein phosphatase 1 regulatory subunit 3G
Hbb-bs1.3784.73 × 10−3Hemoglobin subunit beta
Hba-a11.3721.82 × 10−3Hemoglobin subunit alpha 1
Ms4a6b1.3364.78 × 10−3Membrane spanning 4-domains A6A
Gdf21.1339.95 × 10−3Growth differentiation factor 2
Tspan111.1247.60 × 10−3Tetraspanin 11
Nlrp101.1032.63 × 10−3NLR family pyrin domain containing 10
Table 2. Differentially expressed genes downregulated by HFD.
GeneLogFCp-ValueProtein
Olfr690−3.7128.96 × 10−6Olfactory receptor family
Gtsf1−3.5031.05 × 10−4Gametocyte specific factor 1
Tcp10a−3.1211.77 × 10−3T-Complex 10-like 3, pseudogene
Olfr460−3.0777.60 × 10−4Olfactory receptor family
Cuzd1−2.9024.51 × 10−3CUB and zona pellucida-like domains 1
Serpinc1−2.7216.30 × 10−4Serpin family C member 1
Olfr691−2.7131.26 × 10−3Olfactory receptor family
Opn5−2.7088.80 × 10−3Opsin 5
Hist1h3i−2.5615.37 × 10−3H3 clustered histone 11
Rmi2−2.5466.18 × 10−3RecQ mediated genome instability 2
Rnf222−2.3706.91 × 10−3Ring finger protein 222
Serpinf2−2.3091.17 × 10−3Serpin family F member 2
Cstl1−2.3026.08 × 10−3Cystatin-like 1
Npb−2.0006.35 × 10−3Neuropeptide B
Anxa9−1.7463.87 × 10−4Annexin A9
Nanos2−1.6702.85 × 10−3Nanos C2HC-type zinc finger 2
Tssk4−1.6038.17 × 10−3Testis specific serine kinase 4
Eqtn−1.5103.93 × 10−3Equatorin
Klrg2−1.4366.80 × 10−5Killer-cell lectin-like receptor G2
Mcemp1−1.4193.67 × 10−3Mast cell expressed membrane protein 1
Lat−1.3392.98 × 10−3Linker for activation of T-cells
Plekha4−1.3347.90 × 10−3Pleckstrin homology domain containing A4
Misp−1.2707.52 × 10−3Mitotic spindle positioning
P4ha3−1.1764.91 × 10−3Prolyl 4-hydroxylase subunit alpha 3
Gpr84−1.1759.61 × 10−4G protein-coupled receptor 84
Pi16−1.1605.25 × 10−3Peptidase inhibitor 16
Slc10a5−1.1344.79 × 10−3Solute carrier family 10 member 5
Ankrd7−1.1187.66 × 10−3Ankyrin repeat domain 7
Tmprss5−1.1092.09 × 10−3Transmembrane serine protease 5
Cdhr3−1.0915.62 × 10−3Cadherin-related family member 3
Hmga2−1.0611.63 × 10−3High mobility group AT-hook 2
Sycp2−1.0614.34 × 10−3Synaptonemal complex protein 2
Cd27−1.0395.80 × 10−3T-cell activation antigen CD27
Mypn−1.0366.94 × 10−3Myopalladin
Publisher’s Note: MDPI stays neutral with regard to jurisdictional claims in published maps and institutional affiliations.

