Article

Metavariables Resuming Host Immune Features and Nodal Involvement Are Associated with Oncological Outcomes in Oral Cavity Squamous Cell Carcinoma

1
Department of Molecular and Translational Medicine, University of Brescia, 25125 Brescia, Italy
2
Department of Head & Neck Oncology & Surgery Otorhinolaryngology, Antoni Van Leeuwenhoek, Nederlands Kanker Instituut, 1066 Amsterdam, The Netherlands
3
Unit of Pathology, ASST Spedali Civili di Brescia, 25100 Brescia, Italy
4
Unit of Otorhinolaryngology—Head and Neck Surgery, Department of Medical and Surgical Specialties, Radiological Sciences, and Public Health, University of Brescia, 25123 Brescia, Italy
5
Section of Otorhinolaryngology—Head and Neck Surgery, Department of Neurosciences, University of Padua, Via Giustiniani, 2-35128 Padua, Italy
6
Unit of Biostatistics, Department of Molecular and Translational Medicine, University of Brescia, 25125 Brescia, Italy
7
BDbiomed, Big and Open Data Innovation Laboratory, University of Brescia, 25125 Brescia, Italy
8
Department of Pathology and Immunology, Washington University School of Medicine, St. Louis, MO 63130, USA
*
Authors to whom correspondence should be addressed.
Submission received: 18 July 2021 / Revised: 13 August 2021 / Accepted: 19 August 2021 / Published: 26 August 2021
(This article belongs to the Collection Trends and Advances in Tumor Immunology)

Abstract

:
Oral cavity squamous cell carcinoma (OSCC) is a common head and neck cancer characterized by a poor prognosis associated with locoregional or distant failure. Among the predictors of prognosis, a dense infiltration of adaptive immune cells is protective and associated with improved clinical outcomes. However, few tools are available to integrate immune contexture variables into clinical settings. By using digital microscopy analysis of a large retrospective OSCC cohort (n = 182), we explored the clinical significance of tumor-infiltrating CD8+ T-cells. To this end, CD8+ T-cells counts were combined with well-established clinical variables and peripheral blood immune cell parameters. Through variable clustering, five metavariables (MV) were obtained and included descriptors of nodal (NODALMV) and primary tumor (TUMORMV) involvement, the frequency of myeloid (MYELOIDMV) or lymphoid (LYMPHOIDMV) peripheral blood immune cell populations, and the density of tumor-infiltrating CD8+ T-cells (TI-CD8MV). The clinical relevance of the MV was evaluated in the multivariable survival models. The NODALMV was significantly associated with all tested outcomes (p < 0.001), the LYMPHOIDMV showed a significant association with the overall, disease-specific and distant recurrence-free survival (p < 0.05) and the MYELOIDMV with the locoregional control only (p < 0.001). Finally, TI-CD8MV was associated with distant recurrence-free survival (p = 0.029). Notably, the performance in terms of survival prediction of the combined effect of NODALMV and immune metavariables (LYMPHOIDMV, MYELOIDMV and TI-CD8MV) was superior to the TNM stage for most of the outcomes analyzed. These findings indicate that the analysis of the baseline host immune features are promising tools to complement clinical features, in stratifying the risk of recurrences.

Graphical Abstract

1. Introduction

Oral cavity squamous cell carcinoma (OSCC) is one of the most frequent head and neck tumors [1] with a rising incidence in the Western countries [2,3]. The clinical behavior of OSCC is characterized by the occurrence of early lymphatic spreading to regional lymph nodes. Among clinical and pathological features, nodal involvement is per se one of the most relevant prognostic factors [4,5], with an upstage to Stage III–IV and 42–43% 5-year estimated overall survival [5,6]. Furthermore, despite achieving early diagnosis, OSCC is characterized by a poor prognosis when locoregional or distant failure occurs [7], thus including the mandatory management of the neck with elective node dissection [8] or sentinel node biopsy [9] also for low-stage tumors. The main treatment modality for naïve tumors is still represented by radical surgery retaining radiotherapy (RT) or cisplatin-based chemo-radiotherapy (CT-RT) as adjuvant treatments.
The spectrum of available treatment options in the metastatic/recurrent not resectable setting, for which the median survival ranges between 6 and 15 months, is limited to conventional cytotoxic therapy (platinum-based chemotherapy, fluorouracil and taxanes), molecular target agents as anti-EGFR monoclonal antibodies and immunotherapy with PD-L1/PD-1 checkpoint inhibitors. The results obtained with the CheckMate 141, the KEYNOTE-012, and the KEYNOTE-048 trials established the role and use of pembrolizumab or nivolumab (PD-1 checkpoint inhibitors) with or without chemotherapy as first-line therapy in this clinical scenario [10,11,12]. The evaluation of the PD-L1 expression on tumor cells and tumor infiltrating cells, in the so-called CPS score [13], nowadays represent the key biomarker for the choice of systemic therapy modality [14]. However, its efficacy in patients’ selection is still debated. Several prognostic and predictive biomarkers have been recently proposed and tested in a wide retrospective cohort of OSCC patients, including a measure of the immune contexture on tissue slides. In addition to novel histological features [15,16] and morphology-based immune contexture parameters [17], recent meta-analysis showed that, in OSCC, a favorable overall outcome is associated with a high density of tumor infiltrating lymphocytes (TIL) as NK-cells, CD45RO+ T-cells and CD8+ T-cells, mainly if measured in the tumoral site [18,19], whereas tumor-associated CD68+ or CD163+ macrophages predict a worse prognosis [19]. The routine availability of pre-treatment blood samples raised the interest of studying circulating biomarkers. Among these, the neutrophil, lymphocyte, monocyte or platelet counts and the derived ratios have shown prognostic relevance among solid tumors with myeloid predominance, mainly associated with the worse outcomes [20,21,22]. One of the main limitations of the available literature is the paucity of analysis considering specific oncologic outcomes, including the locoregional or distant failures separately. For biomarkers analysis, the identification of cut-offs is still a matter of debate [23], likely overcome by avoiding dichotomization and keeping the whole information of a continuous variable [24]. Moreover, few attempts have been made to combine peripheral and tumoral immune-features in a unique classifier [25].
Within a homogeneous cohort of surgically treated OSCCs, we combined peripheral and tissue immune features with demographic, clinical and pathological characteristics to generate meta-variables (MVs). The MV describing the nodal involvement was confirmed to be detrimental for any survival end-points, whereas the peripheral blood myeloid-related MV and the CD8+ T-cells infiltration MV were significant predictors of locoregional or distant failure, respectively.

2. Materials and Methods

2.1. Clinical Cohort

A retrospective observational study was carried out, enrolling one hundred eighty-two histologically confirmed cases of oral cavity squamous cell carcinoma (OSCC) who underwent radical surgical resection and neck dissection between 2000 and 2014 (Otorhinolaryngology Department, ASST Spedali Civili di Brescia, Brescia, Italy). This study was approved by the local IRB to WV (H&N Cancer, NP-2066). Patients with at least 12 months of follow-up or earlier death or recurrence were included. Salvage surgery, metastatic disease, immunological disorders or prior systemic treatment for malignancy represented the exclusion criteria. Patients were regularly followed up with clinical examinations and neck MRI or CT every 3–6 months. Preliminary clinical and oncological findings are reported in our previous works [26,27]. Last follow-up was updated until September 2020.

2.2. Blood Samples

Preoperative blood cell counts were retrieved. The absolute counts of full white blood cells (WBC), neutrophils, lymphocytes, monocytes and platelets were considered as the biomarkers of interest. Further derived parameters of clinical interest according to the recent literature, the neutrophil-to-lymphocyte ratio (NLR) [22,28], i.e., the ratio between neutrophils and lymphocytes counts and the platelet-to-lymphocyte ratio (PLR) [29], i.e., the ratio between platelets and lymphocytes counts were obtained.

2.3. Tissues

Formalin-fixed paraffin embedded (FFPE) tissue blocks of a representative section of the primary tumor (PT) were retrieved from the tissue bank of the Department of Pathology (ASST Spedali Civili di Brescia, Brescia, Italy). Four-micron thick FFPE sections were used for immunohistochemical staining and as a primary antibody, the anti-CD8 (clone C8/144B, dilution 1:30, Dako) was used. The reaction was revealed by EnVision (Dako) followed by DAB. Sections were then counterstained with hematoxylin.

2.4. Digital Pathology Analysis

Stained slides were acquired using a ScanScope CS (Leica Microsystems, Wetzlar, Germany) digital scanner. Images were viewed and organized using ImageScope software (version 12.03.5048, Leica biosystems, Wetzlar, Germany). Each scanned image was manually annotated and the IHC nuclear image analysis algorithm was chosen for the analysis. Data are expressed as the number of CD8+ cells per mm2. Primary tumor (PT) was analyzed measuring the immune cell density either in the center of the tumor (CT) and in the invasive margin (IM) (Figure 1). The invasive margin was defined as the tissue area of 1 mm wide from the front of invasion of the tumor [30].

2.5. Statistical Analysis

The main goal was to summarize all the available clinical and biomarkers data in a minimal number of synthetic components, each representing a set of highly correlated variables, therefore identifying a few homogeneous latent variables. Applying a data reduction method allows the multivariable survival modelling of cohorts with a limited sample size and event rates [31].
Firstly, clinical, pathological and biomarkers variables were clustered using hierarchical clustering with a bottom-up agglomerative algorithm. This algorithm aimed to maximize the clusters’ homogeneity, defined as the proximity of each variable in the cluster to a synthetic centroid, using as proximity metrics either the Pearson correlation coefficient for quantitative variables or the correlation ratio for qualitative ones [32]. The optimal number of partitions was determined evaluating clusters’ stability measured by the Rand index between the observed hierarchy and a random sample of dendrograms generated by bootstrap (B = 200). Finally, a synthetic variable representing each cluster was computed as the first principal component derived by a mixed principal component analysis (PCAmix) performed on the variable within the cluster [32,33].
Quantitative variables were summarized using the mean, standard deviation, median and range, while qualitative variables were described as counts and proportions. For group comparisons in qualitative variables, Fisher’s exact test was applied, and for quantitative ones, the Wilcoxon test or Kruskal-Wallis test was applied. Missing data, representing 2.6% of the measured data, were imputed with multivariate imputation by chained equations (MICEs) [34].
The survival endpoints considered are the overall (OS), the disease-specific (DSS), the locoregional recurrence-free survival (LRFS), and the distant recurrence-free (DRFS) survival. The OS was defined as the time between the date of surgery and the date of death for any causes; the DSS as the time between the date of surgery and the date of cancer-related death; the LRFS as the time between the date of surgery and the date of local or nodal recurrence; and the DRFS as the time between the date of surgery and the date of distant recurrence. For each outcome, patients now having the event were censored at the last follow-up.
Survival analysis was performed fitting multivariable Cox proportional-hazards models, estimating p values by the Wald statistic. The relationship between continuous predictor and the outcomes was modelled with restricted cubic splines with 4 knots [35]; not linear terms were retained in the presented models for variables mostly explaining the X2 statistic [36]. The likelihood ratio test was applied for comparing nested models. Decision curve analysis (DCA) [37,38,39] was used to evaluate the net benefit of each proposed model compared to the one fitted considering the UICC overall pathological stage alone. Survival estimates were reported as hazard ratios (HR) with 95% confidence interval (95% CI) and estimating the 2- and 5-year survival probability with 95% CI for the variables of main clinical interest. Proportional hazards assumption was tested examining Schoenfeld residuals [40]. Data reduction analysis was performed with the ‘ClustOfVar’ package [32]. Contour plots were drawn with the ‘visreg’ package [41] and DCA was performed with the ‘dcurves’ one. In all analyses, two-tail tests with a significance level of 5% were applied; adjusted p values for multiple tests were corrected with Bonferroni’s method. R version 4.1.0 (R Foundation for Statistical Computing, Vienna, Austria) was used for statistical analysis.

3. Results

3.1. Clinical Findings of the OSCC Cohort

One hundred and eighty-two patients were enrolled for data analysis; the cohort was composed of 115 males (63.2%) with a mean ± SD age of 63.6 ± 13.1 years. Among the clinical, pathological and biomarker variables of interest, missing data accounted for 2.6% of the dataset, with no variable with “missingness” ≥10% (Supplementary Figure S1 and Supplementary Table S1). Considering already imputed data (Table 1), the cohort was well balanced among all pT categories, and metastatic lymph-node involvement was recorded in 85 cases (46.7%), and in 42 cases (23.1%), evidence of pathologic extranodal extension was observed. The mean ± SD number of involved positive nodes was 1.54 ± 2.84, ranging from 0 to 18. Adverse pathological features as perineural invasion (PNI) or lymphovascular invasion (LVI) were present in 90 (49.5%) and 52 (28.6%) cases, respectively. The rate of positive margin was 17.6%. The treatments included surgery alone in 78 patients (42.9%), surgery and adjuvant radiotherapy (RT) in 61 (33.5%), and surgery followed by adjuvant chemo-radiotherapy (CRT) in 43 (23.6%).
The mean follow-up time was 71.5 months (IQR 24.3–105.8, range 1–214 months). During the follow-up course, 71 patients (39.0%) experienced at least one recurrence event, 42 (23.1%) experienced locoregional recurrence alone, 14 (7.7%) distant recurrence alone and 15 (8.2%) both locoregional and distant recurrences. At the last follow-up available, 78 patients (42.9%) were dead and for 53 of these (67.9%), the cause of death was related to disease progression.

3.2. Clinical Relevance of CD8 Immune Contexture and Peripheral Blood Biomarkers in OSCC

By digital image analysis, the CD8+ T-cell infiltration of tumor tissue was evaluated by measuring a mean ± SD area of 108.7 ± 73 mm2 (range 4.2–319.9 mm2). Analyzing both the center of the tumor (CT) and the invasive margin (IM), the latter was significantly enriched (p < 0.0001) of CD8+ T-cells (median 394 cells/mm2, IQR 210–712) compared to the CT (median 170 cells/mm2, IQR 64–430), as shown in Figure 1G; furthermore, a strong direct correlation between the density of CD8 T-cells in CT and IM was evident (R = 0.78 (CI95% 0.71–0.83, p < 0.0001, Figure 1H)); representative fields of the analysis are shown in Figure 1. Whilst testing for associations and correlations., a lower IMCD8+ T-cells density was observed in patients with evidence of LVI (p = 0.032); no other meaningful association with further clinical or pathological features was observed (Supplementary Tables S1–S9). Finally, no correlation was observed between intratumoral CD8+ T-cells density and any of the available peripheral blood biomarkers (Supplementary Table S1).
Analyzing the available pre-operative peripheral blood biomarkers, a significant association was observed, as expected, between the sex and all the absolute biomarkers and lymphocyte counts (Supplementary Table S2). Furthermore, no relevant associations or correlations were observed between such measures and the other clinical and pathological features (Supplementary Tables S1–S9).

3.3. Identification of the Meta-Variables in OSCC

With the aim of summarizing all available clinical and biomarkers variables in a minimal number of synthetic components, a data reduction algorithm was applied [32,33]. The available 24 variables were resumed into metavariables (MV). The aggregation of highly correlated variable was obtained by ascending hierarchical clustering, (Figure 2A). By inspecting the scree plot (Figure 2B), five clusters were identified, from here on referred to as metavariables (MVs). Specifically, the identified MV are the IT-CD8MV, MYELOIDMV, LYMPHOIDMV, TUMORALMV and NODALMV, whose composition is highlighted by dashed rectangles in Figure 2A. The relationship between the MV scores and the variables is shown in Figure 2C and summarized in Supplementary Figure S2–S6; full details of the squared loadings (as a measure of the weight of each variable within the MV) are reported in Supplementary Table S10. MVs did not show significant correlations, except for a slight direct correlation (R = 0.27, p = 0.002) between the TUMORALMV and NODALMV (Figure 2D), confirming the appropriate segregation of the associated variables.

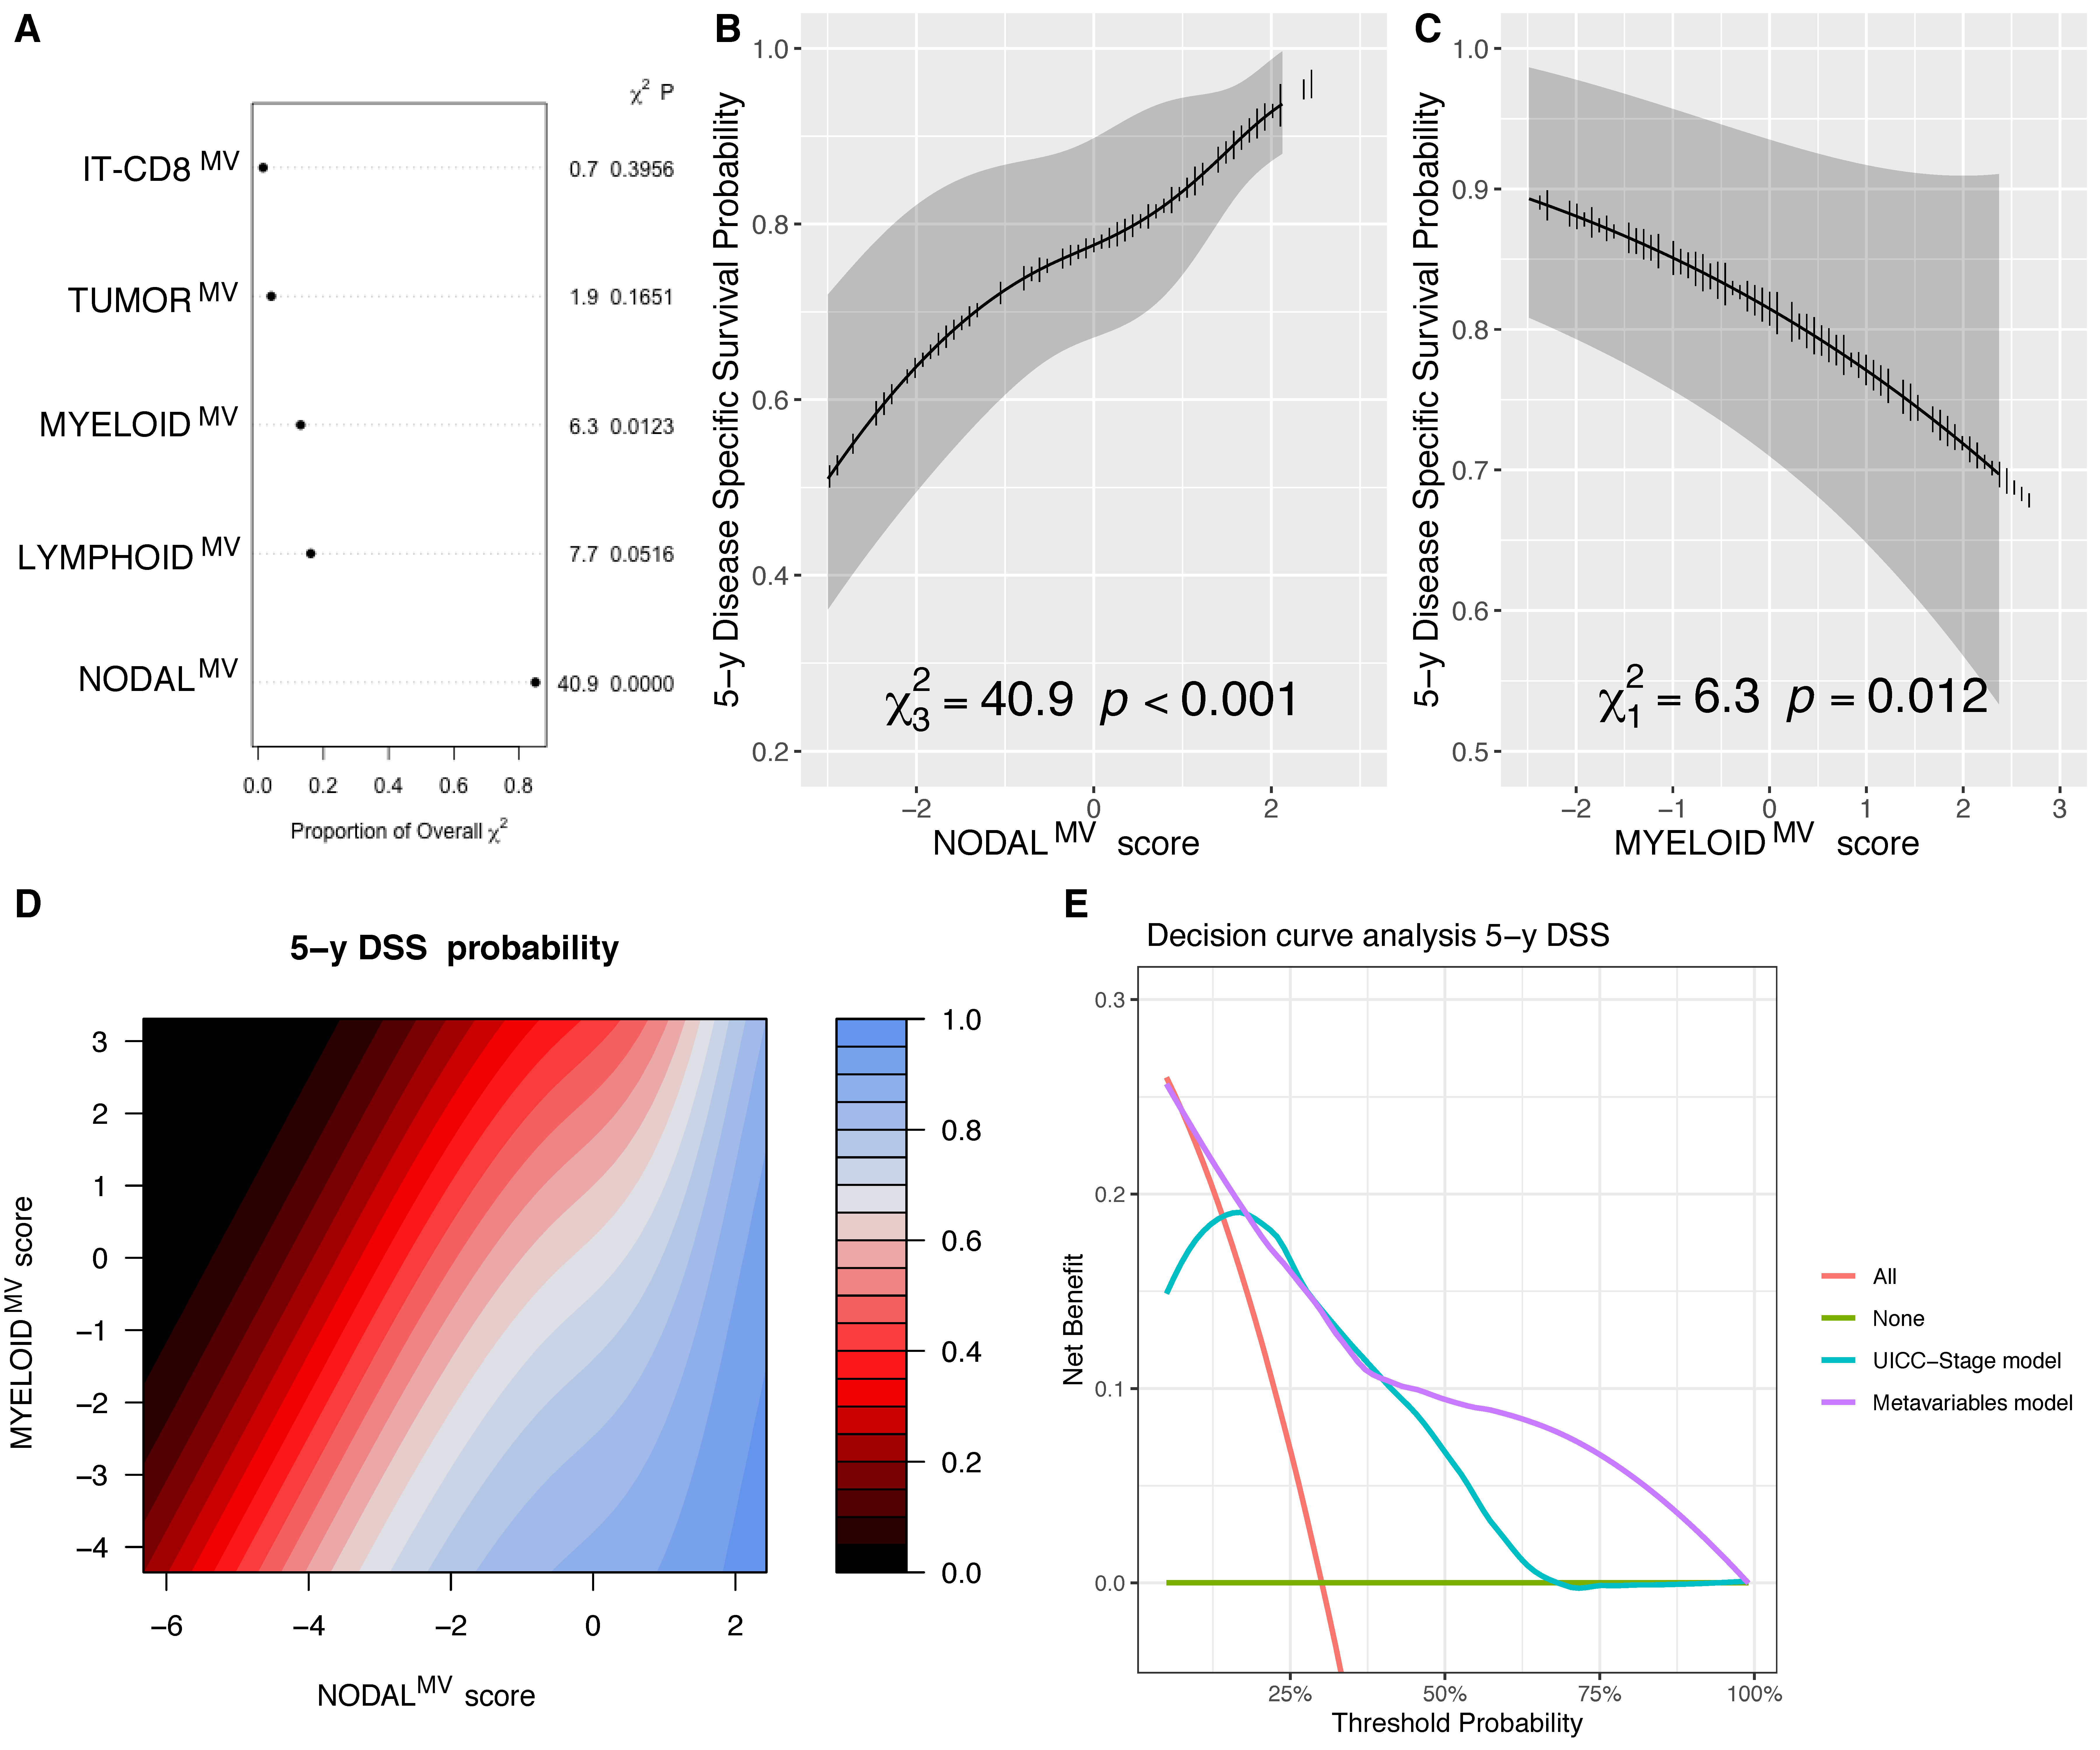
3.4. NODALMV Is Highly Related to OS and DSS

The NODALMV, whose lower values (Supplementary Figure S2) are correlated with a high nodal category, high nodal burden (both lymph node ratio and number of positive nodes), presence of pathologic risk factors as ENE, PNI, LVI or high grade and positive margins was highly associated with all survival endpoints. NODALMV and the LYMPHOIDMV were significantly associated (p < 0.0001 and p = 0.0165, respectively) with OS (Figure 3A). Specifically, NODALMV showed a linear relationship (Figure 3B), whereas LYMPHOIDMV displayed a non-linear effect (Figure 3C) with the best outcome at its mid-values (Supplementary Table S11). The contour plot in Figure 3D represents isoprognostic areas according to the combined value of NODALMV and LYMPHOID MV. Applying the likelihood ratio test, we found that the removal of the LYMPHOIDMV from the model significantly reduced its accuracy (p = 0.028), further supporting the relevance of this variable in the OS outcome. By decision curve analysis (DCA), the model including MVs was comparable to the UICC-TNM pathological Stage in terms of 5 years OS prediction (Figure 3E).
Analyzing the DSS, the NODALMV and MYELOIDMV were significantly associated with the outcome (p < 0.0001 and p = 0.0123, respectively; Figure 4A–C, Supplementary Table S11). Specifically, for MYELOIDMV, higher scores (associated with leukopenia, neutropenia, monocytopenia and female sex) were associated with a poorer DSS, as shown in Figure 4C. The combined partial effect of NODALMV and MYELOIDMV on the 5-year DSS estimate is shown with the contour plot in Figure 4D that illustrates the detrimental contribution of different MYELOIDMV scores along the different values of NODALMV scores. By using the likelihood ratio test, the removal of the MYELOIDMV from the model significantly reduced its accuracy (p = 0.011), further supporting the relevance of such a variable for the DSS outcome. By DCA, the model including MVs showed a benefit in terms of the prediction of the 5-year DSS compared to the UICC-TNM pathological stage, (Figure 4E).

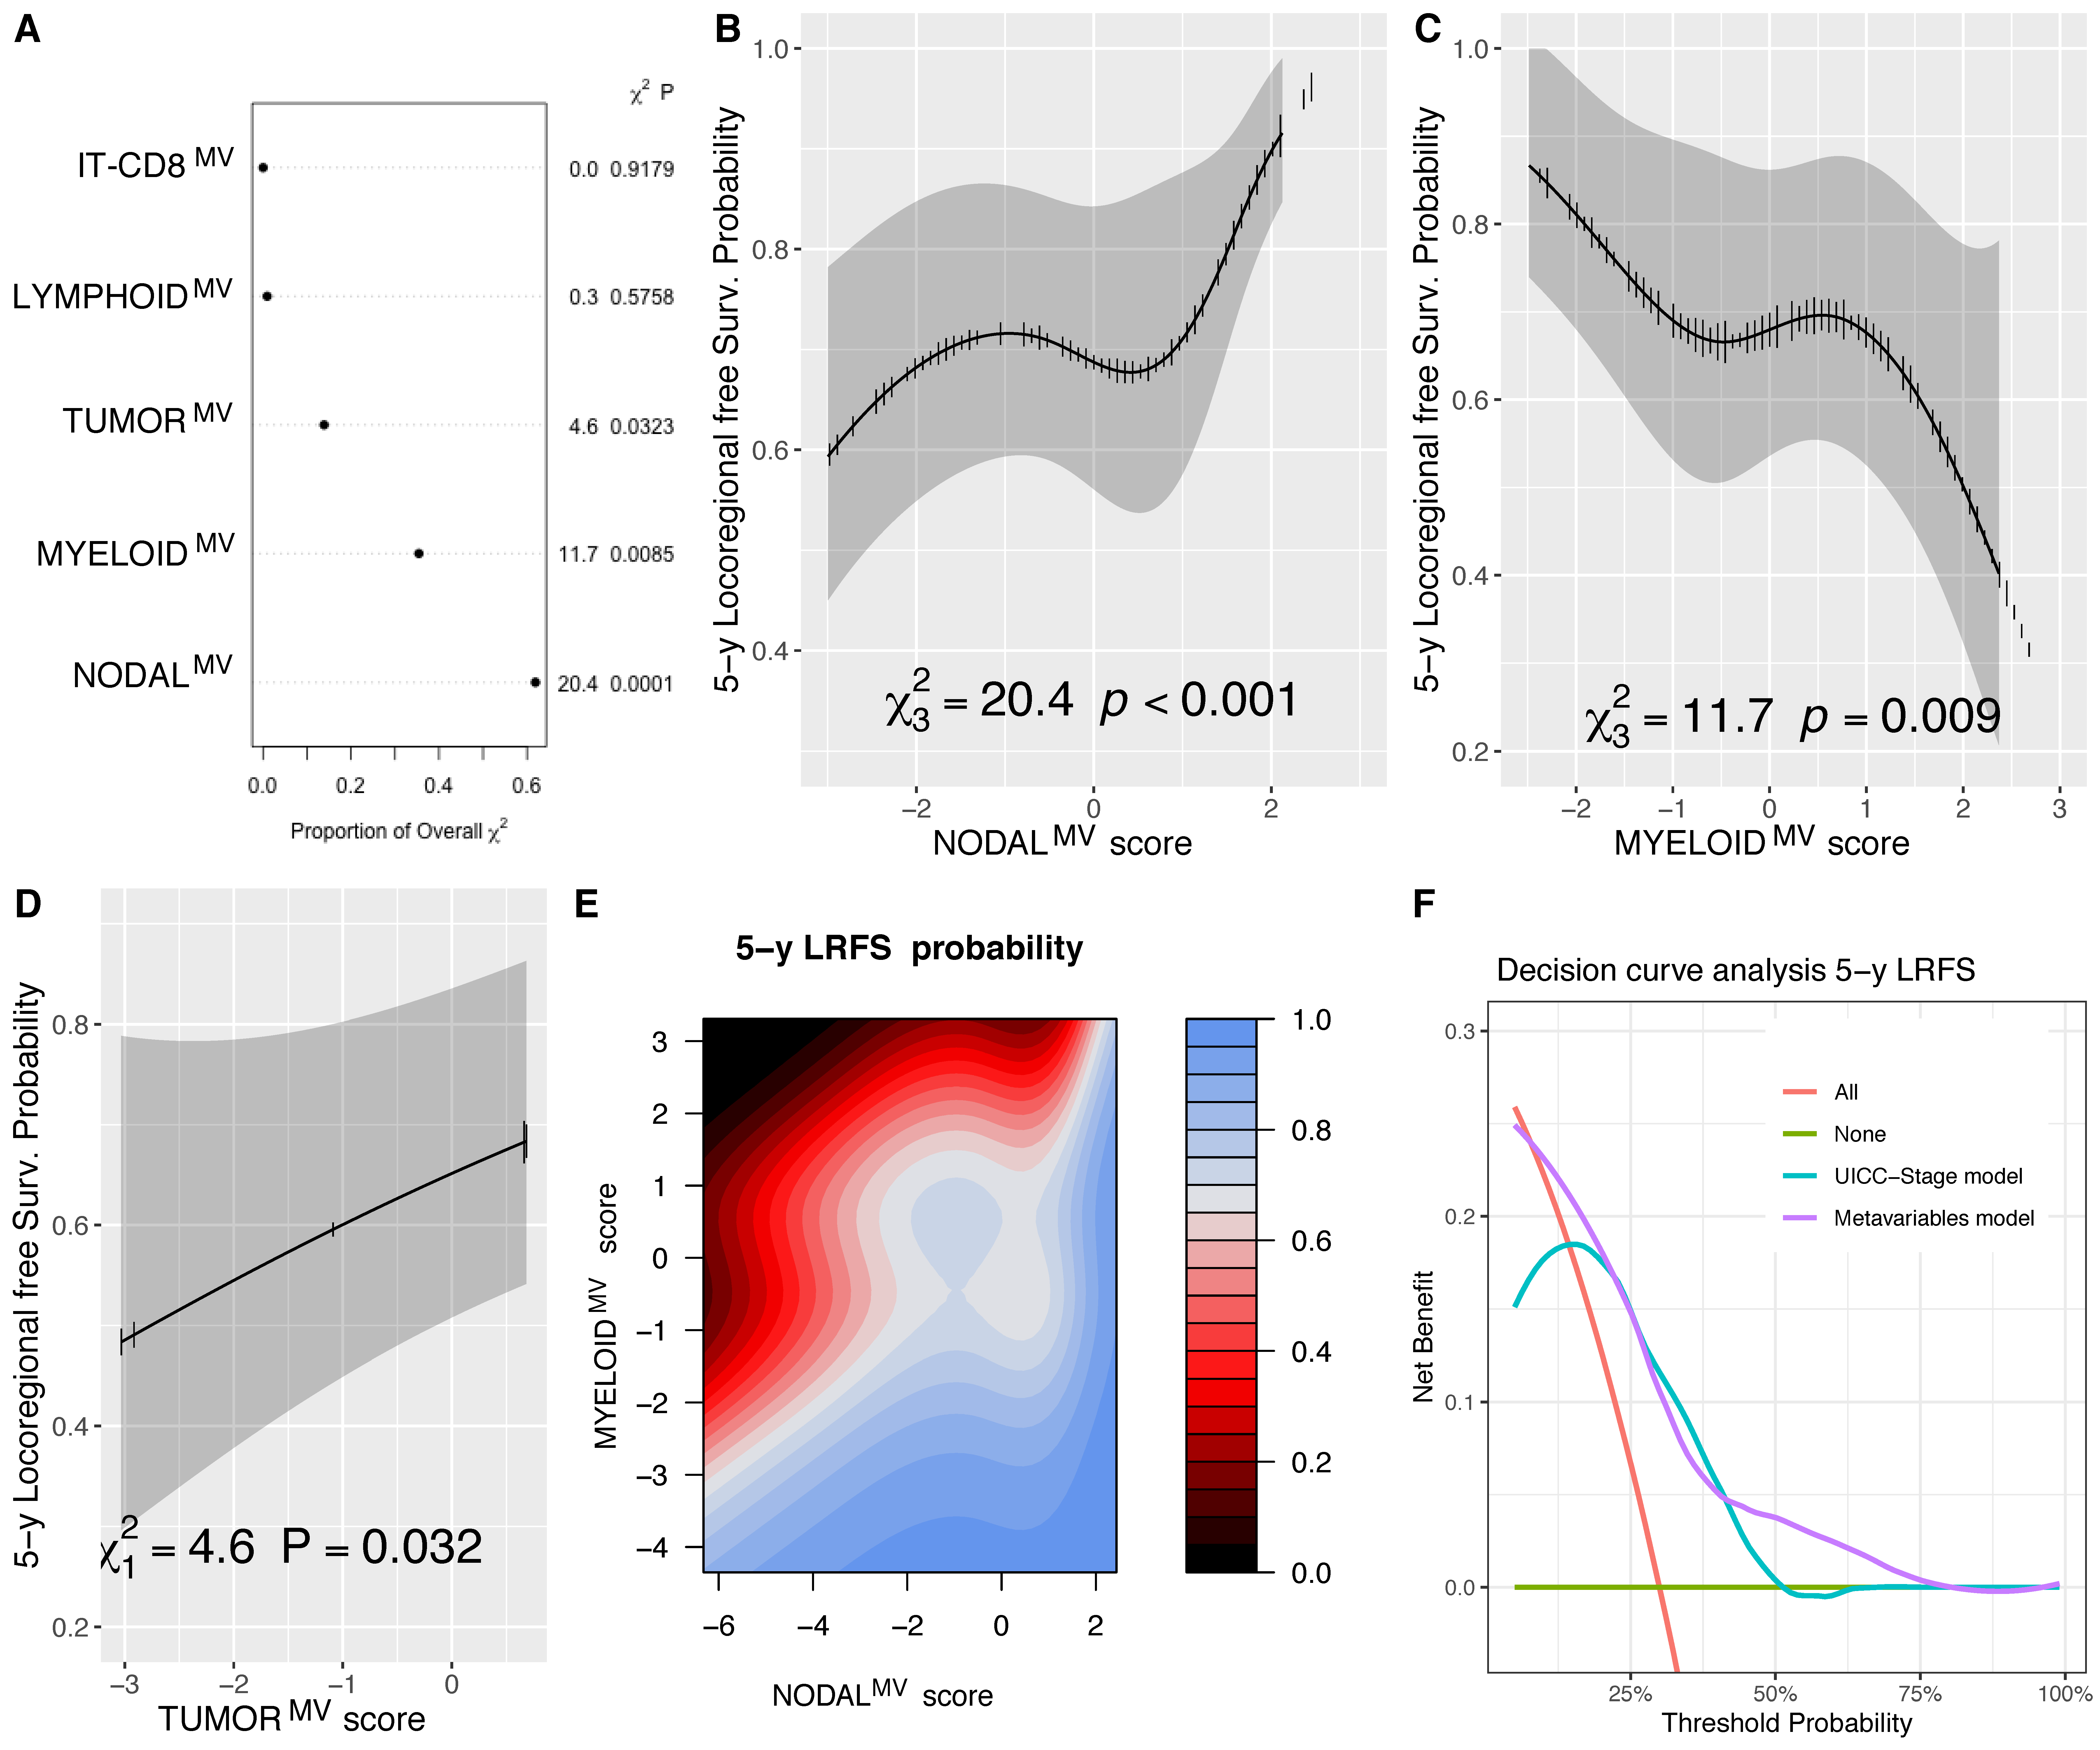
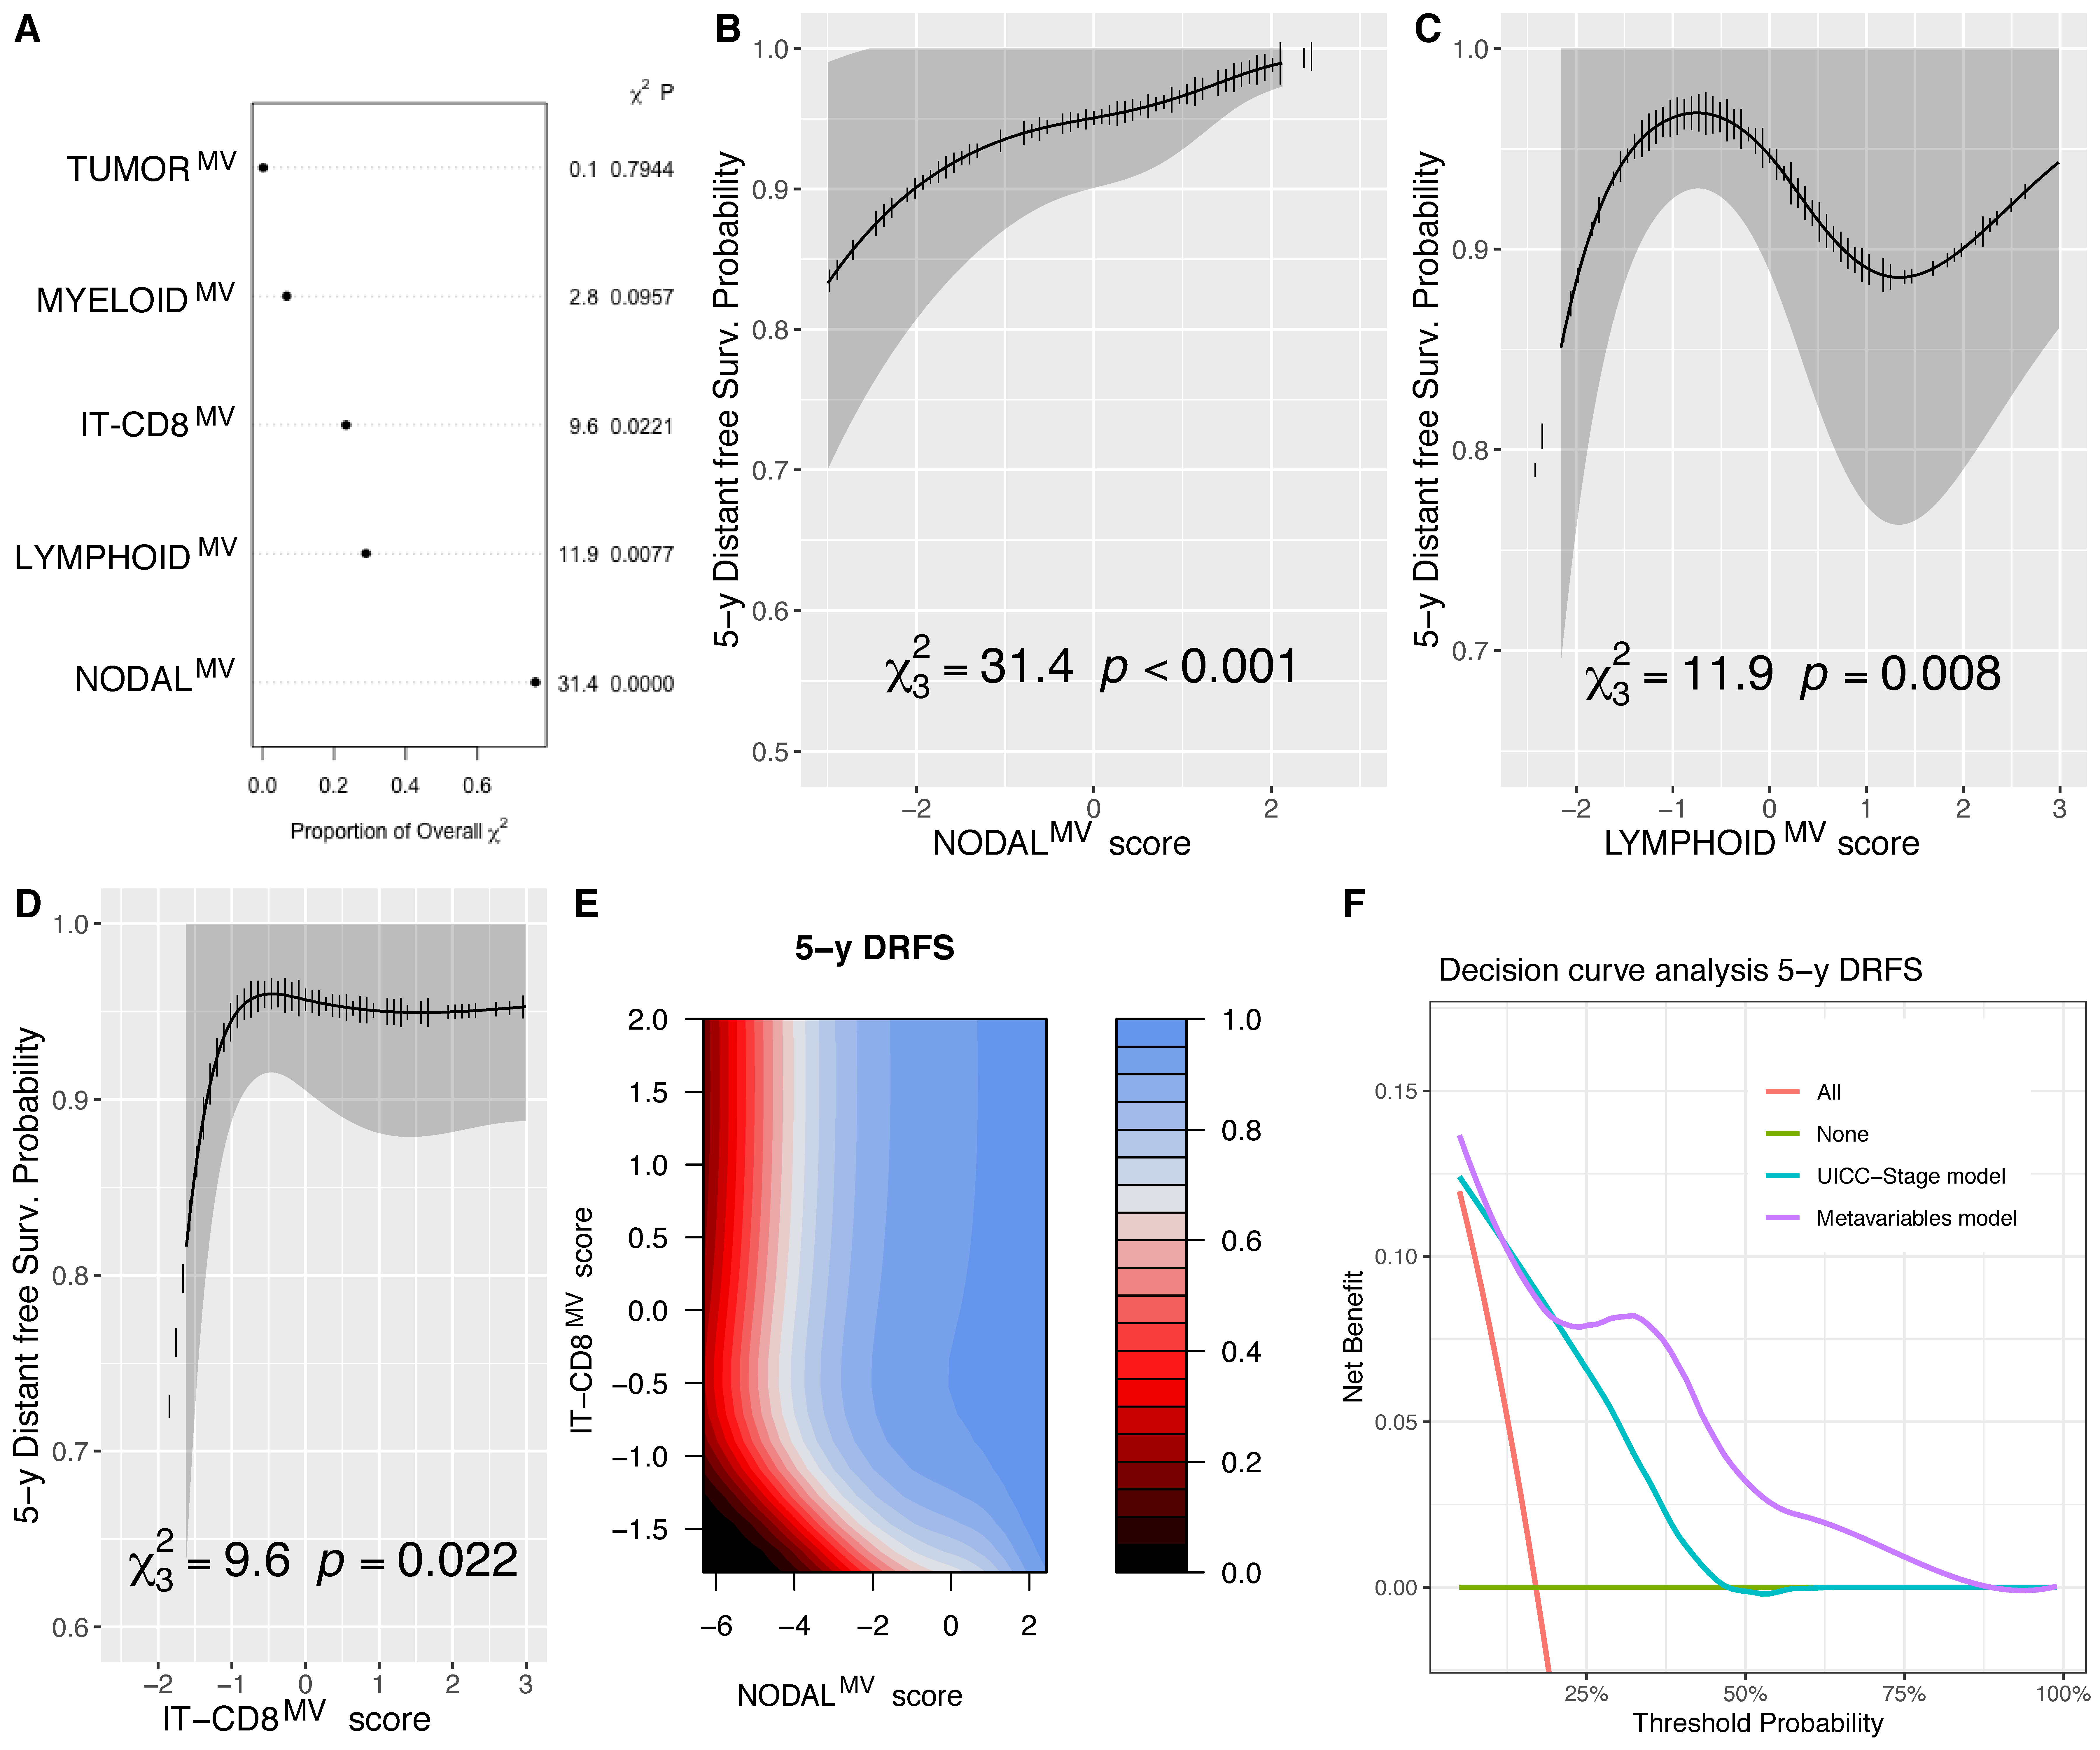
3.5. Immune MV as Predictor of Loco-Regional and Distant Failure

During the follow-up course, 57 patients (31.3%) developed locoregional recurrence with a 5-year LRFS estimate of 78% (CI95% 72–84%) and 29 distant metastases (15.9%), with an estimate of DRFS at 5 years of 85% (CI95% 79–90%). Modelling the LRFS outcome, we could confirm the detrimental prognostic significance of the NODALMV (p < 0.001), MYLEOIDMV (p = 0.009) and TUMORMV (p = 0.032) (Figure 5A–D, Supplementary Table S11). The contour plot shown in Figure 5E illustrates the combined effect of NODALMV and MYELOIDMV scores for the 5-year LRFS prediction with iso-prognostic levels (color gradient) strictly dependent on both variables. By the likelihood ratio test, the removal of the MYELOIDMV from the model significantly reduced its accuracy (p = 0.004), further supporting the relevance of this variable for the LRFS outcome. By DCA and compared to the UICC-TNM pathological stage, the model including MVs showed a benefit in terms of predicting the 5-year LRFS, specifically in the lowest and highest ranges of the estimated risks (Figure 5F).
Considering the DRFS outcome and its modeling with a multivariable model (Figure 6A, Supplementary Table S11), NODALMV confirmed its high weight for its association with such an outcome (p < 0.001, Figure 6B), furthermore LYMPHOIDMV (p = 0.008, Figure 6C) and IT-CD8MV (p = 0.022, Figure 6D) were associated with DRFS following non-linear effects (p = 0.0037, p = 0.0537, respectively). The lowest IT-CD8MV score, corresponding to low CD8 infiltration in all the tested areas of interest, were strictly related to a poor DRFS, also independently from the NODALMV score, as shown in the contour plot in Figure 6E. By using the Likelihood ratio test, the removal of IT-CD8MV and LYMPHOIDMV from the model significantly reduced its accuracy (p = 0.036 and p = 0.013, respectively), further supporting the relevance of such variables for the DRFS outcome. By DCA, the model including MVs showed a benefit in terms of the prediction of the 5-year DSS, compared to the UICC-TNM pathological stage, shown in (Figure 6F).

4. Discussion

In this study, we tested the clinical significance of peripheral blood and tumor-associated immune features in patients submitted to surgery-based treatments for OSCC.
Through a data reduction analysis, five metavariables (MV) were defined; the survival analysis showed their association with different types of oncological outcomes. Specifically, the NODALMV was independently associated with all oncological outcomes tested, thus confirming the detrimental prognostic value of nodal involvement in OSCC. Information derived from peripheral blood biomarkers, and resumed in the MYELOIDMV and LYMPHOIDMV, significantly improved the accuracy of the models of DSS/LRFS and of OS/DRFS, respectively. Thus, these MV represent candidates for the development of predictors models. Interestingly, the IT-CD8MV was significantly associated with the DRFS, suggesting that the group of OSCC desert of CD8+ T-cells should be deeply investigated to identify an innovative therapeutical strategy limiting distant spread. Furthermore, the proposed models including MVs outperform the UICC TNM stage in predicting most of the outcome analyzed.
It is well-known that several clinical variables (e.g., features describing the nodal involvement such as N category, number of positive nodes, LNR, presence of ENE, or high-risk features as PNI, LVI or grading and T category and bone involvement) are highly correlated and it is often difficult to select which variable has to be included in a prognostic regression model.
Building MV might represent an alternative strategy to keep all the available information for the survival modelling analysis. Applying the PCAmix as data reduction method, the explainability of each MV is well achieved, as each original variable can contribute just for one of the five identified MV. Finally, the clinical significance of higher and lower values of each score is easily understandable by inspecting the correlation/associations plots, as shown in Supplementary Figures S2–S6.
Our results confirm the prognostic relevance of nodal involvement, summarized in NODALMV, for all the outcomes analyzed. The highest squared loading for the NODALMV were observed for N category, the nodal ratio and number of positive nodes (Supplementary Table S10) underlining the relevant weight of these variables for the definition of the score and, therefore, their prognostic value. Such an observation is in keeping with the robust literature of recent decades [4,42], including the last update of the TNM classification system [43]. Features such as the nodal ratio [5] and the total number of positive nodes [44] are of main interest and were also tested for the proposal of a new staging systems in the OCSCC setting [45], which are easily available from any pathologic report.
One of the main findings obtained from this analysis suggests that tumor CD8+ T-cells depletion, derived by measuring CD8+ T-cell density in different tumoral compartments, and summarized within the IT-CD8MV, is associated with a higher risk of distant failure, independently from the NODALMV score. Interestingly, the correlation with DRFS apparently displays a threshold effect, with a critical IT-CD8MV score below which the risk of distant metastasis steadily increases (Figure 6D). Although limited to few studies, an association between high tumor CD8+ T-cell density and a better distant metastasis free-survival was already observed in solid tumors from different primary sites including breast [46], colon [47] or soft tissues [48]. Among head and neck malignancies, evidence derived from the analysis of nasopharyngeal carcinoma [49], hypopharyngeal carcinoma [50,51] or from carcinomas of mixed primary sites [52] further support this finding. For OSCC, the association of CD8+ T-cell infiltration and distant failure still needs to be better defined [53]; however, indirect but still limited findings [52], support their protective role.
The occurrence of metastatic disease is associated with systemic immune escape [54]. Cancer-cell intrinsic features as well as host response might represent relevant players in the T-cell exclusion (TCE) mechanism [55,56,57]. No data are available on the molecular basis sustaining TCE in OSCC. However, TCE can be bypassed by various immunotherapy strategies [58,59,60,61,62,63]. Currently, immune checkpoint inhibitors are investigated in the neoadjuvant setting in OCSCC, and this could allegedly enhance CD8+ T-cell activity and reverse tumor host interplay, thus reducing also the risk of tumor escape at distant sites [64,65,66,67,68].
Notably, as recently proposed, photodynamic therapy (PDT) combined with CTLA-4 blockade can enhance the cytotoxic CD8+ T-cell response to achieve durable tumor eradication and inducing an immunological memory [69]. This is worthwhile, since PDT is one of the treatment options for early or recurrent oral cavity squamous cell carcinoma [70,71] and its possible combination with immune checkpoint blockade drugs could pave the way for new trials design.
The main limits of our study are the retrospective design and the mono-institutional setting. Prospective and multi-institutional validation represents mandatory requirements to confirm our observations.

5. Conclusions

The results obtained from this study using data reduction methods confirm the key role of nodal involvement and intratumor CD8+ T-cell density on relevant survival endpoints. Further investigations for the identification of TCE mechanisms will help to identify appropriate treatment strategies for the subgroup of CD8+ T-cell in poor OSCC.

Supplementary Materials

The following are available online at https://0-www-mdpi-com.brum.beds.ac.uk/article/10.3390/cells10092203/s1, Supplementary Figure S1: Heatmap showing the missing data in the whole cohort (A); intersection plot of missing data (B). Supplementary Figure S2: Scatter plots showing the relationship between TI-CD8MV and the variables from which it is defined. P values are estimated by Spearman correlation test. Supplementary Figure S3: Box plots and scatter plots showing the relationship between the NODALMV and the variables from which it is defined. P values are estimated by Kruskal–Wallis test, Wilcoxon sign-rank test or Spearman correlation test. Supplementary Figure S4: Scatter plots and box plots showing the relationship between the MYELOIDMV and the variables from which it is defined. P values are estimated by the Spearman correlation test or Wilcoxon sign-rank test. Supplementary Figure S5: Scatter plots showing the relationship between the LYMPHOIDMV and the variables from which it is defined. P values are estimated by the Spearman correlation test. Supplementary Figure S6: Box plots showing the relationship between the TUMORMV and the variables from which it is defined. P values are estimated by Kruskal–Wallis test. Supplementary Table S1: R values of Spearman’s correlation analysis between continuous variables analyzed. Legend: ****, p < 0.0001; ***, p < 0.001; **, p < 0.01; *, p < 0.05. Supplementary Table S2: Association analysis between peripheral or intratumoral biomarkers measures and sex. P values estimated by Wilcoxon test. Supplementary Table S3: Association analysis between peripheral or intratumoral biomarkers measures and pT category. P values estimated by Kruskal–Wallis test. Supplementary Table S4: Association analysis between peripheral or intratumoral biomarkers measures and pN category. P values estimated by Kruskal–Wallis test. Supplementary Table S5: Association analysis between peripheral or intratumoral biomarkers measures and extranodal extension (ENE). P values estimated by Wilcoxon test. Supplementary Table S6: Association analysis between peripheral or intratumoral biomarkers measures and grading. P values estimated by Kruskal–Wallis test. Supplementary Table S7: Association analysis between peripheral or intratumoral biomarkers measures and bone invasion. P values estimated by Kruskal–Wallis test. Supplementary Table S8: Association analysis between peripheral or intratumoral biomarkers measures and perineural invasion (PNI). P values estimated by Wilcoxon test. Supplementary Table S9: Association analysis between peripheral or intratumoral biomarkers measures and lymphovascular invasion (LVI). P values estimated by Wilcoxon test. Supplementary Table S10: Details of the loadings for each variable and level composing the 5 metavariables (MV). Supplementary Table S11: Extensive details of multivariable survival Cox proportional hazards models. Legend: d.f., degrees of freedom; Coefficient, regression coefficient; S.E., standard error.

Author Contributions

Conceptualization, F.M., S.C. and W.V.; methodology, F.M., M.B., W.V., D.M., S.L., A.M.B. and S.B.; formal analysis, F.M. and S.C.; investigation, F.M., M.B., D.M., D.L. and W.V.; resources, W.V., P.N. and C.P.; data curation, F.M. and D.M.; writing—original draft preparation, F.M. and W.V.; writing—review and editing, S.C., D.M., P.N., D.L., C.P. and W.V.; visualization, M.B., S.L., A.M.B. and S.B.; supervision, W.V., D.L., S.C. and P.N. All authors have read and agreed to the published version of the manuscript.

Funding

The research leading to these results has received funding from “Associazione Italiana per la Ricerca sul Cancro” (AIRC-IG-23179)—P.I. Vermi William.

Institutional Review Board Statement

The study was conducted according to the guidelines of the Declaration of Helsinki, and approved by the “Comitato Etico Provinciale della Provincia di Brescia” (protocol code NP 2066—WV-H&NCancer; date of approval 14-7-2015).

Informed Consent Statement

Informed consent was obtained from all subjects involved in the study.

Data Availability Statement

The full dataset will be available upon reasonable request to the corresponding author.

Acknowledgments

We thank the pathologists, technicians, clinicians, nurses and administrative employers that have provided support to the study and to the follow-up of OCs patients.

Conflicts of Interest

The authors declare no conflict of interest.

References

  1. Ferlay, J.; Soerjomataram, I.; Dikshit, R.; Eser, S.; Mathers, C.; Rebelo, M.; Parkin, D.M.; Forman, D.; Bray, F. Cancer incidence and mortality worldwide: Sources, methods and major patterns in GLOBOCAN 2012. Int. J. Cancer. 2015, 136, e359–e386. [Google Scholar] [CrossRef]
  2. Ghazawi, F.M.; Lu, J.; Savin, E.; Zubarev, A.; Chauvin, P.; Sasseville, D.; Zeitouni, A.; Litvinov, I.V. Epidemiology and Patient Distribution of Oral Cavity and Oropharyngeal SCC in Canada. J. Cutan. Med. Surg. 2020, 24, 340–349. [Google Scholar] [CrossRef]
  3. Conway, D.I.; Purkayastha, M.; Chestnutt, I.G. The changing epidemiology of oral cancer: Definitions, trends, and risk factors. Br. Dent. J. 2018, 225, 867–873. [Google Scholar] [CrossRef] [Green Version]
  4. Shah, J.P.; Cendon, R.A.; Farr, H.W.; Strong, E.W. Carcinoma of the oral cavity. Factors affecting treatment failure at the primary site and neck. Am. J. Surg. 1976, 132, 504–507. [Google Scholar] [CrossRef]
  5. Gil, Z.; Carlson, D.L.; Boyle, J.O.; Kraus, D.H.; Shah, J.P.; Shaha, A.R.; Singh, B.; Wong, R.J.; Patel, S.G. Lymph node density is a significant predictor of outcome in patients with oral cancer. Cancer 2009, 115, 5700–5710. [Google Scholar] [CrossRef]
  6. Patel, S.G.; Amit, M.; Yen, T.C.; Liao, C.T.; Chaturvedi, P.; Agarwal, J.P.; Kowalski, L.P.; Ebrahimi, A.; Clark, J.R.; Cernea, C.R.; et al. Lymph node density in oral cavity cancer: Results of the International Consortium for Outcomes Research. Br. J. Cancer 2013, 109, 2087–2095. [Google Scholar] [CrossRef] [PubMed]
  7. Shiono, S.; Kawamura, M.; Sato, T.; Okumura, S.; Nakajima, J.; Yoshino, I.; Ikeda, N.; Horio, H.; Akiyama, H.; Kobayashi, K. Pulmonary metastasectomy for pulmonary metastases of head and neck squamous cell carcinomas. Ann. Thorac. Surg. 2009, 88, 856–860. [Google Scholar] [CrossRef] [PubMed]
  8. D’Cruz, A.K.; Vaish, R.; Kapre, N.; Dandekar, M.; Gupta, S.; Hawaldar, R.; Agarwal, J.P.; Pantvaidya, G.; Chaukar, D.; Deshmukh, A.; et al. Elective versus Therapeutic Neck Dissection in Node-Negative Oral Cancer. N. Engl. J. Med. 2015, 373, 521–529. [Google Scholar] [CrossRef] [PubMed]
  9. Garrel, R.; Poissonnet, G.; Moyà Plana, A.; Fakhry, N.; Dolivet, G.; Lallemant, B.; Sarini, J.; Vergez, S.; Guelfucci, B.; Choussy, O.; et al. Equivalence Randomized Trial to Compare Treatment on the Basis of Sentinel Node Biopsy Versus Neck Node Dissection in Operable T1-T2N0 Oral and Oropharyngeal Cancer. J. Clin. Oncol. Off. J. Am. Soc. Clin. Oncol. 2020, 38, 4010–4018. [Google Scholar] [CrossRef]
  10. Ferris, R.L.; Blumenschein, G.J.; Fayette, J.; Guigay, J.; Colevas, A.D.; Licitra, L.; Harrington, K.; Kasper, S.; Vokes, E.E.; Even, C.; et al. Nivolumab for Recurrent Squamous-Cell Carcinoma of the Head and Neck. N. Engl. J. Med. 2016, 375, 1856–1867. [Google Scholar] [CrossRef]
  11. Seiwert, T.Y.; Burtness, B.; Mehra, R.; Weiss, J.; Berger, R.; Eder, J.P.; Heath, K.; McClanahan, T.; Lunceford, J.; Gause, C.; et al. Safety and clinical activity of pembrolizumab for treatment of recurrent or metastatic squamous cell carcinoma of the head and neck (KEYNOTE-012): An open-label, multicentre, phase 1b trial. Lancet. Oncol. 2016, 17, 956–965. [Google Scholar] [CrossRef]
  12. Cohen, E.E.W.; Soulières, D.; Le Tourneau, C.; Dinis, J.; Licitra, L.; Ahn, M.-J.; Soria, A.; Machiels, J.-P.; Mach, N.; Mehra, R.; et al. Pembrolizumab versus methotrexate, docetaxel, or cetuximab for recurrent or metastatic head-and-neck squamous cell carcinoma (KEYNOTE-040): A randomised, open-label, phase 3 study. Lancet 2019, 393, 156–167. [Google Scholar] [CrossRef]
  13. Bellmunt, J.; De Wit, R.; Vaughn, D.J.; Fradet, Y.; Lee, J.L.; Fong, L.; Vogelzang, N.J.; Climent, M.A.; Petrylak, D.P.; Choueiri, T.K.; et al. Pembrolizumab as second-line therapy for advanced urothelial carcinoma. N. Engl. J. Med. 2017, 376, 1015–1026. [Google Scholar] [CrossRef] [Green Version]
  14. Brockstein, B.E.; Vokes, E.E. Treatment of metastatic and recurrent head and neck cancer. In Treatment of Metastatic and Recurrent Head and Neck Cancer; Post, T.W., Posner, M.R., Shah, S., Eds.; UpToDate: Waltham, MA, USA, 2021. [Google Scholar]
  15. Brandwein-Gensler, M.; Teixeira, M.S.; Lewis, C.M.; Lee, B.; Rolnitzky, L.; Hille, J.J.; Genden, E.; Urken, M.L.; Wang, B.Y. Oral squamous cell carcinoma: Histologic risk assessment, but not margin status, is strongly predictive of local disease-free and overall survival. Am. J. Surg Pathol. 2005, 29, 167–178. [Google Scholar] [CrossRef] [PubMed]
  16. Brandwein-Gensler, M.; Smith, R.V.; Wang, B.; Penner, C.; Theilken, A.; Broughel, D.; Schiff, B.; Owen, R.P.; Smith, J.; Sarta, C.; et al. Validation of the histologic risk model in a new cohort of patients with head and neck squamous cell carcinoma. Am. J. Surg Pathol. 2010, 34, 676–688. [Google Scholar] [CrossRef]
  17. Troiano, G.; Rubini, C.; Togni, L.; Caponio, V.C.A.; Zhurakivska, K.; Santarelli, A.; Cirillo, N.; Lo Muzio, L.; Mascitti, M. The immune phenotype of tongue squamous cell carcinoma predicts early relapse and poor prognosis. Cancer Med. 2020, 9, 8333–8344. [Google Scholar] [CrossRef] [PubMed]
  18. Borsetto, D.; Tomasoni, M.; Payne, K.; Polesel, J.; Deganello, A.; Bossi, P.; Tysome, J.R.; Masterson, L.; Tirelli, G.; Tofanelli, M.; et al. Prognostic Significance of CD4+ and CD8+ Tumor-Infiltrating Lymphocytes in Head and Neck Squamous Cell Carcinoma: A Meta-Analysis. Cancers 2021, 13, 781. [Google Scholar] [CrossRef] [PubMed]
  19. Huang, Z.; Xie, N.; Liu, H.; Wan, Y.; Zhu, Y.; Zhang, M.; Tao, Y.; Zhou, H.; Liu, X.; Hou, J.; et al. The prognostic role of tumour-infiltrating lymphocytes in oral squamous cell carcinoma: A meta-analysis. J. Oral Pathol. Med. Off. Publ. Int. Assoc. Oral Pathol. Am. Acad. Oral Pathol. 2019, 48, 788–798. [Google Scholar] [CrossRef]
  20. Cupp, M.A.; Cariolou, M.; Tzoulaki, I.; Aune, D.; Evangelou, E.; Berlanga-Taylor, A.J. Neutrophil to lymphocyte ratio and cancer prognosis: An umbrella review of systematic reviews and meta-analyses of observational studies. BMC Med. 2020, 18, 360. [Google Scholar] [CrossRef]
  21. Bardash, Y.; Olson, C.; Herman, W.; Khaymovich, J.; Costantino, P.; Tham, T. Platelet-Lymphocyte Ratio as a Predictor of Prognosis in Head and Neck Cancer: A Systematic Review and Meta-Analysis. Oncol. Res. Treat. 2019, 42, 665–677. [Google Scholar] [CrossRef]
  22. Yang, L.; Huang, Y.; Zhou, L.; Dai, Y.; Hu, G. High pretreatment neutrophil-to-lymphocyte ratio as a predictor of poor survival prognosis in head and neck squamous cell carcinoma: Systematic review and meta-analysis. Head Neck 2019, 41, 1525–1535. [Google Scholar] [CrossRef] [PubMed]
  23. Cho, J.-K.; Kim, M.W.; Choi, I.S.; Moon, U.Y.; Kim, M.-J.; Sohn, I.; Kim, S.; Jeong, H.-S. Optimal cutoff of pretreatment neutrophil-to-lymphocyte ratio in head and neck cancer patients: A meta-analysis and validation study. BMC Cancer 2018, 18, 969. [Google Scholar] [CrossRef] [PubMed]
  24. Royston, P.; Altman, D.G.; Sauerbrei, W. Dichotomizing continuous predictors in multiple regression: A bad idea. Stat. Med. 2006, 25, 127–141. [Google Scholar] [CrossRef]
  25. Chan, J.Y.; Tan, G.F.; Yeong, J.; Ong, C.W.; Ng, D.Y.X.; Lee, E.; Koh, J.; Ng, C.C.-Y.; Lee, J.Y.; Liu, W.; et al. Clinical implications of systemic and local immune responses in human angiosarcoma. NPJ Precis. Oncol. 2021, 5, 11. [Google Scholar] [CrossRef]
  26. Mattavelli, D.; Lombardi, D.; Missale, F.; Calza, S.; Battocchio, S.; Paderno, A.; Bozzola, A.; Bossi, P.; Vermi, W.; Piazza, C.; et al. Prognostic Nomograms in Oral Squamous Cell Carcinoma: The Negat Impact of Low Neutrophil to Lymph Ratio. Front. Oncol. 2019, 9, 1–13. [Google Scholar] [CrossRef] [Green Version]
  27. Lonardi, S.; Missale, F.; Calza, S.; Bugatti, M.; Vescovi, R.; Debora, B.; Uppaluri, R.; Egloff, A.M.; Mattavelli, D.; Lombardi, D.; et al. Tumor-associated neutrophils (TANs) in human carcinoma-draining lymph nodes: A novel TAN compartment. Clin. Transl. Immunol. 2021, 10, e1252. [Google Scholar] [CrossRef]
  28. Walsh, S.R.; Cook, E.J.; Goulder, F.; Justin, T.A.; Keeling, N.J. Neutrophil-lymphocyte ratio as a prognostic factor in colorectal cancer. J. Surg Oncol. 2005, 91, 181–184. [Google Scholar] [CrossRef]
  29. Takenaka, Y.; Oya, R.; Kitamiura, T.; Ashida, N.; Shimizu, K.; Takemura, K.; Yamamoto, Y.; Uno, A. Platelet count and platelet-lymphocyte ratio as prognostic markers for head and neck squamous cell carcinoma: Meta-analysis. Head Neck 2018, 40, 2714–2723. [Google Scholar] [CrossRef]
  30. Galon, J.; Pages, F.; Marincola, F.M.; Angell, H.K.; Thurin, M.; Lugli, A.; Zlobec, I.; Berger, A.; Bifulco, C.; Botti, G.; et al. Cancer classification using the Immunoscore: A worldwide task force. J. Transl. Med. 2012, 10, 205. [Google Scholar] [CrossRef] [PubMed]
  31. Harrell, F.E. Multivariable Modeling Strategies. Regression Modeling Strategies, 2nd ed.; Springer: Cham, Switzerland, 2015; pp. 63–102. [Google Scholar]
  32. Chavent, M.; Kuentz-Simonet, V.; Liquet, B.; Saracco, J. ClustOfVar: An R Package for the Clustering of Variables. J. Stat. Softw. 2011, 50, 1–16. [Google Scholar]
  33. Vigneau, E.; Qannari, E.M. Clustering of Variables around Latent Components. Commun. Stat.-Simul. Comput. 2003, 32, 1131–1150. [Google Scholar] [CrossRef]
  34. Van Buuren, S.; Groothuis-Oudshoorn, K. mice: Multivariate Imputation by Chained Equations in R. J. Stat. Softw. 2011, 45, 1–67. [Google Scholar] [CrossRef] [Green Version]
  35. Durrleman, S.; Simon, R. Flexible regression models with cubic splines. Stat. Med. 1989, 8, 551–561. [Google Scholar] [CrossRef]
  36. Harrell, F.E.J.; Lee, K.L.; Mark, D.B. Multivariable prognostic models: Issues in developing models, evaluating assumptions and adequacy, and measuring and reducing errors. Stat. Med. 1996, 15, 361–387. [Google Scholar] [CrossRef]
  37. Pfeiffer, R.M.; Gail, M.H. Estimating the decision curve and its precision from three study designs. Biom. J. 2020, 62, 764–776. [Google Scholar] [CrossRef]
  38. Vickers, A.J.; Cronin, A.M.; Elkin, E.B.; Gonen, M. Extensions to decision curve analysis, a novel method for evaluating diagnostic tests, prediction models and molecular markers. BMC Med. Inform. Decis. Mak. 2008, 8, 53. [Google Scholar] [CrossRef] [Green Version]
  39. Vickers, A.J.; Elkin, E.B. Decision curve analysis: A novel method for evaluating prediction models. Med. Decis. Mak. Int. J. Soc. Med. Decis. Mak. 2006, 26, 565–574. [Google Scholar] [CrossRef] [Green Version]
  40. Grambsch, P.M.; Therneau, T.M. Proportional hazards tests and diagnostics based on weighted residuals. Biometrika. 1994, 81, 515–526. [Google Scholar] [CrossRef]
  41. Breheny, P.; Burchett, W. Package ‘visreg’: Visualization of Regression Models. R J. 2017, 9, 56–71. [Google Scholar] [CrossRef]
  42. Cerezo, L.; Millán, I.; Torre, A.; Aragón, G.; Otero, J. Prognostic factors for survival and tumor control in cervical lymph node metastases from head and neck cancer. A multivariate study of 492 cases. Cancer. 1992, 69, 1224–1234. [Google Scholar] [CrossRef]
  43. Amin, M.B.; Edge, S.; Greene, F.; Byrd, D.R.; Brookland, R.K.; Washington, M.K.; Gershenwald, J.E.; Compton, C.C.; Hess, K.R.; Sullivan, D.C.; et al. AJCC Cancer Staging Manual, 8th ed.; Springer: Cham, Switzerland, 2017. [Google Scholar]
  44. Ho, A.S.; Kim, S.; Tighiouart, M.; Gudino, C.; Mita, A.; Scher, K.S.; Laury, A.; Prasad, R.; Shiao, S.L.; Van Eyk, J.E.; et al. Metastatic Lymph Node Burden and Survival in Oral Cavity Cancer. J. Clin. Oncol. Off. J. Am. Soc. Clin. Oncol. 2017, 35, 3601–3609. [Google Scholar] [CrossRef] [Green Version]
  45. Mirian, C.; Gerds, T.A.; Pedersen, M.M.; de Ridder, M.; Balm, A.; Mattavelli, D.; Piazza, C.; Jensen, L.R.; Balasubramanian, D.; Subramaniam, N.; et al. Metrics of pN-staging in oral squamous cell carcinoma: An analysis of 1905 patients. Eur. J. Cancer. 2021, 150, 33–41. [Google Scholar] [CrossRef]
  46. Papaioannou, E.; Sakellakis, M.; Melachrinou, M.; Tzoracoleftherakis, E.; Kalofonos, H.; Kourea, E. A Standardized Evaluation Method for FOXP3+ Tregs and CD8+ T-cells in Breast Carcinoma: Association with Breast Carcinoma Subtypes, Stage and Prognosis. Anticancer Res. 2019, 39, 1217–1232. [Google Scholar] [CrossRef] [PubMed] [Green Version]
  47. Sperlich, A.; Balmert, A.; Doll, D.; Bauer, S.; Franke, F.; Keller, G.; Wilhelm, D.; Mur, A.; Respondek, M.; Friess, H.; et al. Genetic and immunological biomarkers predict metastatic disease recurrence in stage III colon cancer. BMC Cancer 2018, 18, 998. [Google Scholar] [CrossRef] [Green Version]
  48. Fujii, H.; Arakawa, A.; Utsumi, D.; Sumiyoshi, S.; Yamamoto, Y.; Kitoh, A.; Ono, M.; Matsumura, Y.; Kato, M.; Konishi, K.; et al. CD8+ tumor-infiltrating lymphocytes at primary sites as a possible prognostic factor of cutaneous angiosarcoma. Int. J. Cancer 2014, 134, 2393–2402. [Google Scholar] [CrossRef] [Green Version]
  49. Wang, Y.Q.; Chen, L.; Mao, Y.P.; Li, Y.Q.; Jiang, W.; Xu, S.-Y.; Zhang, Y.; Chen, Y.P.; Li, X.-M.; He, Q.M.; et al. Prognostic value of immune score in nasopharyngeal carcinoma using digital pathology. J. Immunother. Cancer 2020, 8, e000334. [Google Scholar] [CrossRef] [PubMed]
  50. Ono, T.; Azuma, K.; Kawahara, A.; Akiba, J.; Kakuma, T.; Chitose, S.; Umeno, H. Pre-treatment CD8(+) tumour-infiltrating lymphocyte density predicts distant metastasis after definitive treatment in patients with stage III/IV hypopharyngeal squamous cell carcinoma. Clin. Otolaryngol. Off. J. ENT-UK Off. J. Neth. Soc. Oto-Rhino-Laryngol. Cerv.-Fac. Surg. 2018, 43, 1312–1320. [Google Scholar] [CrossRef]
  51. Wang, J.; Tian, S.; Sun, J.; Zhang, J.; Lin, L.; Hu, C. The presence of tumour-infiltrating lymphocytes (TILs) and the ratios between different subsets serve as prognostic factors in advanced hypopharyngeal squamous cell carcinoma. BMC Cancer 2020, 20, 731. [Google Scholar] [CrossRef]
  52. Balermpas, P.; Michel, Y.; Wagenblast, J.; Seitz, O.; Weiss, C.; Rödel, F.; Rödel, C.; Fokas, E. Tumour-infiltrating lymphocytes predict response to definitive chemoradiotherapy in head and neck cancer. Br. J. Cancer 2014, 110, 501–509. [Google Scholar] [CrossRef]
  53. Chen, W.Y.; Wu, C.T.; Wang, C.W.; Lan, K.H.; Liang, H.K.; Huang, B.S.; Chang, Y.L.; Kuo, S.H.; Cheng, A.L. Prognostic significance of tumor-infiltrating lymphocytes in patients with operable tongue cancer. Radiat. Oncol. 2018, 13, 1–8. [Google Scholar] [CrossRef] [PubMed]
  54. Garner, H.; de Visser, K.E. Immune crosstalk in cancer progression and metastatic spread: A complex conversation. Nat. Rev. Immunol. 2020, 20, 483–497. [Google Scholar] [CrossRef]
  55. Joyce, J.A.; Fearon, D.T. T cell exclusion, immune privilege, and the tumor microenvironment. Science 2015, 348, 74–80. [Google Scholar] [CrossRef] [Green Version]
  56. Chen, D.S.; Mellman, I. Elements of cancer immunity and the cancer-immune set point. Nature 2017, 541, 321–330. [Google Scholar] [CrossRef]
  57. Philip, M.; Schietinger, A. CD8(+) T cell differentiation and dysfunction in cancer. Nat. Rev. Immunol. 2021. [Google Scholar] [CrossRef]
  58. Devaud, C.; John, L.B.; Westwood, J.A.; Darcy, P.K.; Kershaw, M.H. Immune modulation of the tumor microenvironment for enhancing cancer immunotherapy. Oncoimmunology 2013, 2, e25961. [Google Scholar] [CrossRef] [Green Version]
  59. Curran, M.A.; Montalvo, W.; Yagita, H.; Allison, J.P. PD-1 and CTLA-4 combination blockade expands infiltrating T cells and reduces regulatory T and myeloid cells within B16 melanoma tumors. Proc. Natl. Acad. Sci. USA 2010, 107, 4275–4280. [Google Scholar] [CrossRef] [Green Version]
  60. Jin, D.; Fan, J.; Wang, L.; Thompson, L.F.; Liu, A.; Daniel, B.J.; Shin, T.; Curiel, T.J.; Zhang, B. CD73 on tumor cells impairs antitumor T-cell responses: A novel mechanism of tumor-induced immune suppression. Cancer Res. 2010, 70, 2245–2255. [Google Scholar] [CrossRef] [Green Version]
  61. Li, J.; O’Malley, M.; Urban, J.; Sampath, P.; Guo, Z.S.; Kalinski, P.; Thorne, S.H.; Bartlett, D.L. Chemokine expression from oncolytic vaccinia virus enhances vaccine therapies of cancer. Mol. Ther. 2011, 19, 650–657. [Google Scholar] [CrossRef] [PubMed]
  62. Park, J.; Wrzesinski, S.H.; Stern, E.; Look, M.; Criscione, J.; Ragheb, R.; Jay, S.M.; Demento, S.L.; Agawu, A.; Licona Limon, P.; et al. Combination delivery of TGF-β inhibitor and IL-2 by nanoscale liposomal polymeric gels enhances tumour immunotherapy. Nat. Mater. 2012, 11, 895–905. [Google Scholar] [CrossRef]
  63. John, L.B.; Howland, L.J.; Flynn, J.K.; West, A.C.; Devaud, C.; Duong, C.P.; Stewart, T.J.; Westwood, J.A.; Guo, Z.S.; Bartlett, D.L.; et al. Oncolytic virus and anti-4-1BB combination therapy elicits strong antitumor immunity against established cancer. Cancer Res. 2012, 72, 1651–1660. [Google Scholar] [CrossRef] [PubMed] [Green Version]
  64. Schoenfeld, J.D.; Hanna, G.J.; Jo, V.Y.; Rawal, B.; Chen, Y.-H.; Catalano, P.S.; Lako, A.; Ciantra, Z.; Weirather, J.L.; Criscitiello, S.; et al. Neoadjuvant Nivolumab or Nivolumab Plus Ipilimumab in Untreated Oral Cavity Squamous Cell Carcinoma: A Phase 2 Open-Label Randomized Clinical Trial. JAMA Oncol. 2020, 6, 1563–1570. [Google Scholar] [CrossRef]
  65. Uppaluri, R.; Zolkind, P.; Lin, T.; Nussenbaum, B.; Jackson, R.S.; Rich, J.; Pipkorn, P.; Paniello, R.; Thorstad, W.; Michel, L.; et al. Neoadjuvant pembrolizumab in surgically resectable, locally advanced HPV negative head and neck squamous cell carcinoma (HNSCC). J. Clin. Oncol. 2017, 35, 6012. [Google Scholar] [CrossRef]
  66. Zuur, L.; Vos, J.L.; Elbers, J.B.; Krijgsman, O.; Qiao, X.; van der Leun, A.; Smit, L.; van den Brekel, M.W.; Tan, B.; Jasperse, B.; et al. LBA40 Neoadjuvant nivolumab and nivolumab plus ipilimumab induce (near-) complete responses in patients with head and neck squamous cell carcinoma: The IMCISION trial. Ann. Oncol. 2020, 31, S1169. [Google Scholar] [CrossRef]
  67. Zuur, C.L.; Elbers, J.B.W.; Vos, J.L.; van der Leun, A.; Qiao, X.; Karakullukcu, B.; van den Brekel, M.W.M.; Tan, B.; Jasperse, B.; Vogel, W.V.; et al. Feasibility and toxicity of neoadjuvant nivolumab with or without ipilimumab prior to extensive (salvage) surgery in patients with advanced head and neck cancer (the IMCISION trial, NCT03003637). J. Clin. Oncol. 2019, 37, 2575. [Google Scholar] [CrossRef]
  68. Horton, J.D.; Knochelmann, H.; Armeson, K.; Kaczmar, J.M.; Paulos, C.; Neskey, D. Neoadjuvant presurgical PD-1 inhibition in oral cavity squamous cell carcinoma. J. Clin. Oncol. 2019, 37, 2574. [Google Scholar] [CrossRef]
  69. Kleinovink, J.W.; Fransen, M.F.; Löwik, C.W.; Ossendorp, F. Photodynamic-Immune Checkpoint Therapy Eradicates Local and Distant Tumors by CD8(+) T Cells. Cancer Immunol. Res. 2017, 5, 832–838. [Google Scholar] [CrossRef] [Green Version]
  70. Civantos, F.J.; Karakullukcu, B.; Biel, M.; Silver, C.E.; Rinaldo, A.; Saba, N.F.; Takes, R.P.; Vander Poorten, V.; Ferlito, A. A Review of Photodynamic Therapy for Neoplasms of the Head and Neck. Adv. Ther. 2018, 35, 324–340. [Google Scholar] [CrossRef] [PubMed]
  71. Meulemans, J.; Delaere, P.; Vander Poorten, V. Photodynamic therapy in head and neck cancer: Indications, outcomes, and future prospects. Curr. Opin. Otolaryngol. Head Neck Surg. 2019, 27, 136–141. [Google Scholar] [CrossRef]
Figure 1. Panel showing whole tumor sections stained for CD8 in two representative cases (AC and DF). In (A) and (D), the selection of areas of interest is shown: the center of the tumor (CT) and the invasive margin (IM)—whilst the black line defines the whole tumoral bed. Representative high magnification immunostained (left) and processed (right) sections showing the immune cells recognition and counting algorithm (B,C,E,F). In (B) and (C), the example fields of 1 mm2 of the case presented in (A) taken from the CT (554 CD8+ T-cells) or IM (1159 CD8+ T-cells), respectively. In (E) and (F), the example fields of 1 mm2 of the case presented in (D) are taken from the CT (26 CD8+ T-cells) or IM (294 CD8+ T-cells), respectively. The box plots (G) show a higher density of CD8+ T-cells in the IM compared to the CT (grey lines connecting the measures of CD8+ T-cell density in each single patient) and the scatter plot (H) illustrates a significant direct correlation of CD8+ T-cells’ density between those regions (H); p values estimated by the Wilcoxon matched-pairs signed rank test (G) or Spearman rank correlation test (H). Scale bars: (A,D), 5 mm; (B,C,E,F), 500 µm.
Cells 10 02203 g001
Figure 2. Dendrogram of the hierarchical ascending clustering of the 24 demographic, clinical, pathological and peripheral and tissue biomarkers according to their correlation ratio (A); aggregation level plot related to the number of clusters of variables, red circle showing the chosen 5 clusters as optimum choice (B); heatmap showing the relationship between each metavariable (MV) and the original variables from which is derived (columns on the right of each metavariable) (C); and correlogram showing the Spearman correlation between each metavariable, R coefficient is shown, adjusted not significant comparisons are covered with a cross (D). Dashed rectangles in A highlight which original variable is included in each MV.
Cells 10 02203 g002
Figure 3. Chunk test results on the OS multivariable model reporting the proportion of the overall χ2 of the model explained by each variable, the partial χ2 and P value of the Wald test, testing the association between each variable and the outcome (A); adjusted marginal effect plot of the NODALMV score for the 5-year OS estimate with the CI95% gray band (B); adjusted marginal effect plot of the LYMPHOIDMV score for the 5-year OS estimate with CI95% gray band (C); contour plot showing isoprognostic OS bands according to the combined effect of the NODALMV and LYMPHOIDMV scores for the 5-year OS estimate, the color scale represents the 5 y OS probability (D); and decision curve analysis (DCA) analysis showing comparable results of the model including metavariables and to the one fitted with UICC overall stage alone in predicting the 5-year OS (E).
Cells 10 02203 g003
Figure 4. Chunk test results on the DSS multivariable model reporting the proportion of the overall χ2 of the model explained by each variable, the partial χ2 and p value of the Wald test, testing the association between each variable and the outcome (A); adjusted marginal effect plots for the 5-year DSS with CI95% (gray bands) of the NODALMV (B) and MYELOIDMV (C) scores; contour plot showing isoprognostic DSS bands according to the combined effect of the NODALMV and MYELOIDMV scores for the 5-year DSS estimate, the color scale represents the 5 y DSS probability (D); and decision curve analysis (DCA) showing the advantages of the model including MV compared to the one fitted with UICC overall stage alone in predicting the 5-year DSS (E).
Cells 10 02203 g004
Figure 5. Chunk test results on the LRFS multivariable model reporting the proportion of the overall χ2 of the model explained by each variable, the partial χ2 and P value of the Wald test, testing the association between each variable and the outcome (A); adjusted marginal effect plots for the 5-year LRFS with CI95% (gray bands) of the NODALMV (B); MYELOIDMV (C), and TUMORMV (D) scores; contour plot showing isoprognostic LRFS bands according to the combined effect of the NODALMV and MYELOIDMV scores for the 5-year LRFS estimate—the color scale representing the 5 y LRFS probability (E); and decision curve analysis (DCA) showing a better performance of the model including MVs compared to the one fitted with the UICC overall stage alone in predicting the 5-year LRFS in the lowest and highest ranges of the estimated risks (F).
Cells 10 02203 g005
Figure 6. Chunk test results on the DRFS multivariable model reporting the proportion of the overall χ2 of the model explained by each variable, the partial χ2 and P value of the Wald test, testing the association between each variable and the outcome (A); adjusted marginal effect plots for the 5-year DRFS with CI95% (gray bands) of the NODALMV (B); LYMPHOIDMV (C) and IT-CD8MV (D) scores; contour plot showing isoprognostic DRFS bands according to the combined effect of the NODALMV and IT-CD8MV scores for the 5-year DRFS estimate—the color scale represents the 5 y DRFS probability (E); and decision curve analysis (DCA) showing the better performance of the model including MVs compared to the one fitted with the UICC overall stage alone in predicting the 5-year DRFS (F).
Cells 10 02203 g006
Table 1. Summary statistics of the cohort.
VariableOverall (N = 182)VariableOverall (N = 182)
Age Margins
 Mean (SD) 63.6 (13.1) Positive 32 (17.6%)
 Median (Min, Max) 64.0 (26.0, 93.0) Close 54 (29.7%)
Sex  Negative 96 (52.7%)
 Male 115 (63.2%)Treatment
 Female 67 (36.8%) Surgery 78 (42.9%)
pT category (8th Ed.)  Surgery+RT 61 (33.5%)
 pT1 23 (12.6%) Surgery+CRT 43 (23.6%)
 pT2 41 (22.5%)WBC (109/L)
 pT3 85 (46.7%) Mean (SD) 7.41 (1.94)
 pT4 33 (18.1%) Median (Min, Max) 7.39 (2.77, 13.7)
pN category (8th Ed.) Lymphocytes (109/L)
 pN0 96 (52.7%) Mean (SD) 1.82 (0.535)
 pN1 24 (13.2%) Median (Min, Max) 1.78 (0.690, 3.69)
 pN2a 6 (3.3%)Neutrophils (109/L)
 pN2b 16 (8.8%) Mean (SD) 4.79 (1.64)
 pN2c 2 (1.1%) Median (Min, Max) 4.76 (1.04, 10.1)
 pN3b 38 (20.9%)Monocytes (109/L)
Npos  Mean (SD) 0.585 (0.231)
 pN0 97 (53.3%) Median (Min, Max) 0.550 (0.160, 1.53)
 pN+ 85 (46.7%)PLT (109/L)
ENE  Mean (SD) 228 (68.6)
 No 140 (76.9%) Median (Min, Max) 220 (51.0, 431)
 Yes 42 (23.1%)NLR
Nodal ratio  Mean (SD) 2.83 (1.31)
 Mean (SD) 0.0326 (0.0558) Median (Min, Max) 2.53 (0.799, 7.55)
 Median (Min, Max) 0 (0, 0.320)PLR
Total Number Positive Nodes  Mean (SD) 134 (52.7)
 Mean (SD) 1.54 (2.84) Median (Min, Max) 129 (31.1, 315)
 Median (Min, Max) 0 (0, 18.0)CD8 density Total (cells/mm2)
LVI  Mean (SD) 418 (403)
 No 130 (71.4%) Median (Min, Max) 279 (16, 2180)
 Yes 52 (28.6%)CD8 density CT (cells/mm2)
PNI  Mean (SD) 333 (406)
 No 92 (50.5%) Median (Min, Max) 170 (5, 2270)
 Yes 90 (49.5%)CD8 density IM (cells/mm2)
Differentiation  Mean (SD) 520 (429)
 G1 18 (9.9%) Median (Min, Max) 394 (24, 2340)
 G2 87 (47.8%)
 G3 77 (42.3%)
Bone invasion
 No 148 (81.3%)
 Cortical 16 (8.8%)
 Medullary 18 (9.9%)
Publisher’s Note: MDPI stays neutral with regard to jurisdictional claims in published maps and institutional affiliations.

