
Expression Pattern of T-Type Ca2+ Channels in Cerebellar Purkinje Cells after VEGF Treatment

 and
and 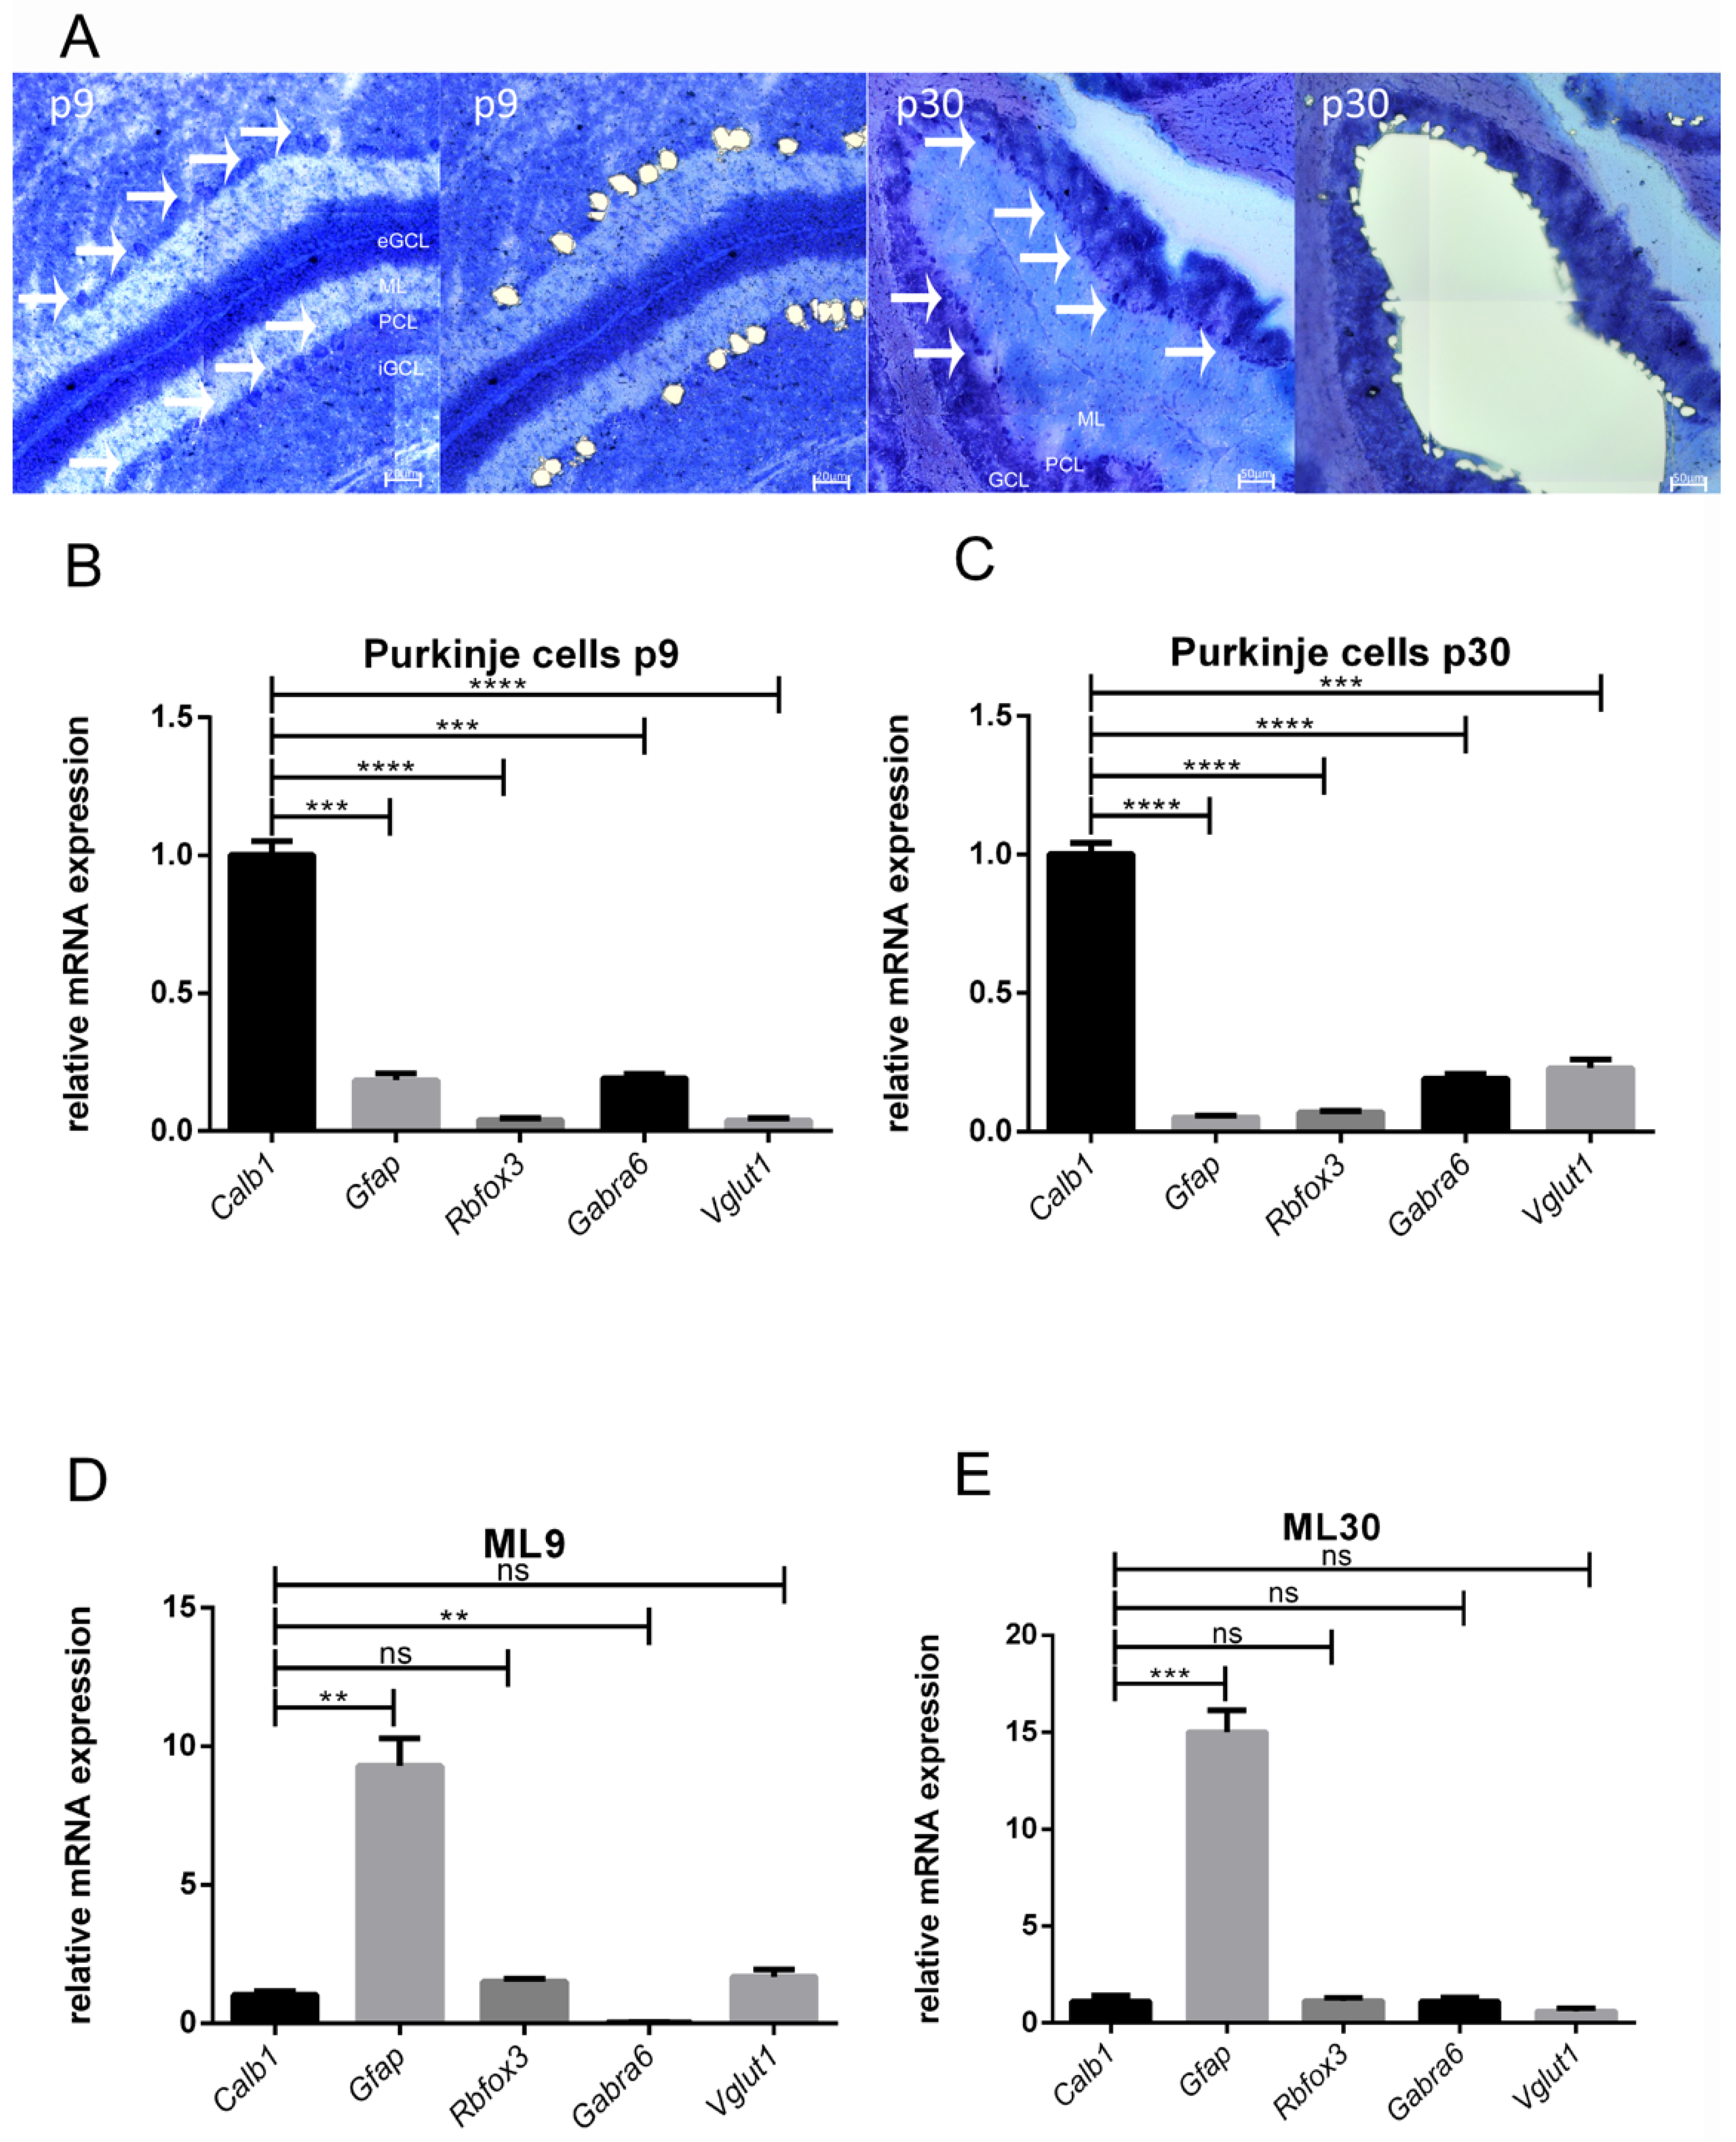
Abstract
:1. Introduction
2. Materials and Methods
2.1. Enriched PC Culture
2.2. Laser Microdissection
2.3. RT-qPCR
2.4. Immunostaining Experiments
3. Results
3.1. Accuracy of LMD
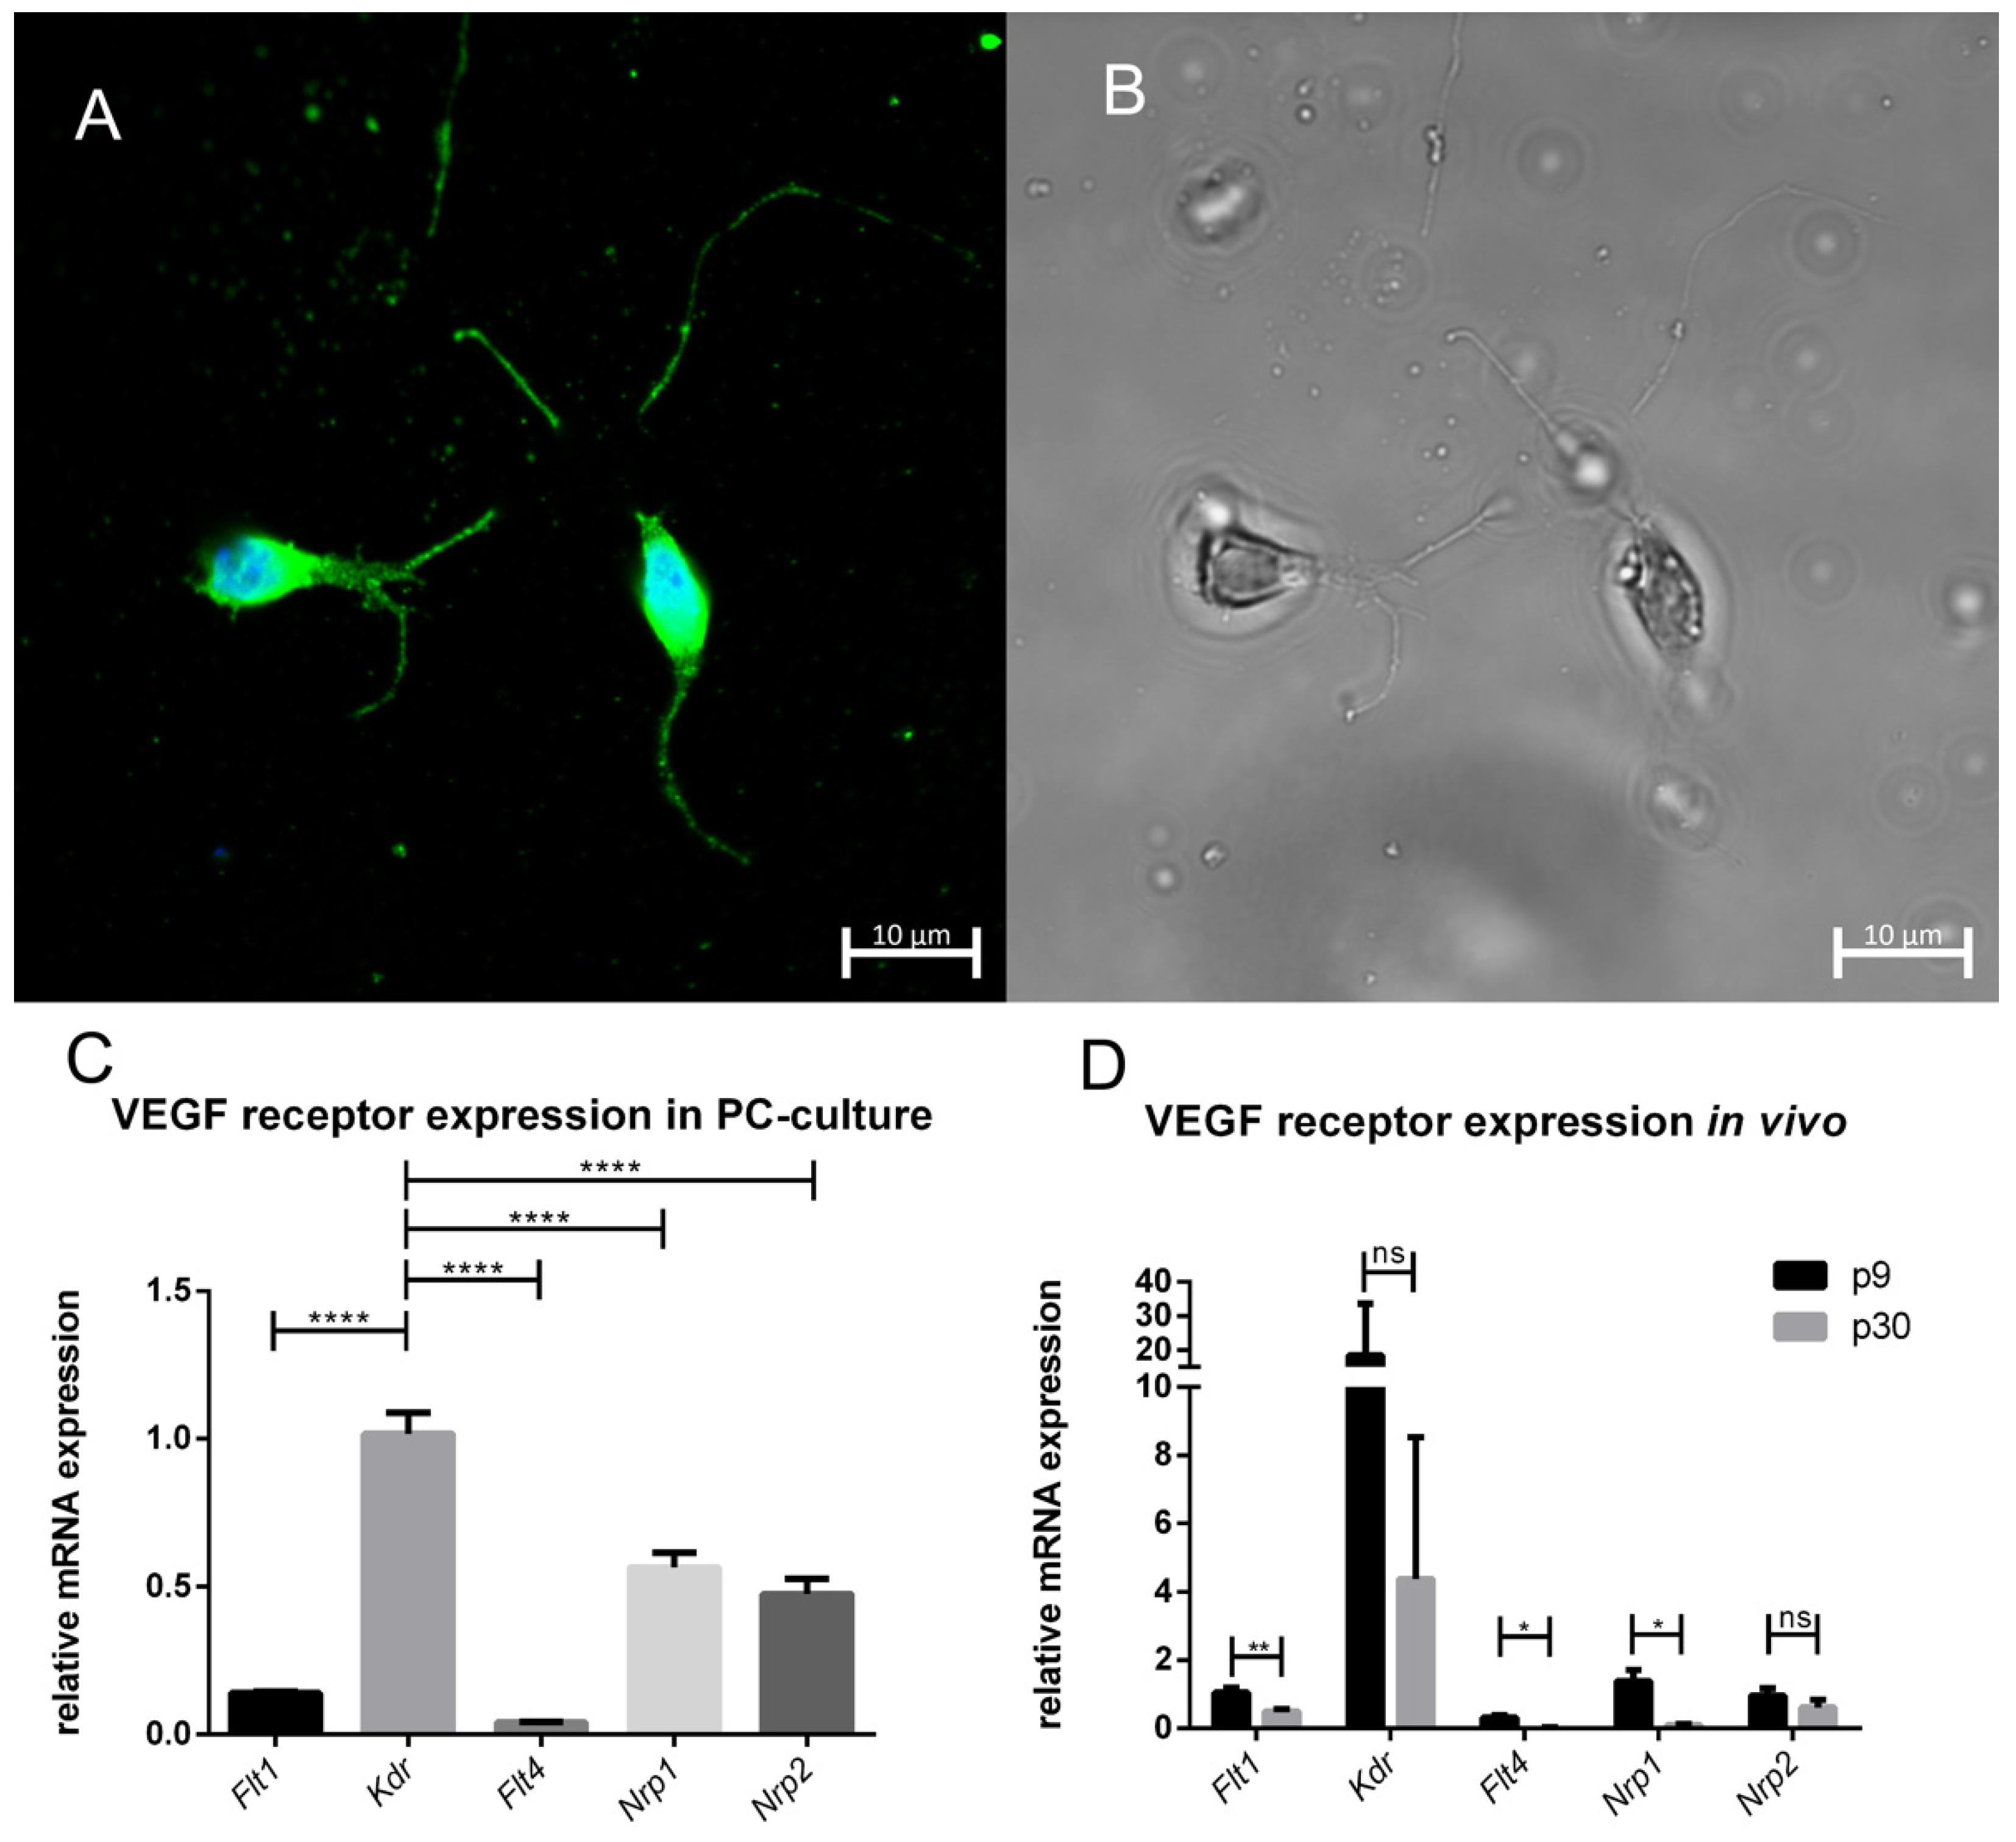
3.2. PC Culture and VEGF Receptor Expression
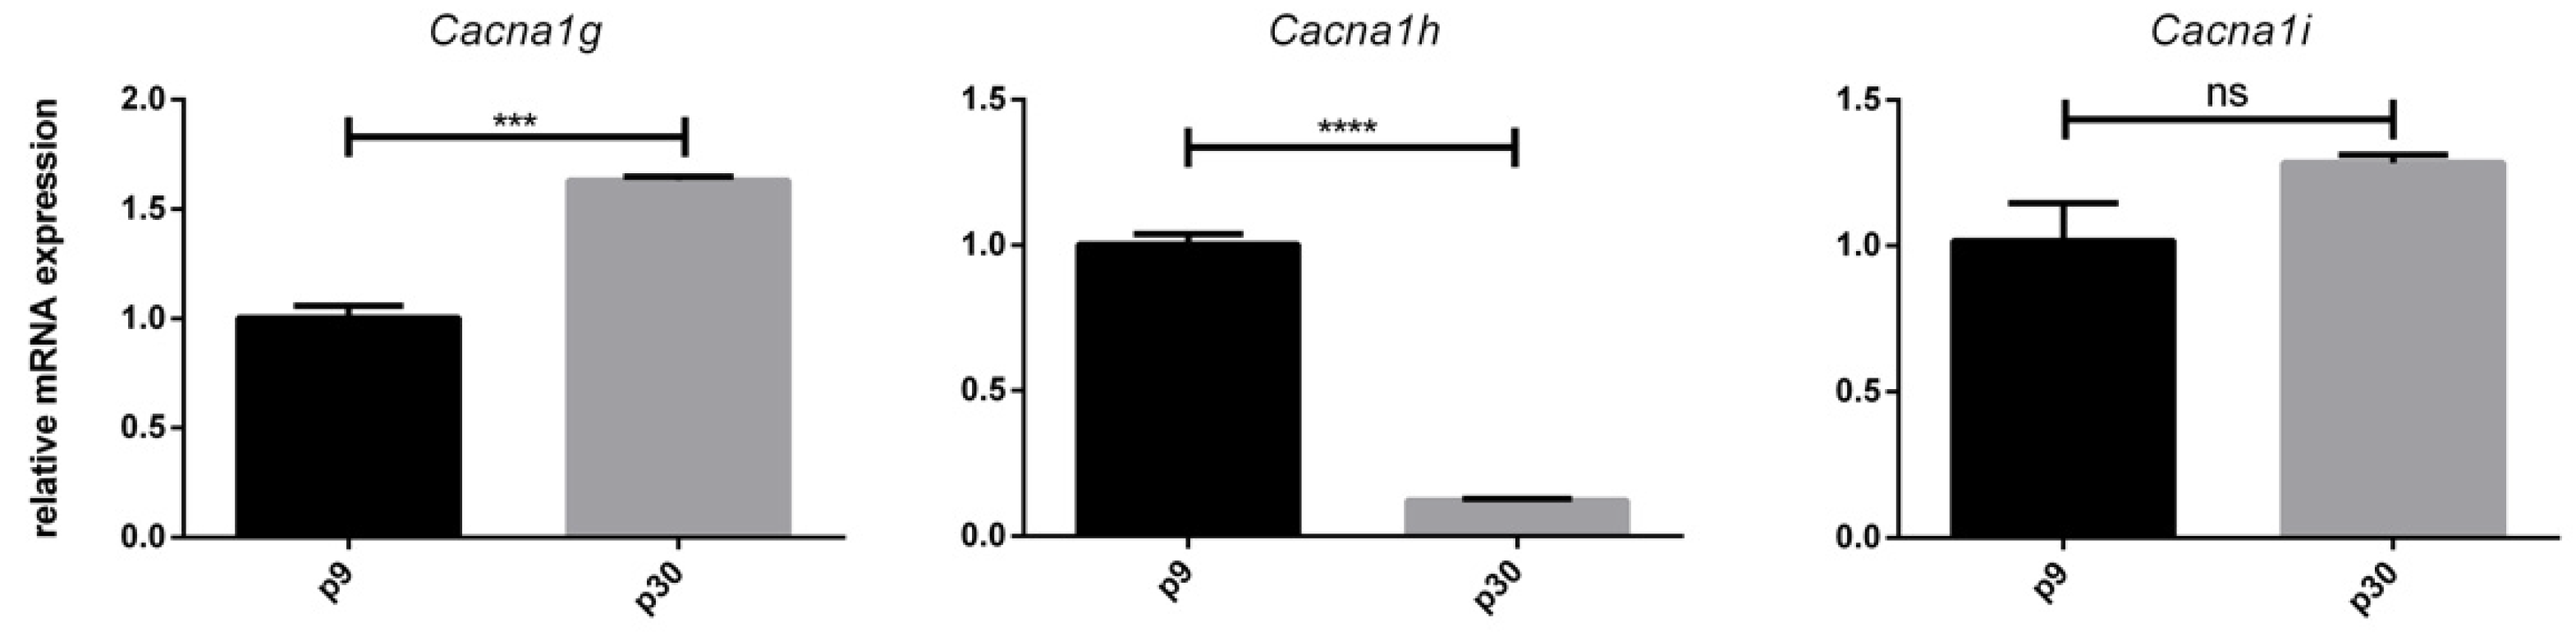
3.3. Age-Dependent mRNA Expression of T-Type Ca2+ Channels
3.4. Immunostaining of T-Type Ca2+ Channel
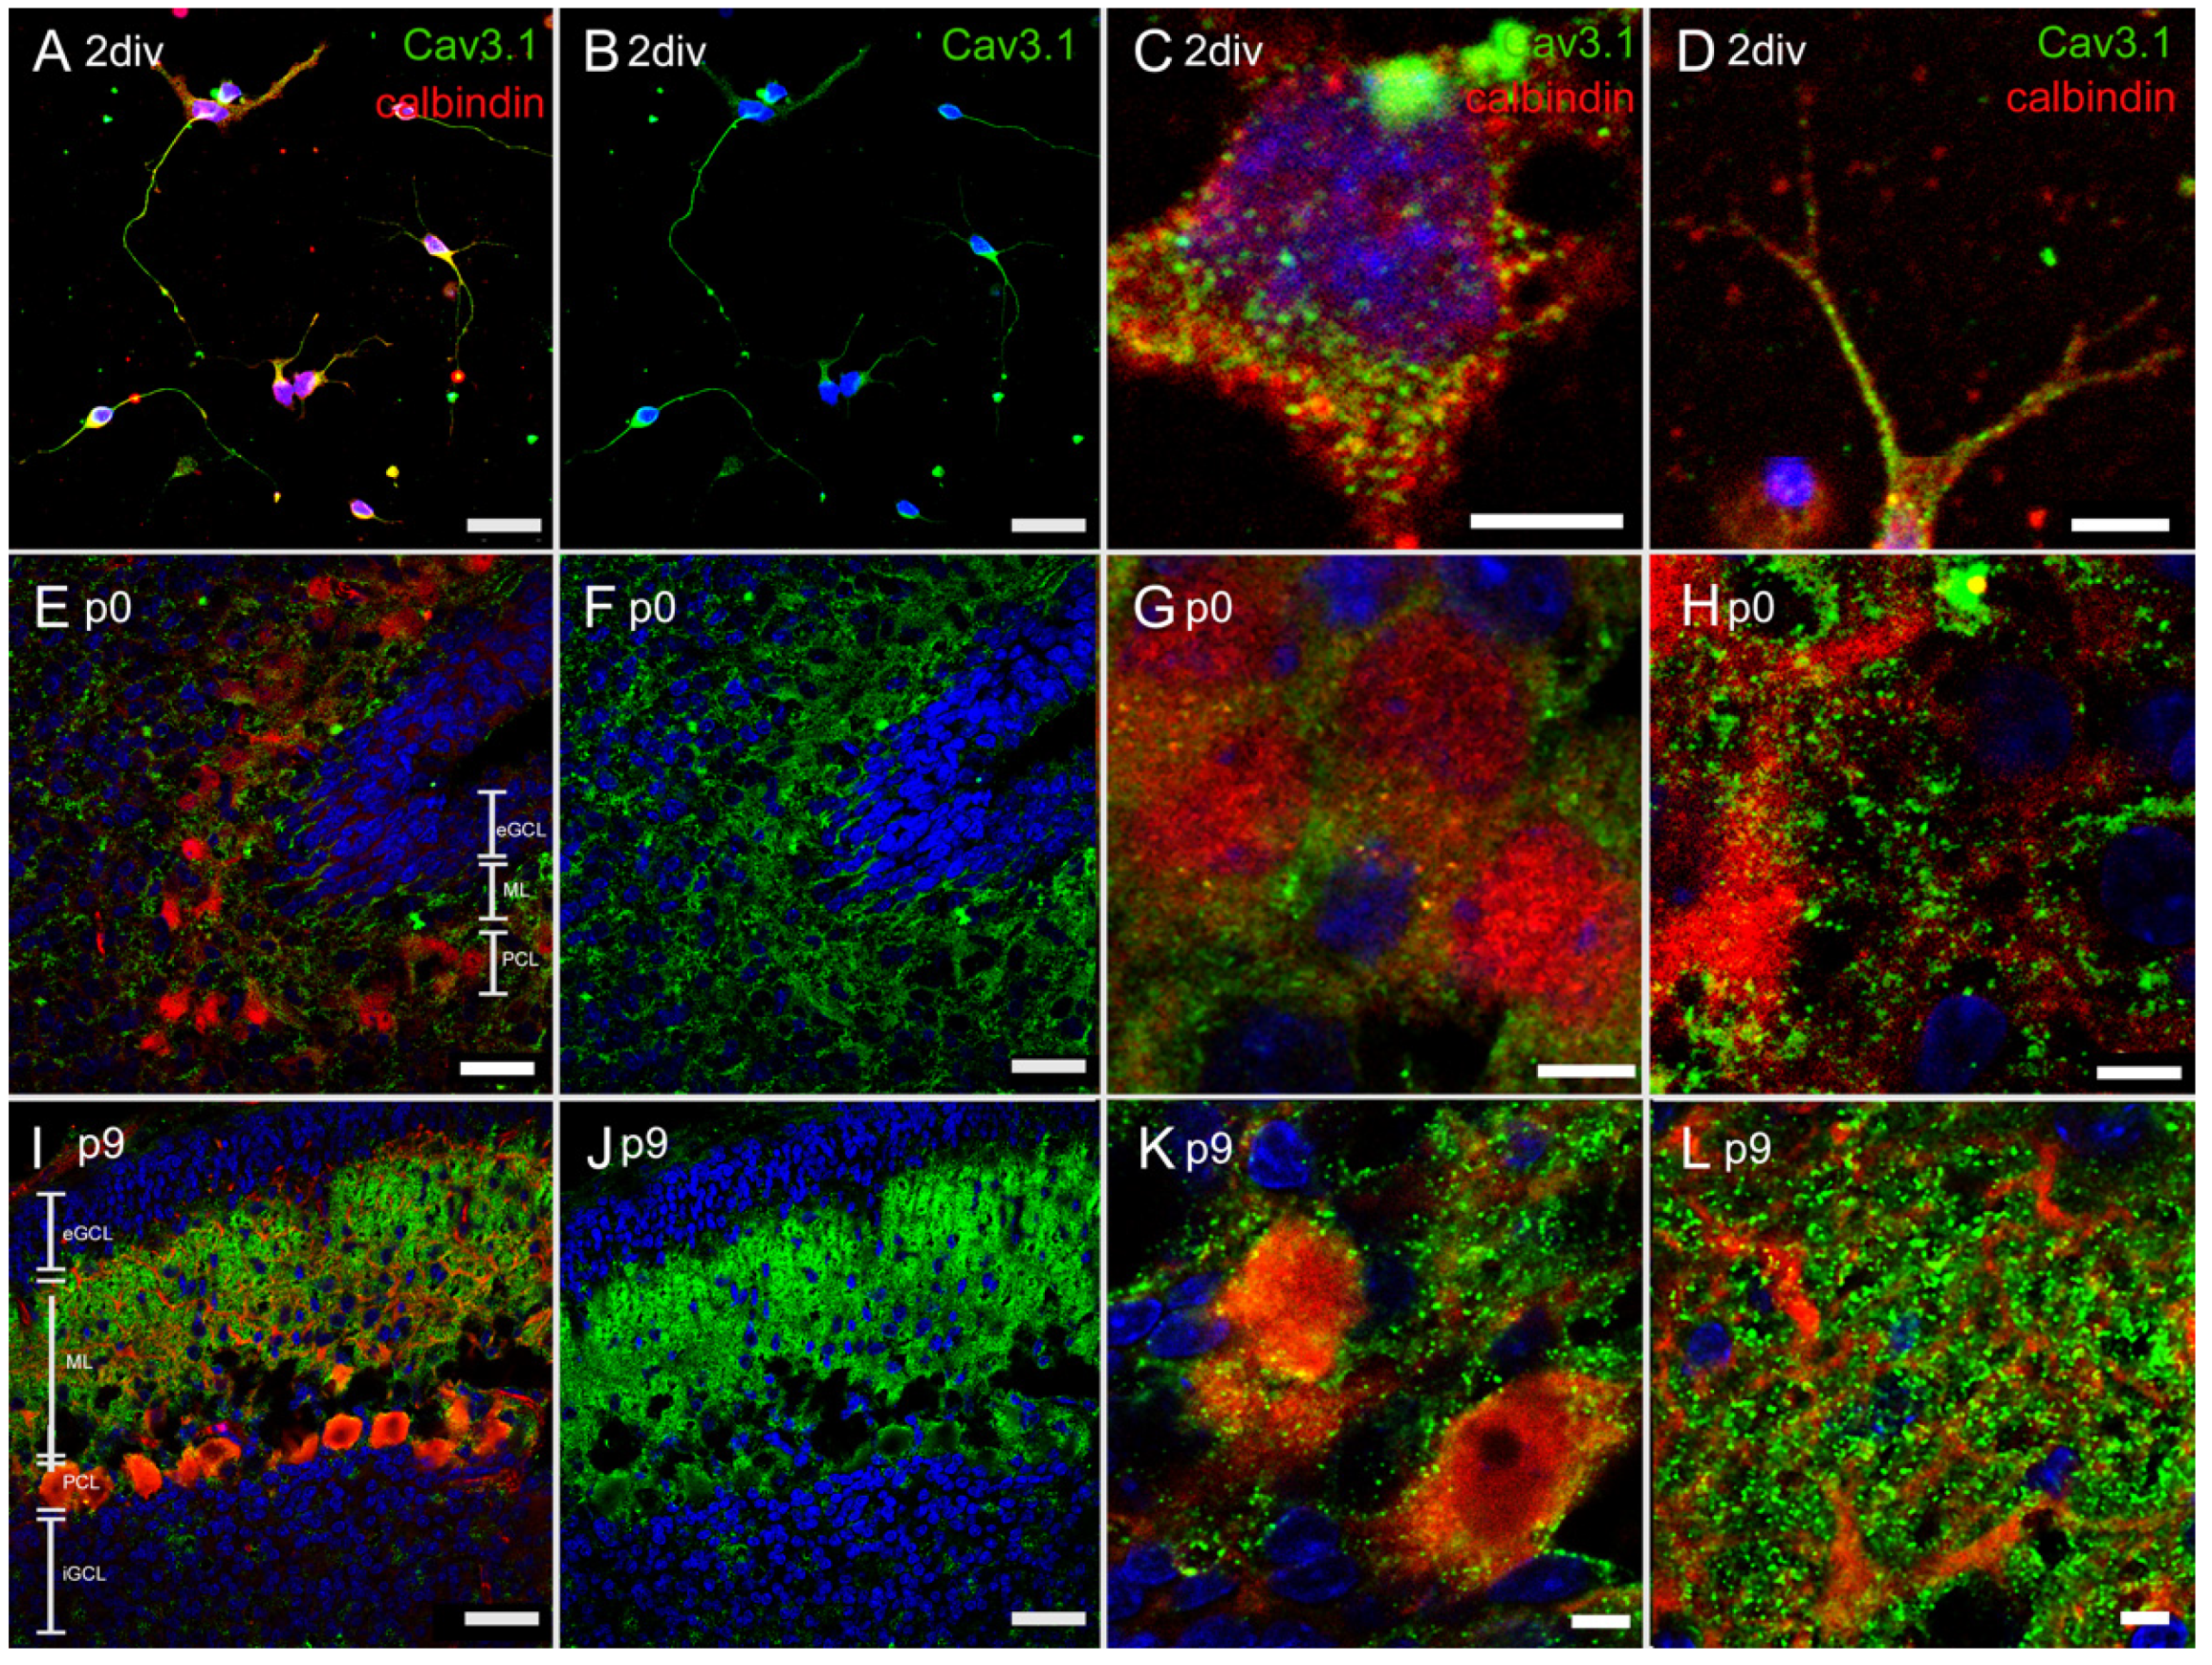
3.4.1. Immunostaining with Anti-Cav3.1 Antibody
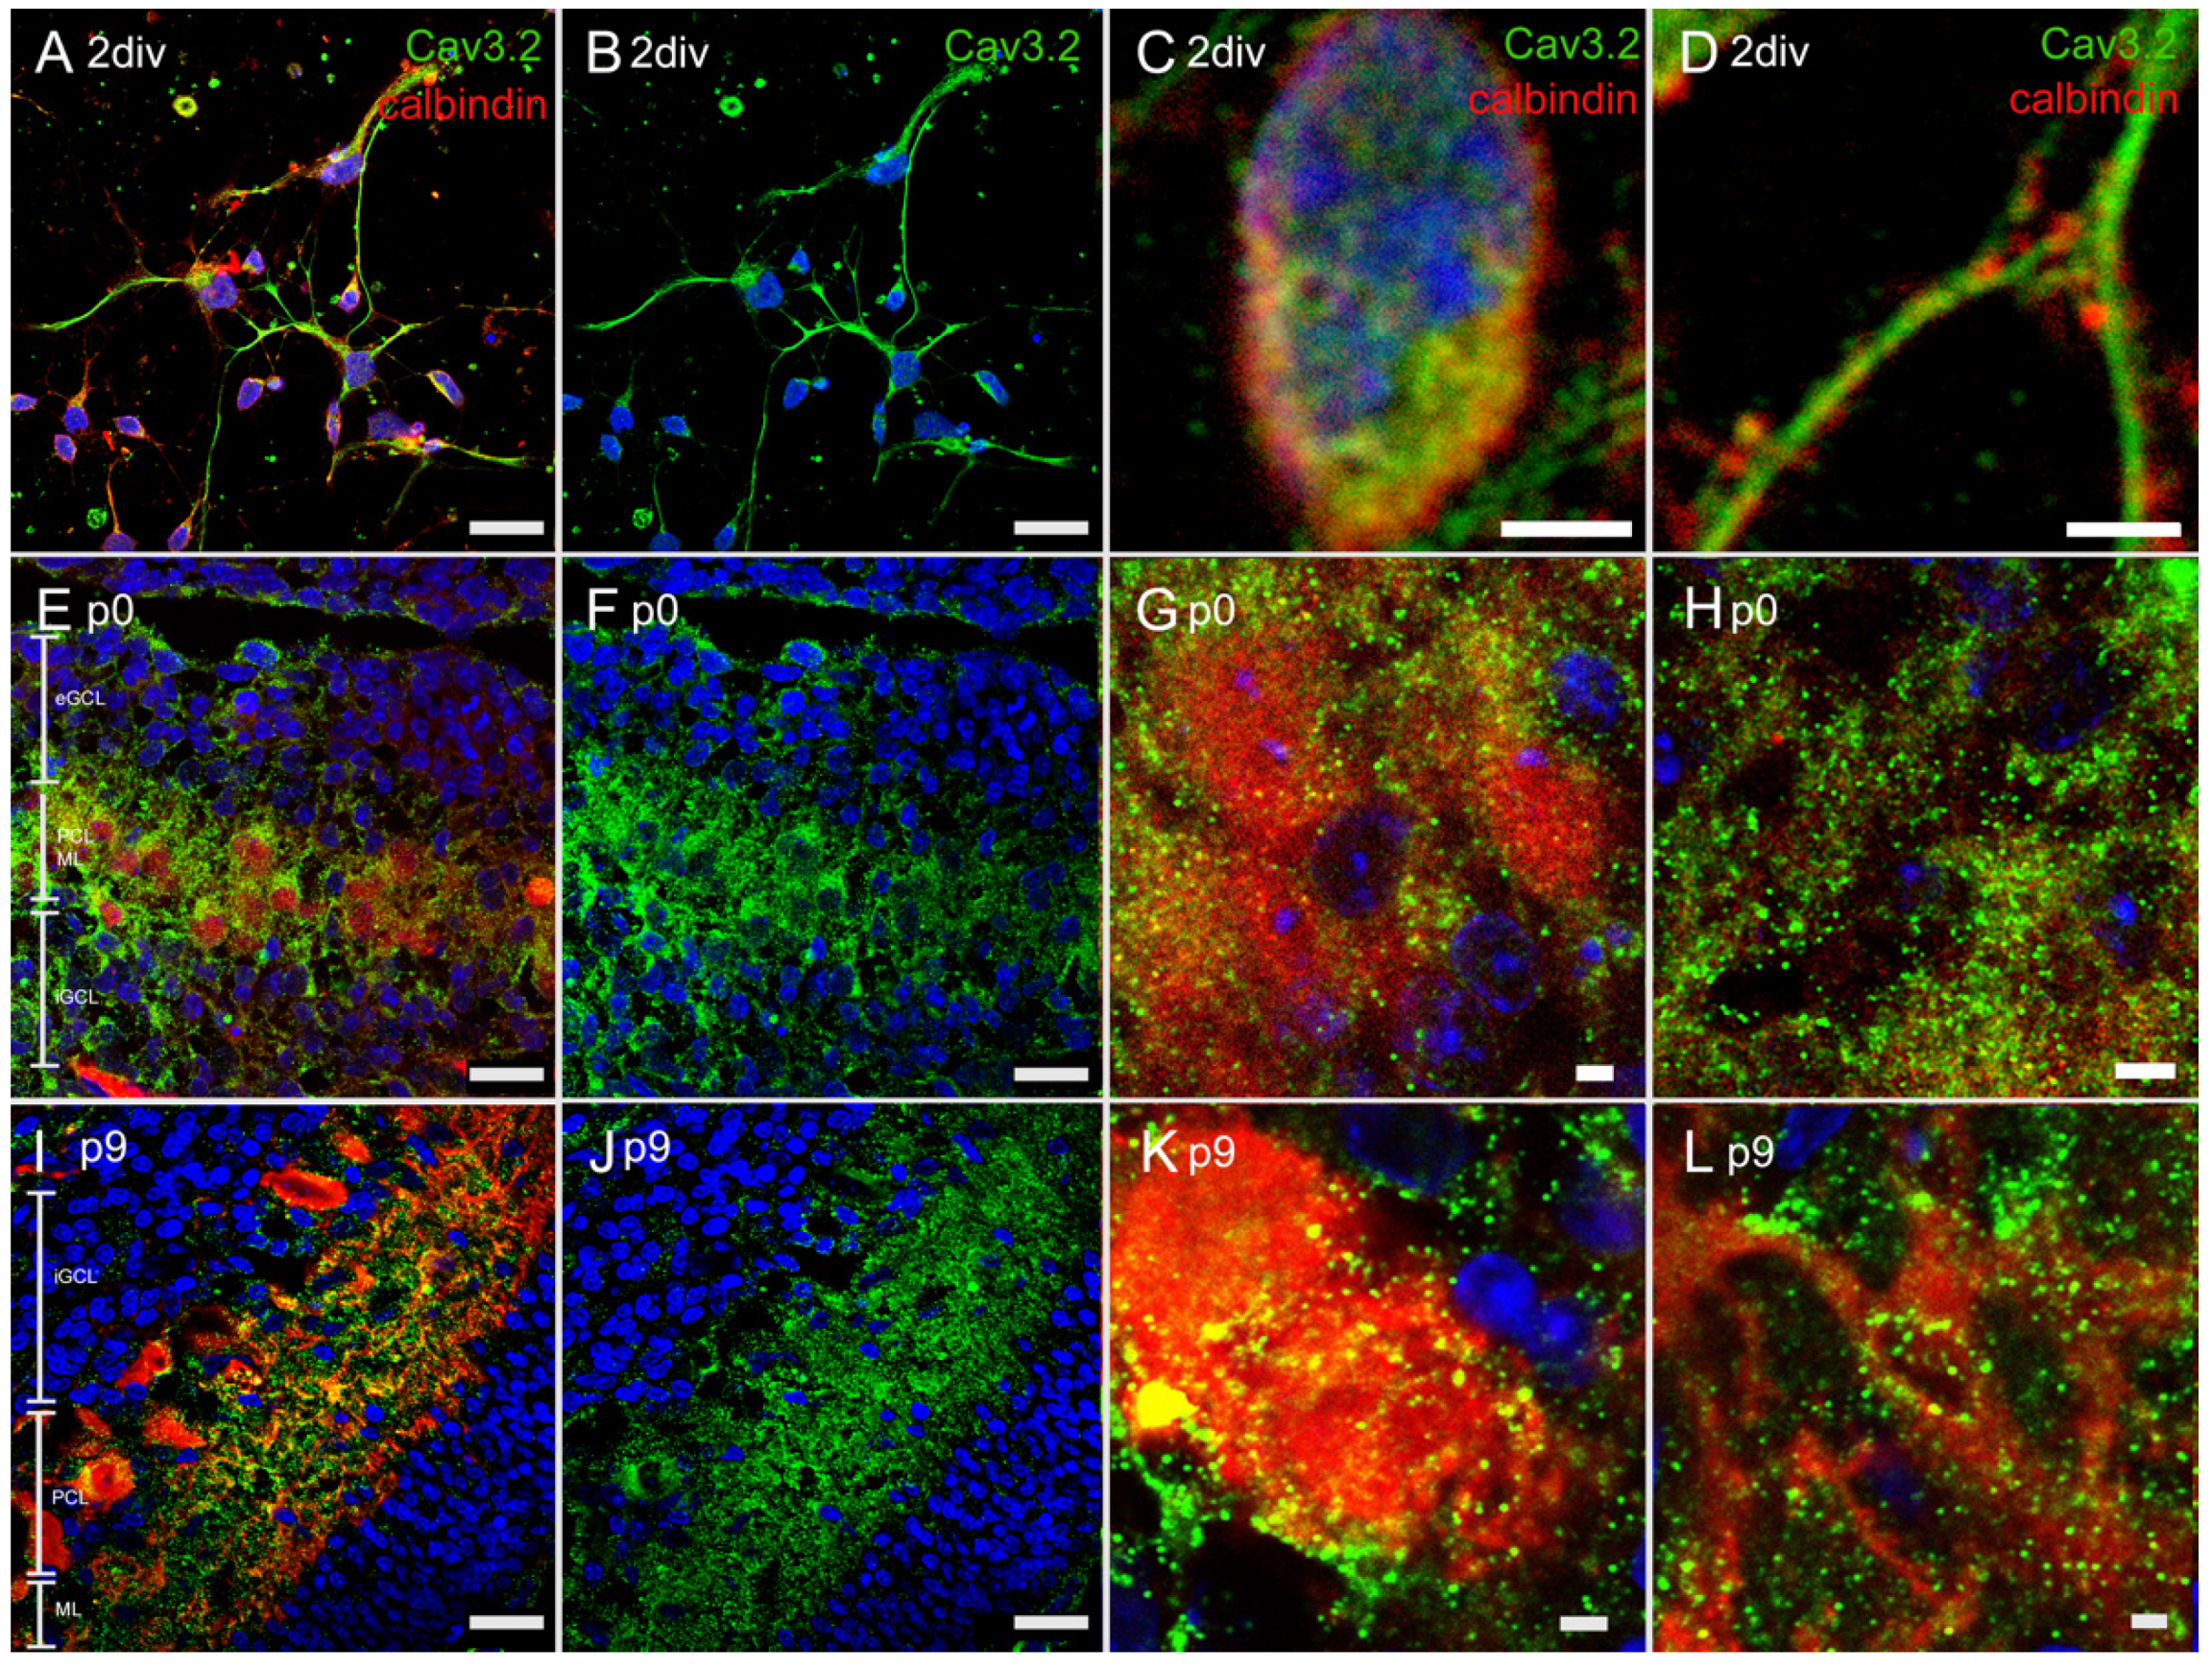
3.4.2. Immunostaining with Anti-Cav3.2 Antibody
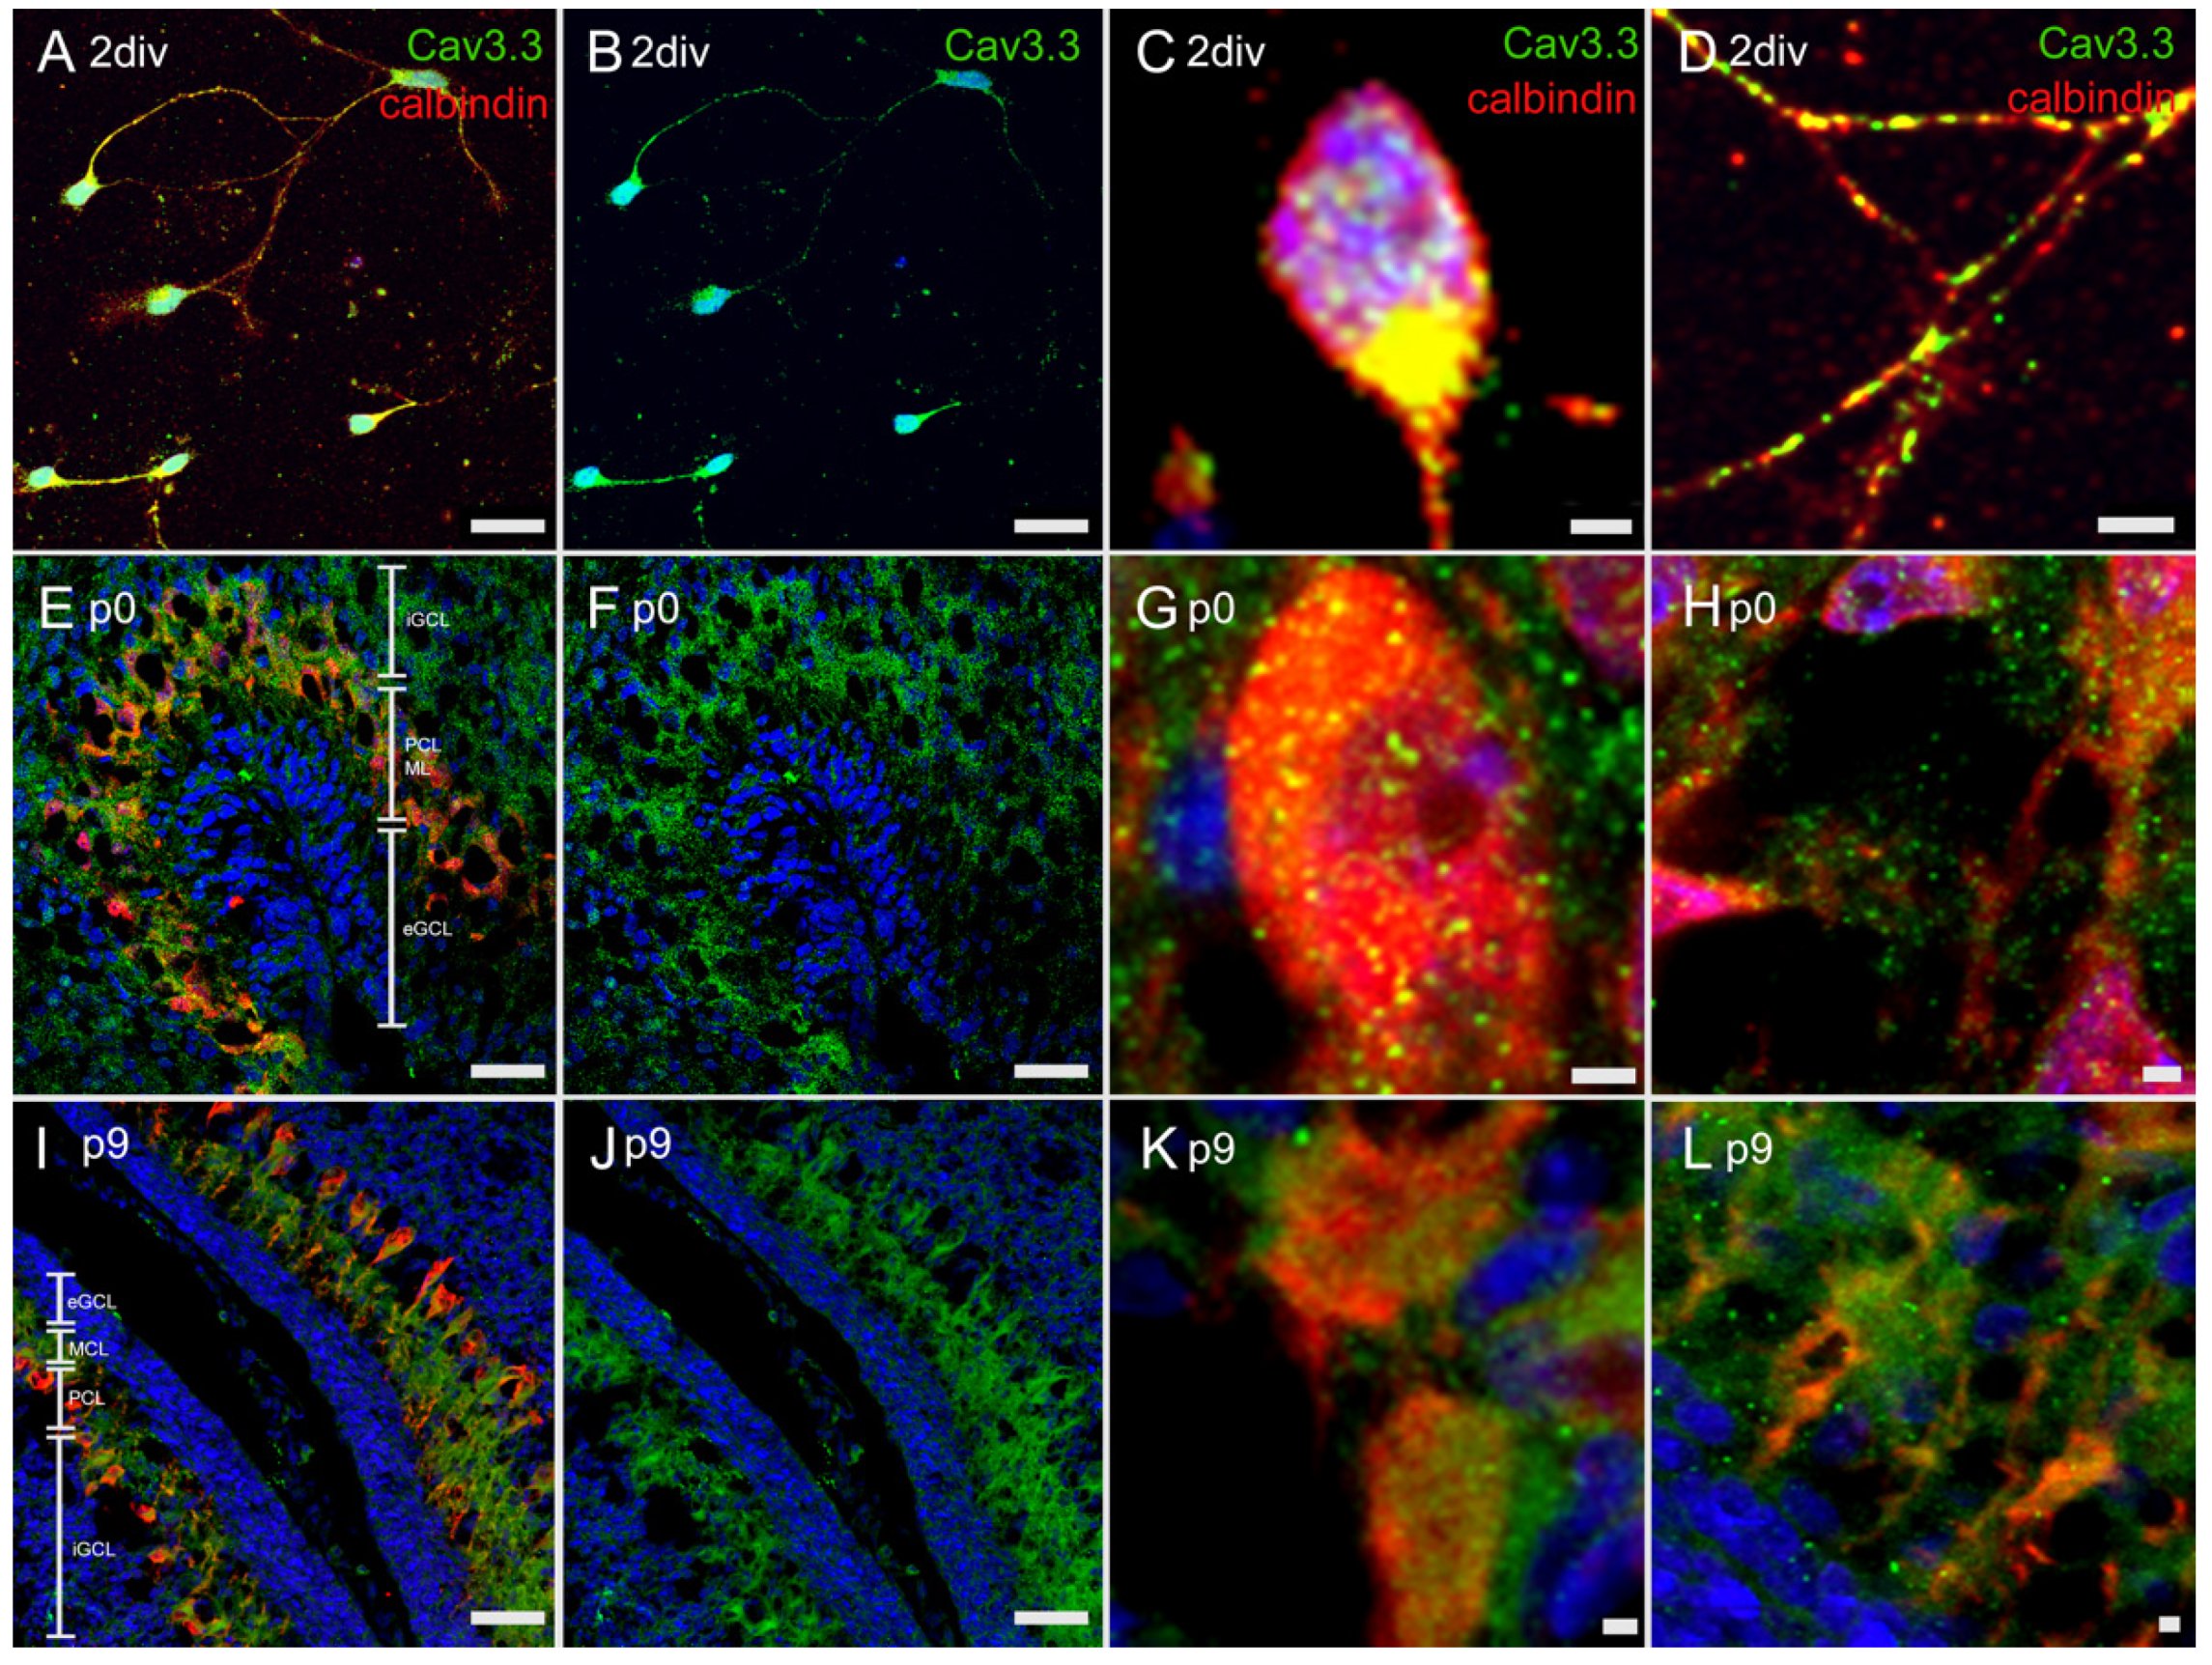
3.4.3. Immunostaining with Anti-Cav3.3 Antibody
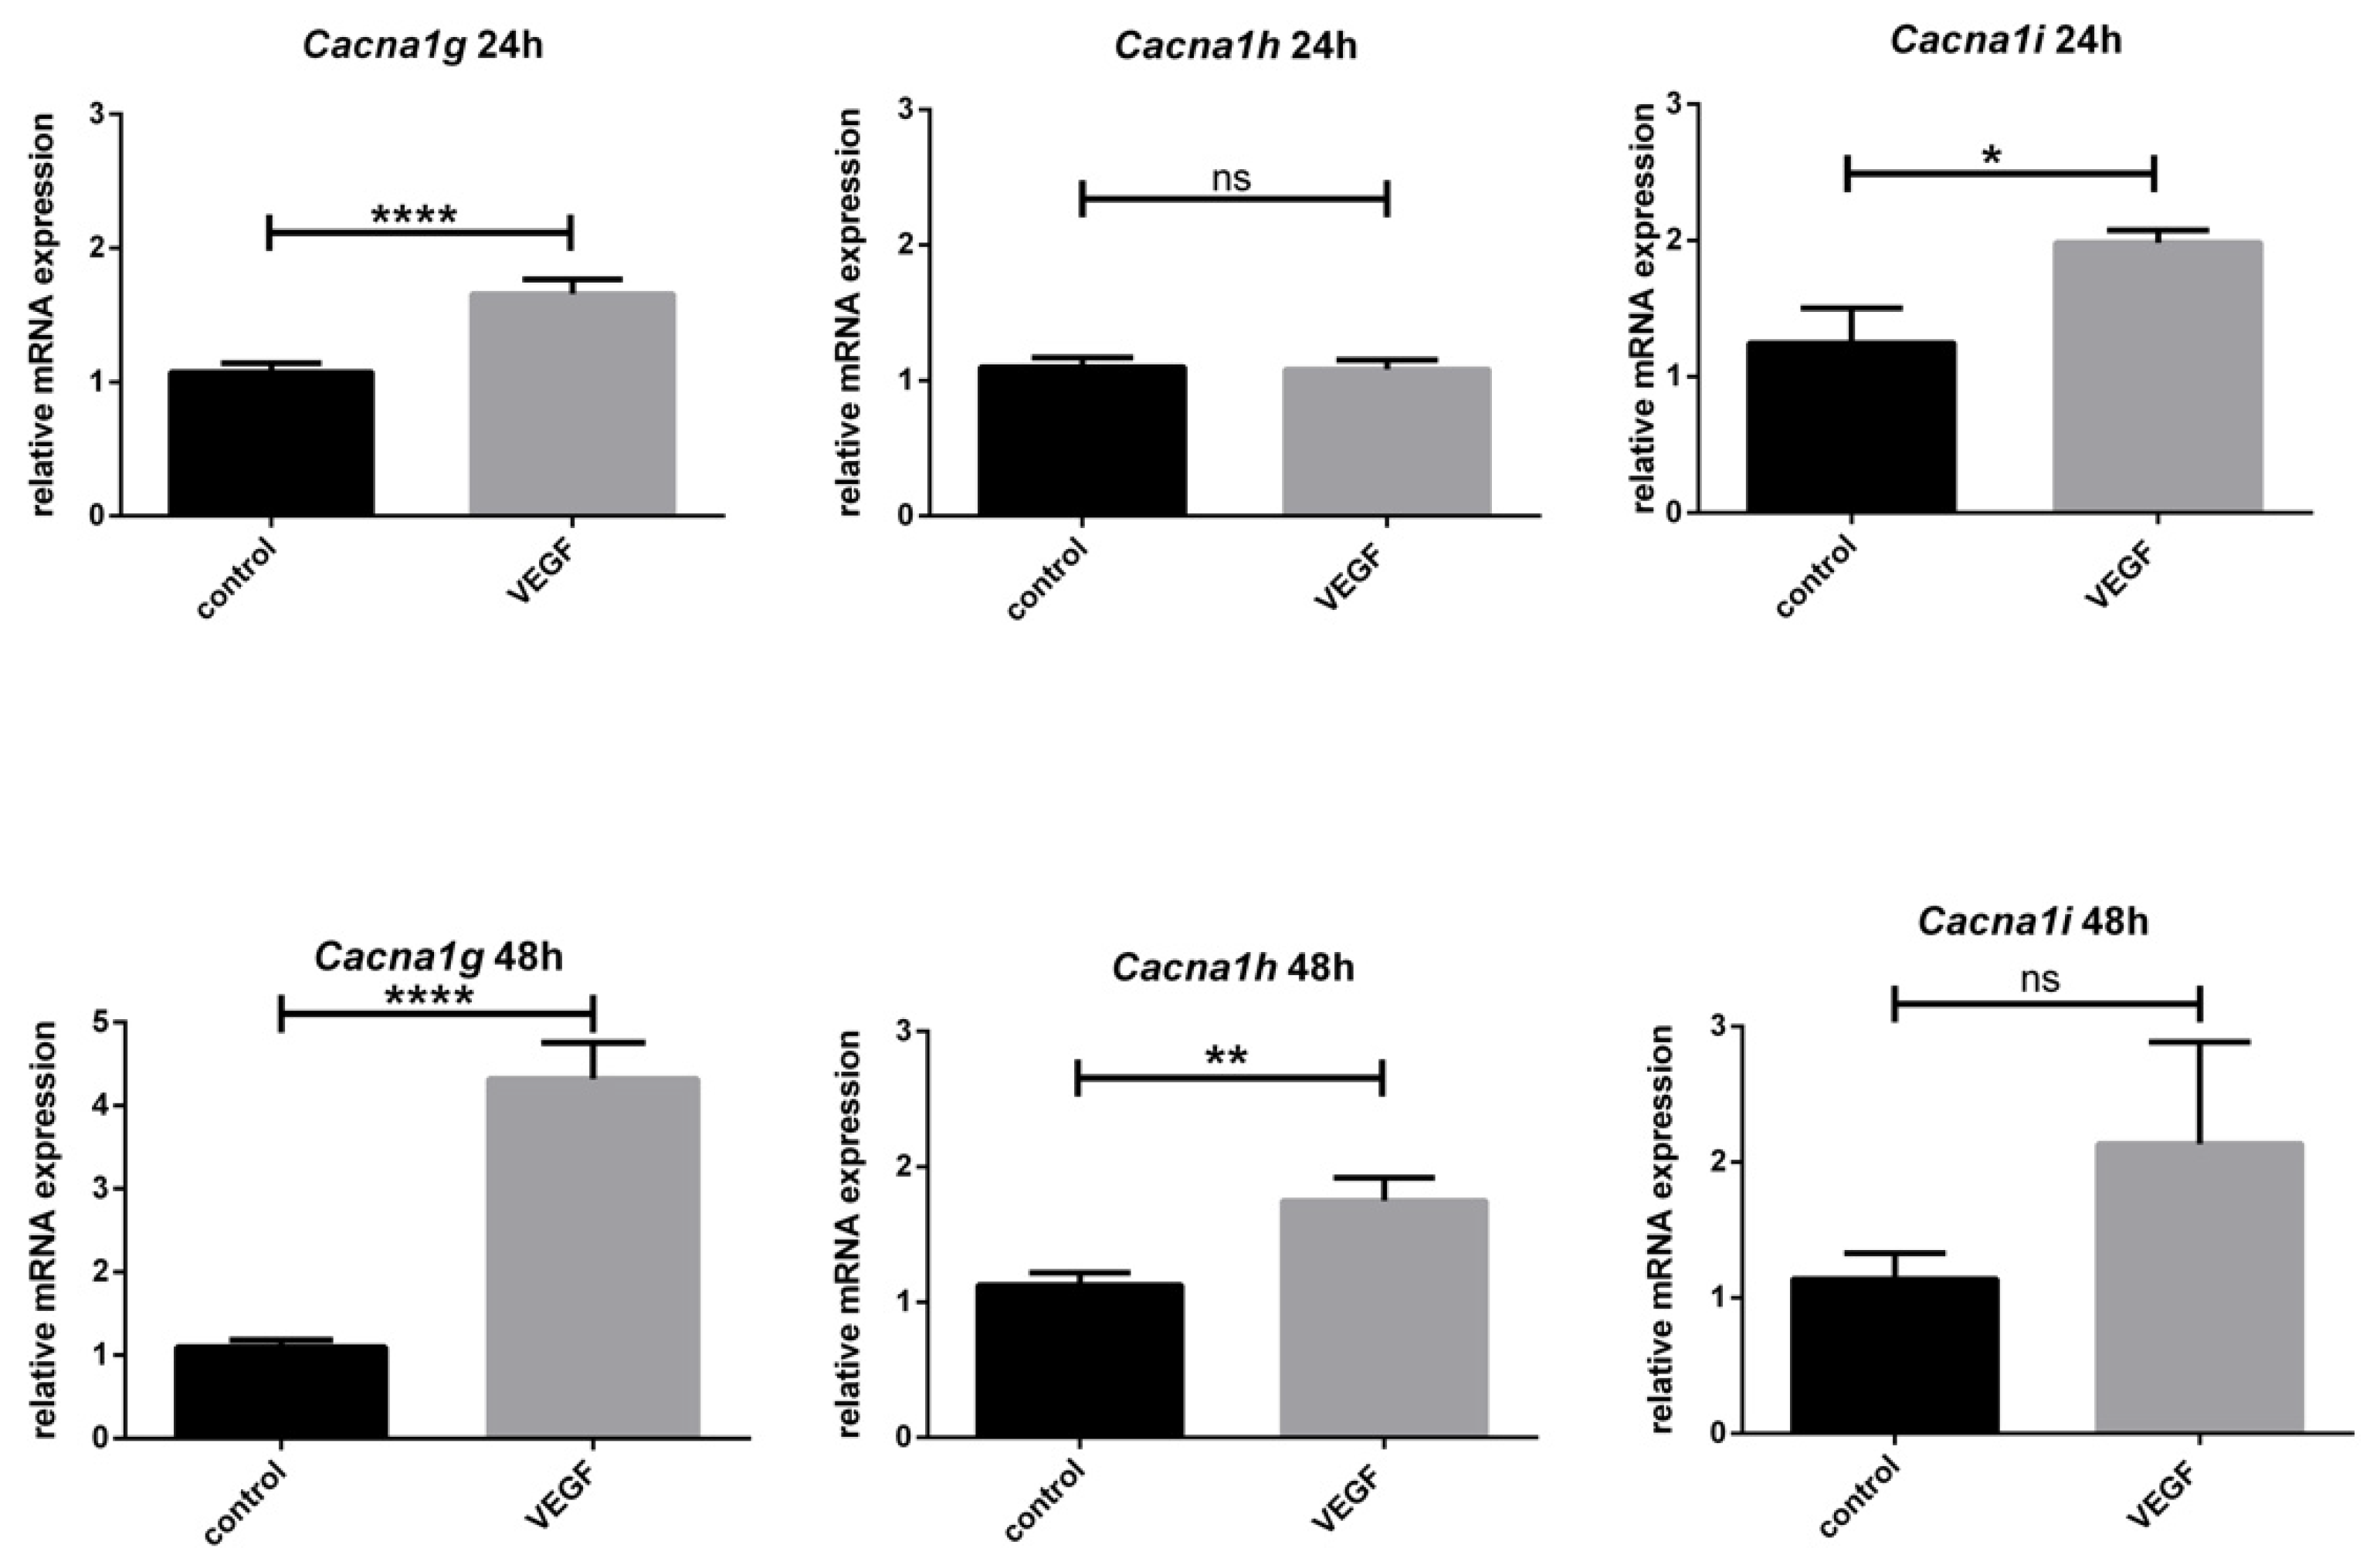
3.5. Effect of VEGF on Cacna1g, Cacna1h and Cacna1i
4. Discussion
4.1. Comparability of In Vivo- and In Vitro-Grown PC
4.2. Expression of T-Type Ca2+ Channels in PCs
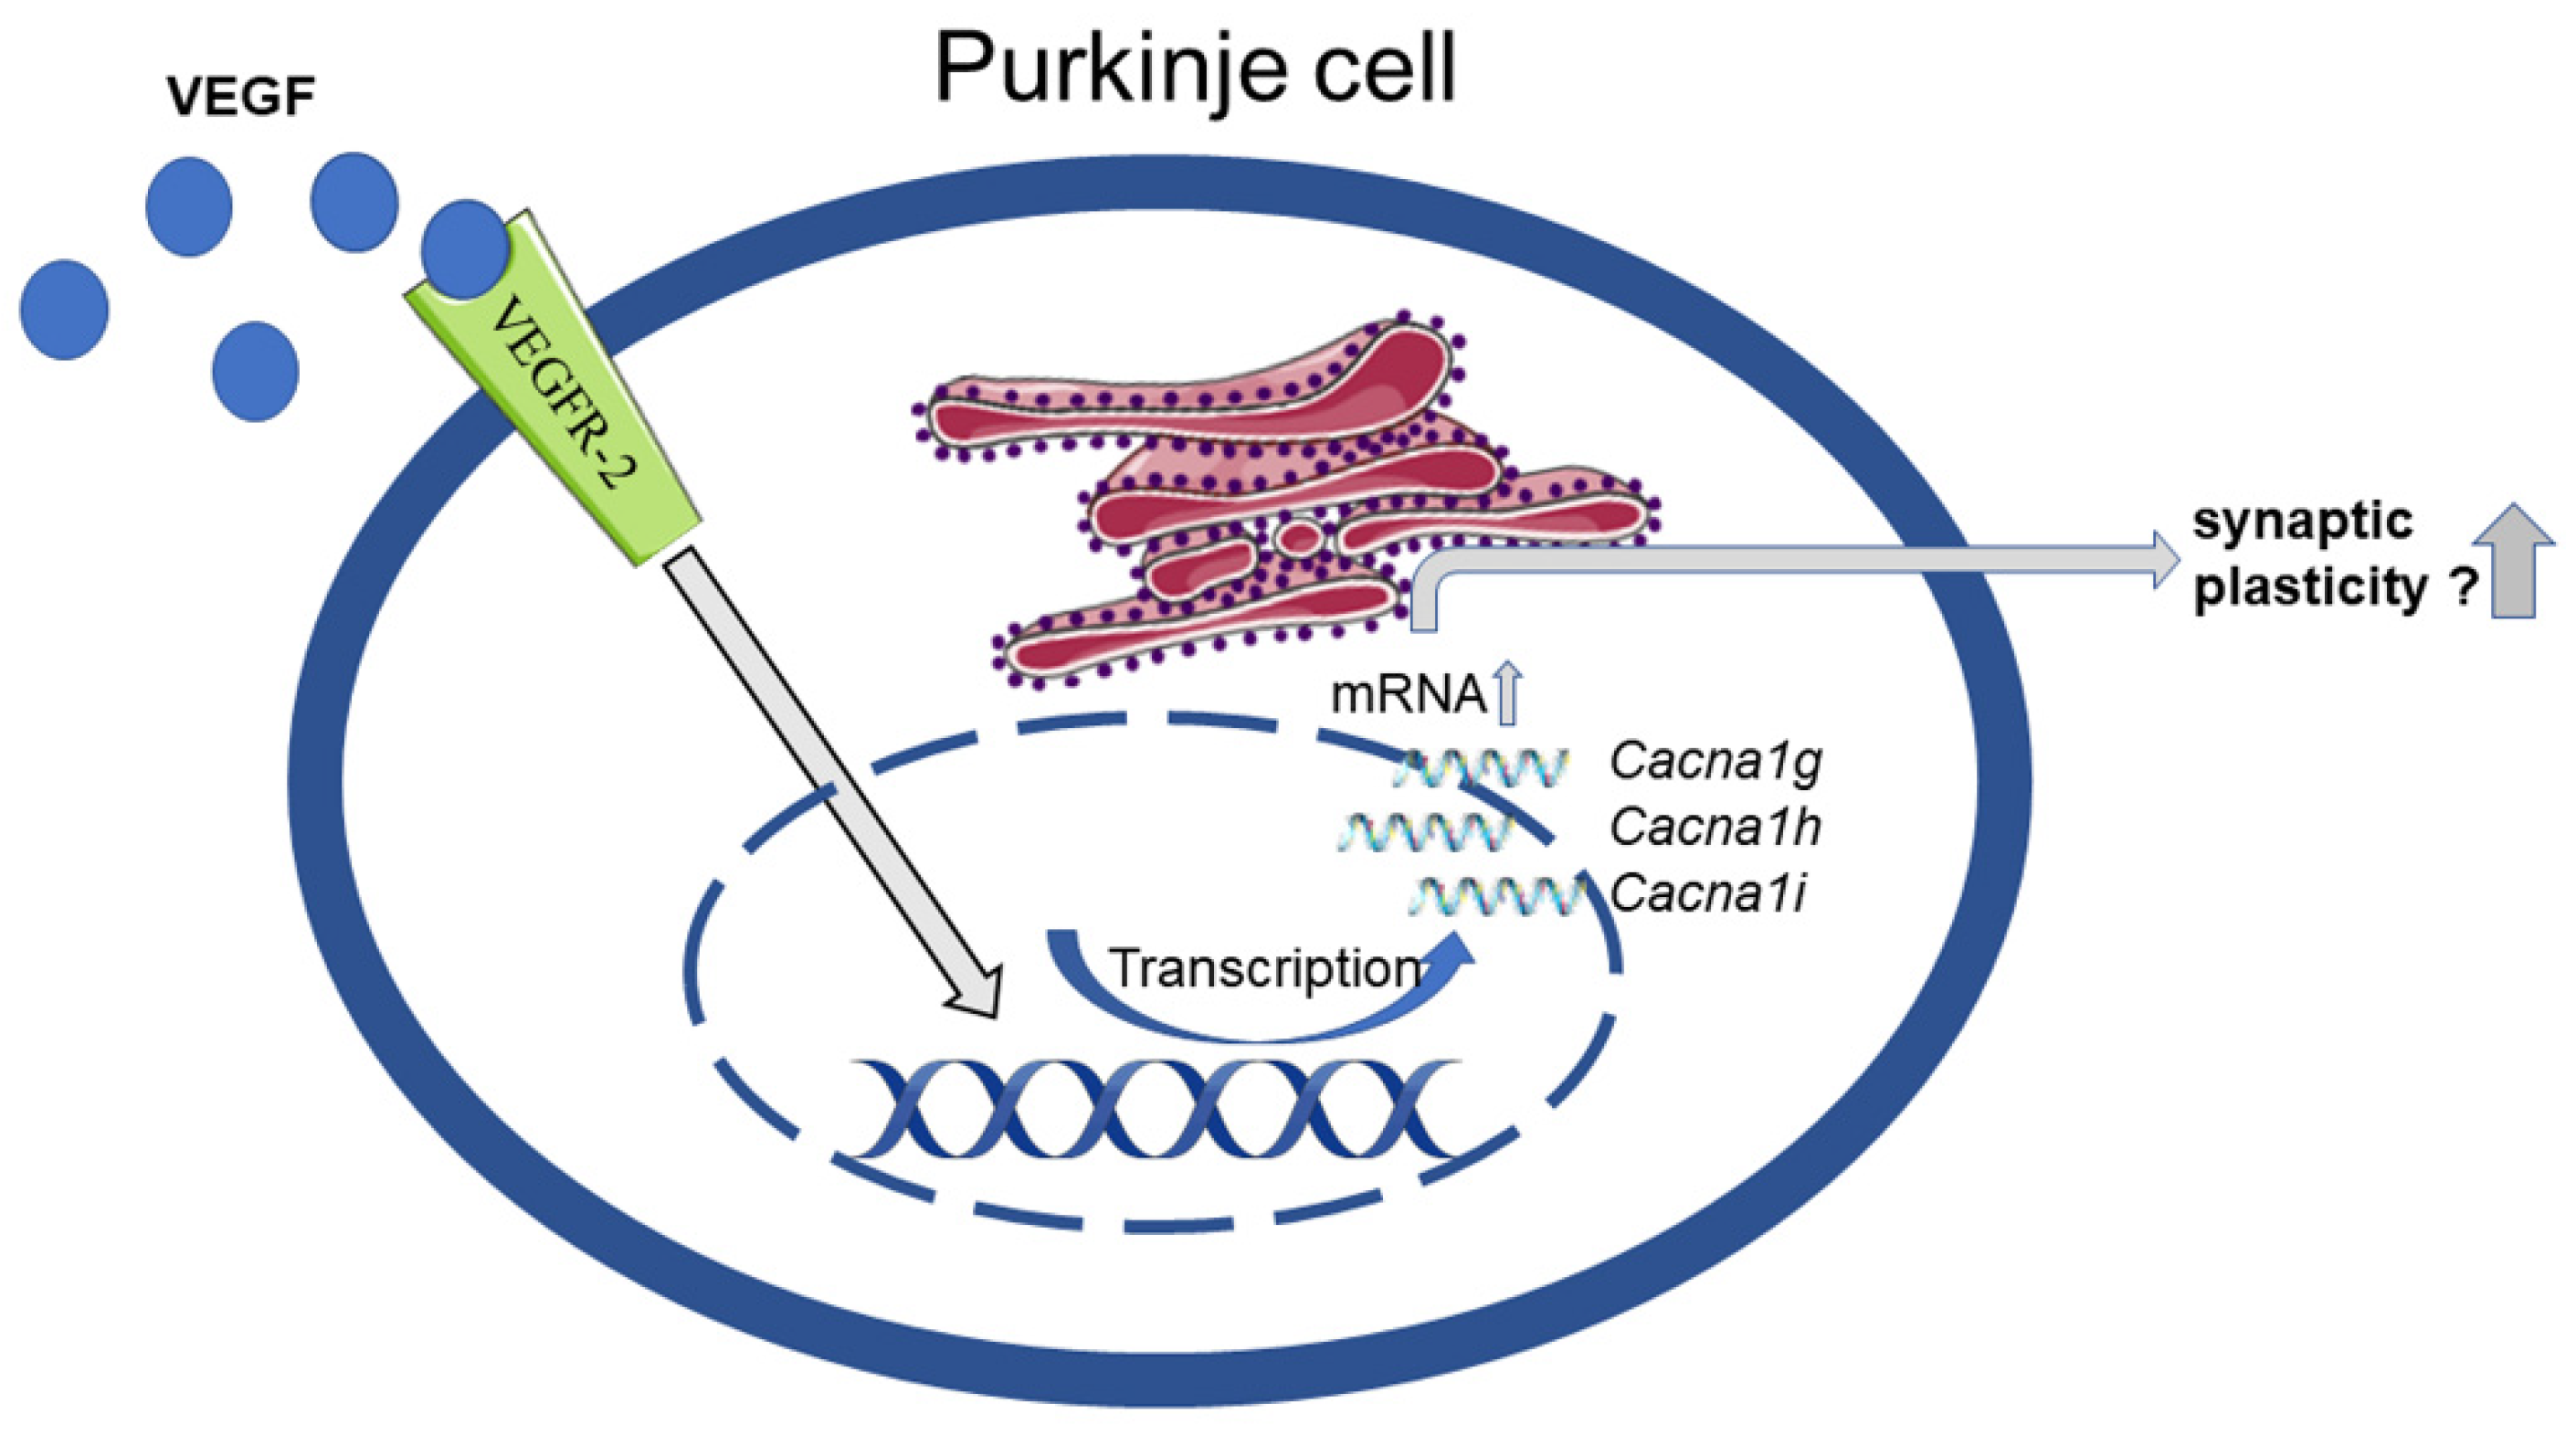
4.3. Impact of VEGF on T-Type Ca2+ Channels Expression
Author Contributions
Funding
Data Availability Statement
Acknowledgments
Conflicts of Interest
References
- Senger, D.R.; Galli, S.J.; Dvorak, A.M.; Perruzzi, C.A.; Harvey, V.S.; Dvorak, H.F. Tumor cells secrete a vascular permeability factor that promotes accumulation of ascites fluid. Science 1983, 219, 983–985. [Google Scholar] [CrossRef]
- Senger, D.R. Vascular endothelial growth factor: Much more than an angiogenesis factor. Mol. Biol. Cell 2010, 21, 377–379. [Google Scholar] [CrossRef] [Green Version]
- Ruiz de Almodovar, C.; Coulon, C.; Salin, P.A.; Knevels, E.; Chounlamountri, N.; Poesen, K.; Hermans, K.; Lambrechts, D.; van Geyte, K.; Dhondt, J.; et al. Matrix-binding vascular endothelial growth factor (VEGF) isoforms guide granule cell migration in the cerebellum via VEGF receptor Flk1. J. Neurosci. 2010, 30, 15052–15066. [Google Scholar] [CrossRef] [PubMed]
- Dumpich, M.; Theiss, C. VEGF in the nervous system: An important target for research in neurodevelopmental and regenerative medicine. Neural Regen. Res. 2015, 10, 1725–1726. [Google Scholar] [CrossRef] [PubMed]
- Maharaj, A.S.R.; D’Amore, P.A. Roles for VEGF in the adult. Microvasc. Res. 2007, 74, 100–113. [Google Scholar] [CrossRef] [PubMed]
- Stuttfeld, E.; Ballmer-Hofer, K. Structure and function of VEGF receptors. IUBMB Life 2009, 61, 915–922. [Google Scholar] [CrossRef] [PubMed]
- Licht, T.; Keshet, E. Delineating multiple functions of VEGF-A in the adult brain. Cell. Mol. Life Sci. 2013, 70, 1727–1737. [Google Scholar] [CrossRef]
- Carmeliet, P.; Ruiz de Almodovar, C.; Carmen, R.D.A. VEGF ligands and receptors: Implications in neurodevelopment and neurodegeneration. Cell. Mol. Life Sci. 2013, 70, 1763–1778. [Google Scholar] [CrossRef]
- Herrfurth, L.; Theis, V.; Matschke, V.; May, C.; Marcus, K.; Theiss, C. Morphological Plasticity of Emerging Purkinje Cells in Response to Exogenous VEGF. Front. Mol. Neurosci. 2017, 10, 2. [Google Scholar] [CrossRef]
- D’Angelo, E. Physiology of the cerebellum. Handb. Clin. Neurol. 2018, 154, 85–108. [Google Scholar] [CrossRef]
- Fujishima, K.; Kawabata Galbraith, K.; Kengaku, M. Dendritic Self-Avoidance and Morphological Development of Cerebellar Purkinje Cells. Cerebellum 2018, 17, 701–708. [Google Scholar] [CrossRef] [PubMed]
- Jin, K.; Mao, X.O.; Greenberg, D.A. Vascular endothelial growth factor stimulates neurite outgrowth from cerebral cortical neurons via Rho kinase signaling. J. Neurobiol. 2006, 66, 236–242. [Google Scholar] [CrossRef]
- Berlucchi, G.; Buchtel, H.A. Neuronal plasticity: Historical roots and evolution of meaning. Exp. Brain Res. 2009, 192, 307–319. [Google Scholar] [CrossRef] [PubMed]
- Gordon-Weeks, P.R.; Fournier, A.E. Neuronal cytoskeleton in synaptic plasticity and regeneration. J. Neurochem. 2014, 129, 206–212. [Google Scholar] [CrossRef]
- Lohmann, C.; Kessels, H.W. The developmental stages of synaptic plasticity. J. Physiol. 2014, 592, 13–31. [Google Scholar] [CrossRef] [Green Version]
- Wang, S.S.; Denk, W.; Häusser, M. Coincidence detection in single dendritic spines mediated by calcium release. Nat. Neurosci. 2000, 3, 1266–1273. [Google Scholar] [CrossRef]
- Maggio, N.; Vlachos, A. Synaptic plasticity at the interface of health and disease: New insights on the role of endoplasmic reticulum intracellular calcium stores. Neuroscience 2014, 281, 135–146. [Google Scholar] [CrossRef]
- Higgins, D.; Graupner, M.; Brunel, N. Memory maintenance in synapses with calcium-based plasticity in the presence of background activity. PLoS Comput. Biol. 2014, 10, e1003834. [Google Scholar] [CrossRef] [PubMed] [Green Version]
- Fierro, L.; Llano, I. High endogenous calcium buffering in Purkinje cells from rat cerebellar slices. J. Physiol. 1996, 496 Pt 3, 617–625. [Google Scholar] [CrossRef] [Green Version]
- Kitamura, K.; Kano, M. Dendritic calcium signaling in cerebellar Purkinje cell. Neural Netw. 2013, 47, 11–17. [Google Scholar] [CrossRef]
- Aguado, C.; García-Madrona, S.; Gil-Minguez, M.; Luján, R. Ontogenic Changes and Differential Localization of T-type Ca2+ Channel Subunits Cav3.1 and Cav3.2 in Mouse Hippocampus and Cerebellum. Front. Neuroanat. 2016, 10, 83. [Google Scholar] [CrossRef] [Green Version]
- Ikeda, H.; Heinke, B.; Ruscheweyh, R.; Sandkühler, J. Synaptic plasticity in spinal lamina I projection neurons that mediate hyperalgesia. Science 2003, 299, 1237–1240. [Google Scholar] [CrossRef] [Green Version]
- Hildebrand, M.E.; Isope, P.; Miyazaki, T.; Nakaya, T.; Garcia, E.; Feltz, A.; Schneider, T.; Hescheler, J.; Kano, M.; Sakimura, K.; et al. Functional coupling between mGluR1 and Cav3.1 T-type calcium channels contributes to parallel fiber-induced fast calcium signaling within Purkinje cell dendritic spines. J. Neurosci. 2009, 29, 9668–9682. [Google Scholar] [CrossRef] [PubMed] [Green Version]
- Yang, Y.; Lisberger, S.G. Purkinje-cell plasticity and cerebellar motor learning are graded by complex-spike duration. Nature 2014, 510, 529–532. [Google Scholar] [CrossRef] [Green Version]
- Pigeat, R.; Chausson, P.; Dreyfus, F.M.; Leresche, N.; Lambert, R.C. Sleep slow wave-related homo and heterosynaptic LTD of intrathalamic GABAAergic synapses: Involvement of T-type Ca2+ channels and metabotropic glutamate receptors. J. Neurosci. 2015, 35, 64–73. [Google Scholar] [CrossRef] [PubMed] [Green Version]
- Canepari, M. Is Purkinje Neuron Hyperpolarisation Important for Cerebellar Synaptic Plasticity? A Retrospective and Prospective Analysis. Cerebellum 2020, 19, 869–878. [Google Scholar] [CrossRef] [PubMed]
- Yunker, A.M.R.; Sharp, A.H.; Sundarraj, S.; Ranganathan, V.; Copeland, T.D.; McEnery, M.W. Immunological characterization of T-type voltage-dependent calcium channel CaV3.1 (alpha 1G) and CaV3.3 (alpha 1I) isoforms reveal differences in their localization, expression, and neural development. Neuroscience 2003, 117, 321–335. [Google Scholar] [CrossRef]
- Isope, P.; Hildebrand, M.E.; Snutch, T.P. Contributions of T-type voltage-gated calcium channels to postsynaptic calcium signaling within Purkinje neurons. Cerebellum 2012, 11, 651–665. [Google Scholar] [CrossRef] [PubMed] [Green Version]
- Ly, R.; Bouvier, G.; Szapiro, G.; Prosser, H.M.; Randall, A.D.; Kano, M.; Sakimura, K.; Isope, P.; Barbour, B.; Feltz, A. Contribution of postsynaptic T-type calcium channels to parallel fibre-Purkinje cell synaptic responses. J. Physiol. 2016, 594, 915–936. [Google Scholar] [CrossRef] [PubMed]
- Kampa, B.M.; Letzkus, J.J.; Stuart, G.J. Requirement of dendritic calcium spikes for induction of spike-timing-dependent synaptic plasticity. J. Physiol. 2006, 574, 283–290. [Google Scholar] [CrossRef] [PubMed]
- Binda, F.; Dorgans, K.; Reibel, S.; Sakimura, K.; Kano, M.; Poulain, B.; Isope, P. Inhibition promotes long-term potentiation at cerebellar excitatory synapses. Sci. Rep. 2016, 6, 33561. [Google Scholar] [CrossRef] [PubMed] [Green Version]
- Tjaden, J.; Pieczora, L.; Wach, F.; Theiss, C.; Theis, V. Cultivation of Purified Primary Purkinje Cells from Rat Cerebella. Cell. Mol. Neurobiol. 2018, 38, 1399–1412. [Google Scholar] [CrossRef]
- Pieczora, L.; Stracke, L.; Vorgerd, M.; Hahn, S.; Theiss, C.; Theis, V. Unveiling of miRNA Expression Patterns in Purkinje Cells During Development. Cerebellum 2017, 16, 376–387. [Google Scholar] [CrossRef] [PubMed]
- Zhang, J.D.; Biczok, R.; Ruschhaupt, M. ddCt; Bioconductor: Boston, MA, USA, 2017. [Google Scholar]
- Mullen, R.J.; Buck, C.R.; Smith, A.M. NeuN, a neuronal specific nuclear protein in vertebrates. Development 1992, 116, 201–211. [Google Scholar] [CrossRef]
- Wisden, W. Structure and distribution of multiple GABAA receptor subunits with special reference to the cerebellum. Ann. N. Y. Acad. Sci. 1995, 757, 506–515. [Google Scholar] [CrossRef] [PubMed]
- Lin, H.; Magrane, J.; Clark, E.M.; Halawani, S.M.; Warren, N.; Rattelle, A.; Lynch, D.R. Early VGLUT1-specific parallel fiber synaptic deficits and dysregulated cerebellar circuit in the KIKO mouse model of Friedreich ataxia. Dis. Model. Mech. 2017, 10, 1529–1538. [Google Scholar] [CrossRef] [Green Version]
- Bernsen, M.R.; van Muijen, G.N.; Ruiter, D.J. Lasermicrodissectie en moleculaire analyse op celniveau. Ned. Tijdschr. Geneeskd. 1999, 143, 2611–2615. [Google Scholar] [PubMed]
- Bastianelli, E. Distribution of calcium-binding proteins in the cerebellum. Cerebellum 2003, 2, 242–262. [Google Scholar] [CrossRef]
- Rodríguez, J.J.; Yeh, C.-Y.; Terzieva, S.; Olabarria, M.; Kulijewicz-Nawrot, M.; Verkhratsky, A. Complex and region-specific changes in astroglial markers in the aging brain. Neurobiol. Aging 2014, 35, 15–23. [Google Scholar] [CrossRef] [PubMed]
- Hibi, M.; Shimizu, T. Development of the cerebellum and cerebellar neural circuits. Dev. Neurobiol. 2012, 72, 282–301. [Google Scholar] [CrossRef] [PubMed]
- Mercurio, A.M. VEGF/Neuropilin Signaling in Cancer Stem Cells. Int. J. Mol. Sci. 2019, 20, 490. [Google Scholar] [CrossRef] [PubMed] [Green Version]
- Lambert, R.C.; Bessaïh, T.; Crunelli, V.; Leresche, N. The many faces of T-type calcium channels. Pflugers Arch. 2014, 466, 415–423. [Google Scholar] [CrossRef]
- Perez-Reyes, E.; Cribbs, L.L.; Daud, A.; Lacerda, A.E.; Barclay, J.; Williamson, M.P.; Fox, M.; Rees, M.; Lee, J.H. Molecular characterization of a neuronal low-voltage-activated T-type calcium channel. Nature 1998, 391, 896–900. [Google Scholar] [CrossRef]
- Cribbs, L.L.; Lee, J.H.; Yang, J.; Satin, J.; Zhang, Y.; Daud, A.; Barclay, J.; Williamson, M.P.; Fox, M.; Rees, M.; et al. Cloning and characterization of alpha1H from human heart, a member of the T-type Ca2+ channel gene family. Circ. Res. 1998, 83, 103–109. [Google Scholar] [CrossRef] [Green Version]
- Lee, J.H.; Daud, A.N.; Cribbs, L.L.; Lacerda, A.E.; Pereverzev, A.; Klöckner, U.; Schneider, T.; Perez-Reyes, E. Cloning and expression of a novel member of the low voltage-activated T-type calcium channel family. J. Neurosci. 1999, 19, 1912–1921. [Google Scholar] [CrossRef] [PubMed]
- Song, D.; Wang, Z.; Berger, T.W. Contribution of T-type VDCC to TEA-induced long-term synaptic modification in hippocampal CA1 and dentate gyrus. Hippocampus 2002, 12, 689–697. [Google Scholar] [CrossRef] [PubMed]
- Astori, S.; Lüthi, A. Synaptic plasticity at intrathalamic connections via CaV3.3 T-type Ca2+ channels and GluN2B-containing NMDA receptors. J. Neurosci. 2013, 33, 624–630. [Google Scholar] [CrossRef]
- Joksimovic, S.M.; Eggan, P.; Izumi, Y.; Joksimovic, S.L.; Tesic, V.; Dietz, R.M.; Orfila, J.E.; DiGruccio, M.R.; Herson, P.S.; Jevtovic-Todorovic, V.; et al. The role of T-type calcium channels in the subiculum: To burst or not to burst? J. Physiol. 2017, 595, 6327–6348. [Google Scholar] [CrossRef]
- Murchison, D.; Griffith, W.H. Low-voltage activated calcium currents increase in basal forebrain neurons from aged rats. J. Neurophysiol. 1995, 74, 876–887. [Google Scholar] [CrossRef]
- Horibe, S.; Tarusawa, E.; Komatsu, Y.; Yoshimura, Y. Ni2+-sensitive T-type Ca2+ channel currents are regulated in parallel with synaptic and visual response plasticity in visual cortex. Neurosci. Res. 2014, 87, 33–39. [Google Scholar] [CrossRef] [PubMed]
- Klöckner, U.; Lee, J.H.; Cribbs, L.L.; Daud, A.; Hescheler, J.; Pereverzev, A.; Perez-Reyes, E.; Schneider, T. Comparison of the Ca2+ currents induced by expression of three cloned alpha1 subunits, alpha1G, alpha1H and alpha1I, of low-voltage-activated T-type Ca2+ channels. Eur. J. Neurosci. 1999, 11, 4171–4178. [Google Scholar] [CrossRef]
- Empson, R.M.; Knöpfel, T. Functional integration of calcium regulatory mechanisms at Purkinje neuron synapses. Cerebellum 2012, 11, 640–650. [Google Scholar] [CrossRef] [PubMed] [Green Version]
- Hartmann, J.; Konnerth, A. Determinants of postsynaptic Ca2+ signaling in Purkinje neurons. Cell Calcium 2005, 37, 459–466. [Google Scholar] [CrossRef] [PubMed]
- Nevian, T.; Sakmann, B. Spine Ca2+ signaling in spike-timing-dependent plasticity. J. Neurosci. 2006, 26, 11001–11013. [Google Scholar] [CrossRef] [Green Version]
- Mateos-Aparicio, P.; Rodríguez-Moreno, A. Calcium Dynamics and Synaptic Plasticity. Adv. Exp. Med. Biol. 2020, 1131, 965–984. [Google Scholar] [CrossRef]
- Talley, E.M.; Cribbs, L.L.; Lee, J.-H.; Daud, A.; Perez-Reyes, E.; Bayliss, D.A. Differential Distribution of Three Members of a Gene Family Encoding Low Voltage-Activated (T-Type) Calcium Channels. J. Neurosci. 1999, 19, 1895–1911. [Google Scholar] [CrossRef]
- McKay, B.E.; McRory, J.E.; Molineux, M.L.; Hamid, J.; Snutch, T.P.; Zamponi, G.W.; Turner, R.W. Ca(V)3 T-type calcium channel isoforms differentially distribute to somatic and dendritic compartments in rat central neurons. Eur. J. Neurosci. 2006, 24, 2581–2594. [Google Scholar] [CrossRef]
- Molineux, M.L.; McRory, J.E.; McKay, B.E.; Hamid, J.; Mehaffey, W.H.; Rehak, R.; Snutch, T.P.; Zamponi, G.W.; Turner, R.W. Specific T-type calcium channel isoforms are associated with distinct burst phenotypes in deep cerebellar nuclear neurons. Proc. Natl. Acad. Sci. USA 2006, 103, 5555–5560. [Google Scholar] [CrossRef] [Green Version]
- Beazley-Long, N.; Hua, J.; Jehle, T.; Hulse, R.P.; Dersch, R.; Lehrling, C.; Bevan, H.; Qiu, Y.; Lagrèze, W.A.; Wynick, D.; et al. VEGF-A165b is an endogenous neuroprotective splice isoform of vascular endothelial growth factor A in vivo and in vitro. Am. J. Pathol. 2013, 183, 918–929. [Google Scholar] [CrossRef] [Green Version]
- Schlau, M.; Terheyden-Keighley, D.; Theis, V.; Mannherz, H.G.; Theiss, C. VEGF Triggers the Activation of Cofilin and the Arp2/3 Complex within the Growth Cone. Int. J. Mol. Sci. 2018, 19, 384. [Google Scholar] [CrossRef] [PubMed] [Green Version]
- Gomes, E.; Papa, L.; Hao, T.; Rockwell, P. The VEGFR2 and PKA pathways converge at MEK/ERK1/2 to promote survival in serum deprived neuronal cells. Mol. Cell. Biochem. 2007, 305, 179–190. [Google Scholar] [CrossRef] [PubMed]
- Chin, H.-K.; Horng, C.-T.; Liu, Y.-S.; Lu, C.-C.; Su, C.-Y.; Chen, P.-S.; Chiu, H.-Y.; Tsai, F.-J.; Shieh, P.-C.; Yang, J.-S. Kaempferol inhibits angiogenic ability by targeting VEGF receptor-2 and downregulating the PI3K/AKT, MEK and ERK pathways in VEGF-stimulated human umbilical vein endothelial cells. Oncol. Rep. 2018, 39, 2351–2357. [Google Scholar] [CrossRef] [PubMed]
- Wang, Q.; Wang, T.; Zhu, L.; He, N.; Duan, C.; Deng, W.; Zhang, H.; Zhang, X. Sophocarpine Inhibits Tumorgenesis of Colorectal Cancer via Downregulation of MEK/ERK/VEGF Pathway. Biol. Pharm. Bull. 2019, 42, 1830–1838. [Google Scholar] [CrossRef] [Green Version]
- Ferron, L.; Capuano, V.; Ruchon, Y.; Deroubaix, E.; Coulombe, A.; Renaud, J.-F. Angiotensin II signaling pathways mediate expression of cardiac T-type calcium channels. Circ. Res. 2003, 93, 1241–1248. [Google Scholar] [CrossRef] [PubMed] [Green Version]
- Wang, D.; Hirase, T.; Inoue, T.; Node, K. Atorvastatin inhibits angiotensin II-induced T-type Ca2+ channel expression in endothelial cells. Biochem. Biophys. Res. Commun. 2006, 347, 394–400. [Google Scholar] [CrossRef]
- Zheng, Z.; Chen, H.; Xie, P.; Dickerson, C.A.; King, J.A.C.; Alexeyev, M.F.; Wu, S. α1G T-type calcium channel determines the angiogenic potential of pulmonary microvascular endothelial cells. Am. J. Physiol. Cell Physiol. 2019, 316, C353–C364. [Google Scholar] [CrossRef] [PubMed]
- Ly, R.; Bouvier, G.; Schonewille, M.; Arabo, A.; Rondi-Reig, L.; Léna, C.; Casado, M.; de Zeeuw, C.I.; Feltz, A. T-type channel blockade impairs long-term potentiation at the parallel fiber-Purkinje cell synapse and cerebellar learning. Proc. Natl. Acad. Sci. USA 2013, 110, 20302–20307. [Google Scholar] [CrossRef] [PubMed] [Green Version]


Publisher’s Note: MDPI stays neutral with regard to jurisdictional claims in published maps and institutional affiliations. |
© 2021 by the authors. Licensee MDPI, Basel, Switzerland. This article is an open access article distributed under the terms and conditions of the Creative Commons Attribution (CC BY) license (https://creativecommons.org/licenses/by/4.0/).
Share and Cite
Tjaden, J.; Eickhoff, A.; Stahlke, S.; Gehmeyr, J.; Vorgerd, M.; Theis, V.; Matschke, V.; Theiss, C. Expression Pattern of T-Type Ca2+ Channels in Cerebellar Purkinje Cells after VEGF Treatment. Cells 2021, 10, 2277. https://0-doi-org.brum.beds.ac.uk/10.3390/cells10092277
Tjaden J, Eickhoff A, Stahlke S, Gehmeyr J, Vorgerd M, Theis V, Matschke V, Theiss C. Expression Pattern of T-Type Ca2+ Channels in Cerebellar Purkinje Cells after VEGF Treatment. Cells. 2021; 10(9):2277. https://0-doi-org.brum.beds.ac.uk/10.3390/cells10092277
Chicago/Turabian StyleTjaden, Jonas, Annika Eickhoff, Sarah Stahlke, Julian Gehmeyr, Matthias Vorgerd, Verena Theis, Veronika Matschke, and Carsten Theiss. 2021. "Expression Pattern of T-Type Ca2+ Channels in Cerebellar Purkinje Cells after VEGF Treatment" Cells 10, no. 9: 2277. https://0-doi-org.brum.beds.ac.uk/10.3390/cells10092277