Article

Key Genes and Biochemical Networks in Various Brain Regions Affected in Alzheimer’s Disease

1
Faculty of Basic Sciences and Advanced Medical Technologies, Royan Institute for Stem Cell Biology and Technology, ACECR, Tehran 1665659911, Iran
2
Department of Brain and Cognitive Sciences, Cell Science Research Center, Royan Institute for Stem Cell Biology and Technology, ACECR, Tehran 1665659911, Iran
3
School of Biological and Behavioural Sciences, Queen Mary University of London, London E1 4NS, UK
4
School of Life and Environmental Sciences, University of Sydney, Sydney, NSW 2006, Australia
5
Australian Proteome Analysis Facility, Macquarie University, Sydney, NSW 2109, Australia
6
School of Medicine, Deakin University, Geelong, VIC 2600, Australia
7
Department of Clinical Medicine, Faculty of Medicine, Health and Human Sciences, Macquarie Medical School, Macquarie University, Macquarie Park, North Ryde, Sydney, NSW 2109, Australia
8
School of Natural Sciences, Macquarie University, Macquarie Park, NSW 2109, Australia
9
Biomolecular Discovery Research Centre, Macquarie University, Sydney, NSW 2109, Australia
*
Authors to whom correspondence should be addressed.
Submission received: 25 January 2022 / Revised: 2 March 2022 / Accepted: 10 March 2022 / Published: 14 March 2022

Abstract

:
Alzheimer’s disease (AD) is one of the most complicated progressive neurodegenerative brain disorders, affecting millions of people around the world. Ageing remains one of the strongest risk factors associated with the disease and the increasing trend of the ageing population globally has significantly increased the pressure on healthcare systems worldwide. The pathogenesis of AD is being extensively investigated, yet several unknown key components remain. Therefore, we aimed to extract new knowledge from existing data. Ten gene expression datasets from different brain regions including the hippocampus, cerebellum, entorhinal, frontal and temporal cortices of 820 AD cases and 626 healthy controls were analyzed using the robust rank aggregation (RRA) method. Our results returned 1713 robust differentially expressed genes (DEGs) between five brain regions of AD cases and healthy controls. Subsequent analysis revealed pathways that were altered in each brain region, of which the GABAergic synapse pathway and the retrograde endocannabinoid signaling pathway were shared between all AD affected brain regions except the cerebellum, which is relatively less sensitive to the effects of AD. Furthermore, we obtained common robust DEGs between these two pathways and predicted three miRNAs as potential candidates targeting these genes; hsa-mir-17-5p, hsa-mir-106a-5p and hsa-mir-373-3p. Three transcription factors (TFs) were also identified as the potential upstream regulators of the robust DEGs; ELK-1, GATA1 and GATA2. Our results provide the foundation for further research investigating the role of these pathways in AD pathogenesis, and potential application of these miRNAs and TFs as therapeutic and diagnostic targets.

1. Introduction

Alzheimer’s disease (AD) is the leading cause of dementia, affecting between 70 to 80% of older adults with dementia [1]. Currently, over 50 million people are living with the disease worldwide, and this number is estimated to rise to 150 million in 2050, exacerbating an already constrained healthcare system unless preventive strategies are implemented [2,3]. AD is characterized by initial memory loss and learning impairment, followed by cognitive dysfunction. The disability progresses significantly throughout the disease course, culminating in death within 5–12 years of the onset of symptoms [3,4]. The current treatments only provide symptomatic relief without mitigating disease progression. Thus, there are a growing number of studies focusing on potential therapeutic agents to combat AD more directly [5,6,7]. Most of these studies are focused on two main pathological hallmarks of AD: senile plaques (SPs) composed of amyloid beta (Aβ) peptides; and neurofibrillary tangles (NFTs) composed of hyperphosphorylated tau proteins [3,4,5,8]. Although results of clinical trials have been underwhelming for the past 25 years, recently an anti-amyloid β antibody, Aducanumab, received an accelerated FDA approval, requiring further clinical trials to confirm the estimated efficacy [1]. Repeated failure in clinical trials has challenged our understanding of this multifactorial disease, leading to recent studies concentrating on advancing our knowledge of the underlying mechanisms of AD pathogenesis to find druggable targets.
High-throughput ‘omics’-based research including genomics, transcriptomics and proteomics has made a significant contribution to our current understanding of AD [9,10,11]. However, currently the biological data are generated at a higher pace than they are being interpreted. Thus, there is an urgent need to summarize and extract new knowledge from the existing data. We have used meta-analysis to summarize and extract the most reliable data from existing results of multiple studies, taking advantage of the increased statistical power of larger combined sample sizes [12,13]. Several meta-analyses have been performed on microarray gene expression datasets of different brain regions to identify altered pathways involved in AD, as brain regions are differentially affected by AD during the course of disease progression [12,14]. The hippocampus is one of the earliest brain regions to be affected and thus most studies have been aimed at this region. However, data from the other regions, especially those that are less affected by AD such as the cerebellum, are not well-studied and are sometimes even excluded from meta-analyses [15,16]. Exploring these changes in less affected brain regions may open new avenues to enhance the molecular understanding of AD pathogenesis and may reveal key disease mechanism in affected brain regions [17]. Therefore, in this study we have combined multiple gene expression datasets from five brain regions including the hippocampus, cerebellum, frontal, entorhinal and temporal cortices of AD patients and healthy controls, and used robust rank aggregation (RRA) meta-analysis to find robust differentially expressed genes (DEGs) between AD cases and healthy controls. We further investigated enriched pathways, related miRNAs and transcription factors of these DEGs.

2. Materials and Methods

2.1. Search Strategy

A comprehensive search was performed through the National Center for Biotechnology Information (NCBI) Gene Expression Omnibus (GEO) datasets (https://0-www-ncbi-nlm-nih-gov.brum.beds.ac.uk/geo/, accessed on 25 March 2021) to identify eligible data from inception to March 2021. The following key words were used: “Alzheimer”, “hippocampi”, “hippocampus”, “entorhinal”, “temporal”, “frontal” and “cerebellum”, then three filters including ‘Homo sapiens’, ‘Series’ and ‘Expression profiling by array’ were applied. In addition, references of all included studies were screened to find other relevant studies.

2.2. Dataset Selection

Datasets were included in our study if they met the following inclusion criteria: (1) dataset was original; (2) reported gene expression in hippocampus, cerebellum, frontal, entorhinal and temporal cortices of AD patients; (3) reported gene expression datasets for both cases and controls; (4) when the same authors published two or more datasets possibly using same data or re-analyzed pre-existing datasets, we used the most comprehensive dataset. GEO2R tool was used to analyze datasets and extract differentially expressed genes (DEGs) between AD cases and healthy controls. DEGs with adjusted p-value less than 0.05 were considered significant.

2.3. Integrated Genomic Analysis

Herein, we utilized the R package RRA to integrate microarray datasets downloaded from the GEO database and identify robust DEGs. The RRA method generates a relevant list from input lists even if they are incomplete. Robust DEGs with a Bonferroni-corrected p-value less than 0.05 were considered statistically significant.

2.4. Pathway Analysis

To identify relevant pathways, two lists of down- and up-regulated robust DEGs were submitted separately in Enrichr, a web-based tool for comprehensive gene set enrichment analysis (https://maayanlab.cloud/Enrichr/, accessed on 16 July 2021) [18]. KEGG (Kyoto Encyclopedia of Genes and Genomes) pathway was then used to find the enriched pathways from the submitted robust DEGs. Pathways with an adjusted p-value less than 0.05 were considered statistically significant.

2.5. Protein–Protein Interaction Analysis

Protein–protein interaction (PPI) networks were analyzed using Cytoscape string App plugin with the confidence score > 0.05 as previously described [19]. Briefly, differentially expressed genes were loaded into Cytoscape, and the Homo sapiens database in the StringDB was selected to reveal the protein interaction between differentially expressed proteins. In addition, hub genes within the protein network were identified using CytoHubba, a plugin within Cytoscape, based on the Maximal Clique Centrality (MCC) algorithm.

2.6. Gene–miRNA Interaction Analysis

The gene–miRNA interaction analysis was carried out in NetworkAnalyst (https://www.networkanalyst.ca/, accessed on 10 November 2021) [20], which uses collected data of validated miRNA-gene interaction from TarBase and miRTarBase [21,22]. Related miRNAs were obtained from both of these databases and common miRNAs were obtained using a Venn diagram analysis (http://bioinformatics.psb.ugent.be/webtools/Venn/, accessed on 10 November 2021). The miRNAs were then ranked using network topology measurements including degree and betweenness centrality, and the top five interactions were reported.

2.7. Gene-Transcription Factors Interaction Analysis

Gene-transcription factor interactions were discerned using NetworkAnalyst. Official gene symbols were submitted and related TFs were explored from three sources including Encyclopedia of DNA Elements (ENCODE) ChIP-seq data, ChIP Enrichment Analysis (ChEA) and the JASPAR database [23,24,25]. Common TFs between these three datasets were obtained using a Venn diagram analysis, and these common TFs were ranked based on network topology measurements including degree and betweenness centrality, and the top five interactions were reported.

3. Results

3.1. Search Results and Characteristics of Selected Studies

The initial search through GEO yielded 37 datasets, of which 10 datasets including 820 AD cases and 626 healthy controls met the eligibility criteria and were included in our study. The basic characteristics of the included studies are given in Table 1. There were seven datasets for the frontal cortex (GSE118553, GSE48350, GSE5281, GSE33000, GSE44770, GSE36980, GSE122063), five datasets for the temporal cortex (GSE118553, GSE5281, GSE36980, GSE122063, GSE132903), four datasets for the hippocampus (GSE48350, GSE5281, GSE36980, GSE29378), three datasets for the entorhinal cortex (GSE118553, GSE48350, GSE5281), and two datasets for the cerebellum (GSE118553, GSE44768).
Table 1. Characteristics of the selected datasets based on the criteria of this study.
DatasetsCountryNumber of AD/CTRAge (years) AD/CTRPostmortem Interval (h) AD/CTRBrain Region (s)Reference
GSE118553UK52/2782.9 ± 8.7/70.6 ± 15.939.9 ± 21.3/
37.1 ± 20.7
Cerebellum/Entorhinal/Frontal/Temporal[26]
GSE44768USA129/101--Cerebellum[27]
GSE48350USA15/3985.7 ± 6.3/64.8 ± 9.5-Entorhinal/Frontal/Hippocampus[28]
GSE5281USA33/1479.9 ± 6.9/79.8 ± 9.12.5/2.5Entorhinal/Frontal/Temporal/Hippocampus[29,30]
GSE33000USA310/15780.6 ± 9.0/63.5 ± 9.913.7 ± 7.4/22.4 ± 5.8Frontal[31]
GSE44770USA129/101--Frontal[27]
GSE36980Japan26/6283.0 ± 5.7-Frontal/Temporal/Hippocampus[32,33]
GSE122063USA12/1180.9 ± 7.4/78.6 ± 8.58.0 ± 4.0/
9.0 ± 3.0
Frontal/Temporal[34]
GSE132903USA97/9885.02 ± 6.75/84.98 ± 6.90-Temporal[35]
GSE29378USA17/1677.3 ± 9.1/81.7 ± 6.911.2 ± 6.3/10.8 ± 6.8Hippocampus[36]

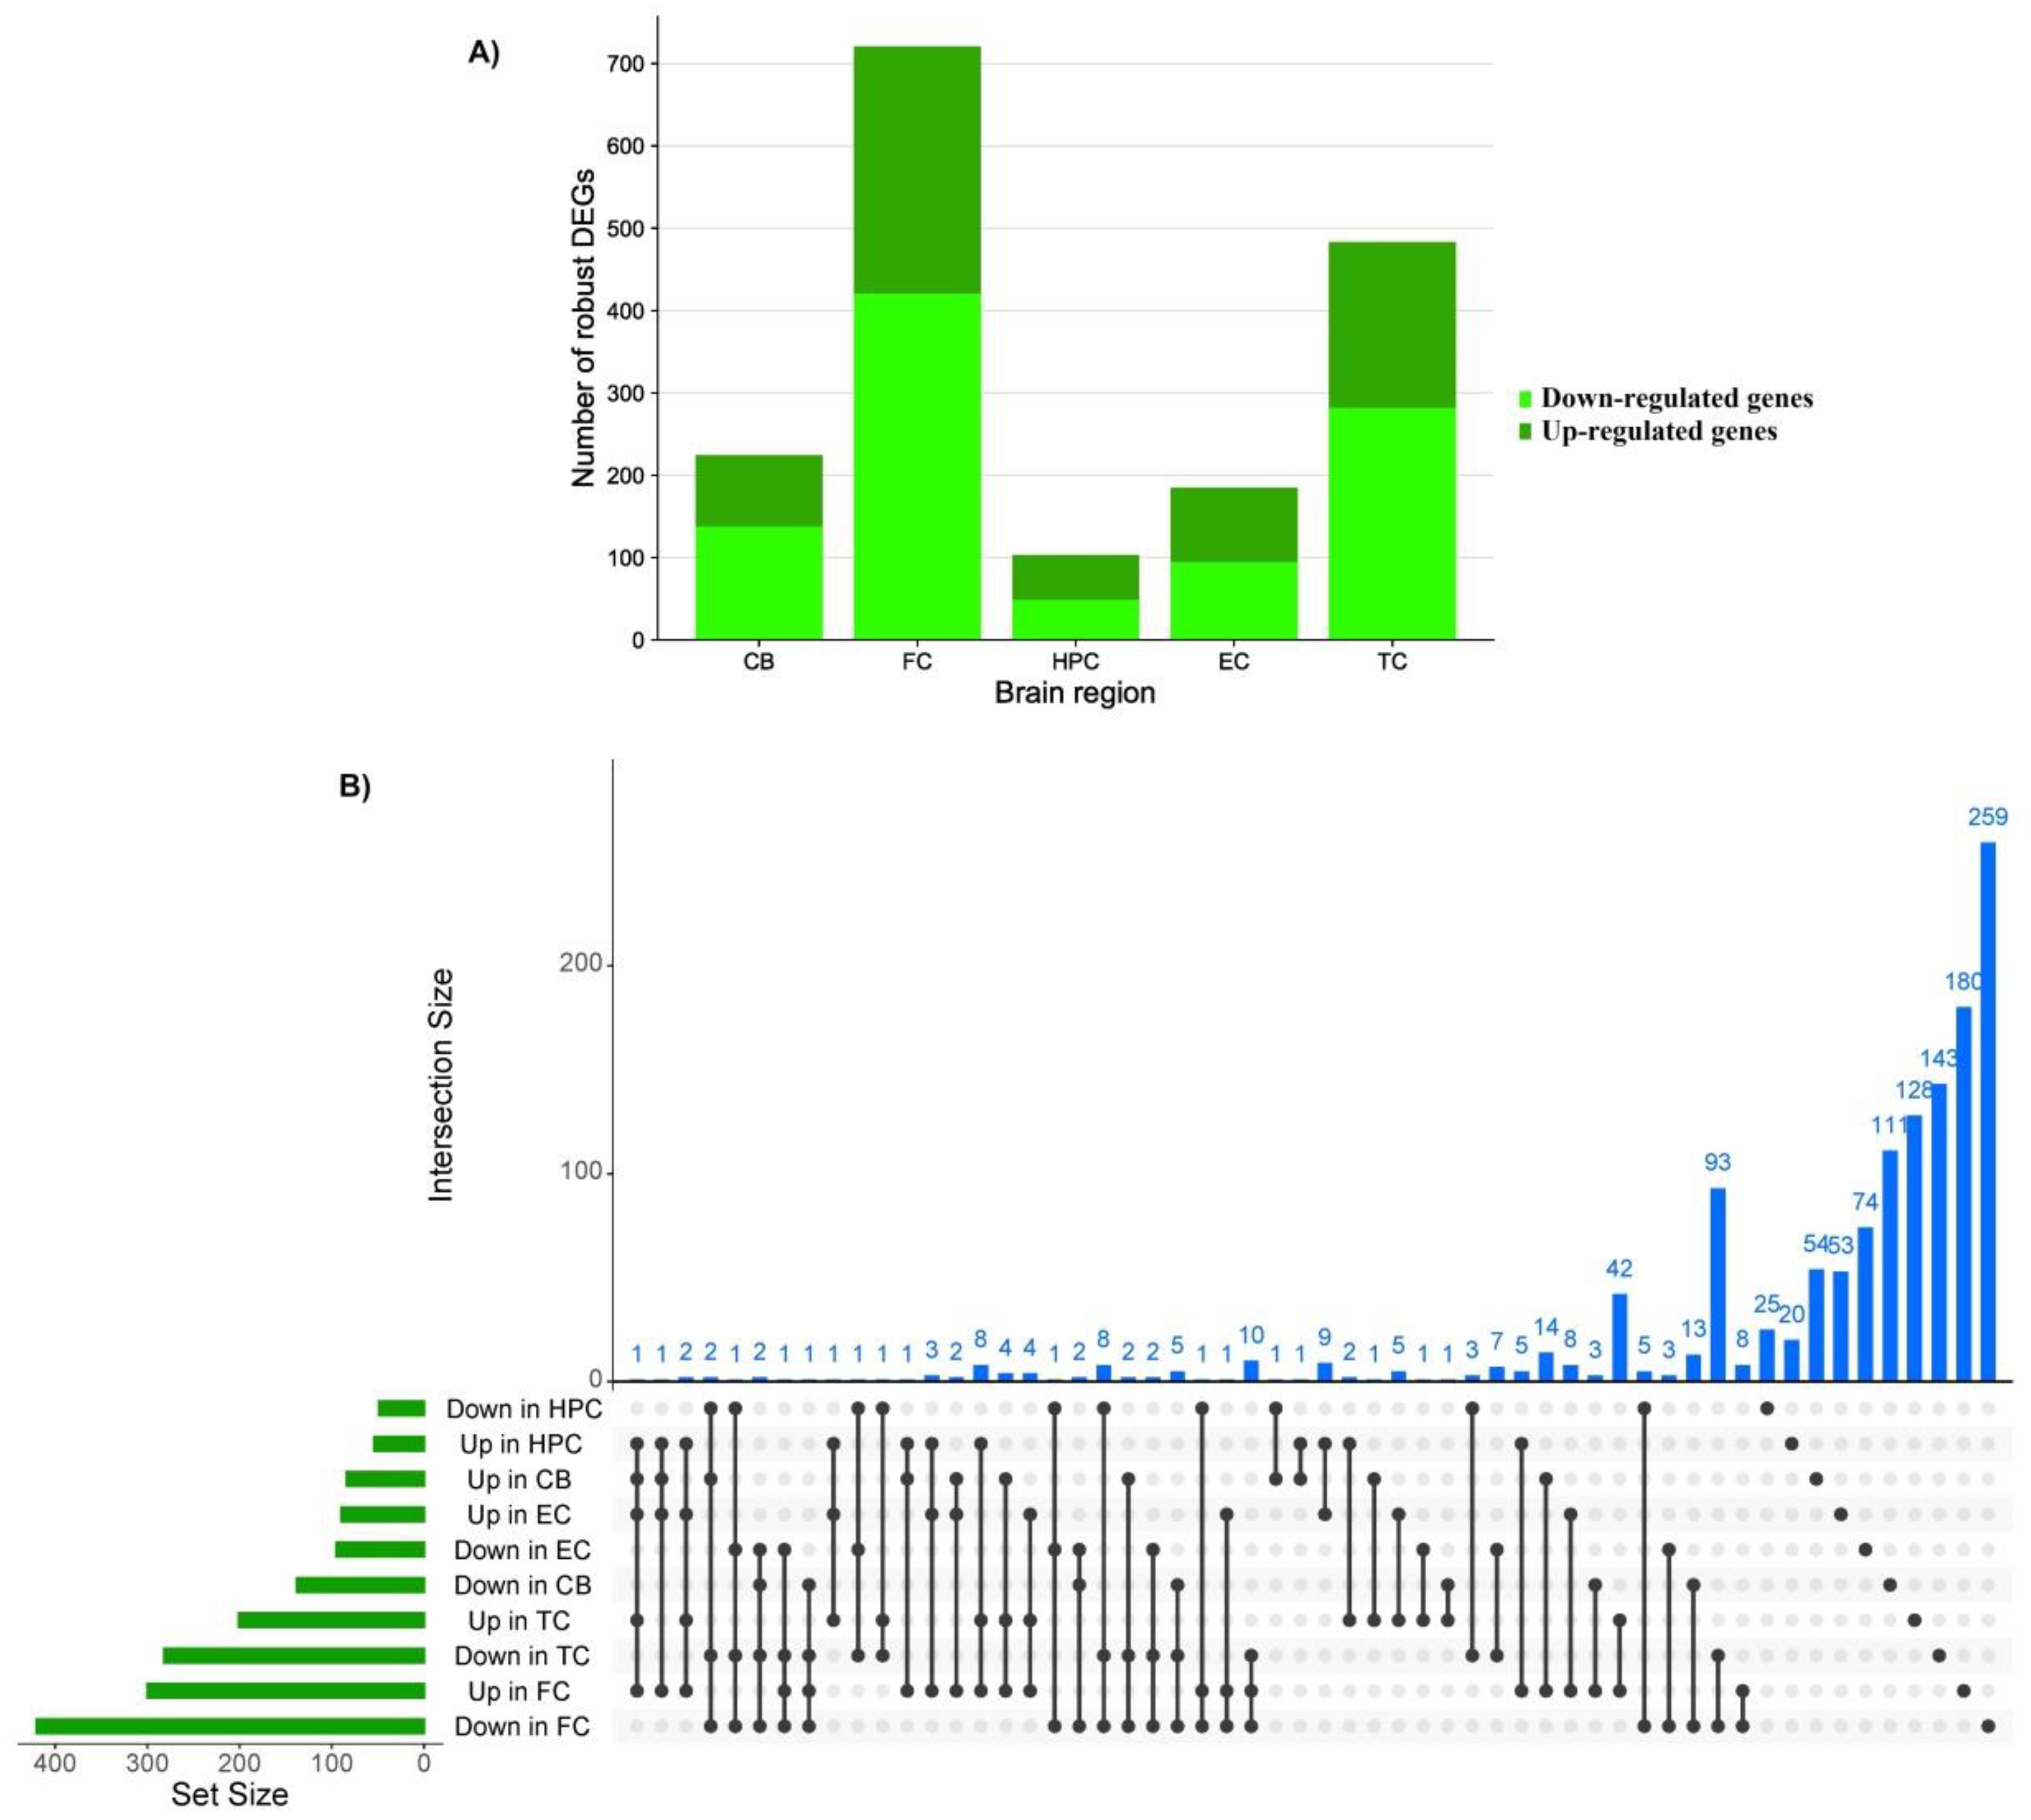
3.2. Robust Differentially Expressed Genes

DEGs in each brain region were extracted from GEO using the GEO2R tool based on the limma R package (p-value < 0.05). In the next step the RRA R package was used to identify the robust DEGs [37]. This process identified a total of 1713 robust DEGs. The numbers of down- and up-regulated robust DEGs in each tissue were, respectively, 138 and 84 in the cerebellum, 420 and 300 in the frontal cortex, 49 and 54 in the hippocampus, 95 and 90 in the entorhinal cortex, and 282 and 201 in the temporal cortex. Interestingly, Serpin Family A Member 3 (SERPINA3) was up-regulated in all brain regions and none of the robust down-regulated genes were shared between all brain regions (Figure 1 and Supplementary File 1). The full list of robust DEGs and their scores can be found in the Supplementary File 1.

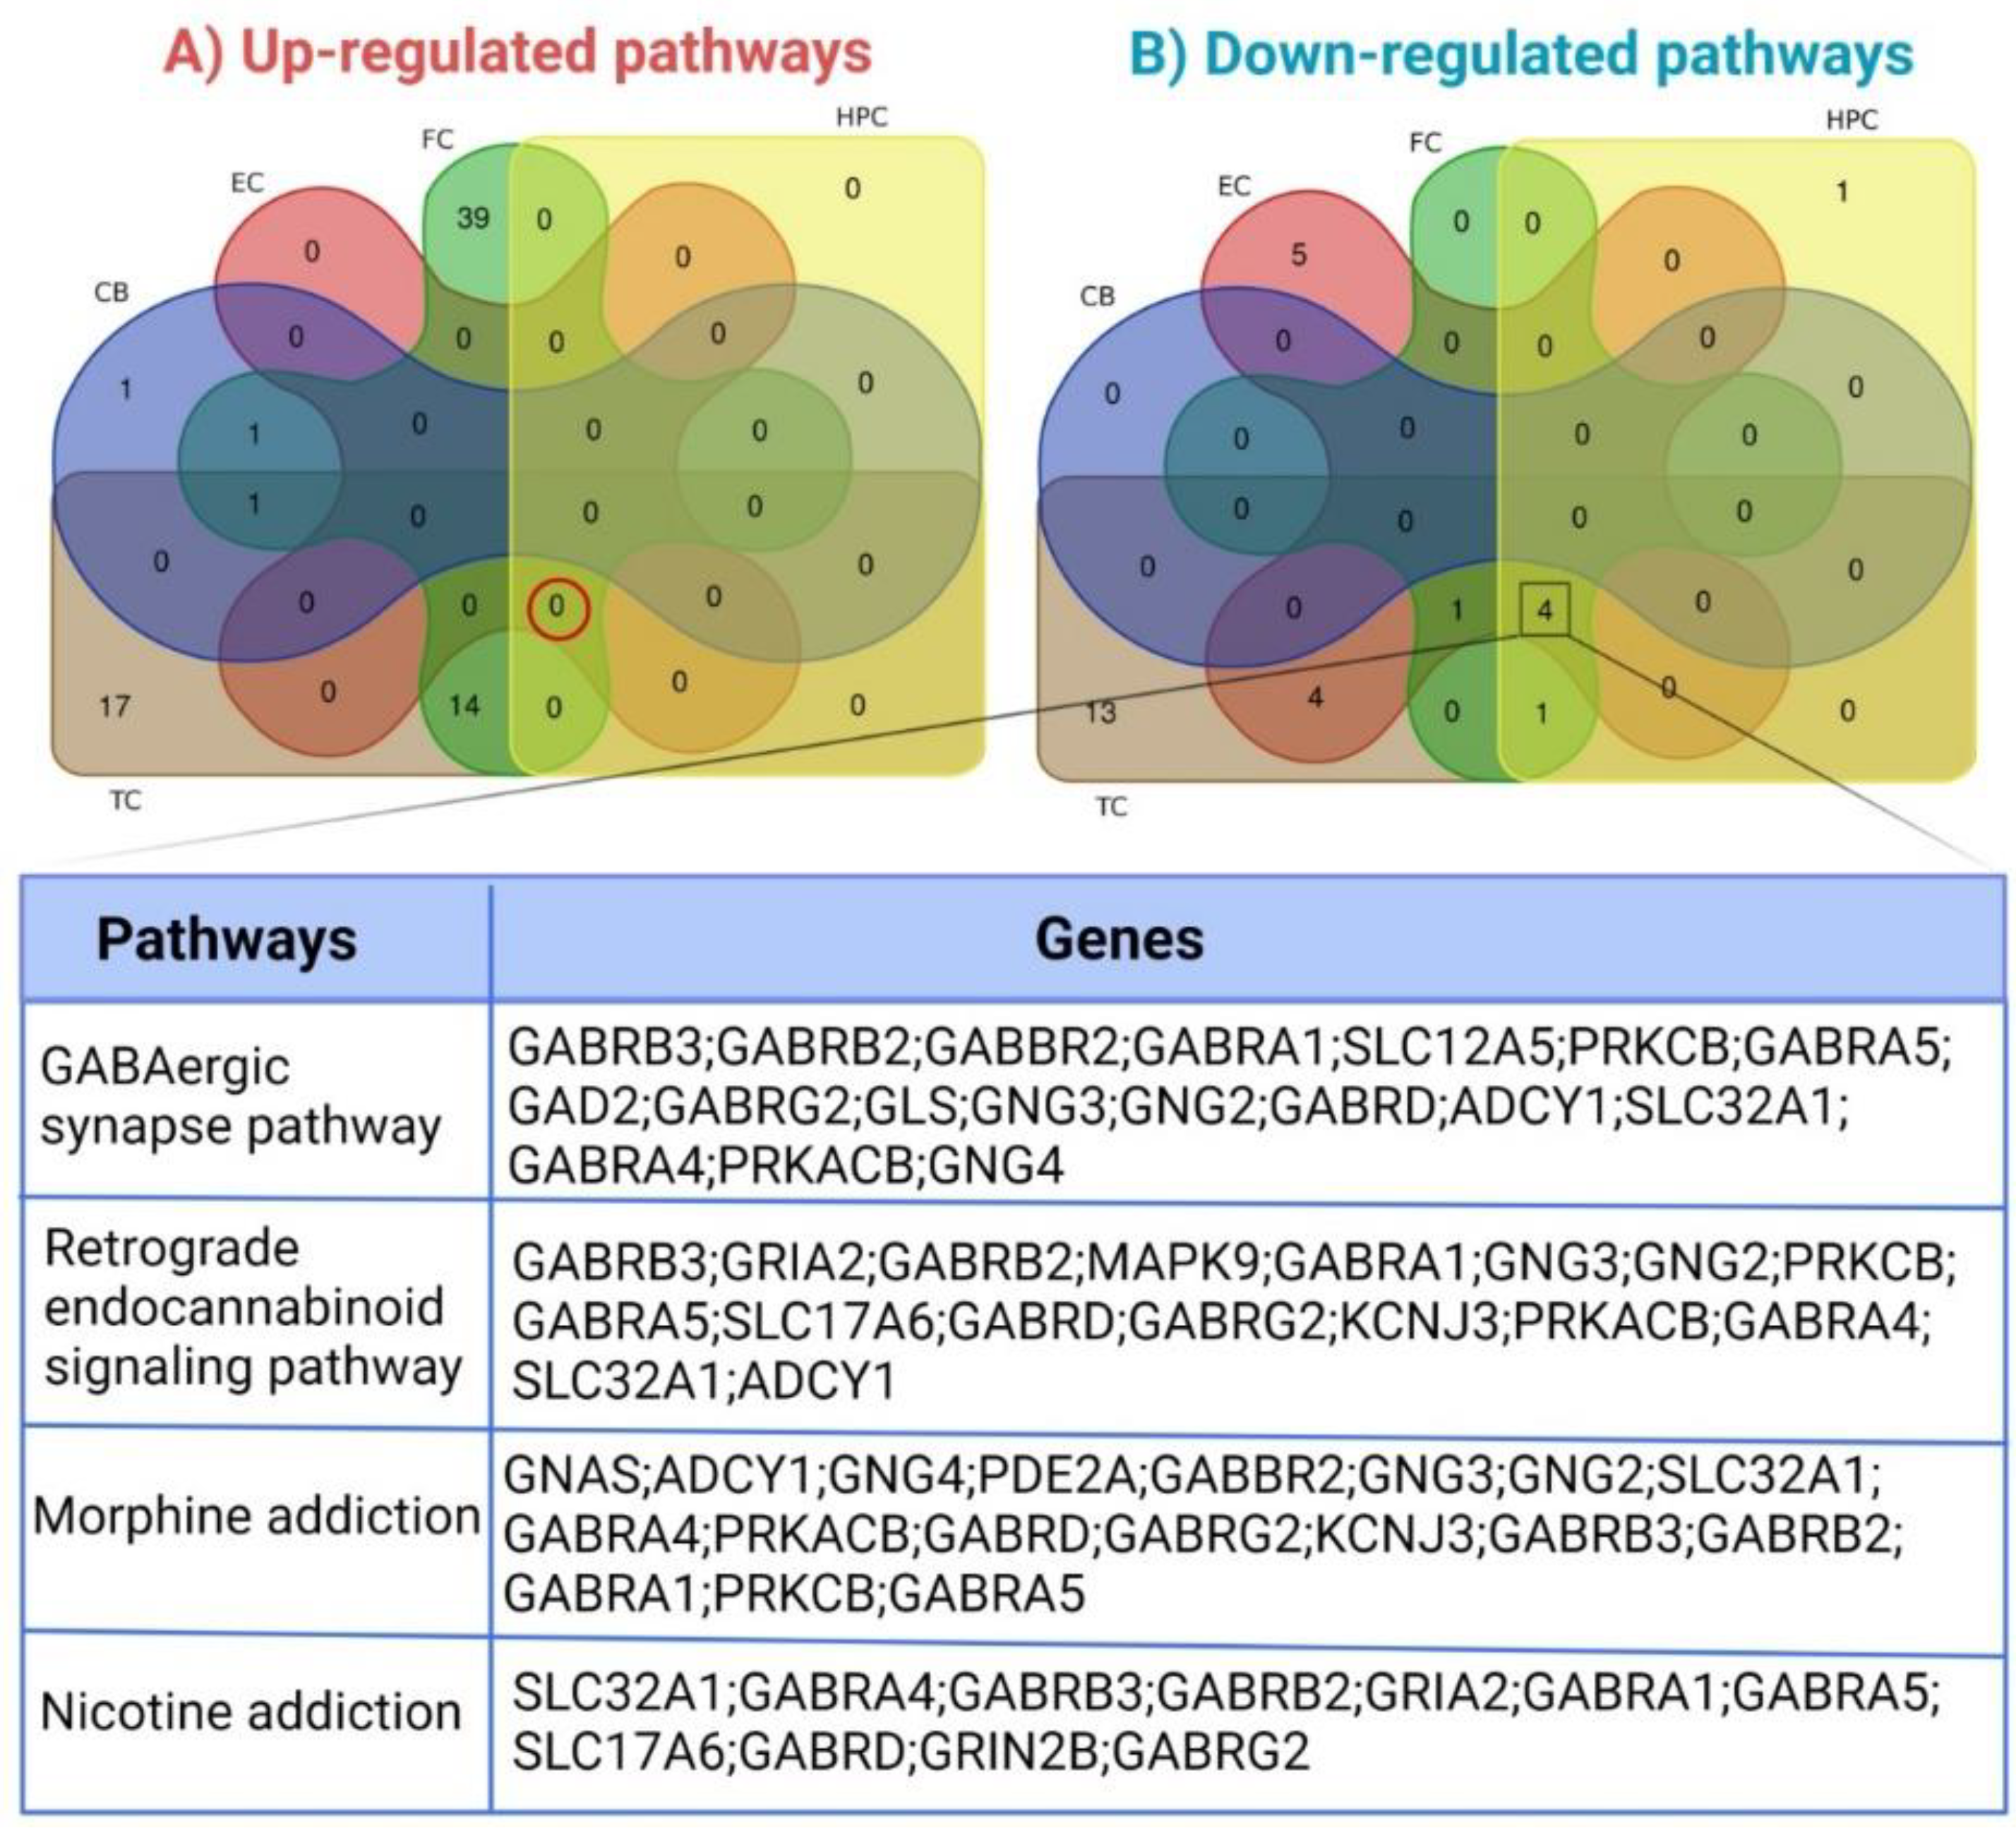
3.3. Pathways Enriched by Differentially Expressed Genes

Enrichr and subsequently KEGG were used to predict pathways enriched separately by down- and up-regulated robust DEGs, and the pathways with an adjusted p-value of less than 0.05 were considered statistically significant. The top three enriched pathways in each brain region are provided in Table 2. Interestingly, based on adjusted p-value, the GABAergic synapse pathway, enriched by 18 robust DEGs, and the retrograde endocannabinoid signaling pathway, enriched by 17 robust DEGS, were meaningful pathways that were significantly down-regulated in all brain regions except the cerebellum (Figure 2), which is known to be less affected by AD. In addition, temporal and frontal cortices showed a higher number of altered pathways. A full list of enriched pathways for each brain region is provided in Supplementary File 2.

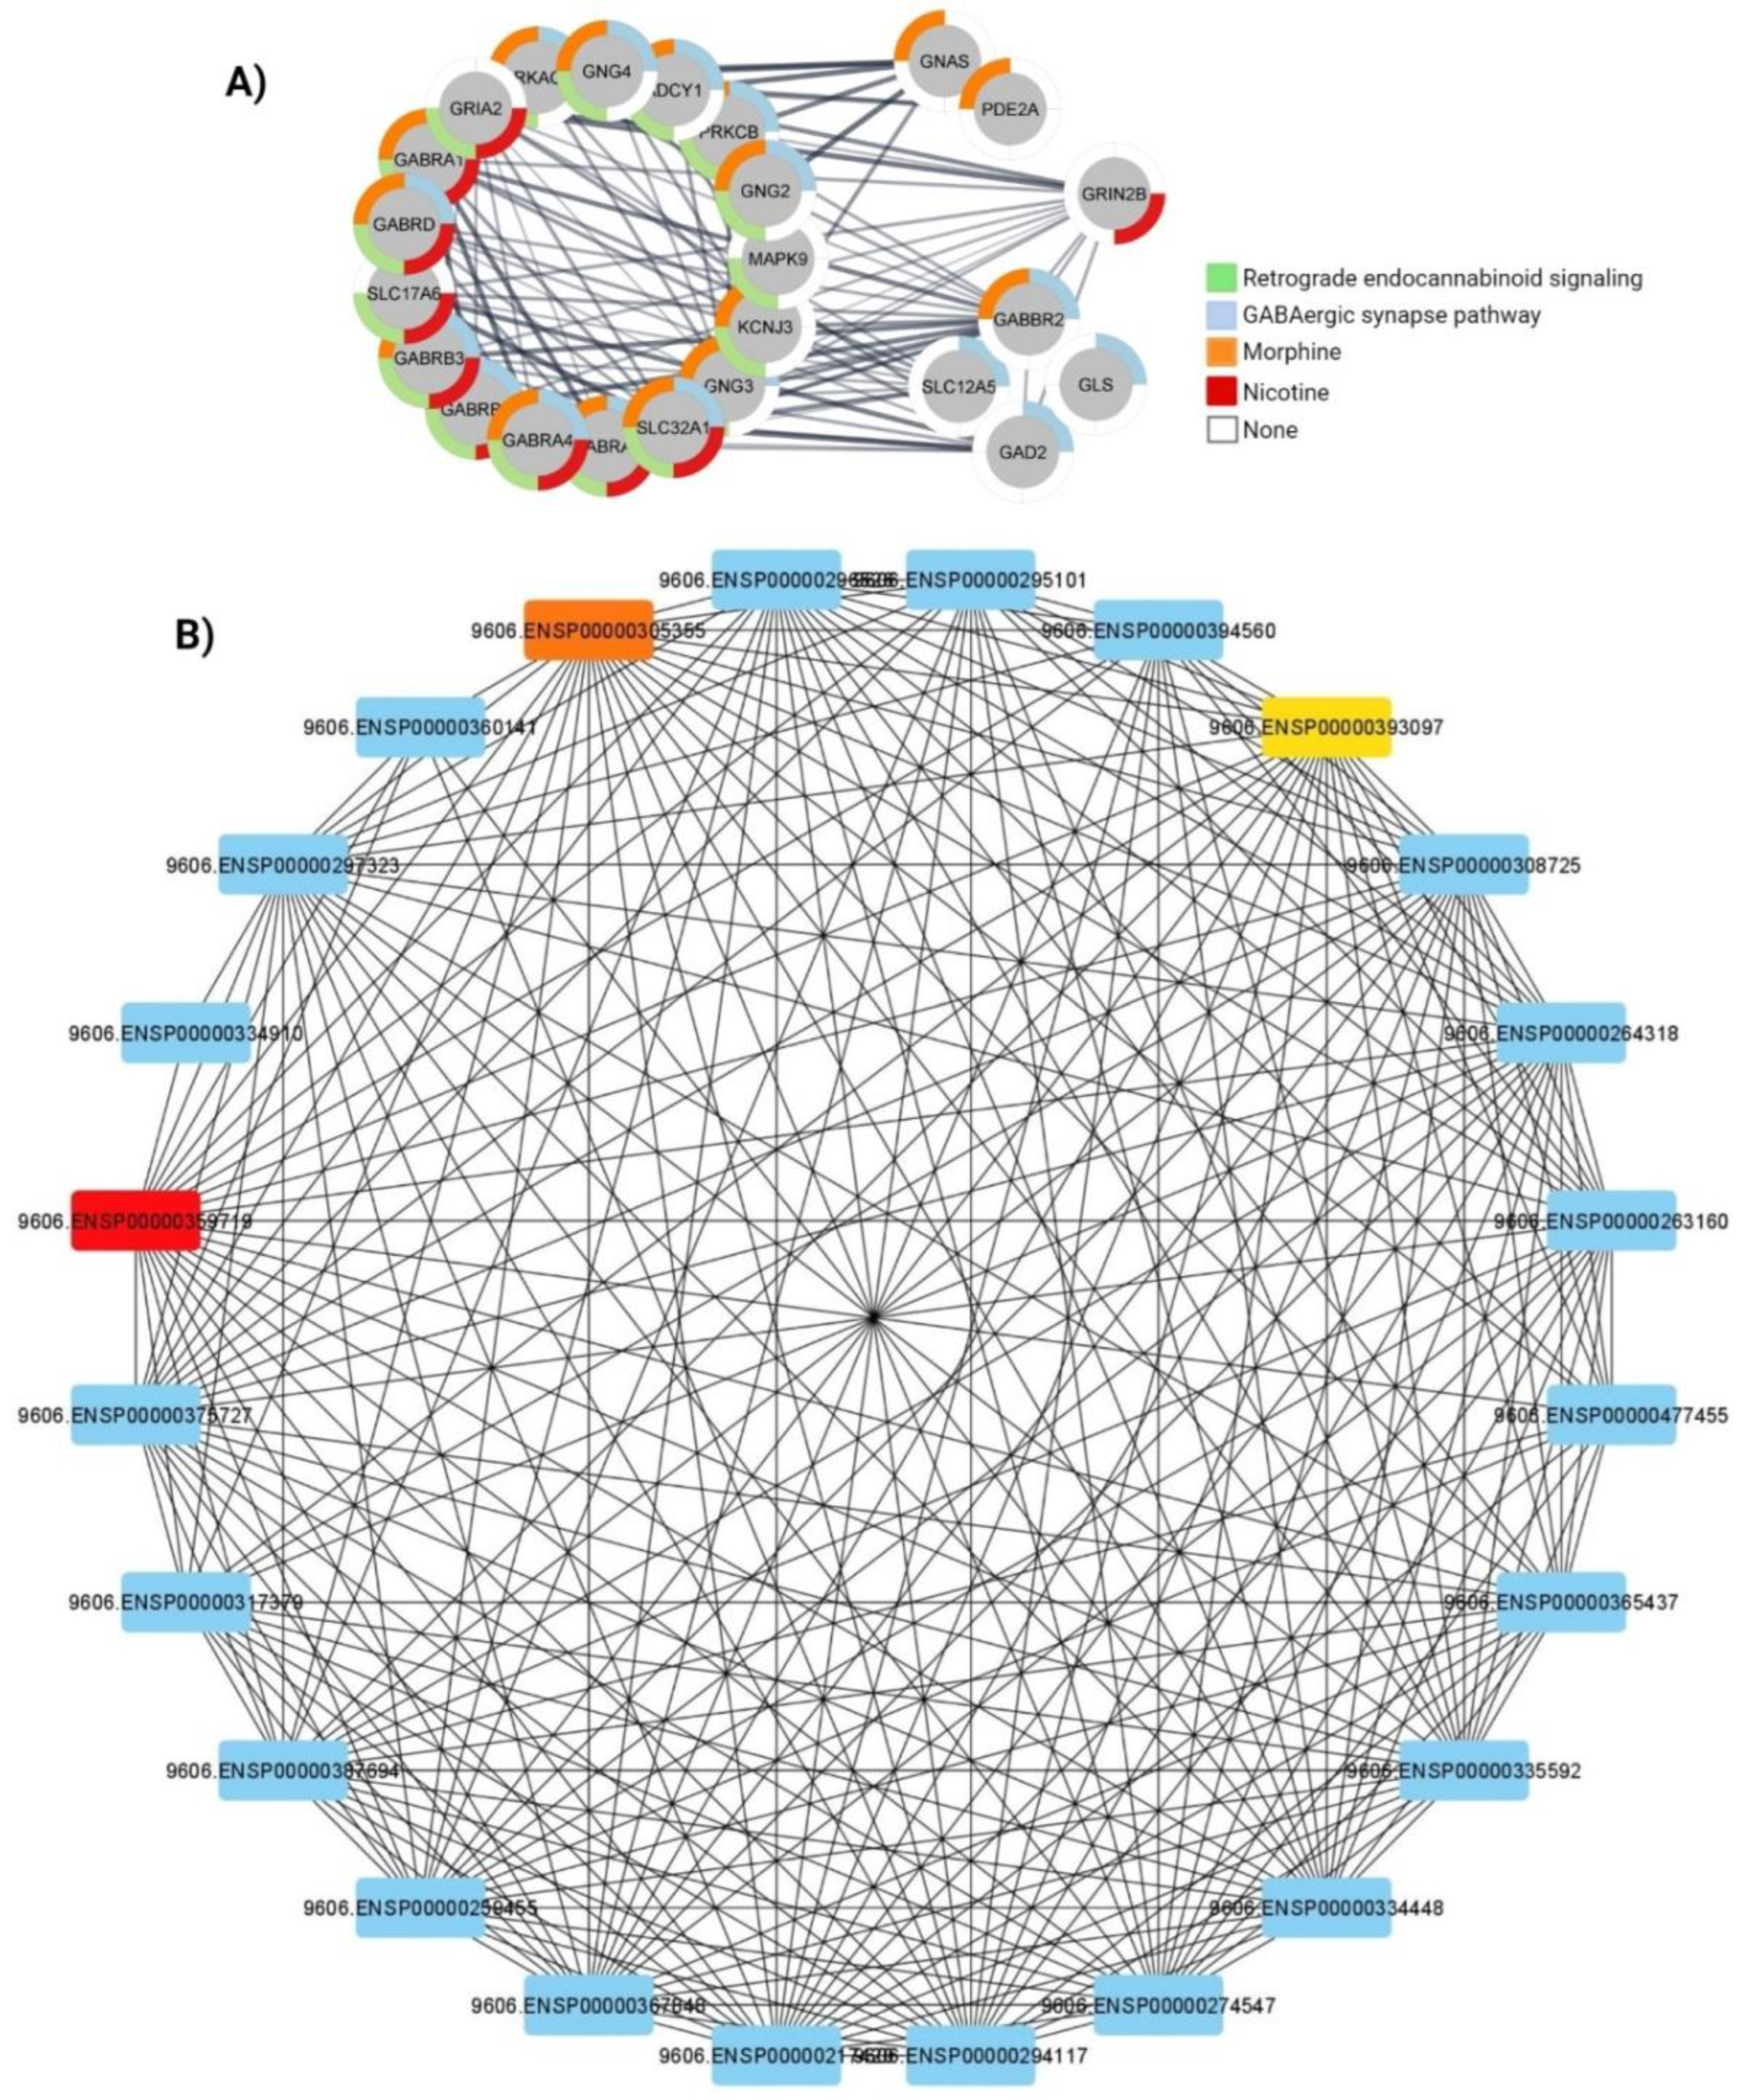
3.4. Protein-Protein Interaction Analysis

PPI network between down regulated genes in common pathways including GABAergic synapse pathway, retrograde endocannabinoid signaling, morphine and nicotine addiction-related pathways were retrieved using the Cytoscape stringApp plug-in. Furthermore PRKACB, PRKCB and GABRA1 found as the top three hub genes through CytoHubba and based on the MCC algorithm (Figure 3).

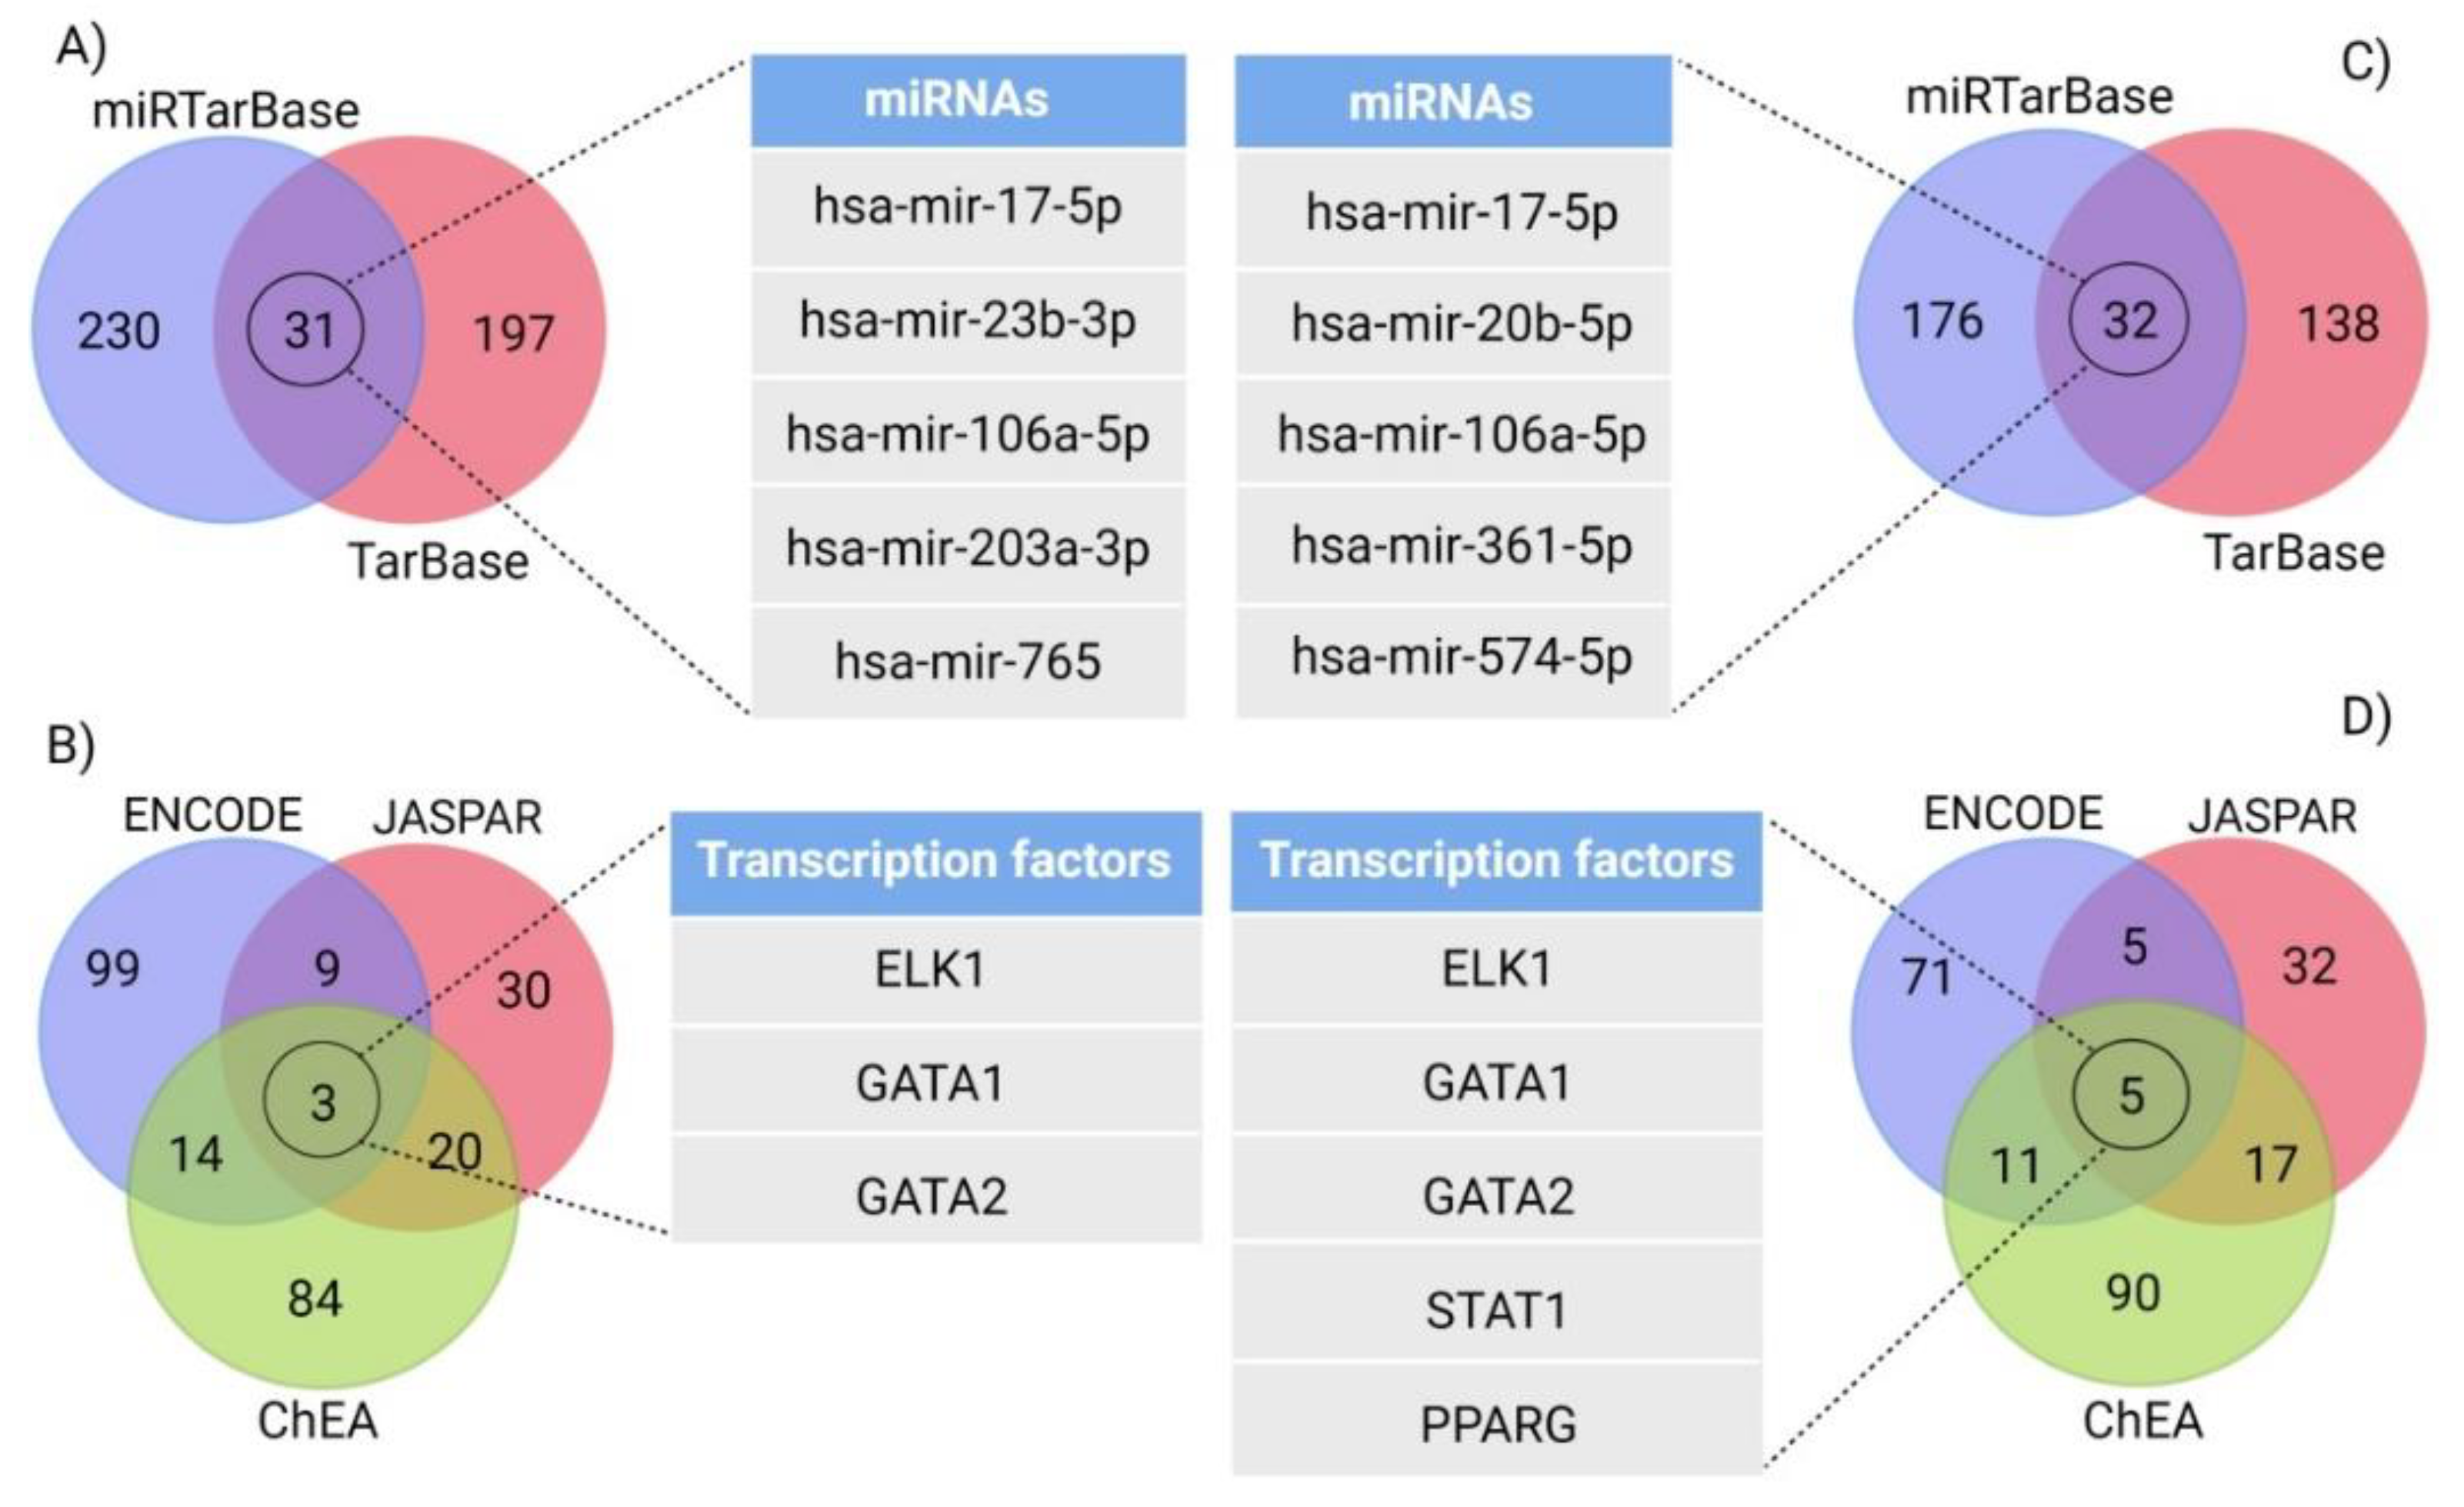
3.5. Gene–miRNA Interaction and Targeting miRNA Analysis

TarBase, miRTarBase and miRecords databases in NetworkAnalyst were used to indicate miRNAs interacting with the GABAergic synapse pathway and the retrograde endocannabinoid signaling pathway down-regulated genes, which returned 458 and 346 miRNAs respectively. There were 31 and 32 miRNAs common among all the databases for DEGs involved in the GABAergic synapse pathway and the retrograde endocannabinoid signaling pathway, respectively, and these were ranked based on network topology measurements including degree and betweenness centrality. The top five miRNAs are shown in Figure 4, and the top three miRNAs that were shared between the GABAergic synapse pathway and the retrograde endocannabinoid signaling pathway are provided in Table 3.

3.6. Gene–Transcription Factors Interaction Analysis

Gene-transcription factors (TFs) interaction analysis was performed in NetworkAnalyst, in order to identify upstream regulators of the down-regulated robust DEGs involved in the GABAergic synapse pathway and the retrograde endocannabinoid signaling pathway. All transcription factors from the three different databases (ENCODE, ChEA and JASPAR) were extracted in NetworkAnalyst. Comparison of the identified TFs from these databases using a Venn diagram analysis yielded 3 shared TFs in the GABAergic synapse pathway and 5 TFs in the retrograde endocannabinoid signaling pathway (Figure 4). The top three TFs that were shared between the GABAergic synapse pathway and the retrograde endocannabinoid signaling pathway are shown in Table 3.

4. Discussion

In this study, ten microarray gene expression datasets available in the public domain were analyzed using an integrated genomic approach. The datasets comprised 1446 brain samples from five brain regions, including the hippocampus, cerebellum, frontal, entorhinal and temporal cortices. Between the AD cases and the healthy controls, 1713 robust DEGs were identified, showing different dysregulated pathways in these brain regions. The down-regulation of the GABAergic synapse pathway and the retrograde endocannabinoid signaling pathway was common among the hippocampus, frontal, entorhinal and temporal cortices, all of which have been shown to be more impacted by AD, compared to the cerebellum.
A balance between neural excitation and inhibition is vital to proper brain function and its disruption contributes to several neuronal disorders such as AD. The down-regulation of the GABAergic synapse pathway and the decreased levels of Gamma-aminobutyric acid (GABA) in the hippocampus, frontal, entorhinal and temporal cortices found in this study have also been reported in other human and mice AD studies [35,36]. GABA is the main inhibitory neurotransmitter within the mammalian central nervous system [38]. A decreased level of GABA receptor subunits such as GABRA1, GABRA5, GABRB1, GABRB2, GABRB3, GABRG1, GABRG2 and GABRG3 have been observed at the transcriptional and protein levels in the hippocampus of AD patients [39,40,41,42,43].
However, in contrast to these results, the expression of another GABA receptor named GABRA6 was increased in cultured rat cerebellar granule neurons following treatment with amyloid beta (Aβ), one of the main pathological hallmark proteins implicated in AD [43,44]. Studies in both mice and humans have reported that the presence of Aβ can decrease the numbers and activity of GABA inhibitory interneurons, leading to impaired synaptic transmission and disrupted neural network activity, and resulting in cognitive impairment [45]. Interestingly, transplantation of GABA progenitor neurons into the hippocampus of mice overexpressing Aβ restored normal learning and memory [46].
Furthermore, the accumulation of phosphorylated tau (p-tau), another pathological hallmark protein of AD, in the hippocampus reduced extracellular GABA level and led to tau-induced anxiety in mice. In addition, p-tau accumulation in GABAergic interneurons in the dentate gyrus of AD patients and mice also caused disruption of GABAergic transmission [47,48]. This means that the GABAergic synapse pathway is down-regulated in AD, although there are some conflicting results from mice models [43]. However, AD has a complex neuropathological basis and mice models may not accurately represent underlying pathological events of AD in humans.
Another common down-regulated pathway between the AD sensitive brain regions was the retrograde endocannabinoid signaling pathway. The endocannabinoid system (ECS) is comprised of endocannabinoids (eCBs) that are endogenous lipid-based neurotransmitters, along with their receptors such as cannabinoid receptor 1 (CB1R) and cannabinoid receptor 2 (CB2R), and the enzymes that are involved in their synthesis and degradation [49]. Arachidonoyl ethanolamide (anandamide or AEA) and 2-arachidonoylglycerol (2-AG) are the two main endocannabinoids [49]. ECS plays a vital role in the central nervous system function and in the regulation of the endocrine and immune systems [50,51]. Endocannabinoid-mediated retrograde signaling was first reported in 2001, where eCBs were shown to mediate a type of short-term synaptic plasticity known as depolarization-induced suppression of inhibition (DSI)/excitation (DSE) [52,53]. Later, the effect of eCBs on long-term depression (eCB-LTD) on both excitatory and inhibitory synapses was also observed [54]. Although the alteration of ECS components in AD animal models has remained controversial and mostly unchanged levels of these components in the hippocampus have been reported, beneficial effects of CB1R activation via exogenous cannabinoids has been observed against Aβ-induced neurotoxicity, particularly microglia activation in several cell models [54,55,56]. Moreover, eCBs have anti-inflammatory and neuroprotective properties, and since neuroinflammation is a key driver of neurodegenerative diseases such as AD, restoration of dysregulated ECS has emerged as a promising therapeutic option [55].
Interestingly, the down-regulation of retrograde endocannabinoid signaling also has been observed in a meta-analysis of gene expression data from patients with mild cognitive impairment (MCI) [57]. MCI patients are at a higher risk of developing AD as MCI is considered an early stage of AD. Thus, the molecular changes in the respective brain regions of MCI patients may represent early changes that mediate the development of AD [57,58]. The down-regulation of the retrograde endocannabinoid system in MCI patients, and in the four AD sensitive brain regions but not in the cerebellum of AD patients, highlighted dysregulation of this pathway as an early and key change in AD development. As such, this can be a promising therapeutic target for early intervention against AD progression.
The miRNAs and TFs that interact with robust DEGs in the GABAergic synapse pathway and in retrograde endocannabinoid signaling were also investigated here. Among the identified miRNAs, hsa-mir-17-5p, hsa-mir-106a-5p and hsa-mir-373-3p were found to interact with robust DEGs of both pathways. Recently, the elevated levels of hsa-mir-17-5p have been reported in the human AD brain and the microglia of AD mice models, coupled with the down-regulation of autophagy markers, that consequently impaired Aβ clearance [59]. In contrast to our results, decreased serum level of hsa-mir-106a-5p has previously been observed in AD patients [60].
However, recent studies have reported that hsa-mir-106a-5p decreased the level of VEGFA, which plays a protective role against cognitive impairment in AD patients, and its level is decreased in AD patients [61,62]. Therefore, the increased level of hsa-mir-106a-5p in AD patients may be involved in cognitive impairment, and thus its abundance may be altered in patients with mild cognitive impairment. No data is yet available in the published literature on the role of hsa-mir-373-3p in AD; however, a recent study indicated that hsa-mir-373-3p inhibits epithelial–mesenchymal transition in choriocarcinoma through targeting TGFβR2 [63]. Interestingly, the level of TGFβR2 in AD patients was shown to be about 50% lower than normal [64], therefore hsa-mir-373-3p may be associated with decreased level of TGFβR2 in AD patients. Collectively, there are limited data about these miRNAs and further studies are needed to establish their role in AD.
In order to investigate the upstream regulation of robust DEGs, TF analysis was performed. This returned the three TFs, ELK1, GATA1 and GATA2 that interact with robust DEGs involved in both the GABAergic synapse pathway and the retrograde endocannabinoid signaling pathway. ELK-1 belongs to the ternary complex factor (TCF) subfamily of ETS-domain TFs and its presence in diverse brain regions has been previously reported [65]. ELK-1 plays a dual role in neuronal function; while its expression is required for proper neuronal differentiation, overexpression and distinct phosphorylation of this TF is toxic for neuronal cells [66]. ELK-1 decreases expression of the presenilin 1 gene (PS1), which is involved in the proteolytic processing of the amyloid precursor protein (APP) and the generation of amyloidogenic Aβ, while, in turn, the presence of Aβ decreases ELK-1 activation and may derepress PS1 expression [66,67,68]. The other two identified TFs, GATA1 and GATA2, belong to the GATA family. Aberrant expression of GATA1 has been reported in AD patients previously, and has been shown to induce the expression of the β-amyloid precursor mRNA, and modulate γ-secretase activity. GATA1 may therefore be involved in the impairment of the synaptic plasticity and cognitive function [69,70]. GATA2, on the other hand, has been reported to play a key role in neuroglobin (NGB) activation, which has been shown to exhibit protective effects for neuronal cells in AD [71]. The expression of NGB is increased in early and moderate stages of AD but significantly decreased in advanced stages, which might be due to the decreased levels of GATA2 in the advanced stages of AD [72,73]. However, further studies are needed to evaluate this association. Interestingly, previous analysis of DEGs between the entorhinal cortex of AD patients and healthy controls also showed alteration of the retrograde endocannabinoid signaling pathway and predicted GATA1 and GATA2 as the upstream regulators of the identified DEGs in AD [74]. Our results here identified altered pathways in each brain region of AD patients and shared pathways between AD sensitive brain regions. Furthermore, our study also predicted miRNAs and TFs that interact with the DEGs involved in these shared pathways. However, experimental data about these regulators are limited and further studies are needed to reveal their role in AD pathogenesis.

5. Conclusions

In this study, we identified robust DEGs in different brain regions of AD patients and investigated enriched pathways using these genes. Our results suggested that the GABAergic synapse pathway and the retrograde endocannabinoid signaling pathway are two key pathways involved in AD pathogenesis, shared between all AD sensitive brain regions but not cerebellum. Further analyses revealed hsa-mir-17-5p, hsa-mir-106a-5p and hsa-mir-373-3p as potential miRNAs that may be involved in the down-regulation of these pathways. TF analysis further demonstrated ELK-1, GATA1 and GATA2 are upstream regulators of these pathways. Additional studies using large cohorts of AD patients are warranted to assess the potential therapeutic targets related to these pathways, and determine the miRNA and TFs involved in their regulation.

Supplementary Materials

The following supporting information can be downloaded at: https://0-www-mdpi-com.brum.beds.ac.uk/article/10.3390/cells11060987/s1, Supplementary File 1: RRA genes; Supplementary File 2: Enriched pathways.

Author Contributions

Conceptualization, M.M. and K.S.; methodology, M.A. and S.H.; data collection, N.T., S.H., M.H., A.A., M.J.F., V.G. (Veer Gupta), N.C.; software, M.A.; validation and formal analysis, M.A.; writing, M.A., N.C., S.H.; supervision and editing, M.M., K.S., V.G. (Vivek Gupta), G.H.S. and P.A.H.; funding, M.M. All authors have read and agreed to the published version of the manuscript.

Funding

The authors acknowledge support from the National Health and Medical Research Council (NHMRC) Australia, Ophthalmic Research Institute of Australia (ORIA), Perpetual Hillcrest Foundation and Macquarie University.

Institutional Review Board Statement

Not applicable.

Informed Consent Statement

Not applicable.

Conflicts of Interest

The authors declare no conflict of interest.

References

  1. Abyadeh, M.; Gupta, V.; Gupta, V.; Chitranshi, N.; Wu, Y.; Amirkhani, A.; Meyfour, A.; Sheriff, S.; Shen, T.; Dhiman, K. Comparative Analysis of Aducanumab, Zagotenemab and Pioglitazone as Targeted Treatment Strategies for Alzheimer’s Disease. Aging Dis. 2021, 12, 1964. [Google Scholar] [CrossRef] [PubMed]
  2. Abyadeh, M.; Djafarian, K.; Heydarinejad, F.; Alizadeh, S.; Shab-Bidar, S. Association between apolipoprotein E gene polymorphism and Alzheimer’s disease in an Iranian population: A meta-analysis. J. Mol. Neurosci. 2019, 69, 557–562. [Google Scholar] [CrossRef] [PubMed]
  3. Abyadeh, M.; Gupta, V.; Chitranshi, N.; Gupta, V.; Wu, Y.; Saks, D.; Wander Wall, R.; Fitzhenry, M.J.; Basavarajappa, D.; You, Y. Mitochondrial dysfunction in Alzheimer’s disease-a proteomics perspective. Expert Rev. Proteom. 2021, 18, 295–304. [Google Scholar] [CrossRef] [PubMed]
  4. Long, J.M.; Holtzman, D.M. Alzheimer disease: An update on pathobiology and treatment strategies. Cell 2019, 179, 312–339. [Google Scholar] [CrossRef]
  5. Chitranshi, N.; Kumar, A.; Sheriff, S.; Gupta, V.; Godinez, A.; Saks, D.; Sarkar, S.; Shen, T.; Mirzaei, M.; Basavarajappa, D. Identification of novel cathepsin B inhibitors with implications in Alzheimer’s disease: Computational refining and biochemical evaluation. Cells 2021, 10, 1946. [Google Scholar] [CrossRef]
  6. Mirzaei, M.; Deng, L.; Gupta, V.B.; Graham, S.; Gupta, V. Complement pathway in Alzheimer’s pathology and retinal neurodegenerative disorders–the road ahead. Neural Regen. Res. 2020, 15, 257. [Google Scholar] [CrossRef]
  7. Joseph, C.; Mangani, A.S.; Gupta, V.; Chitranshi, N.; Shen, T.; Dheer, Y.; Kb, D.; Mirzaei, M.; You, Y.; Graham, S.L. Cell cycle deficits in neurodegenerative disorders: Uncovering molecular mechanisms to drive innovative therapeutic development. Aging Dis. 2020, 11, 946. [Google Scholar] [CrossRef]
  8. Vosoughi, A.; Sadigh-Eteghad, S.; Ghorbani, M.; Shahmorad, S.; Farhoudi, M.; Rafi, M.A.; Omidi, Y. Mathematical models to shed light on amyloid-beta and tau protein dependent pathologies in Alzheimer’s disease. Neuroscience 2020, 424, 45–57. [Google Scholar] [CrossRef]
  9. Hampel, H.; Nisticò, R.; Seyfried, N.T.; Levey, A.I.; Modeste, E.; Lemercier, P.; Baldacci, F.; Toschi, N.; Garaci, F.; Perry, G. Omics Sciences for Systems Biology in Alzheimer’s Disease: State-of-the-Art of the Evidence. Ageing Res. Rev. 2021, 69, 101346. [Google Scholar] [CrossRef]
  10. Deng, L.; Gupta, V.K.; Wu, Y.; Pushpitha, K.; Chitranshi, N.; Gupta, V.B.; Fitzhenry, M.J.; Moghaddam, M.Z.; Karl, T.; Salekdeh, G.H. Mouse model of Alzheimer’s disease demonstrates differential effects of early disease pathology on various brain regions. Proteomics 2021, 21, 2000213. [Google Scholar] [CrossRef]
  11. Deng, L.; Haynes, P.A.; Wu, Y.; Amirkhani, A.; Kamath, K.S.; Wu, J.X.; Pushpitha, K.; Gupta, V.; Graham, S.; Gupta, V.K. Amyloid-beta peptide neurotoxicity in human neuronal cells is associated with modulation of insulin-like growth factor transport, lysosomal machinery and extracellular matrix receptor interactions. Neural Regen. Res. 2020, 15, 2131. [Google Scholar] [PubMed]
  12. Hosseinian, S.; Arefian, E.; Rakhsh-Khorshid, H.; Eivani, M.; Rezayof, A.; Pezeshk, H.; Marashi, S.-A. A meta-analysis of gene expression data highlights synaptic dysfunction in the hippocampus of brains with Alzheimer’s disease. Sci. Rep. 2020, 10, 8384. [Google Scholar] [CrossRef] [PubMed]
  13. Ceylan, H. Integrated Bioinformatics Analysis to Identify Alternative Therapeutic Targets for Alzheimer’s Disease: Insights from a Synaptic Machinery Perspective. J. Mol. Neurosci. 2021, 72, 273–286. [Google Scholar] [CrossRef] [PubMed]
  14. Li, X.; Long, J.; He, T.; Belshaw, R.; Scott, J. Integrated genomic approaches identify major pathways and upstream regulators in late onset Alzheimer’s disease. Sci. Rep. 2015, 5, 12393. [Google Scholar] [CrossRef] [PubMed] [Green Version]
  15. Noori, A.; Mezlini, A.M.; Hyman, B.T.; Serrano-Pozo, A.; Das, S. Systematic review and meta-analysis of human transcriptomics reveals neuroinflammation, deficient energy metabolism, and proteostasis failure across neurodegeneration. Neurobiol. Dis. 2021, 149, 105225. [Google Scholar] [CrossRef] [PubMed]
  16. Yan, T.; Ding, F.; Zhao, Y. Integrated identification of key genes and pathways in Alzheimer’s disease via comprehensive bioinformatical analyses. Hereditas 2019, 156, 25. [Google Scholar] [CrossRef]
  17. Guennewig, B.; Lim, J.; Marshall, L.; McCorkindale, A.N.; Paasila, P.J.; Patrick, E.; Kril, J.J.; Halliday, G.M.; Cooper, A.A.; Sutherland, G.T. Defining early changes in Alzheimer’s disease from RNA sequencing of brain regions differentially affected by pathology. Sci. Rep. 2021, 11, 4865. [Google Scholar] [CrossRef]
  18. Xie, Z.; Bailey, A.; Kuleshov, M.V.; Clarke, D.J.; Evangelista, J.E.; Jenkins, S.L.; Lachmann, A.; Wojciechowicz, M.L.; Kropiwnicki, E.; Jagodnik, K.M. Gene set knowledge discovery with Enrichr. Curr. Protoc. 2021, 1, e90. [Google Scholar] [CrossRef]
  19. Deng, L.; Pushpitha, K.; Joseph, C.; Gupta, V.; Rajput, R.; Chitranshi, N.; Dheer, Y.; Amirkhani, A.; Kamath, K.; Pascovici, D. Amyloid β induces early changes in the ribosomal machinery, cytoskeletal organization and oxidative phosphorylation in retinal photoreceptor cells. Front. Mol. Neurosci. 2019, 12, 24. [Google Scholar] [CrossRef]
  20. Zhou, G.; Soufan, O.; Ewald, J.; Hancock, R.E.; Basu, N.; Xia, J. NetworkAnalyst 3.0: A visual analytics platform for comprehensive gene expression profiling and meta-analysis. Nucleic Acids Res. 2019, 47, W234–W241. [Google Scholar] [CrossRef] [Green Version]
  21. Karagkouni, D.; Paraskevopoulou, M.D.; Chatzopoulos, S.; Vlachos, I.S.; Tastsoglou, S.; Kanellos, I.; Papadimitriou, D.; Kavakiotis, I.; Maniou, S.; Skoufos, G. DIANA-TarBase v8: A decade-long collection of experimentally supported miRNA–gene interactions. Nucleic Acids Res. 2018, 46, D239–D245. [Google Scholar] [CrossRef] [PubMed] [Green Version]
  22. Chou, C.-H.; Shrestha, S.; Yang, C.-D.; Chang, N.-W.; Lin, Y.-L.; Liao, K.-W.; Huang, W.-C.; Sun, T.-H.; Tu, S.-J.; Lee, W.-H. miRTarBase update 2018: A resource for experimentally validated microRNA-target interactions. Nucleic Acids Res. 2018, 46, D296–D302. [Google Scholar] [CrossRef] [PubMed]
  23. Consortium, E.P. A user’s guide to the encyclopedia of DNA elements (ENCODE). PLoS Biol. 2011, 9, e1001046. [Google Scholar]
  24. Lachmann, A.; Xu, H.; Krishnan, J.; Berger, S.I.; Mazloom, A.R.; Ma’ayan, A. ChEA: Transcription factor regulation inferred from integrating genome-wide ChIP-X experiments. Bioinformatics 2010, 26, 2438–2444. [Google Scholar] [CrossRef]
  25. Fornes, O.; Castro-Mondragon, J.A.; Khan, A.; Van der Lee, R.; Zhang, X.; Richmond, P.A.; Modi, B.P.; Correard, S.; Gheorghe, M.; Baranašić, D. JASPAR 2020: Update of the open-access database of transcription factor binding profiles. Nucleic Acids Res. 2020, 48, D87–D92. [Google Scholar] [CrossRef]
  26. Patel, H.; Hodges, A.K.; Curtis, C.; Lee, S.H.; Troakes, C.; Dobson, R.J.; Newhouse, S.J. Transcriptomic analysis of probable asymptomatic and symptomatic alzheimer brains. Brain Behav. Immun. 2019, 80, 644–656. [Google Scholar] [CrossRef]
  27. Zhang, B.; Gaiteri, C.; Bodea, L.-G.; Wang, Z.; McElwee, J.; Podtelezhnikov, A.A.; Zhang, C.; Xie, T.; Tran, L.; Dobrin, R. Integrated systems approach identifies genetic nodes and networks in late-onset Alzheimer’s disease. Cell 2013, 153, 707–720. [Google Scholar] [CrossRef] [Green Version]
  28. Berchtold, N.C.; Coleman, P.D.; Cribbs, D.H.; Rogers, J.; Gillen, D.L.; Cotman, C.W. Synaptic genes are extensively downregulated across multiple brain regions in normal human aging and Alzheimer’s disease. Neurobiol. Aging 2013, 34, 1653–1661. [Google Scholar] [CrossRef] [Green Version]
  29. Liang, W.S.; Dunckley, T.; Beach, T.G.; Grover, A.; Mastroeni, D.; Ramsey, K.; Caselli, R.J.; Kukull, W.A.; McKeel, D.; Morris, J.C. Altered neuronal gene expression in brain regions differentially affected by Alzheimer’s disease: A reference data set. Physiol. Genom. 2008, 33, 240–256. [Google Scholar] [CrossRef] [Green Version]
  30. Liang, W.S.; Dunckley, T.; Beach, T.G.; Grover, A.; Mastroeni, D.; Walker, D.G.; Caselli, R.J.; Kukull, W.A.; McKeel, D.; Morris, J.C. Gene expression profiles in anatomically and functionally distinct regions of the normal aged human brain. Physiol. Genom. 2007, 28, 311–322. [Google Scholar] [CrossRef]
  31. Narayanan, M.; Huynh, J.L.; Wang, K.; Yang, X.; Yoo, S.; McElwee, J.; Zhang, B.; Zhang, C.; Lamb, J.R.; Xie, T. Common dysregulation network in the human prefrontal cortex underlies two neurodegenerative diseases. Mol. Syst. Biol. 2014, 10, 743. [Google Scholar] [CrossRef] [PubMed]
  32. Ohara, T.; Ninomiya, T.; Kubo, M.; Hirakawa, Y.; Doi, Y.; Hata, J.; Iwaki, T.; Kanba, S.; Kiyohara, Y. Apolipoprotein genotype for prediction of Alzheimer’s disease in older Japanese: The Hisayama Study. J. Am. Geriatr. Soc. 2011, 59, 1074–1079. [Google Scholar] [CrossRef] [PubMed]
  33. Hokama, M.; Oka, S.; Leon, J.; Ninomiya, T.; Honda, H.; Sasaki, K.; Iwaki, T.; Ohara, T.; Sasaki, T.; LaFerla, F.M. Altered expression of diabetes-related genes in Alzheimer’s disease brains: The Hisayama study. Cereb. Cortex 2014, 24, 2476–2488. [Google Scholar] [CrossRef] [PubMed]
  34. McKay, E.C.; Beck, J.S.; Khoo, S.K.; Dykema, K.J.; Cottingham, S.L.; Winn, M.E.; Paulson, H.L.; Lieberman, A.P.; Counts, S.E. Peri-infarct upregulation of the oxytocin receptor in vascular dementia. J. Neuropathol. Exp. Neurol. 2019, 78, 436–452. [Google Scholar] [CrossRef] [PubMed]
  35. Piras, I.S.; Krate, J.; Delvaux, E.; Nolz, J.; Mastroeni, D.F.; Persico, A.M.; Jepsen, W.M.; Beach, T.G.; Huentelman, M.J.; Coleman, P.D. Transcriptome changes in the Alzheimer’s disease middle temporal gyrus: Importance of RNA metabolism and mitochondria-associated membrane genes. J. Alzheimer’s Dis. 2019, 70, 691–713. [Google Scholar] [CrossRef]
  36. Miller, J.A.; Woltjer, R.L.; Goodenbour, J.M.; Horvath, S.; Geschwind, D.H. Genes and pathways underlying regional and cell type changes in Alzheimer’s disease. Genome Med. 2013, 5, 48. [Google Scholar] [CrossRef] [Green Version]
  37. Kolde, R.; Laur, S.; Adler, P.; Vilo, J. Robust rank aggregation for gene list integration and meta-analysis. Bioinformatics 2012, 28, 573–580. [Google Scholar] [CrossRef] [Green Version]
  38. Xu, Y.; Zhao, M.; Han, Y.; Zhang, H. GABAergic inhibitory interneuron deficits in Alzheimer’s disease: Implications for treatment. Front. Neurosci. 2020, 14, 660. [Google Scholar] [CrossRef]
  39. Mizukami, K.; Ikonomovic, M.D.; Grayson, D.R.; Sheffield, R.; Armstrong, D.M. Immunohistochemical study of GABAA receptor α1 subunit in the hippocampal formation of aged brains with Alzheimer-related neuropathologic changes. Brain Res. 1998, 799, 148–155. [Google Scholar] [CrossRef]
  40. Rissman, R.; Mishizen-Eberz, A.; Carter, T.; Wolfe, B.; De Blas, A.; Miralles, C.; Ikonomovic, M.; Armstrong, D. Biochemical analysis of GABAA receptor subunits α1, α5, β1, β2 in the hippocampus of patients with Alzheimer’s disease neuropathology. Neuroscience 2003, 120, 695–704. [Google Scholar] [CrossRef]
  41. Iwakiri, M.; Mizukami, K.; Ikonomovic, M.D.; Ishikawa, M.; Abrahamson, E.E.; DeKosky, S.T.; Asada, T. An immunohistochemical study of GABAA receptor gamma subunits in Alzheimer’s disease hippocampus: Relationship to neurofibrillary tangle progression. Neuropathology 2009, 29, 263–269. [Google Scholar] [CrossRef] [PubMed] [Green Version]
  42. Mizukami, K.; Grayson, D.R.; Ikonomovic, M.D.; Sheffield, R.; Armstrong, D.M. GABAA receptor β2 and β3 subunits mRNA in the hippocampal formation of aged human brain with Alzheimer-related neuropathology. Mol. Brain Res. 1998, 56, 268–272. [Google Scholar] [CrossRef]
  43. Li, Y.; Sun, H.; Chen, Z.; Xu, H.; Bu, G.; Zheng, H. Implications of GABAergic neurotransmission in Alzheimer’s disease. Front. Aging Neurosci. 2016, 8, 31. [Google Scholar] [CrossRef] [Green Version]
  44. Zhan, X.Q.; Yao, J.J.; Liu, D.D.; Ma, Q.; Mei, Y.A. Aβ40 modulates GABAA receptor α6 subunit expression and rat cerebellar granule neuron maturation through the ERK/mTOR pathway. J. Neurochem. 2014, 128, 350–362. [Google Scholar] [CrossRef] [PubMed]
  45. Frere, S.; Slutsky, I. Alzheimer’s disease: From firing instability to homeostasis network collapse. Neuron 2018, 97, 32–58. [Google Scholar] [CrossRef] [PubMed] [Green Version]
  46. Tong, L.M.; Djukic, B.; Arnold, C.; Gillespie, A.K.; Yoon, S.Y.; Wang, M.M.; Zhang, O.; Knoferle, J.; Rubenstein, J.L.; Alvarez-Buylla, A. Inhibitory interneuron progenitor transplantation restores normal learning and memory in ApoE4 knock-in mice without or with Aβ accumulation. J. Neurosci. 2014, 34, 9506–9515. [Google Scholar] [CrossRef] [PubMed] [Green Version]
  47. Li, X.; Wang, Z.; Tan, L.; Wang, Y.; Lu, C.; Chen, R.; Zhang, S.; Gao, Y.; Liu, Y.; Yin, Y. Correcting miR92a-vGAT-mediated GABAergic dysfunctions rescues human tau-induced anxiety in mice. Mol. Ther. 2017, 25, 140–152. [Google Scholar] [CrossRef] [PubMed] [Green Version]
  48. Zheng, J.; Li, H.-L.; Tian, N.; Liu, F.; Wang, L.; Yin, Y.; Yue, L.; Ma, L.; Wan, Y.; Wang, J.-Z. Interneuron accumulation of phosphorylated tau impairs adult hippocampal neurogenesis by suppressing GABAergic transmission. Cell Stem Cell 2020, 26, 331–345.e336. [Google Scholar] [CrossRef]
  49. Abyadeh, M.; Gupta, V.; Paulo, J.A.; Gupta, V.; Chitranshi, N.; Godinez, A.; Saks, D.; Hasan, M.; Amirkhani, A.; McKay, M. A proteomic view of cellular and molecular effects of cannabis. Biomolecules 2021, 11, 1411. [Google Scholar] [CrossRef]
  50. Lu, H.-C.; Mackie, K. An introduction to the endogenous cannabinoid system. Biol. Psychiatry 2016, 79, 516–525. [Google Scholar] [CrossRef] [Green Version]
  51. Cristino, L.; Bisogno, T.; Di Marzo, V. Cannabinoids and the expanded endocannabinoid system in neurological disorders. Nat. Rev. Neurol. 2020, 16, 9–29. [Google Scholar] [CrossRef] [PubMed]
  52. Ohno-Shosaku, T.; Maejima, T.; Kano, M. Endogenous cannabinoids mediate retrograde signals from depolarized postsynaptic neurons to presynaptic terminals. Neuron 2001, 29, 729–738. [Google Scholar] [CrossRef]
  53. Wilson, R.I.; Nicoll, R.A. Endogenous cannabinoids mediate retrograde signalling at hippocampal synapses. Nature 2001, 410, 588–592. [Google Scholar] [CrossRef] [PubMed]
  54. Zou, S.; Kumar, U. Cannabinoid receptors and the endocannabinoid system: Signaling and function in the central nervous system. Int. J. Mol. Sci. 2018, 19, 833. [Google Scholar] [CrossRef] [Green Version]
  55. Xu, J.-Y.; Chen, C. Endocannabinoids in synaptic plasticity and neuroprotection. Neuroscientist 2015, 21, 152–168. [Google Scholar] [CrossRef] [Green Version]
  56. Mulder, J.; Zilberter, M.; Pasquare, S.J.; Alpar, A.; Schulte, G.; Ferreira, S.G.; Köfalvi, A.; Martín-Moreno, A.M.; Keimpema, E.; Tanila, H. Molecular reorganization of endocannabinoid signalling in Alzheimer’s disease. Brain 2011, 134, 1041–1060. [Google Scholar] [CrossRef]
  57. Bottero, V.; Potashkin, J.A. Meta-analysis of gene expression changes in the blood of patients with mild cognitive impairment and Alzheimer’s disease dementia. Int. J. Mol. Sci. 2019, 20, 5403. [Google Scholar] [CrossRef]
  58. Ge, X.-Y.; Cui, K.; Liu, L.; Qin, Y.; Cui, J.; Han, H.-J.; Luo, Y.-H.; Yu, H.-M. Screening and predicting progression from high-risk mild cognitive impairment to Alzheimer’s disease. Sci. Rep. 2021, 11, 17558. [Google Scholar] [CrossRef]
  59. Estfanous, S.; Daily, K.P.; Eltobgy, M.; Deems, N.P.; Anne, M.N.; Krause, K.; Badr, A.; Hamilton, K.; Carafice, C.; Hegazi, A. Elevated Expression of MiR-17 in Microglia of Alzheimer’s Disease Patients Abrogates Autophagy-Mediated Amyloid-β Degradation. Front. Immunol. 2021, 12, 2839. [Google Scholar] [CrossRef]
  60. Yılmaz, Ş.G.; Erdal, M.E.; Özge, A.A.; Sungur, M.A. Can peripheral MicroRNA expression data serve as epigenomic (upstream) biomarkers of Alzheimer’s disease? Omics A J. Integr. Biol. 2016, 20, 456–461. [Google Scholar] [CrossRef]
  61. Ma, J.; Wang, W.; Azhati, B.; Wang, Y.; Tusong, H. miR-106a-5p Functions as a Tumor Suppressor by Targeting VEGFA in Renal Cell Carcinoma. Dis. Markers 2020, 2020, 8837941. [Google Scholar] [CrossRef] [PubMed]
  62. Mahoney, E.R.; Dumitrescu, L.; Moore, A.M.; Cambronero, F.E.; De Jager, P.L.; Koran, M.E.I.; Petyuk, V.A.; Robinson, R.A.; Goyal, S.; Schneider, J.A. Brain expression of the vascular endothelial growth factor gene family in cognitive aging and alzheimer’s disease. Mol. Psychiatry 2021, 26, 888–896. [Google Scholar] [CrossRef] [PubMed] [Green Version]
  63. Lu, Y.; Li, X.; Zuo, Y.; Xu, Q.; Liu, L.; Wu, H.; Chen, L.; Zhang, Y.; Liu, Y.; Li, Y. miR-373-3p inhibits epithelial–mesenchymal transition via regulation of TGFβR2 in choriocarcinoma. J. Obstet. Gynaecol. Res. 2021, 47, 2417–2432. [Google Scholar] [CrossRef] [PubMed]
  64. Fessel, J. Ineffective levels of transforming growth factors and their receptor account for old age being a risk factor for Alzheimer’s disease. Alzheimer’s Dement. Transl. Res. Clin. Interv. 2019, 5, 899–905. [Google Scholar] [CrossRef] [PubMed]
  65. Sharma, A.; Callahan, L.M.; Sul, J.-Y.; Kim, T.K.; Barrett, L.; Kim, M.; Powers, J.M.; Federoff, H.; Eberwine, J. A neurotoxic phosphoform of Elk-1 associates with inclusions from multiple neurodegenerative diseases. PLoS ONE 2010, 5, e9002. [Google Scholar] [CrossRef]
  66. Galan, B.; Caboche, J. Elk-1 a transcription factor with multiple facets in the brain. Front. Neurosci. 2011, 5, 35. [Google Scholar]
  67. Tong, L.; Balazs, R.; Thornton, P.L.; Cotman, C.W. β-amyloid peptide at sublethal concentrations downregulates brain-derived neurotrophic factor functions in cultured cortical neurons. J. Neurosci. 2004, 24, 6799–6809. [Google Scholar] [CrossRef] [Green Version]
  68. Pastorcic, M.; Das, H.K. Ets transcription factors ER81 and Elk1 regulate the transcription of the human presenilin 1 gene promoter. Mol. Brain Res. 2003, 113, 57–66. [Google Scholar] [CrossRef]
  69. Chu, J.; Wisniewski, T.; Praticò, D. GATA 1-mediated transcriptional regulation of the γ-secretase activating protein increases A β formation in D own syndrome. Ann. Neurol. 2016, 79, 138–143. [Google Scholar] [CrossRef] [Green Version]
  70. Roy, J.; Mallick, B. Altered gene expression in late-onset Alzheimer’s disease due to SNPs within 3′ UTR microRNA response elements. Genomics 2017, 109, 177–185. [Google Scholar] [CrossRef]
  71. Tam, K.T.; Chan, P.K.; Zhang, W.; Law, P.P.; Tian, Z.; Fung Chan, G.C.; Philipsen, S.; Festenstein, R.; Tan-Un, K.C. Identification of a novel distal regulatory element of the human Neuroglobin gene by the chromosome conformation capture approach. Nucleic Acids Res. 2017, 45, 115–126. [Google Scholar] [CrossRef] [PubMed] [Green Version]
  72. De Vidania, S.; Palomares-Perez, I.; Frank-García, A.; Saito, T.; Saido, T.C.; Draffin, J.; Szaruga, M.; Chávez-Gutierrez, L.; Calero, M.; Medina, M. Prodromal Alzheimer’s Disease: Constitutive Upregulation of Neuroglobin Prevents the Initiation of Alzheimer’s Pathology. Front. Neurosci. 2020, 14, 1001. [Google Scholar] [CrossRef] [PubMed]
  73. Ciccone, L.; Nencetti, S.; Socci, S.; Orlandini, E. Neuroglobin and neuroprotection: The role of natural and synthetic compounds in neuroglobin pharmacological induction. Neural Regen. Res. 2021, 16, 2353. [Google Scholar] [PubMed]
  74. Bottero, V.; Powers, D.; Yalamanchi, A.; Quinn, J.P.; Potashkin, J.A. Key Disease Mechanisms Linked to Alzheimer’s Disease in the Entorhinal Cortex. Int. J. Mol. Sci. 2021, 22, 3915. [Google Scholar] [CrossRef]
Figure 1. (A) Number of down and up-regulated robust genes in each brain region; (B) upset plot indicates the overlap of robust differentially expressed genes with either increased or decreased abundance in different brain regions; DEGs, differentially expressed genes; CB, cerebellum; FC, frontal cortex; HPC, hippocampus; EC, entorhinal cortex; TC, temporal cortex.
Cells 11 00987 g001
Figure 2. Venn diagram of KEGG pathway enrichment analysis on (A) Up-regulated and (B) Down-regulated pathways based on adjusted p-value. TC, temporal cortex; FC, frontal cortex; EC, entorhinal cortex; HPC, hippocampus; CB, cerebellum.
Cells 11 00987 g002
Figure 3. Functional interaction networks analyzed by the String Cytoscape plug-in. (A) PPI network of genes related to GABAergic synapse pathway (red), retrograde endocannabinoid signaling (green), morphine (blue) and nicotine (orange). (B) In addiction, PRKACB (red), PRKCB (orange) and GABRA1 (yellow) found the top hub genes based on the MCC algorithm.
Cells 11 00987 g003
Figure 4. Transcription factors and miRNAs analyses. (A,B) results represent Venn diagram analysis for the top five miRNAs and the three TFs that interact with the robust DEGs of the GABAergic synapse pathway. (C,D) show Venn diagram analysis and the top five miRNAs and the TFs interacting with the robust DEGs involved in retrograde endocannabinoid signaling.
Cells 11 00987 g004
Table 2. The top three enriched pathways by robust DEGs in each brain region, determined using Enrichr and KEGG.
Brain RegionPathway Alteration p-ValueAdjusted
p-Value
Odd RatioCombined ScoreGenes
CerebellumMineral absorptionUp-regulated0.0000059260.000746722.29268.27MT2A, MT1A, MT1M, ATP2B4, MT1G
IL-17 signaling pathwayUp-regulated0.000053120.00334713.75135.34NFKBIA, CEBPB, CXCL1, S100A9, S100A8
NF-kappa B signaling pathwayUp-regulated0.010230.39367.0932.49NFKBIA, GADD45A, CXCL1
Frontal cortexNeuroactive ligand-receptor interactionDown-regulated0.0000010480.00021483.5048.19GABBR2, GABRA1, CHRM3, EDN3, NPY5R, GABRA5, GABRA4, GRIK1, HTR2A, MCHR1, GABRG2, MCHR2, ADCYAP1, CORT, CCKBR, GLRB, SST, NMU, CRH, TAC3, TAC1, VIP, GABRD
GABAergic synapseDown-regulated0.0000026410.00022526.7186.16GABBR2, GABRA1, GNG3, GNG2, SLC32A1, GABRA5, GABRA4, GAD2, PRKACB, GABRD, GABRG2
Complement and coagulation cascadesUp-regulated8.435 × 10−151.839 × 10−1217.28560.01C1QB, C1QA, C1S, CFH, C1R, C5AR1, CFI, F13A1, SERPINA5, C4B, C4A, C7, CFHR1, C3AR1, VSIG4, CFB, C1QC
HippocampusBacterial invasion of epithelial cellsDown-regulated0.00033950.0172413.26105.91CDC42, ARPC1A, ARPC4, MET
Synaptic vesicle cycleDown-regulated0.00035670.0172413.08103.83ATP6V1G2, SLC32A1, SLC17A6, SLC1A6
Morphine addictionDown-regulated0.00064060.0172411.1281.74GABRA1, SLC32A1, GNG4, PDE2A
Entorhinal cortexMorphine addictionDown-regulated0.000080880.00986812.52118.00GABRB2, GABRA1, GNAS, ADCY1, GABRD
Gap junctionDown-regulated0.00088770.0292610.1571.31GNAS, ADRB1, ADCY1, TUBB4A
GABAergic synapseDown-regulated0.00092610.0292610.0370.04GABRB2, GABRA1, ADCY1, GABRD
Temporal cortexGABAergic synapseDown-regulated4.244 × 10−109.295 × 10−812.30265.54GABRB3, GABRB2, GABBR2, GABRA1, SLC12A5, PRKCB, GABRA5, GAD2, GABRG2, GLS, GNG3, GNG2, GABRD
Nicotine addictionDown-regulated4.089 × 10−94.478 × 10−720.63398.46GABRB3, GABRB2, GRIA2, GABRA1, GABRA5, SLC17A6, GABRD, GRIN2B, GABRG2
Retrograde endocannabinoid signalingDown-regulated0.0000015050.000074316.3084.53GABRB3, GRIA2, GABRB2, MAPK9, GABRA1, GNG3, GNG2, PRKCB, GABRA5, SLC17A6, GABRD, GABRG2
Table 3. The top three shared miRNAs and TFs between the GABAergic synapse pathway and the retrograde endocannabinoid signaling pathway; data were extracted from miRTarBase and JASPAR databases.
NamePathwayDegreeBetweenness
  miRNA
hsa-mir-17-5pGABAergic synapse pathway2887.4
Retrograde endocannabinoid signaling31135.6
hsa-mir-106a-5pGABAergic synapse pathway2887.4
Retrograde endocannabinoid signaling31135.96
hsa-mir-373-3pGABAergic synapse pathway10
Retrograde endocannabinoid signaling10
Transcription Factors
ELK1GABAergic synapse pathway27.35
Retrograde endocannabinoid signaling28.13
GATA1GABAergic synapse pathway10
Retrograde endocannabinoid signaling10
GATA2GABAergic synapse pathway10245.61
Retrograde endocannabinoid signaling10261.51
Publisher’s Note: MDPI stays neutral with regard to jurisdictional claims in published maps and institutional affiliations.

