
Chrysin-Induced Regression of Angiogenesis via an Induction of DNA Damage Response and Oxidative Stress in In Vitro and In Vivo Models of Melanoma
 , , , and
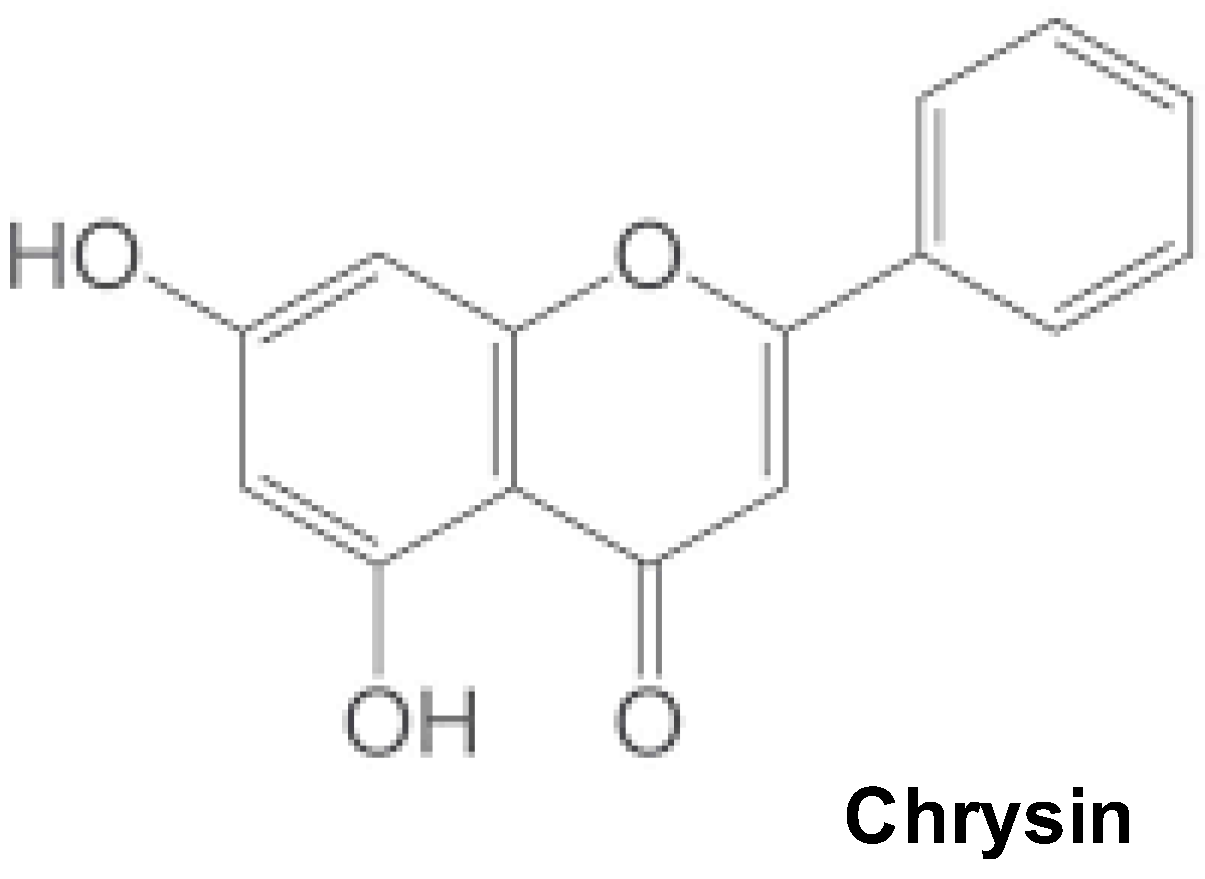
Abstract
:1. Introduction
2. Materials and Methods
2.1. Cell Lines
2.2. Drugs and Chemical Reagents
2.3. Viability Assays
2.4. Apoptosis Detection
2.5. Western Blot Analysis
2.6. Quantification of DNA Damage by Flow Cytometry
2.7. Immunofluorescence
2.8. Interaction Measurement with DNA G-Quadruplex/Duplex
2.9. Oxidative Stress Assays
2.10. RNA Extraction and Quantitative PCR Analysis
2.11. ELISA
2.12. Tumor Growth Analyses In Vivo
2.13. Densitometry and Statistical Significance
3. Results
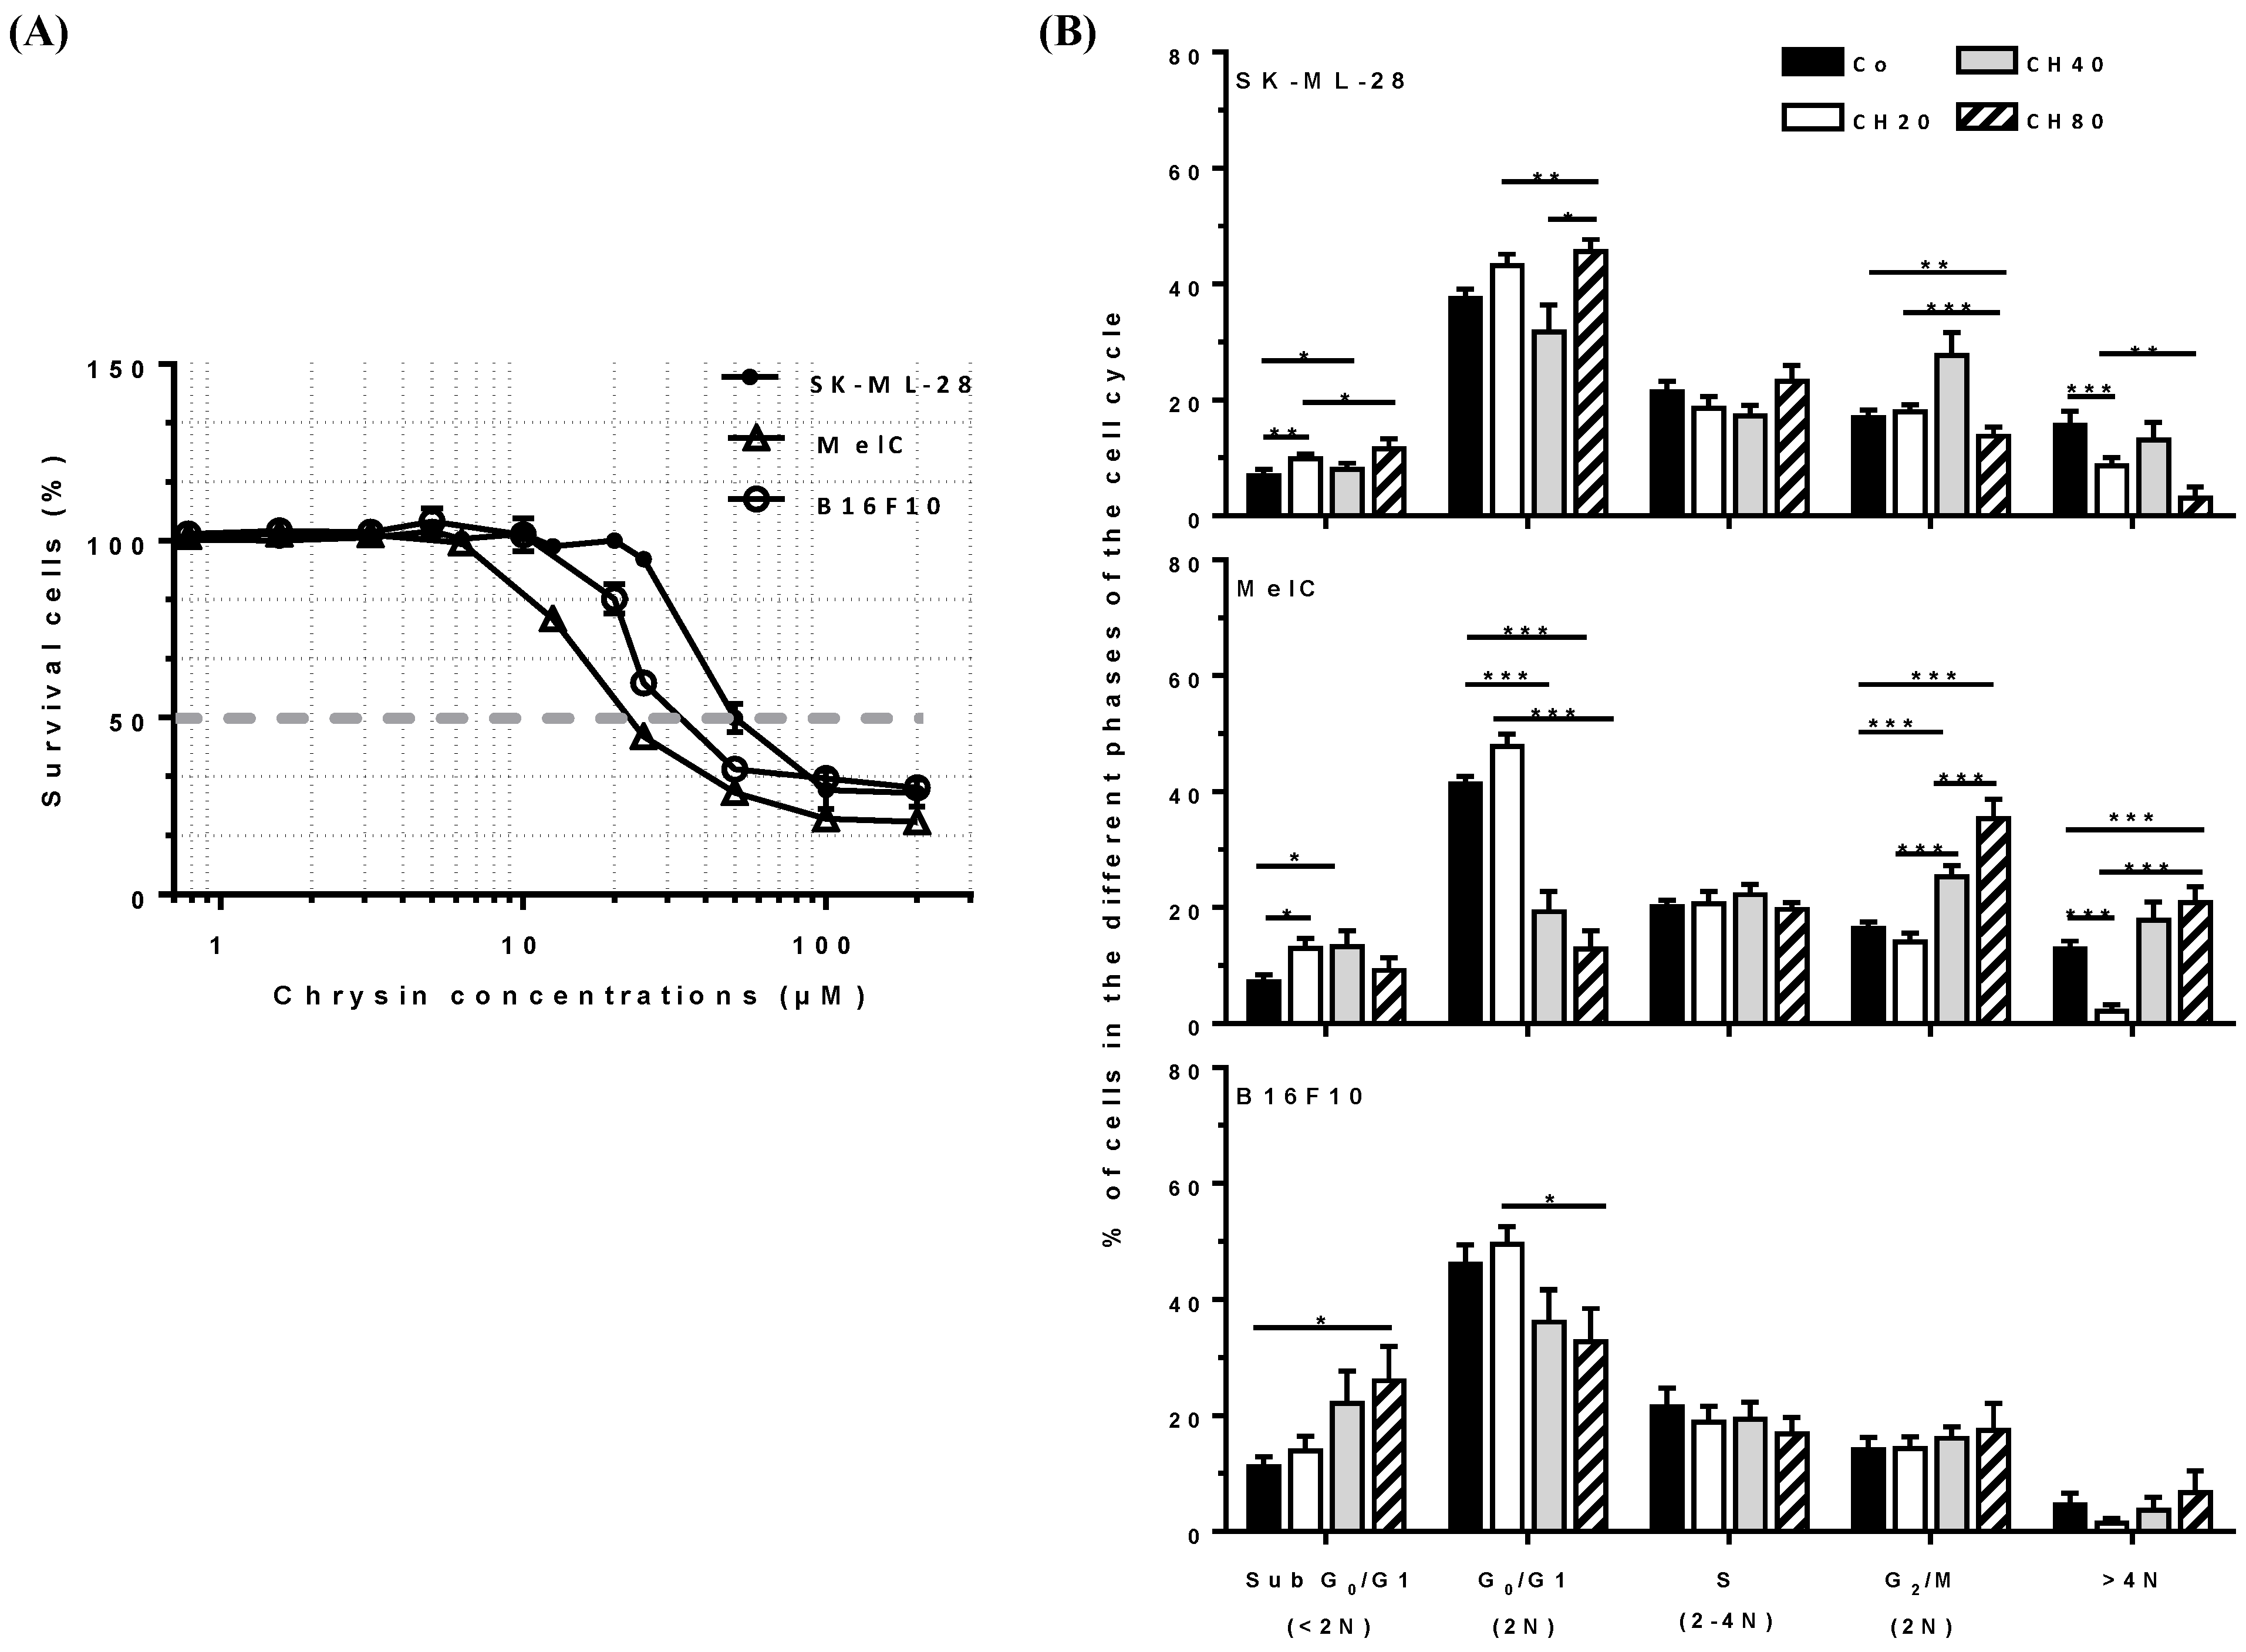
3.1. Chrysin Prevents Melanoma Cell Proliferation
3.2. Chrysin Disrupts Cell Cycle Progression at the G2/M Phase and Induces Tetraploid Cells
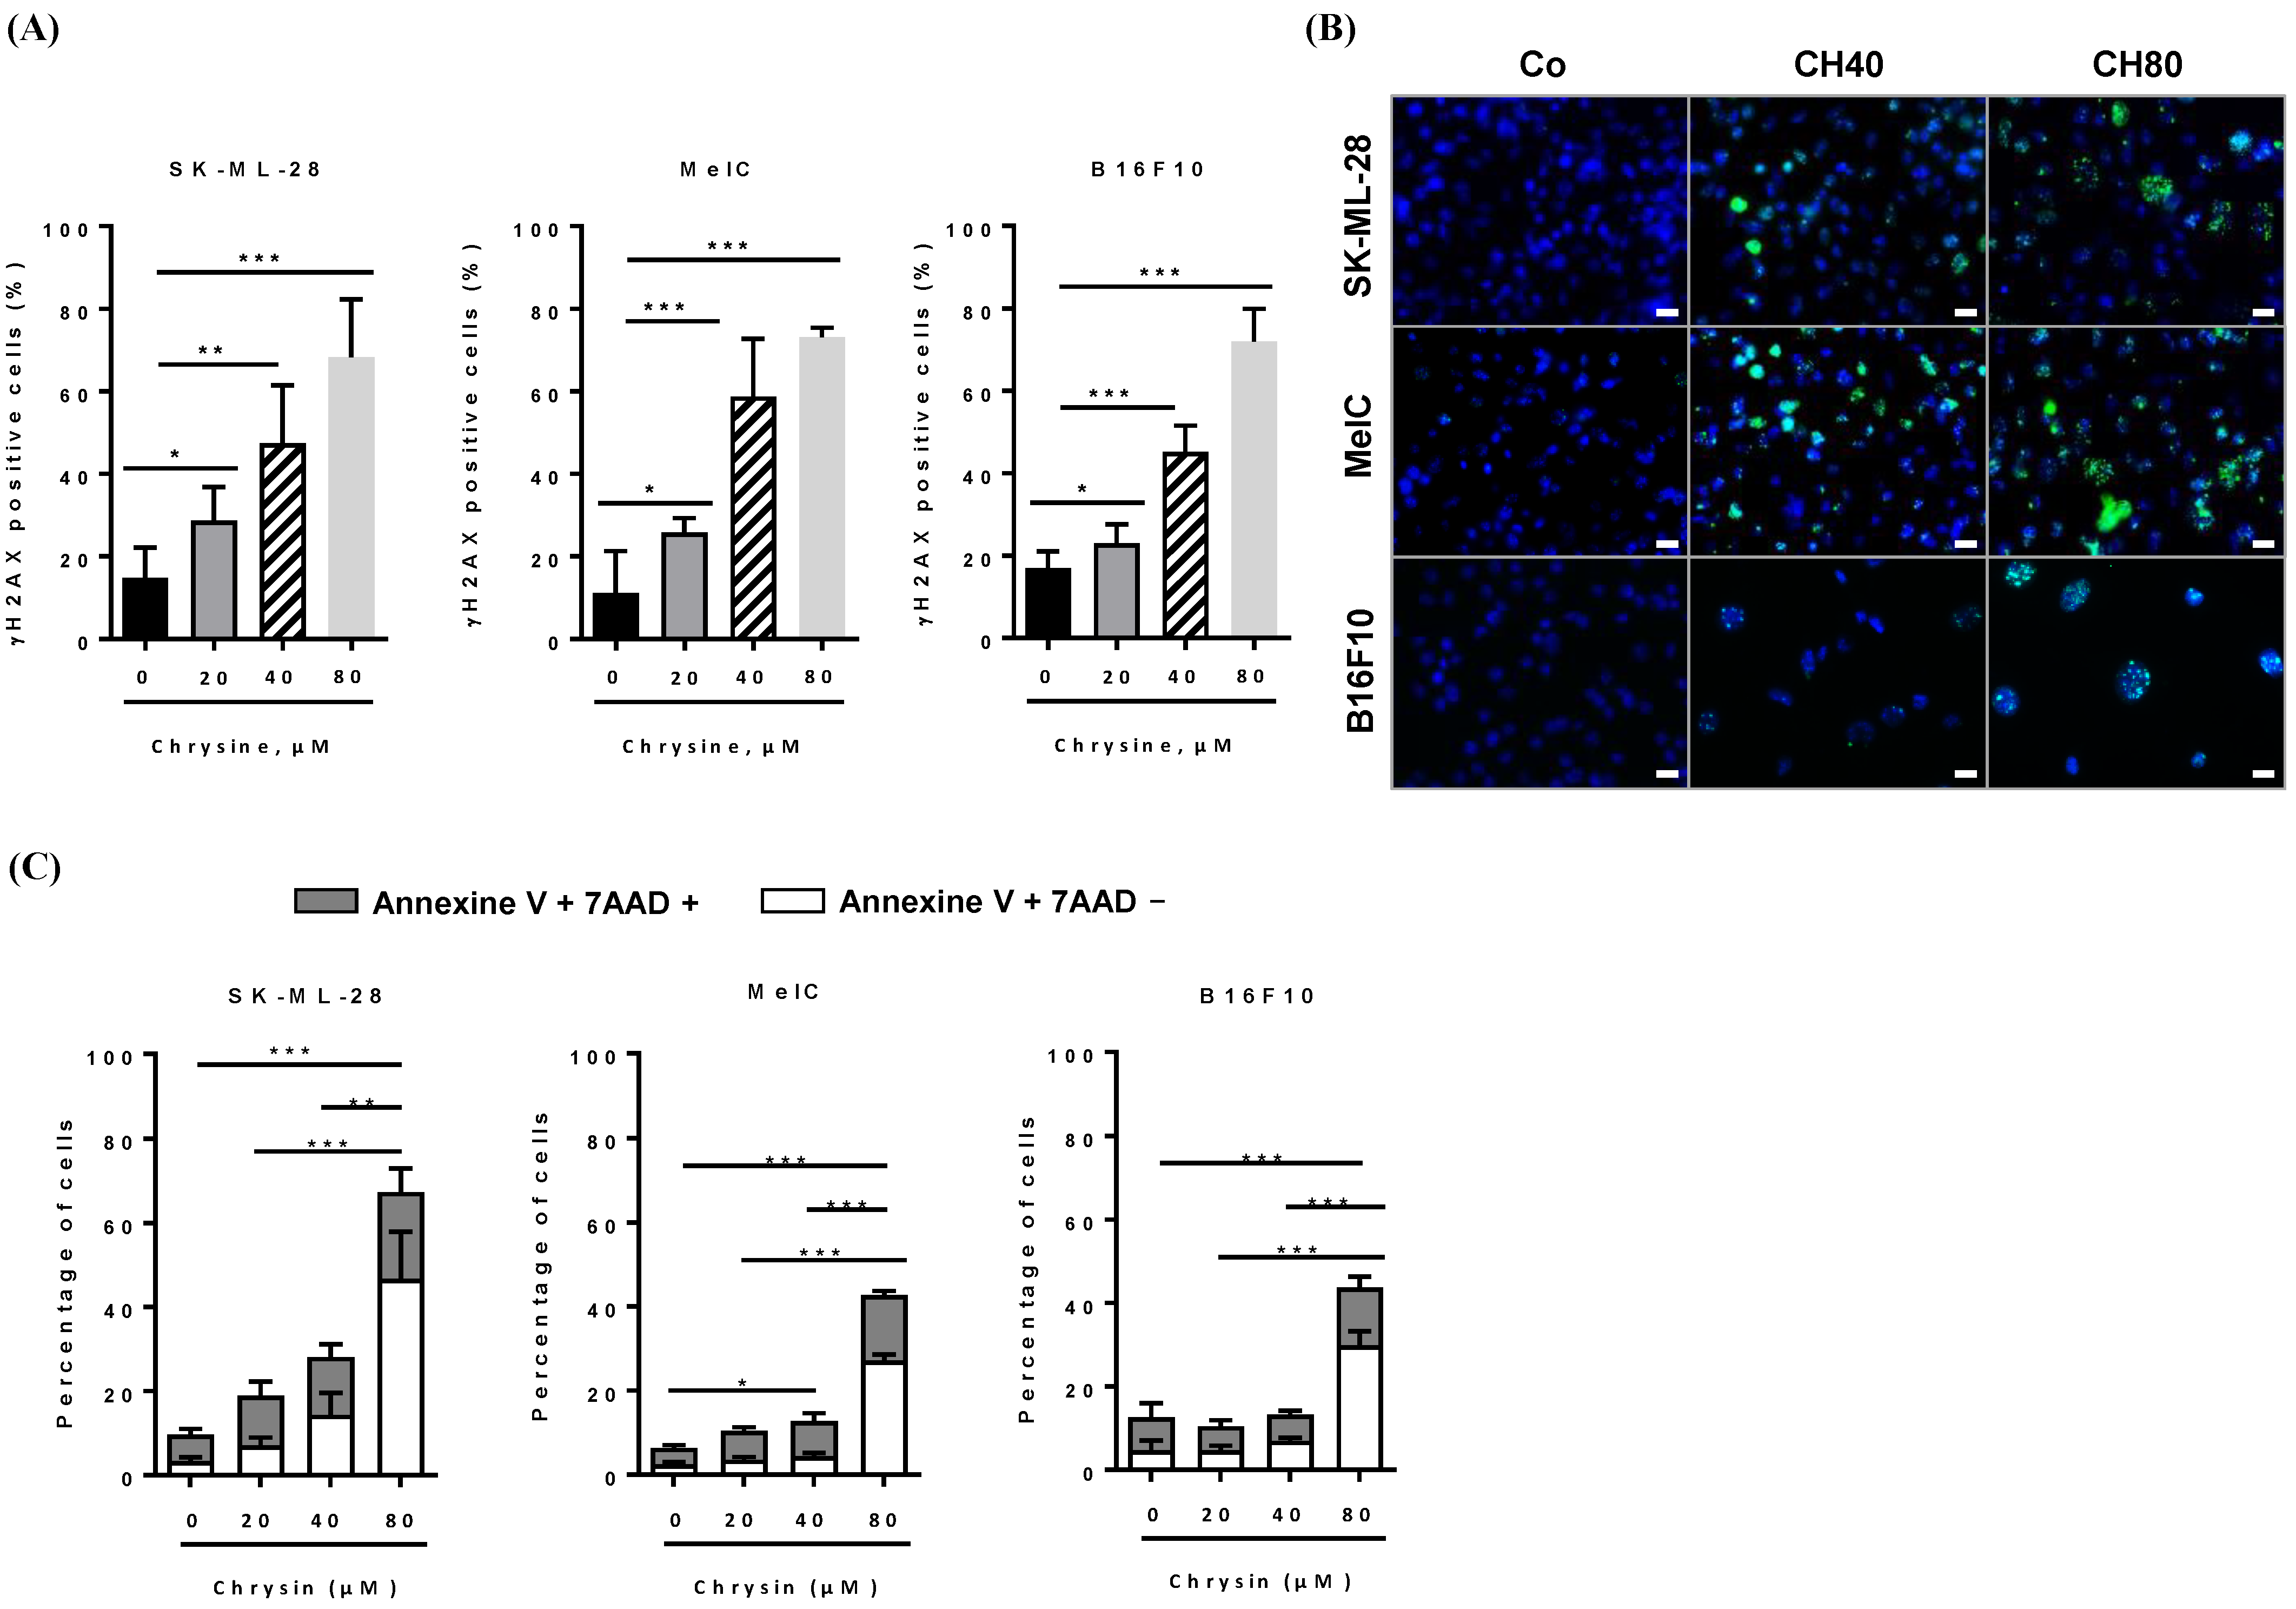
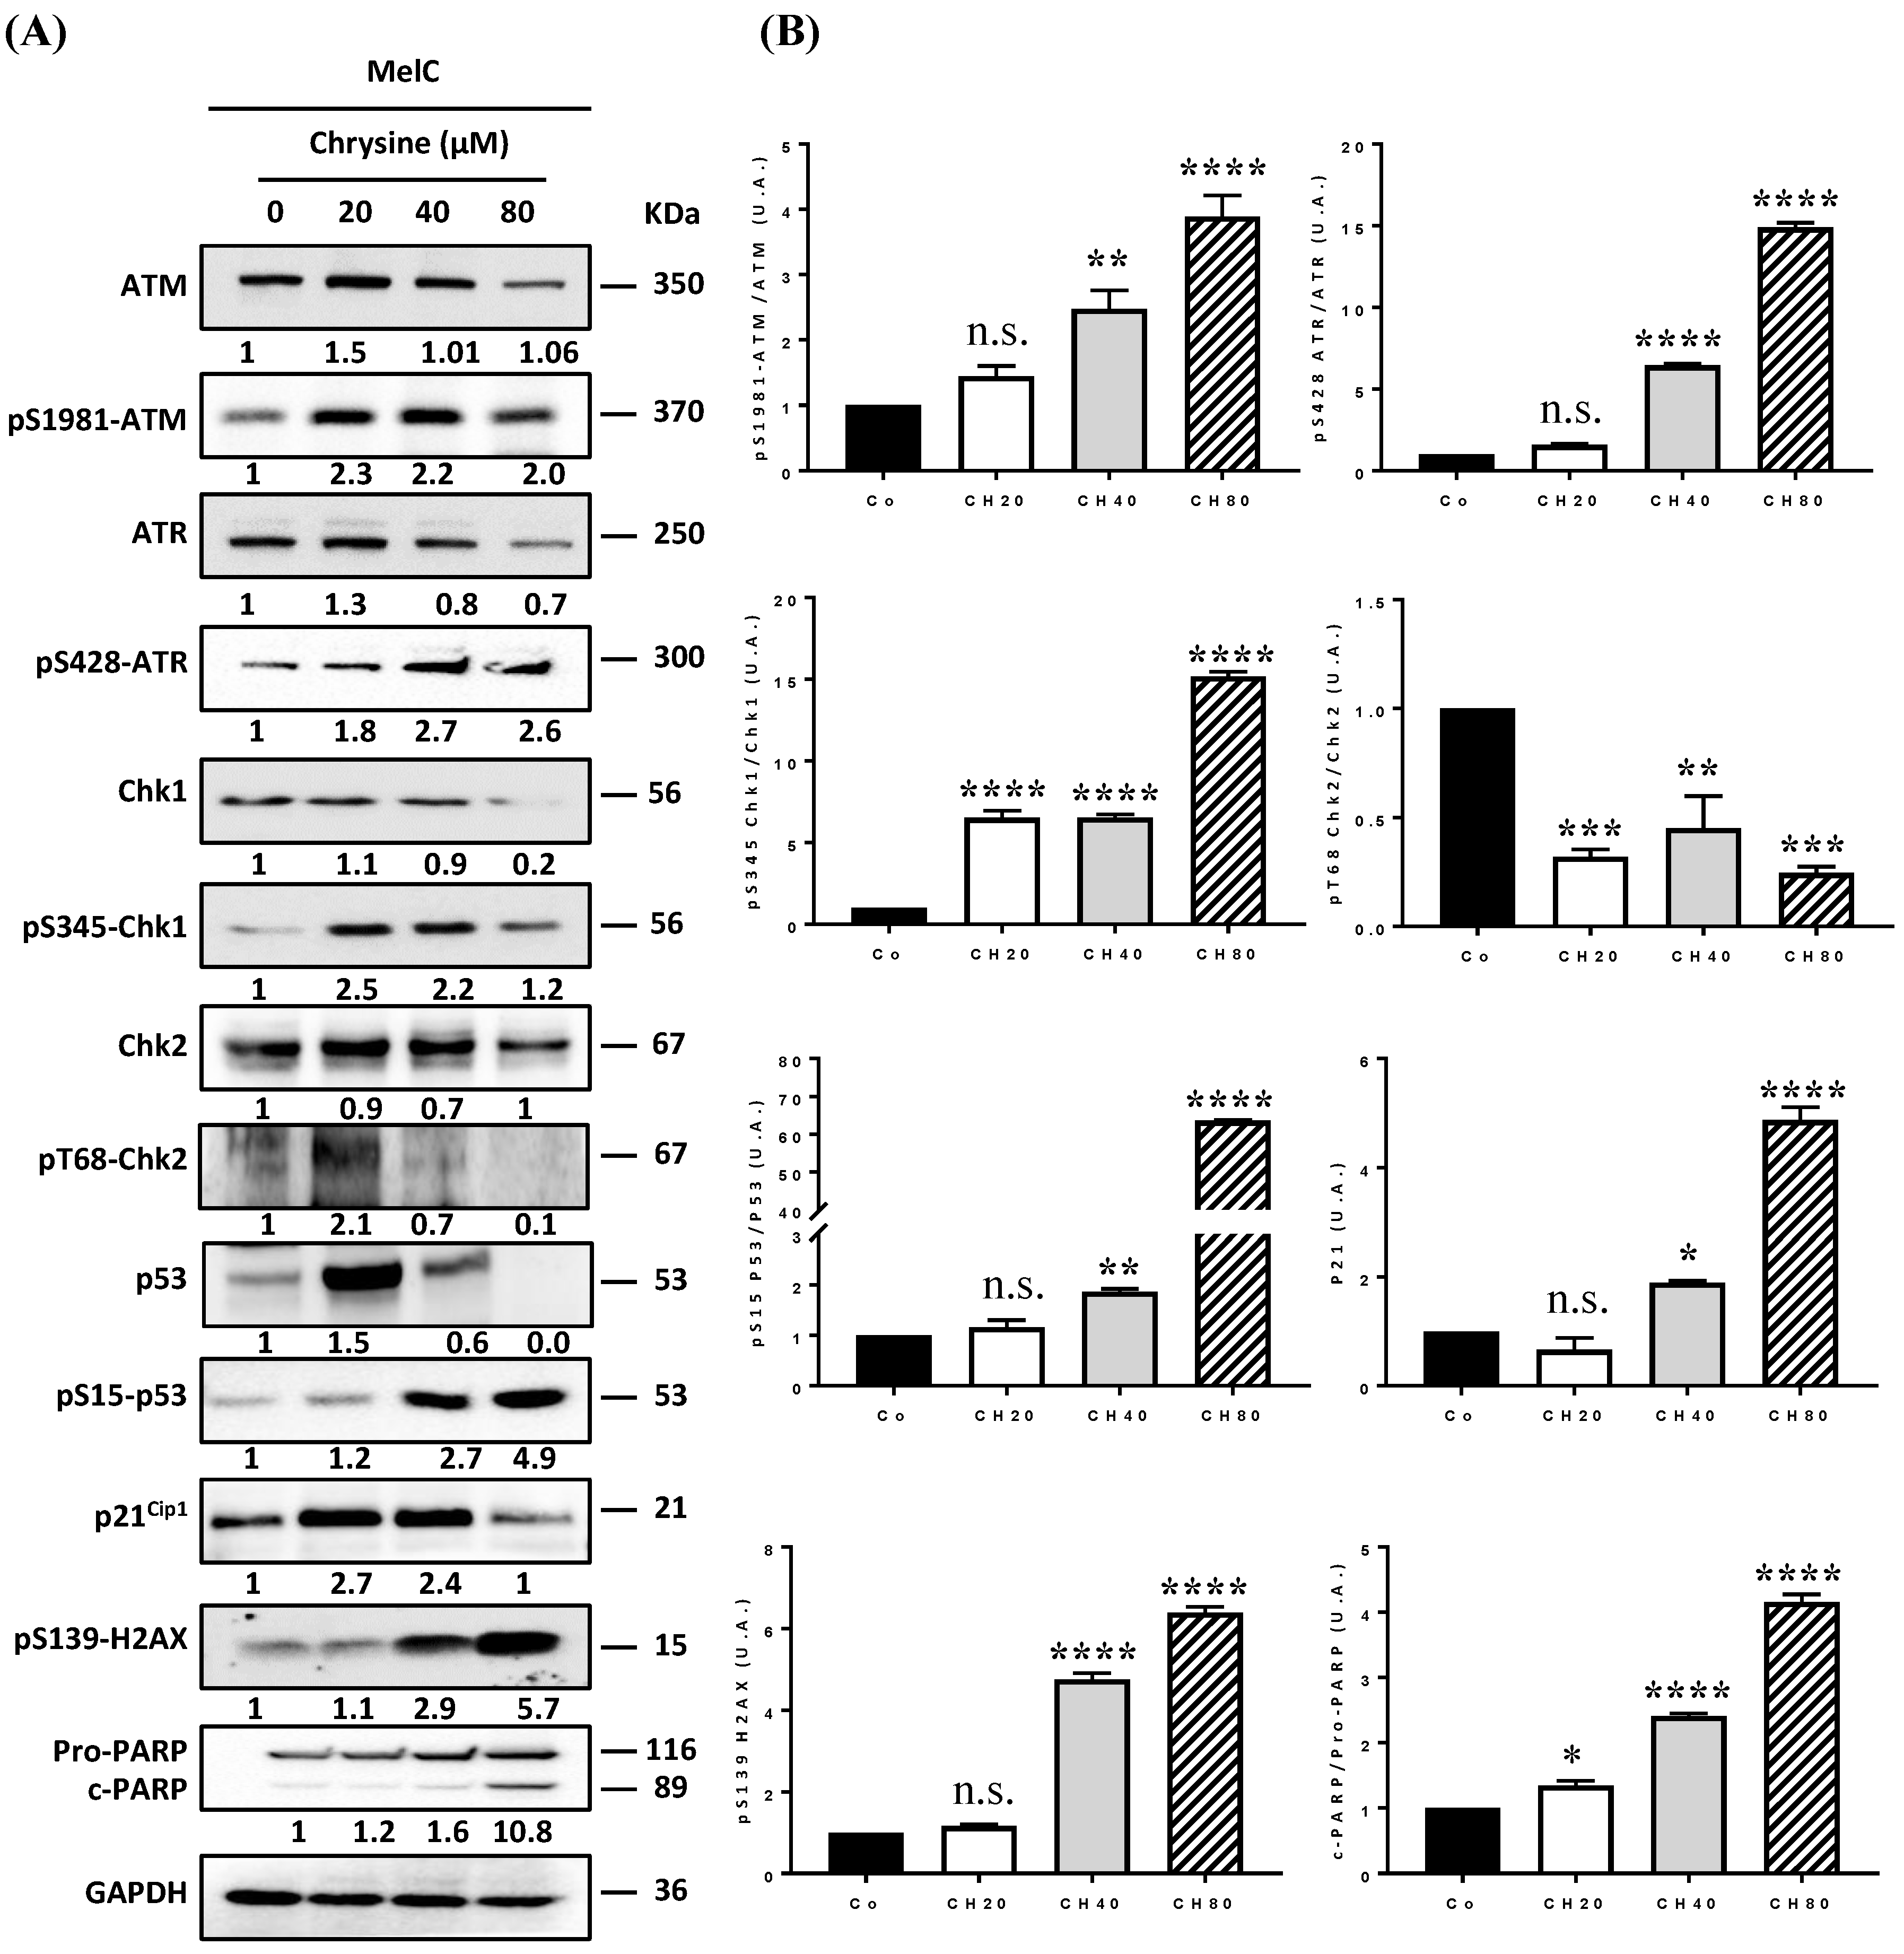
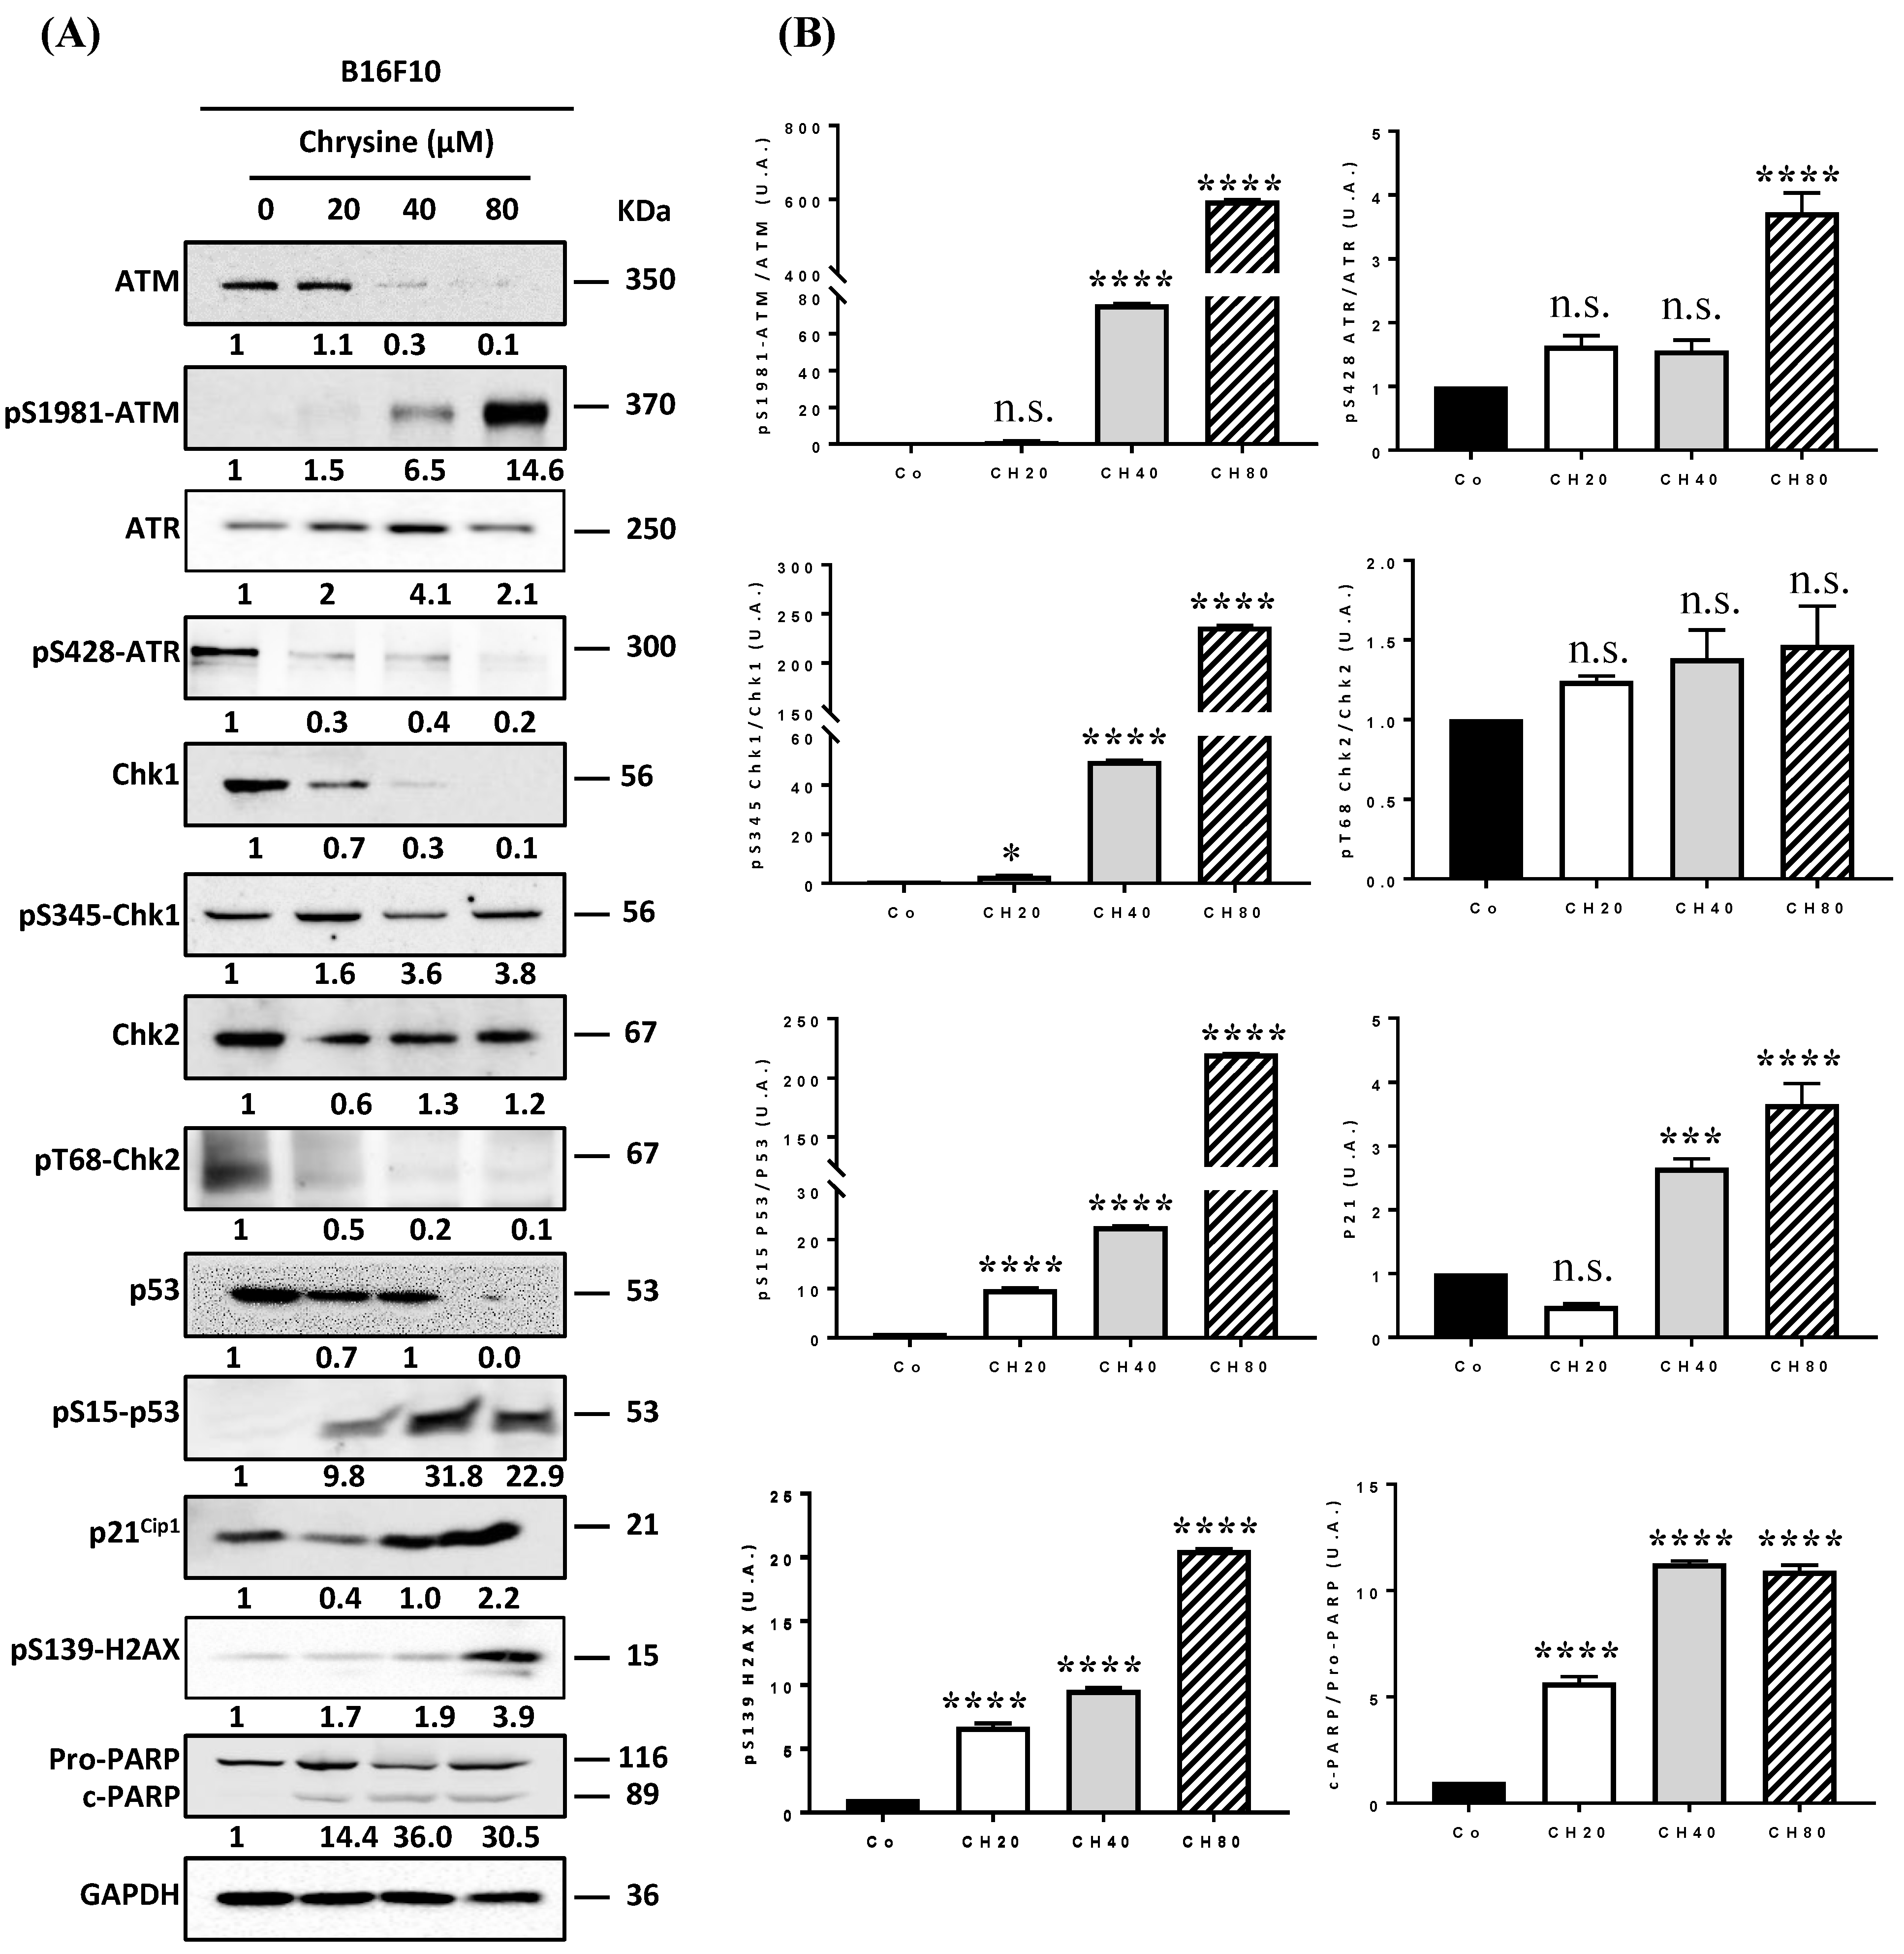
3.3. Chrysin Induces DNA Damages, Leading to the Apoptosis Process
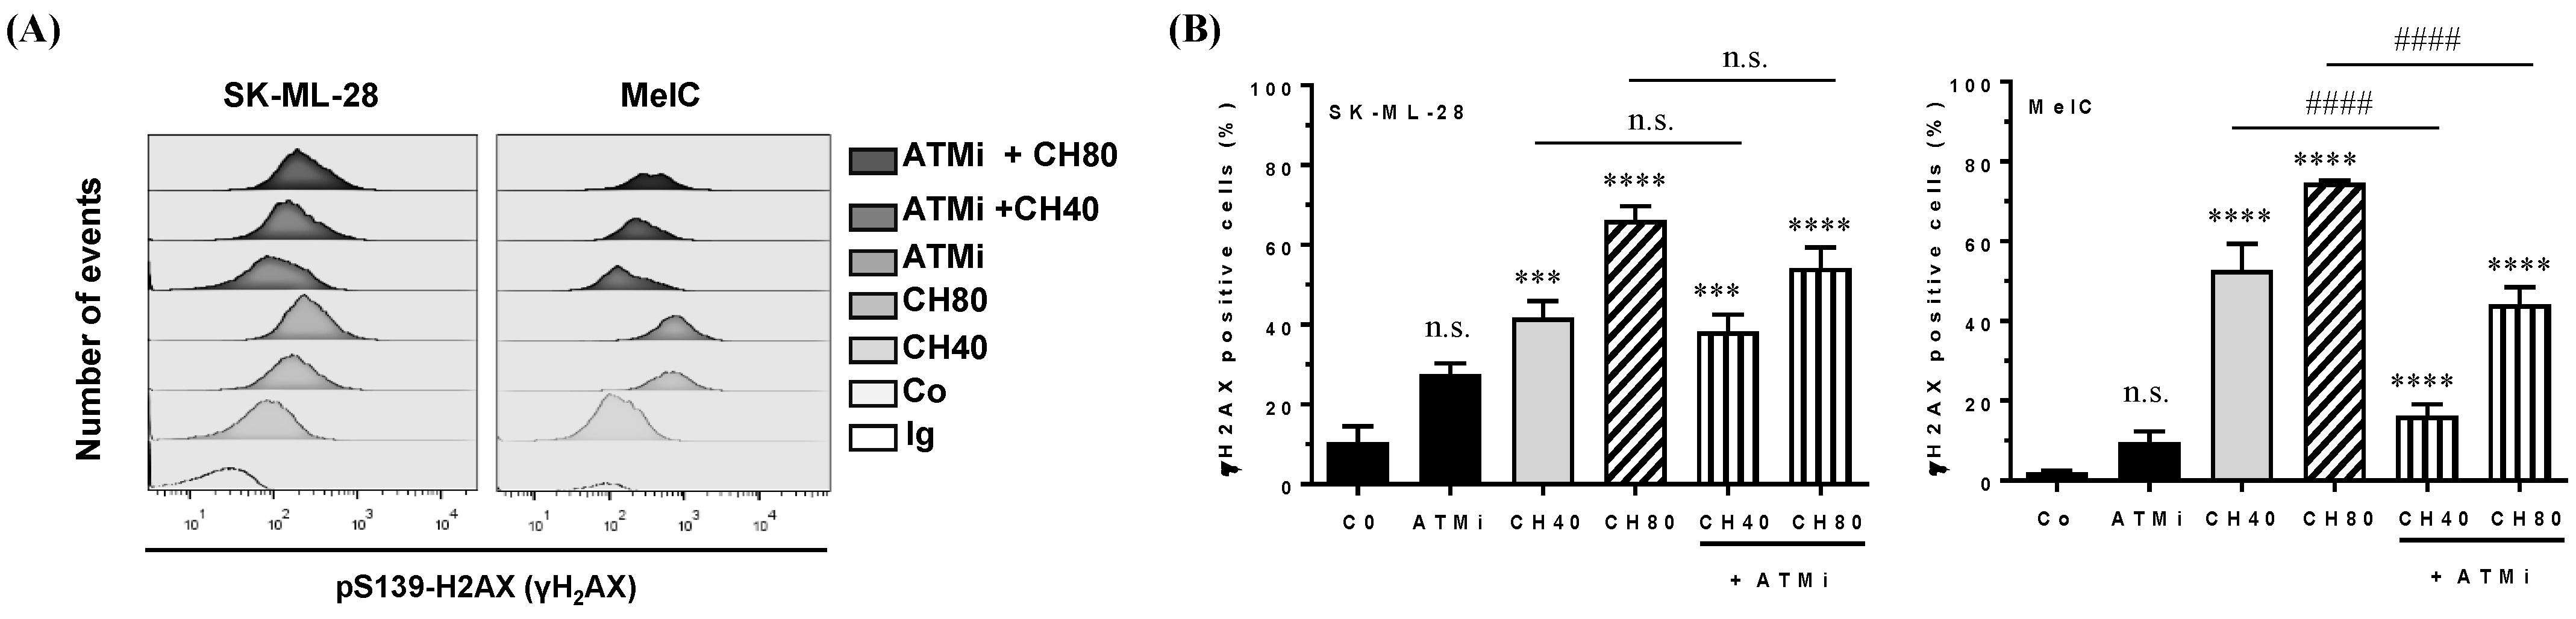
3.4. Chrysin Induces DNA Damage in Melanic Cell Lines
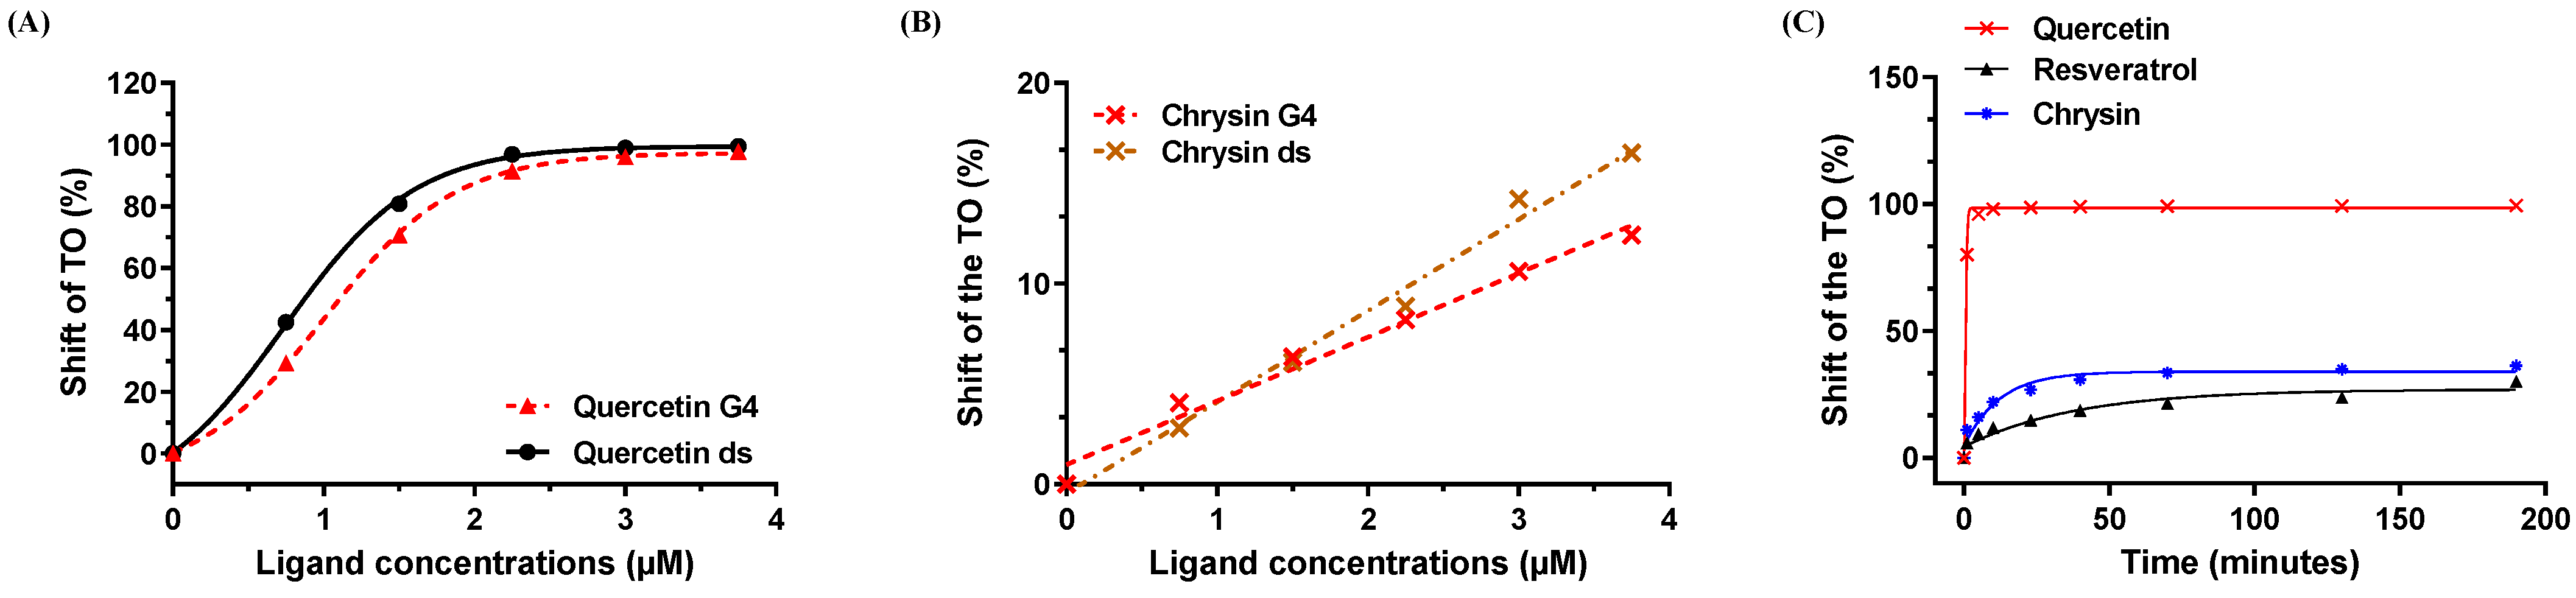
3.5. Chrysin Induces Moderate Binding to the G Quadruplex and Duplex Structures
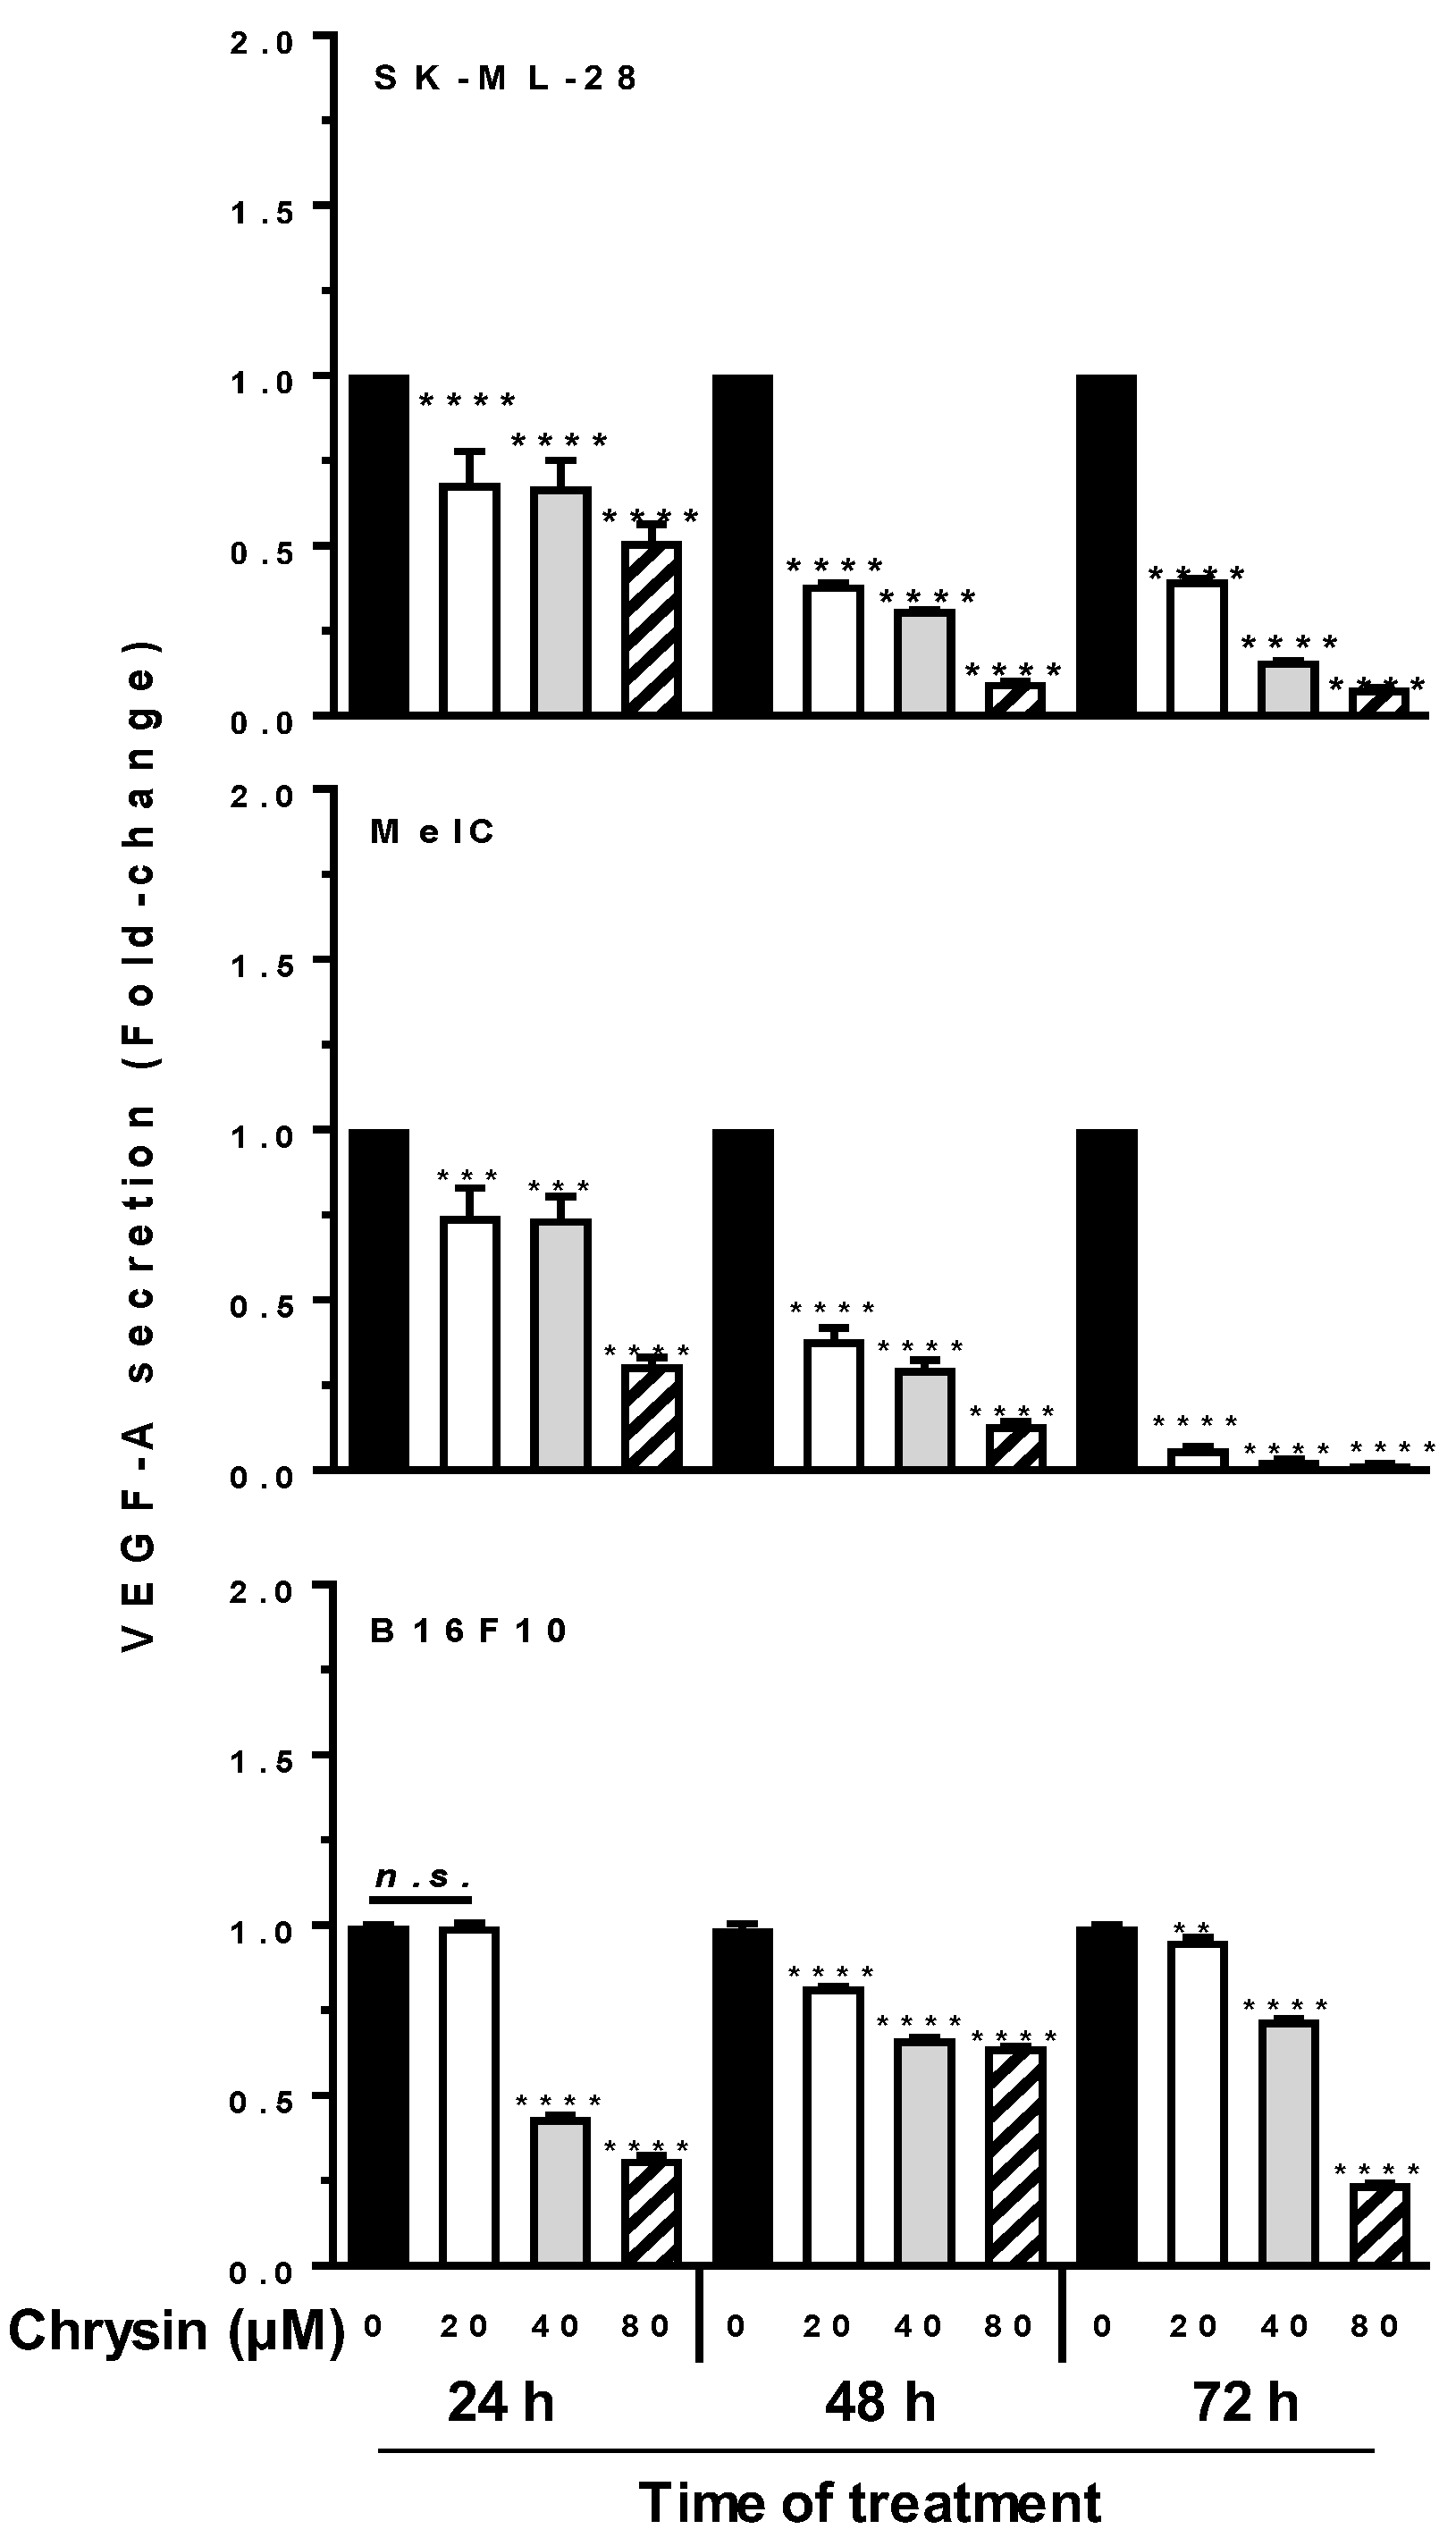
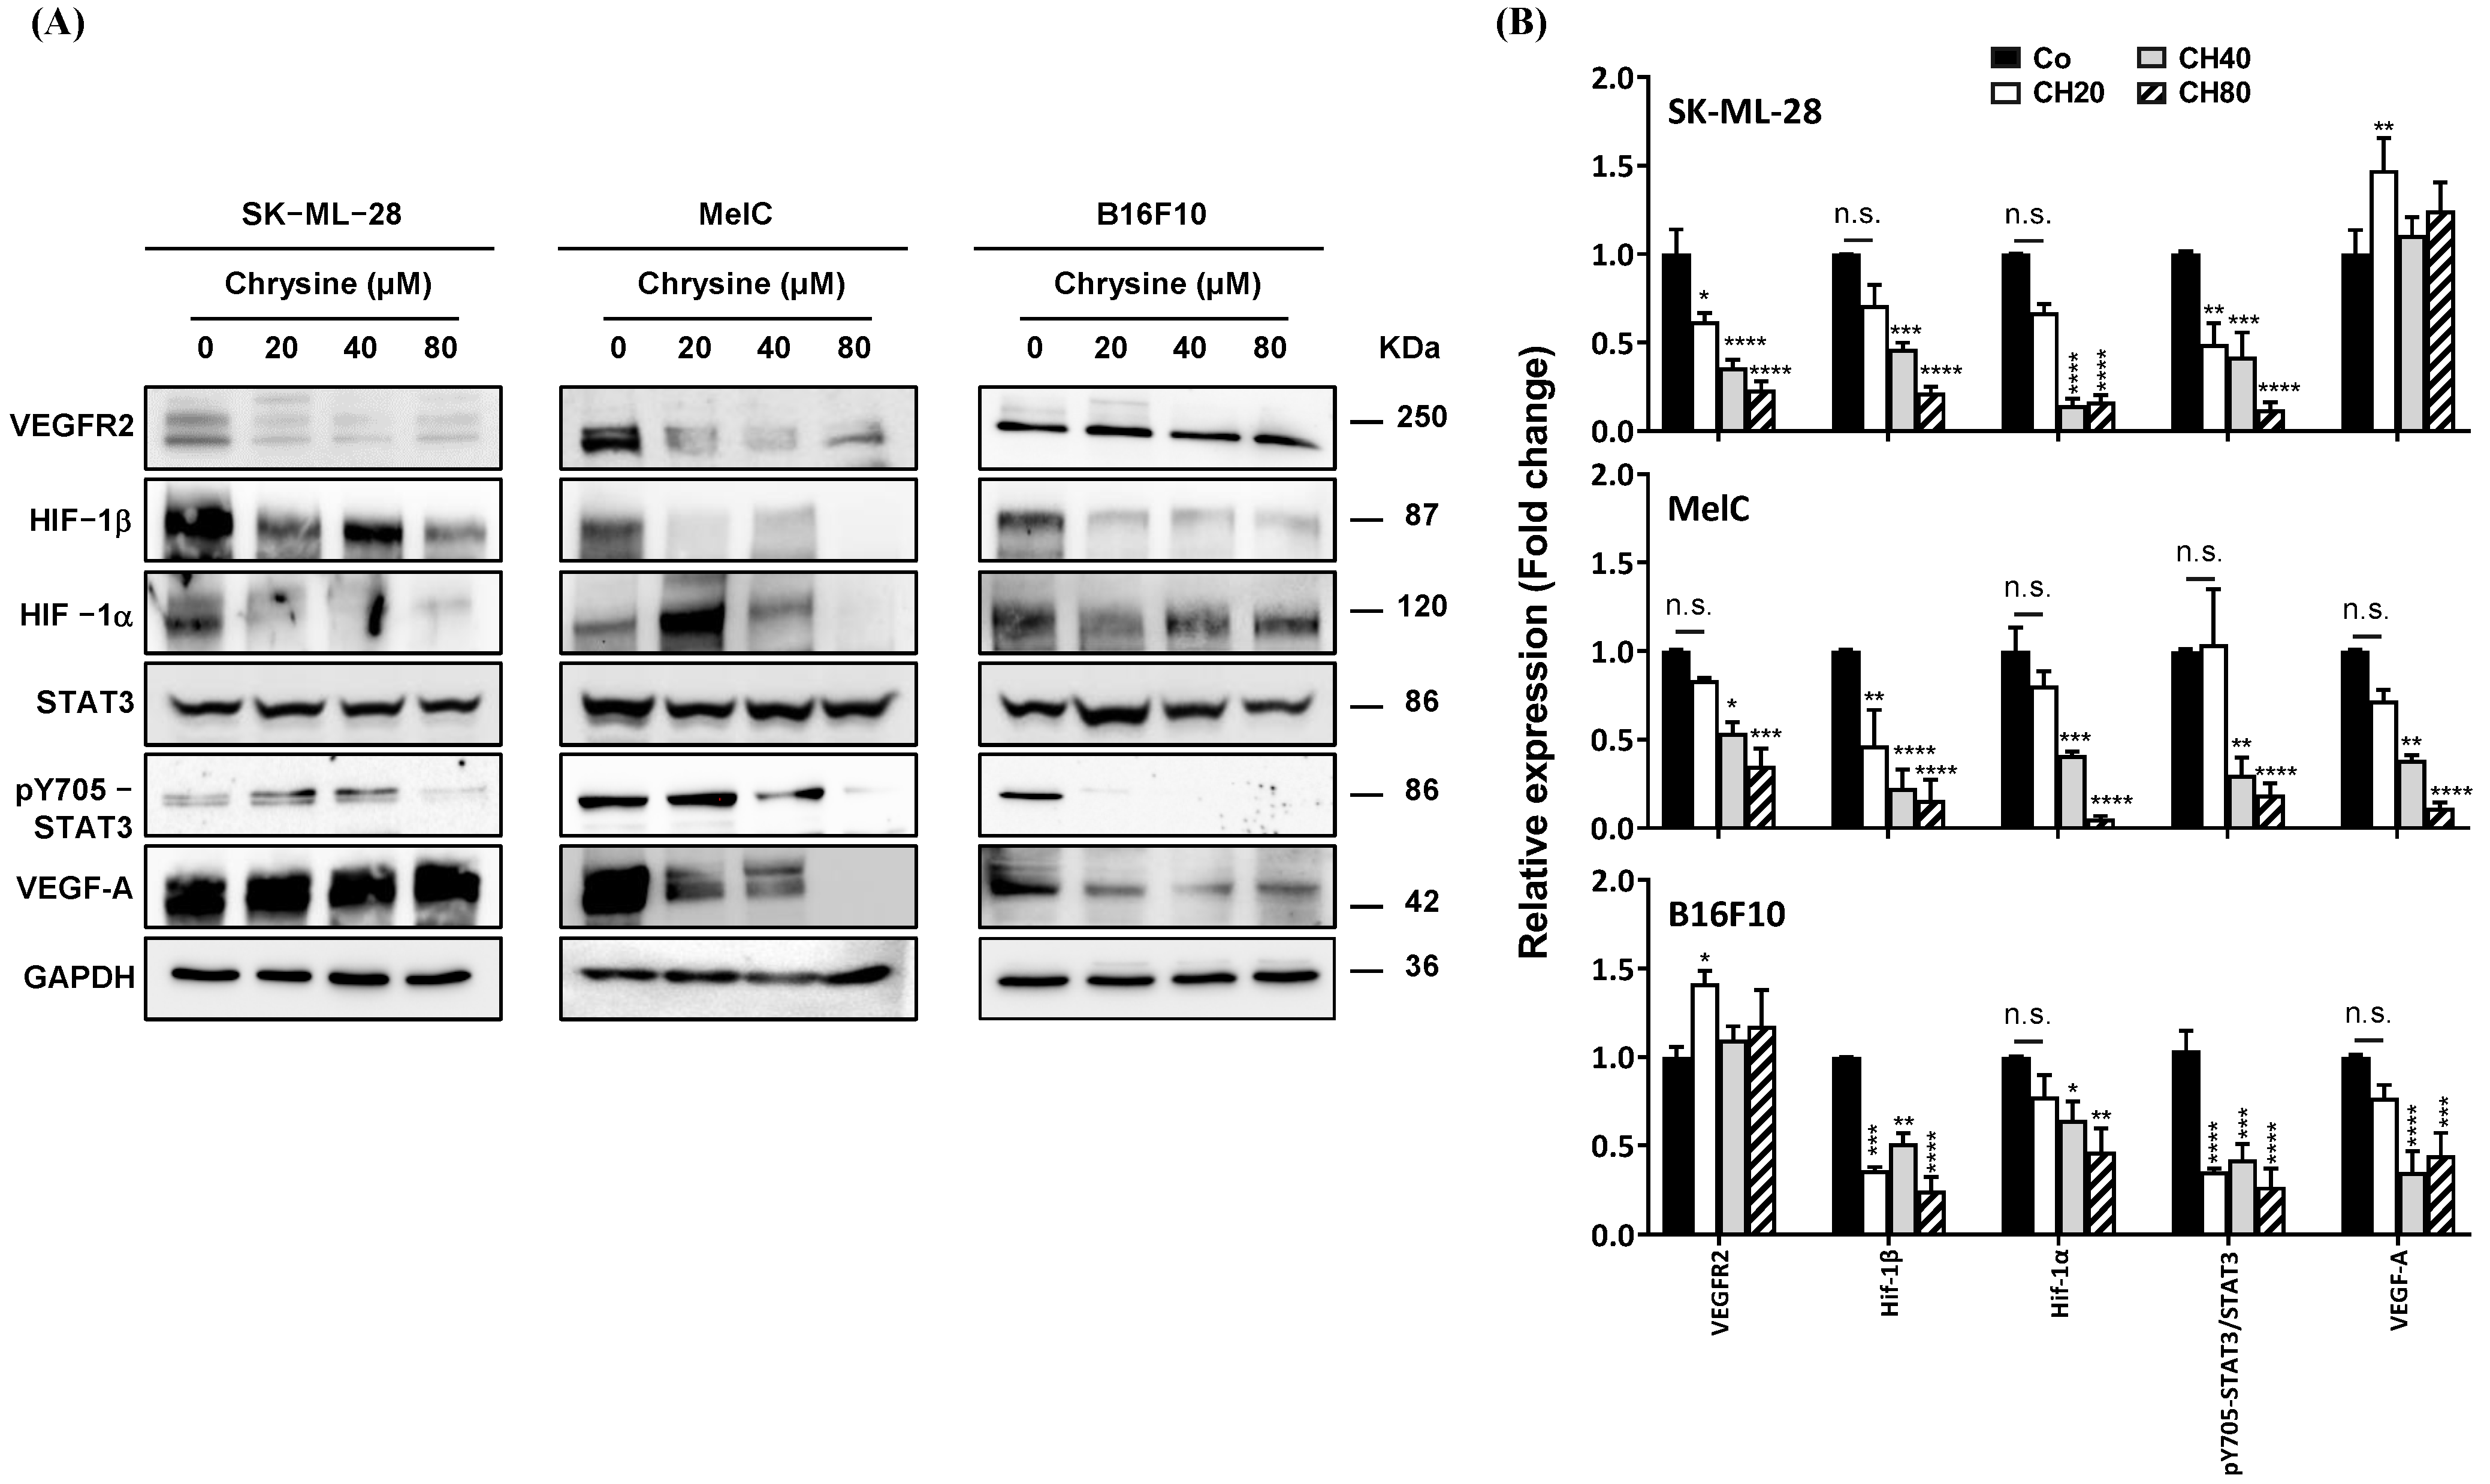
3.6. Chrysin Decreases Key Actors of Angiogenesis Pathway
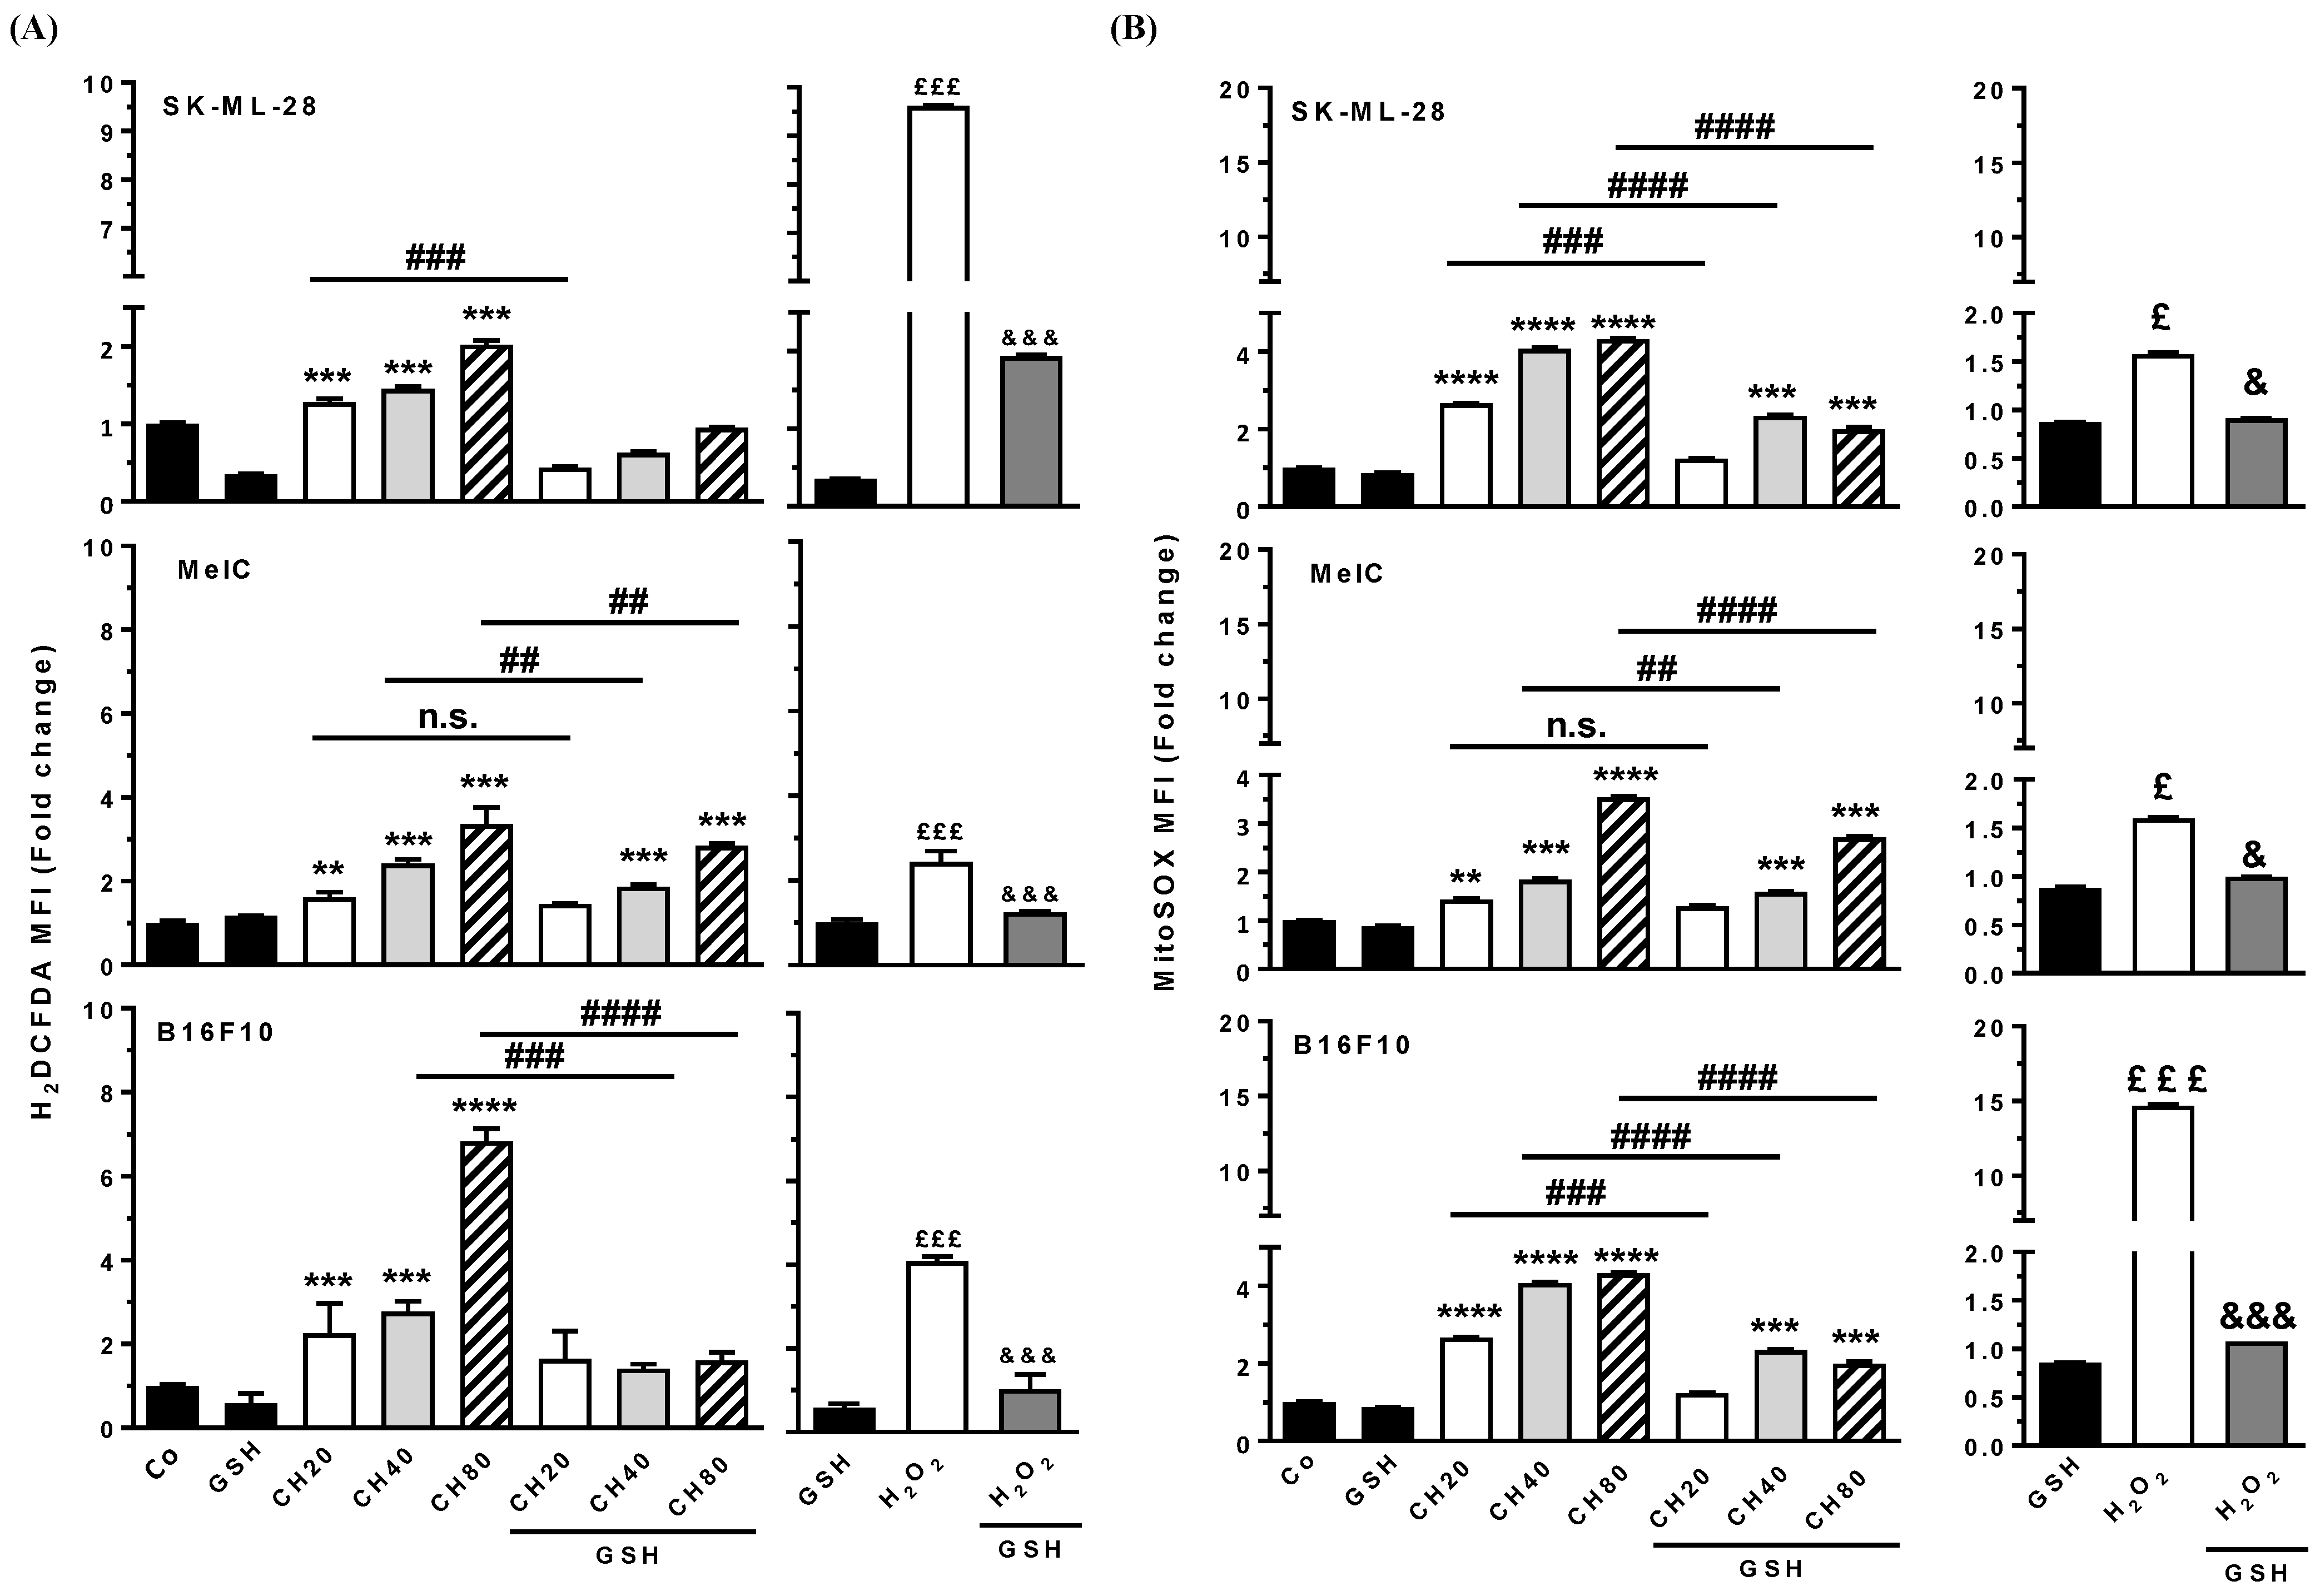
3.7. Chrysin Induces ROS Production
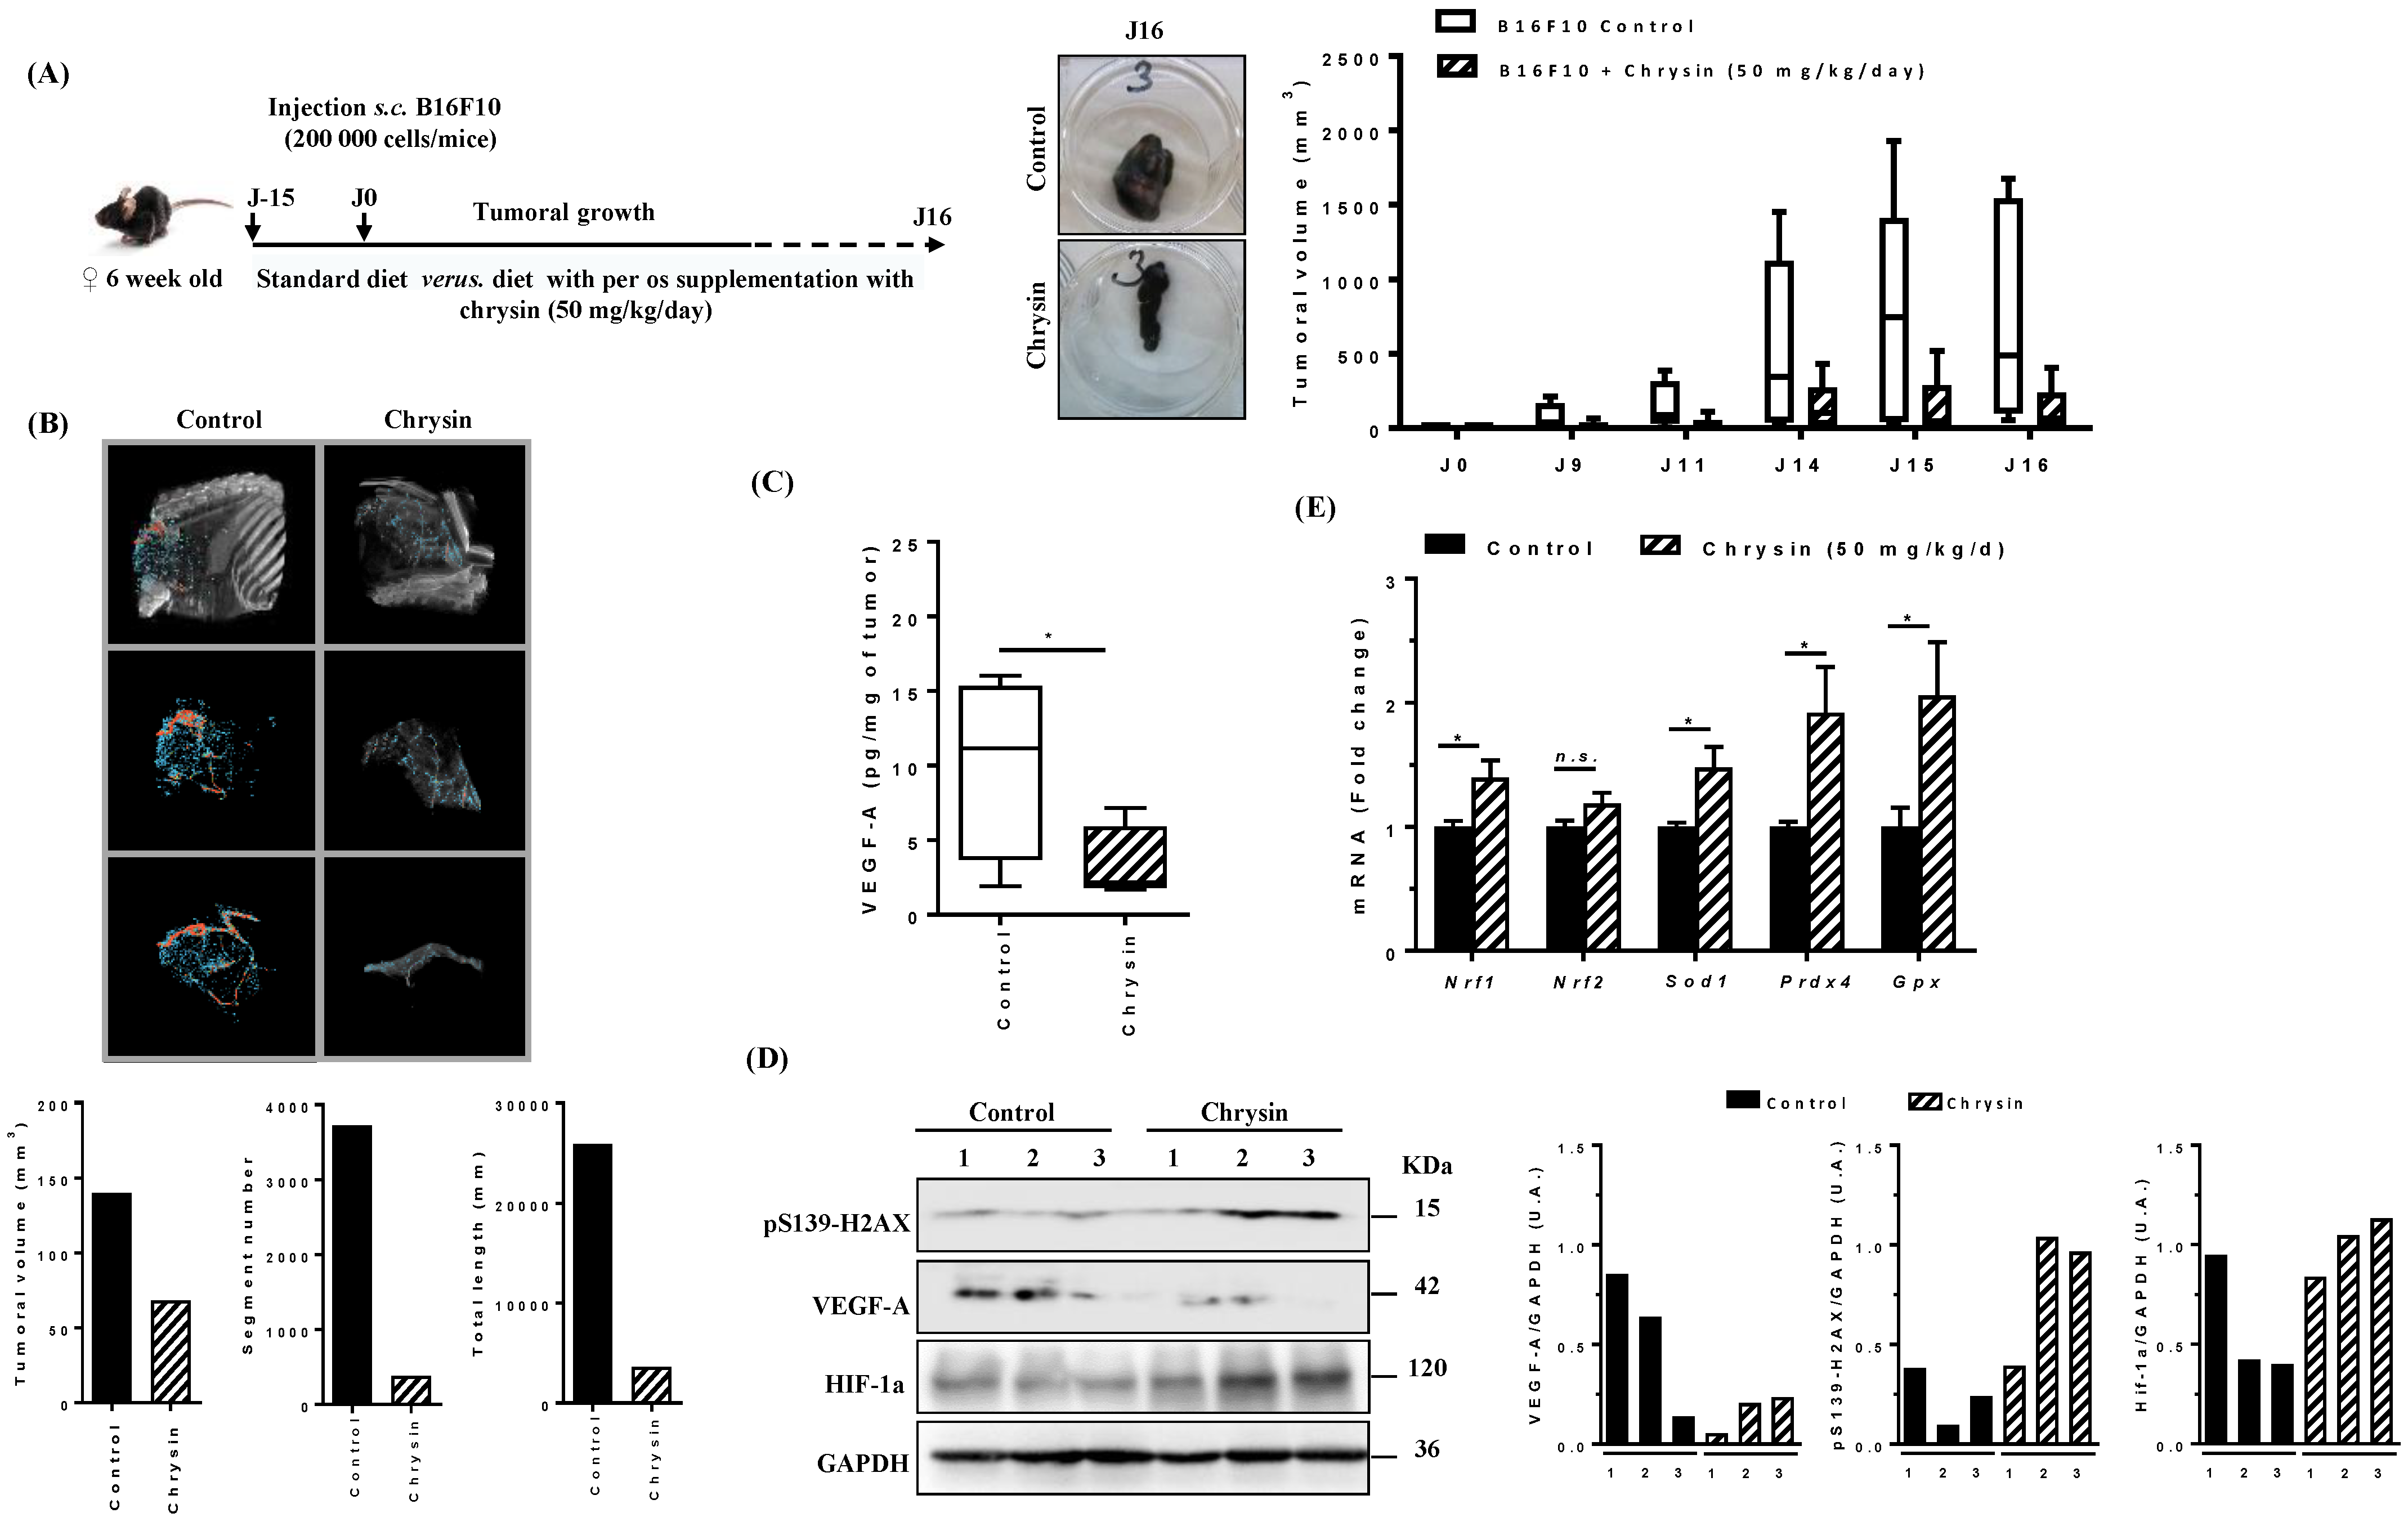
3.8. Chrysin Prevents Tumoral Growth and Angiogenesis In Vivo
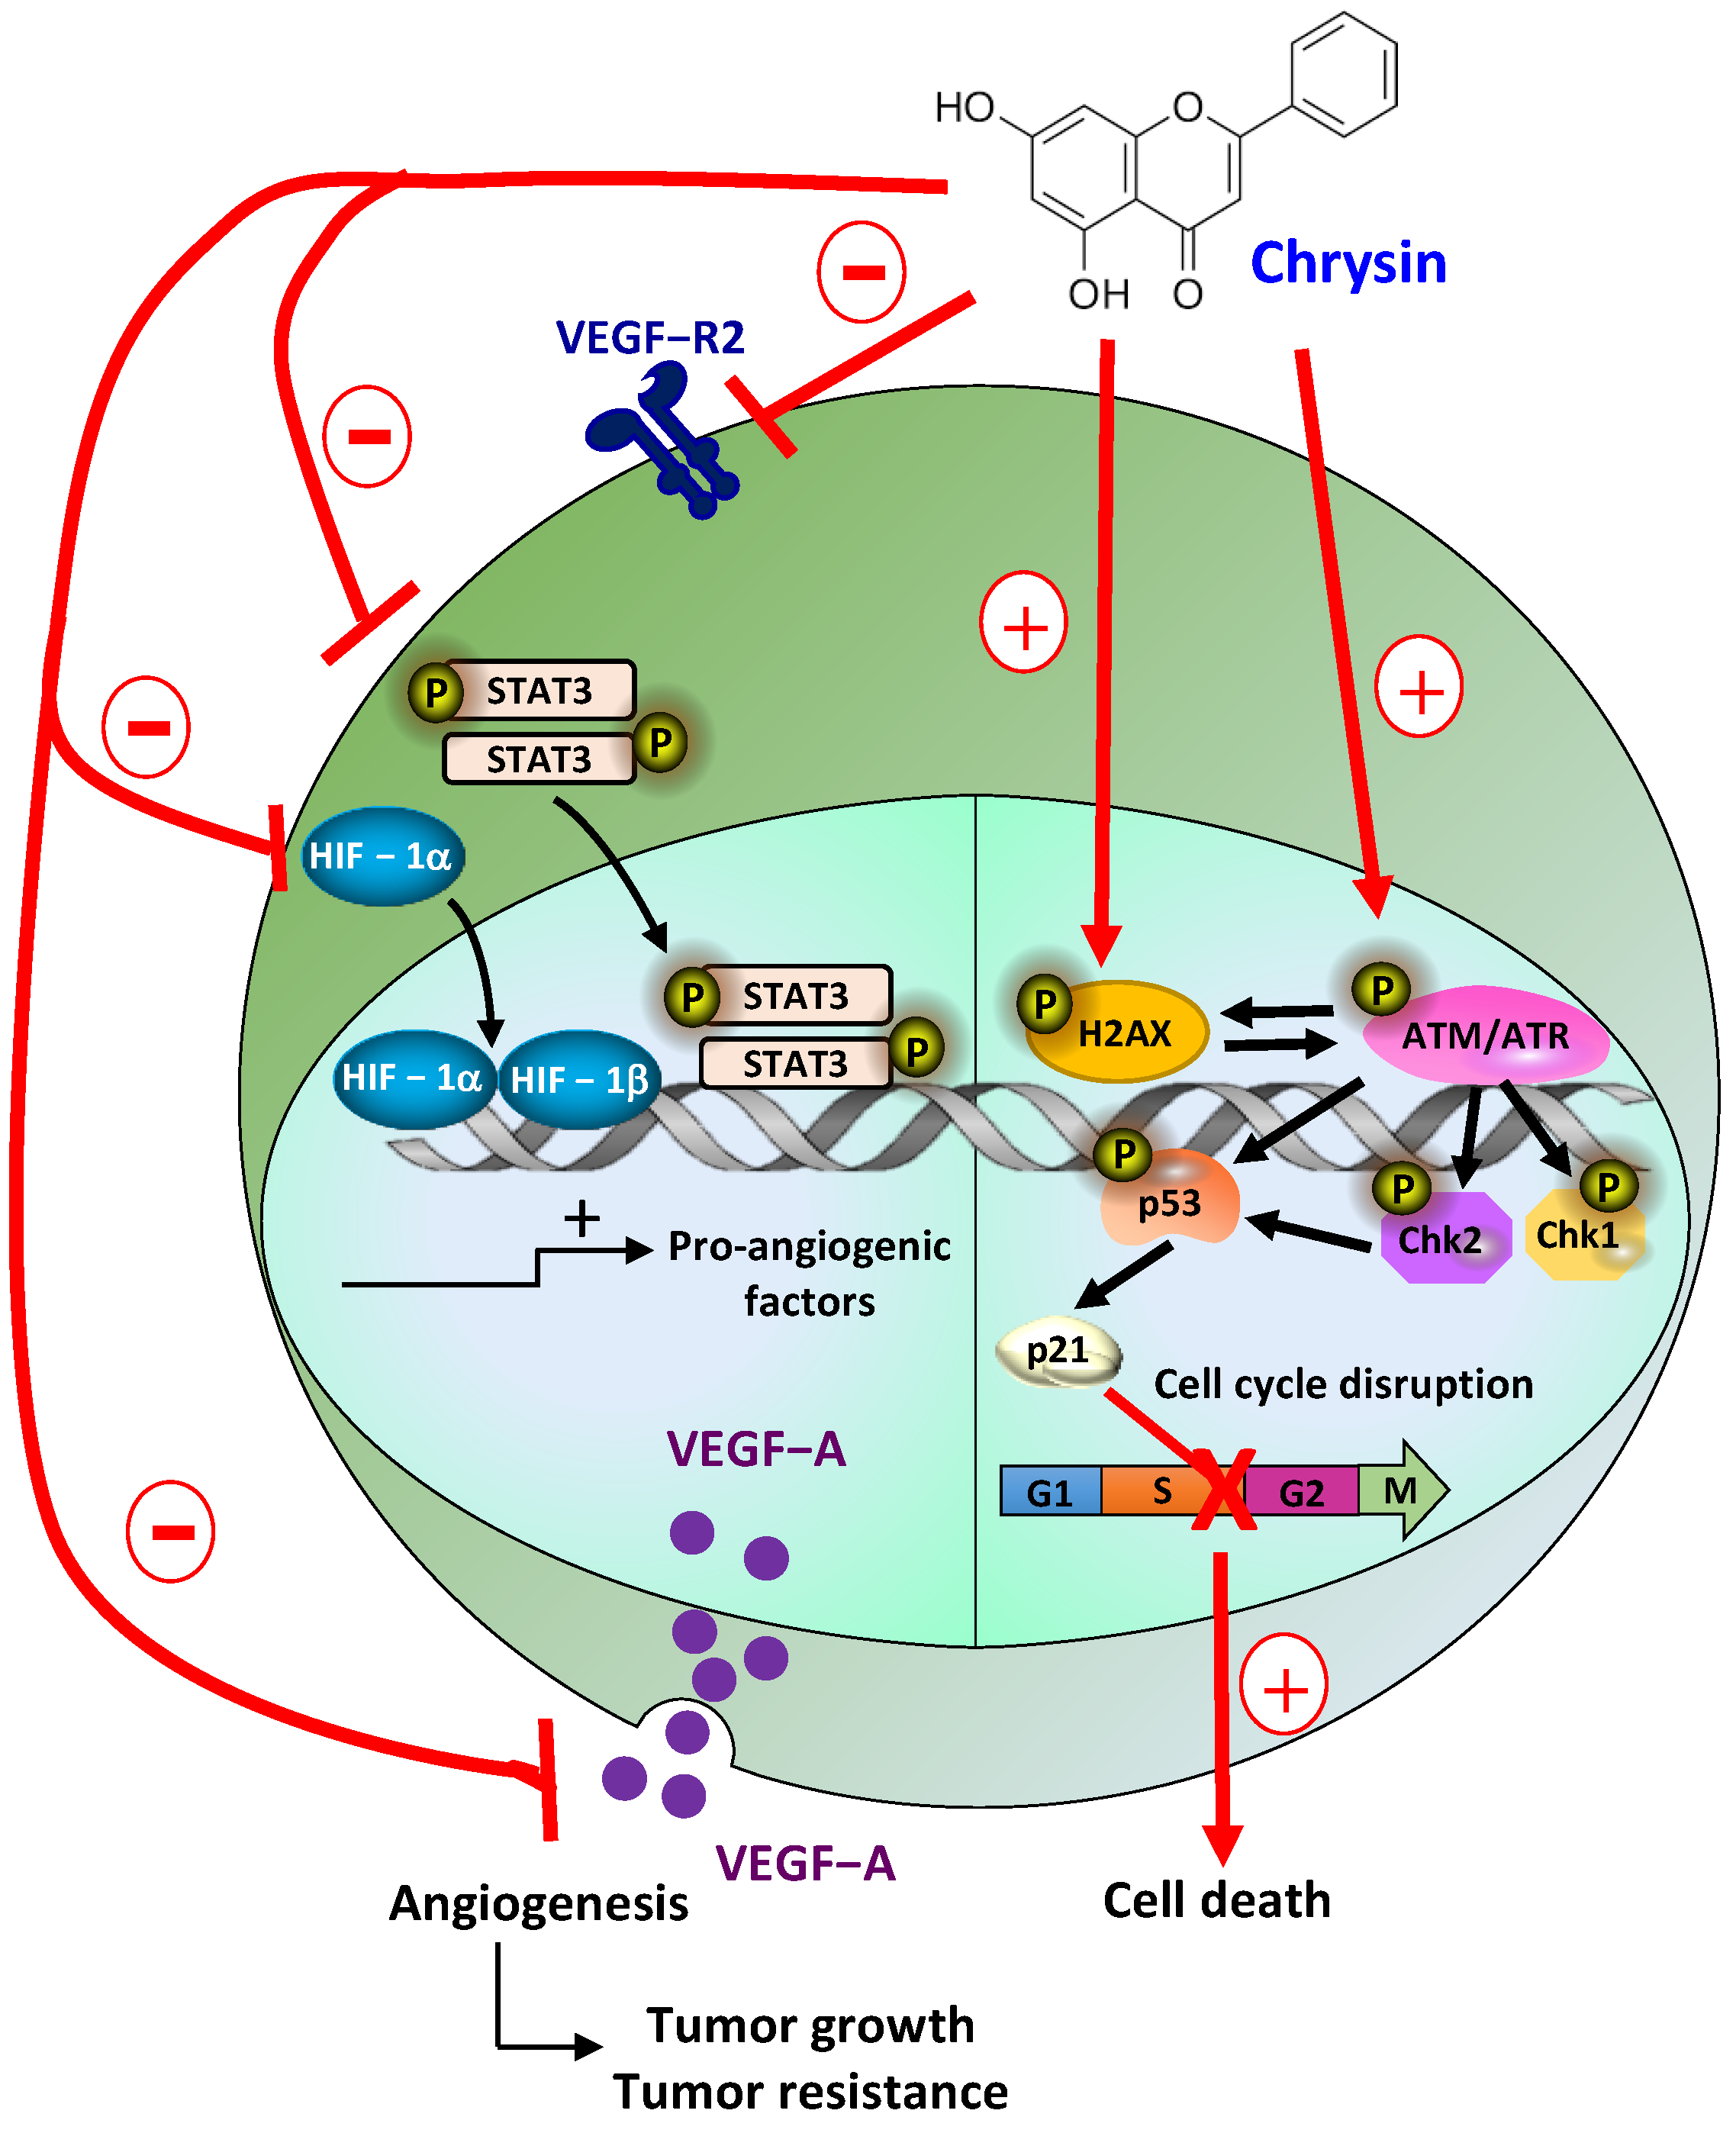
4. Discussion
5. Conclusions
Supplementary Materials
Author Contributions
Funding
Institutional Review Board Statement
Informed Consent Statement
Data Availability Statement
Acknowledgments
Conflicts of Interest
References
- Hanahan, D.; Weinberg, R.A. Hallmarks of cancer: The next generation. Cell 2011, 144, 646–674. [Google Scholar] [CrossRef] [Green Version]
- Baur, J.A.; Sinclair, D.A. Therapeutic potential of resveratrol: The in vivo evidence. Nat. Rev. Drug Discov. 2006, 5, 493–506. [Google Scholar] [CrossRef]
- Pandey, M.K.; Gupta, S.C.; Nabavizadeh, A.; Aggarwal, B.B. Regulation of cell signaling pathways by dietary agents for cancer prevention and treatment. Semin. Cancer Biol. 2017, 46, 158–181. [Google Scholar] [CrossRef]
- Ko, J.H.; Sethi, G.; Um, J.Y.; Shanmugam, M.K.; Arfuso, F.; Kumar, A.P.; Bishayee, A.; Ahn, K.S. The Role of Resveratrol in Cancer Therapy. Int. J. Mol. Sci. 2017, 18, 2589. [Google Scholar] [CrossRef] [Green Version]
- Stevens, J.F.; Revel, J.S.; Maier, C.S. Mitochondria-centric Review of Polyphenol Bioactivity in Cancer Models. Antioxid. Redox. Signal 2017, 29, 1589–1611. [Google Scholar] [CrossRef]
- Kasala, E.R.; Bodduluru, L.N.; Madana, R.M.; Athira, K.V.; Gogoi, R.; Barua, C.C. Chemopreventive and therapeutic potential of chrysin in cancer: Mechanistic perspectives. Toxicol. Lett. 2015, 233, 214–225. [Google Scholar] [CrossRef]
- Aires, V.; Delmas, D. Common pathways in health benefit properties of RSV in cardiovascular diseases, cancers and degenerative pathologies. Curr. Pharm. Biotechnol. 2015, 16, 219–244. [Google Scholar] [CrossRef]
- Aires, V.; Limagne, E.; Cotte, A.K.; Latruffe, N.; Ghiringhelli, F.; Delmas, D. Resveratrol metabolites inhibit human metastatic colon cancer cells progression and synergize with chemotherapeutic drugs to induce cell death. Mol. Nutr. Food Res. 2013, 57, 1170–1181. [Google Scholar] [CrossRef]
- Aggarwal, V.; Tuli, H.S.; Varol, A.; Thakral, F.; Yerer, M.B.; Sak, K.; Varol, M.; Jain, A.; Khan, M.A.; Sethi, G. Role of Reactive Oxygen Species in Cancer Progression: Molecular Mechanisms and Recent Advancements. Biomolecules 2019, 9, 735. [Google Scholar] [CrossRef] [Green Version]
- Obrador, E.; Liu-Smith, F.; Dellinger, R.W.; Salvador, R.; Meyskens, F.L.; Estrela, J.M. Oxidative stress and antioxidants in the pathophysiology of malignant melanoma. Biol. Chem. 2019, 400, 589–612. [Google Scholar] [CrossRef] [Green Version]
- Venza, M.; Visalli, M.; Beninati, C.; De Gaetano, G.V.; Teti, D.; Venza, I. Cellular Mechanisms of Oxidative Stress and Action in Melanoma. Oxidative Med. Cell. Longev. 2015, 2015, 481782. [Google Scholar] [CrossRef] [Green Version]
- Assi, M. The differential role of reactive oxygen species in early and late stages of cancer. Am. J. Physiol. Regul. Integr. Comp. Physiol. 2017, 313, R646–R653. [Google Scholar] [CrossRef] [Green Version]
- Pichichero, E.; Cicconi, R.; Mattei, M.; Canini, A. Chrysin-induced apoptosis is mediated through p38 and Bax activation in B16-F1 and A375 melanoma cells. Int. J. Oncol. 2011, 38, 473–483. [Google Scholar] [CrossRef] [Green Version]
- Ryu, S.; Lim, W.; Bazer, F.W.; Song, G. Chrysin induces death of prostate cancer cells by inducing ROS and ER stress. J. Cell. Physiol. 2017, 232, 3786–3797. [Google Scholar] [CrossRef]
- Brechbuhl, H.M.; Kachadourian, R.; Min, E.; Chan, D.; Day, B.J. Chrysin enhances doxorubicin-induced cytotoxicity in human lung epithelial cancer cell lines: The role of glutathione. Toxicol. Appl. Pharmacol. 2012, 258, 1–9. [Google Scholar] [CrossRef] [Green Version]
- Fu, B.; Xue, J.; Li, Z.; Shi, X.; Jiang, B.H.; Fang, J. Chrysin inhibits expression of hypoxia-inducible factor-1alpha through reducing hypoxia-inducible factor-1alpha stability and inhibiting its protein synthesis. Mol. Cancer Ther. 2007, 6, 220–226. [Google Scholar] [CrossRef] [Green Version]
- Sioud, F.; Amor, S.; Toumia, I.B.; Lahmar, A.; Aires, V.; Chekir-Ghedira, L.; Delmas, D. A New Highlight of Ephedra alata Decne Properties as Potential Adjuvant in Combination with Cisplatin to Induce Cell Death of 4T1 Breast Cancer Cells In Vitro and In Vivo. Cells 2020, 9, 362. [Google Scholar] [CrossRef]
- Colin, D.; Gimazane, A.; Lizard, G.; Izard, J.C.; Solary, E.; Latruffe, N.; Delmas, D. Effects of resveratrol analogs on cell cycle progression, cell cycle associated proteins and 5fluoro-uracil sensitivity in human derived colon cancer cells. Int. J. Cancer. 2009, 124, 2780–2788. [Google Scholar] [CrossRef] [Green Version]
- Cotte, A.K.; Aires, V.; Fredon, M.; Limagne, E.; Derangere, V.; Thibaudin, M.; Humblin, E.; Scagliarini, A.; de Barros, J.P.; Hillon, P.; et al. Lysophosphatidylcholine acyltransferase 2-mediated lipid droplet production supports colorectal cancer chemoresistance. Nat. Commun. 2018, 9, 322. [Google Scholar] [CrossRef] [Green Version]
- Monchaud, D.; Allain, C.; Bertrand, H.; Smargiasso, N.; Rosu, F.; Gabelica, V.; De Cian, A.; Mergny, J.L.; Teulade-Fichou, M.P. Ligands playing musical chairs with G-quadruplex DNA: A rapid and simple displacement assay for identifying selective G-quadruplex binders. Biochimie 2008, 90, 1207–1223. [Google Scholar] [CrossRef]
- Tawani, A.; Kumar, A. Structural Insight into the interaction of Flavonoids with Human Telomeric Sequence. Sci. Rep. 2015, 5, 17574. [Google Scholar] [CrossRef] [PubMed] [Green Version]
- Sassi, A.; Maatouk, M.; El Gueder, D.; Bzeouich, I.M.; Abdelkefi-Ben Hatira, S.; Jemni-Yacoub, S.; Ghedira, K.; Chekir-Ghedira, L. Chrysin, a natural and biologically active flavonoid suppresses tumor growth of mouse B16F10 melanoma cells: In vitro and In vivo study. Chem. Biol. Interact. 2018, 283, 10–19. [Google Scholar] [CrossRef]
- Tavakoli, F.; Jahanban-Esfahlan, R.; Seidi, K.; Jabbari, M.; Behzadi, R.; Pilehvar-Soltanahmadi, Y.; Zarghami, N. Effects of nano-encapsulated curcumin-chrysin on telomerase, MMPs and TIMPs gene expression in mouse B16F10 melanoma tumour model. Artif. Cells Nanomed. Biotechnol. 2018, 46, 75–86. [Google Scholar] [CrossRef] [PubMed] [Green Version]
- Colin, D.J.; Limagne, E.; Ragot, K.; Lizard, G.; Ghiringhelli, F.; Solary, E.; Chauffert, B.; Latruffe, N.; Delmas, D. The role of reactive oxygen species and subsequent DNA-damage response in the emergence of resistance towards resveratrol in colon cancer models. Cell Death Dis. 2014, 5, e1533. [Google Scholar] [CrossRef] [Green Version]
- Delmas, D.; Lancon, A.; Colin, D.; Jannin, B.; Latruffe, N. Resveratrol as a chemopreventive agent: A promising molecule for fighting cancer. Curr. Drug Targets 2006, 7, 423–442. [Google Scholar] [CrossRef] [PubMed]
- Podhorecka, M.; Skladanowski, A.; Bozko, P. H2AX Phosphorylation: Its Role in DNA Damage Response and Cancer Therapy. J. Nucleic Acids 2010, 2010, 920161. [Google Scholar] [CrossRef] [Green Version]
- Sharma, A.; Singh, K.; Almasan, A. Histone H2AX phosphorylation: A marker for DNA damage. Methods Mol. Biol. 2012, 920, 613–626. [Google Scholar] [CrossRef]
- Lerner, L.K.; Sale, J.E. Replication of G Quadruplex DNA. Genes 2019, 10, 95. [Google Scholar] [CrossRef] [Green Version]
- Zell, J.; Rota Sperti, F.; Britton, S.; Monchaud, D. DNA folds threaten genetic stability and can be leveraged for chemotherapy. RSC Chem. Biol. 2021, 2, 47–76. [Google Scholar] [CrossRef]
- Neidle, S. Quadruplex Nucleic Acids as Novel Therapeutic Targets. J. Med. Chem. 2016, 59, 5987–6011. [Google Scholar] [CrossRef]
- Economopoulou, M.; Langer, H.F.; Celeste, A.; Orlova, V.V.; Choi, E.Y.; Ma, M.; Vassilopoulos, A.; Callen, E.; Deng, C.; Bassing, C.H.; et al. Histone H2AX is integral to hypoxia-driven neovascularization. Nat. Med. 2009, 15, 553–558. [Google Scholar] [CrossRef] [PubMed] [Green Version]
- Tian, S.S.; Jiang, F.S.; Zhang, K.; Zhu, X.X.; Jin, B.; Lu, J.J.; Ding, Z.S. Flavonoids from the leaves of Carya cathayensis Sarg. inhibit vascular endothelial growth factor-induced angiogenesis. Fitoterapia 2014, 92, 34–40. [Google Scholar] [CrossRef] [PubMed]
- Ahn, M.R.; Kunimasa, K.; Kumazawa, S.; Nakayama, T.; Kaji, K.; Uto, Y.; Hori, H.; Nagasawa, H.; Ohta, T. Correlation between antiangiogenic activity and antioxidant activity of various components from propolis. Mol. Nutr. Food Res. 2009, 53, 643–651. [Google Scholar] [CrossRef]
- Lin, C.M.; Shyu, K.G.; Wang, B.W.; Chang, H.; Chen, Y.H.; Chiu, J.H. Chrysin suppresses IL-6-induced angiogenesis via down-regulation of JAK1/STAT3 and VEGF: An in vitro and in ovo approach. J. Agric. Food Chem. 2010, 58, 7082–7087. [Google Scholar] [CrossRef]
- Lin, C.M.; Chang, H.; Li, S.Y.; Wu, I.H.; Chiu, J.H. Chrysin inhibits lipopolysaccharide-induced angiogenesis via down-regulation of VEGF/VEGFR-2(KDR) and IL-6/IL-6R pathways. Planta Med. 2006, 72, 708–714. [Google Scholar] [CrossRef] [PubMed]
- Martins, S.G.; Zilhao, R.; Thorsteinsdottir, S.; Carlos, A.R. Linking Oxidative Stress and DNA Damage to Changes in the Expression of Extracellular Matrix Components. Front. Genet. 2021, 12, 673002. [Google Scholar] [CrossRef]
- Matsumura, Y.; Ananthaswamy, H.N. Molecular mechanisms of photocarcinogenesis. Front. Biosci. 2002, 7, 765–783. [Google Scholar] [CrossRef]
- Feinberg, A.P. The epigenetics of cancer etiology. Semin. Cancer Biol. 2004, 14, 427–432. [Google Scholar] [CrossRef]
- Singh, S.; Zafar, A.; Khan, S.; Naseem, I. Towards therapeutic advances in melanoma management: An overview. Life Sci. 2017, 174, 50–58. [Google Scholar] [CrossRef]
- Davies, H.; Bignell, G.R.; Cox, C.; Stephens, P.; Edkins, S.; Clegg, S.; Teague, J.; Woffendin, H.; Garnett, M.J.; Bottomley, W.; et al. Mutations of the BRAF gene in human cancer. Nature 2002, 417, 949–954. [Google Scholar] [CrossRef] [Green Version]
- Luke, J.J.; Flaherty, K.T.; Ribas, A.; Long, G.V. Targeted agents and immunotherapies: Optimizing outcomes in melanoma. Nat. Rev. Clin. Oncol. 2017, 14, 463–482. [Google Scholar] [CrossRef] [PubMed] [Green Version]
- Luke, J.J.; Schwartz, G.K. Chemotherapy in the management of advanced cutaneous malignant melanoma. Clin. Dermatol. 2013, 31, 290–297. [Google Scholar] [CrossRef] [Green Version]
- Geng, A.; Xu, S.; Yao, Y.; Qian, Z.; Wang, X.; Sun, J.; Zhang, J.; Shi, F.; Chen, Z.; Zhang, W.; et al. Chrysin impairs genomic stability by suppressing DNA double-strand break repair in breast cancer cells. Cell Cycle 2022, 21, 379–391. [Google Scholar] [CrossRef]
- Nagasaka, M.; Hashimoto, R.; Inoue, Y.; Ishiuchi, K.; Matsuno, M.; Itoh, Y.; Tokugawa, M.; Ohoka, N.; Morishita, D.; Mizukami, H.; et al. Anti-Tumorigenic Activity of Chrysin from Oroxylum indicum via Non-Genotoxic p53 Activation through the ATM-Chk2 Pathway. Molecules 2018, 23, 1394. [Google Scholar] [CrossRef] [PubMed] [Green Version]
- Lima, A.P.B.; Almeida, T.C.; Barros, T.M.B.; Rocha, L.C.M.; Garcia, C.C.M.; da Silva, G.N. Toxicogenetic and antiproliferative effects of chrysin in urinary bladder cancer cells. Mutagenesis 2020, 35, 361–371. [Google Scholar] [CrossRef] [PubMed]
- Belhan, S.; Ozkaraca, M.; Ozdek, U.; Komuroglu, A.U. Protective role of chrysin on doxorubicin-induced oxidative stress and DNA damage in rat testes. Andrologia 2020, 52, e13747. [Google Scholar] [CrossRef] [PubMed]
- Hansel-Hertsch, R.; Di Antonio, M.; Balasubramanian, S. DNA G-quadruplexes in the human genome: Detection, functions and therapeutic potential. Nat. Rev. Mol. Cell Biol. 2017, 18, 279–284. [Google Scholar] [CrossRef] [PubMed]
- Blasiak, J. DNA-Damaging Anticancer Drugs—A Perspective for DNA Repair-Oriented Therapy. Curr. Med. Chem. 2017, 24, 1488–1503. [Google Scholar] [CrossRef]
- Okuno, Y.; Nakamura-Ishizu, A.; Otsu, K.; Suda, T.; Kubota, Y. Pathological neoangiogenesis depends on oxidative stress regulation by ATM. Nat. Med. 2012, 18, 1208–1216. [Google Scholar] [CrossRef]


Disclaimer/Publisher’s Note: The statements, opinions and data contained in all publications are solely those of the individual author(s) and contributor(s) and not of MDPI and/or the editor(s). MDPI and/or the editor(s) disclaim responsibility for any injury to people or property resulting from any ideas, methods, instructions or products referred to in the content. |
© 2023 by the authors. Licensee MDPI, Basel, Switzerland. This article is an open access article distributed under the terms and conditions of the Creative Commons Attribution (CC BY) license (https://creativecommons.org/licenses/by/4.0/).
Share and Cite
Sassi, A.; Fredon, M.; Cotte, A.K.; Fuselier, C.; Schneider, C.; Martiny, L.; Monchaud, D.; Chekir-Ghedira, L.; Aires, V.; Delmas, D. Chrysin-Induced Regression of Angiogenesis via an Induction of DNA Damage Response and Oxidative Stress in In Vitro and In Vivo Models of Melanoma. Cells 2023, 12, 1561. https://0-doi-org.brum.beds.ac.uk/10.3390/cells12121561
Sassi A, Fredon M, Cotte AK, Fuselier C, Schneider C, Martiny L, Monchaud D, Chekir-Ghedira L, Aires V, Delmas D. Chrysin-Induced Regression of Angiogenesis via an Induction of DNA Damage Response and Oxidative Stress in In Vitro and In Vivo Models of Melanoma. Cells. 2023; 12(12):1561. https://0-doi-org.brum.beds.ac.uk/10.3390/cells12121561
Chicago/Turabian StyleSassi, Aicha, Maxime Fredon, Alexia K. Cotte, Camille Fuselier, Christophe Schneider, Laurent Martiny, David Monchaud, Leila Chekir-Ghedira, Virginie Aires, and Dominique Delmas. 2023. "Chrysin-Induced Regression of Angiogenesis via an Induction of DNA Damage Response and Oxidative Stress in In Vitro and In Vivo Models of Melanoma" Cells 12, no. 12: 1561. https://0-doi-org.brum.beds.ac.uk/10.3390/cells12121561