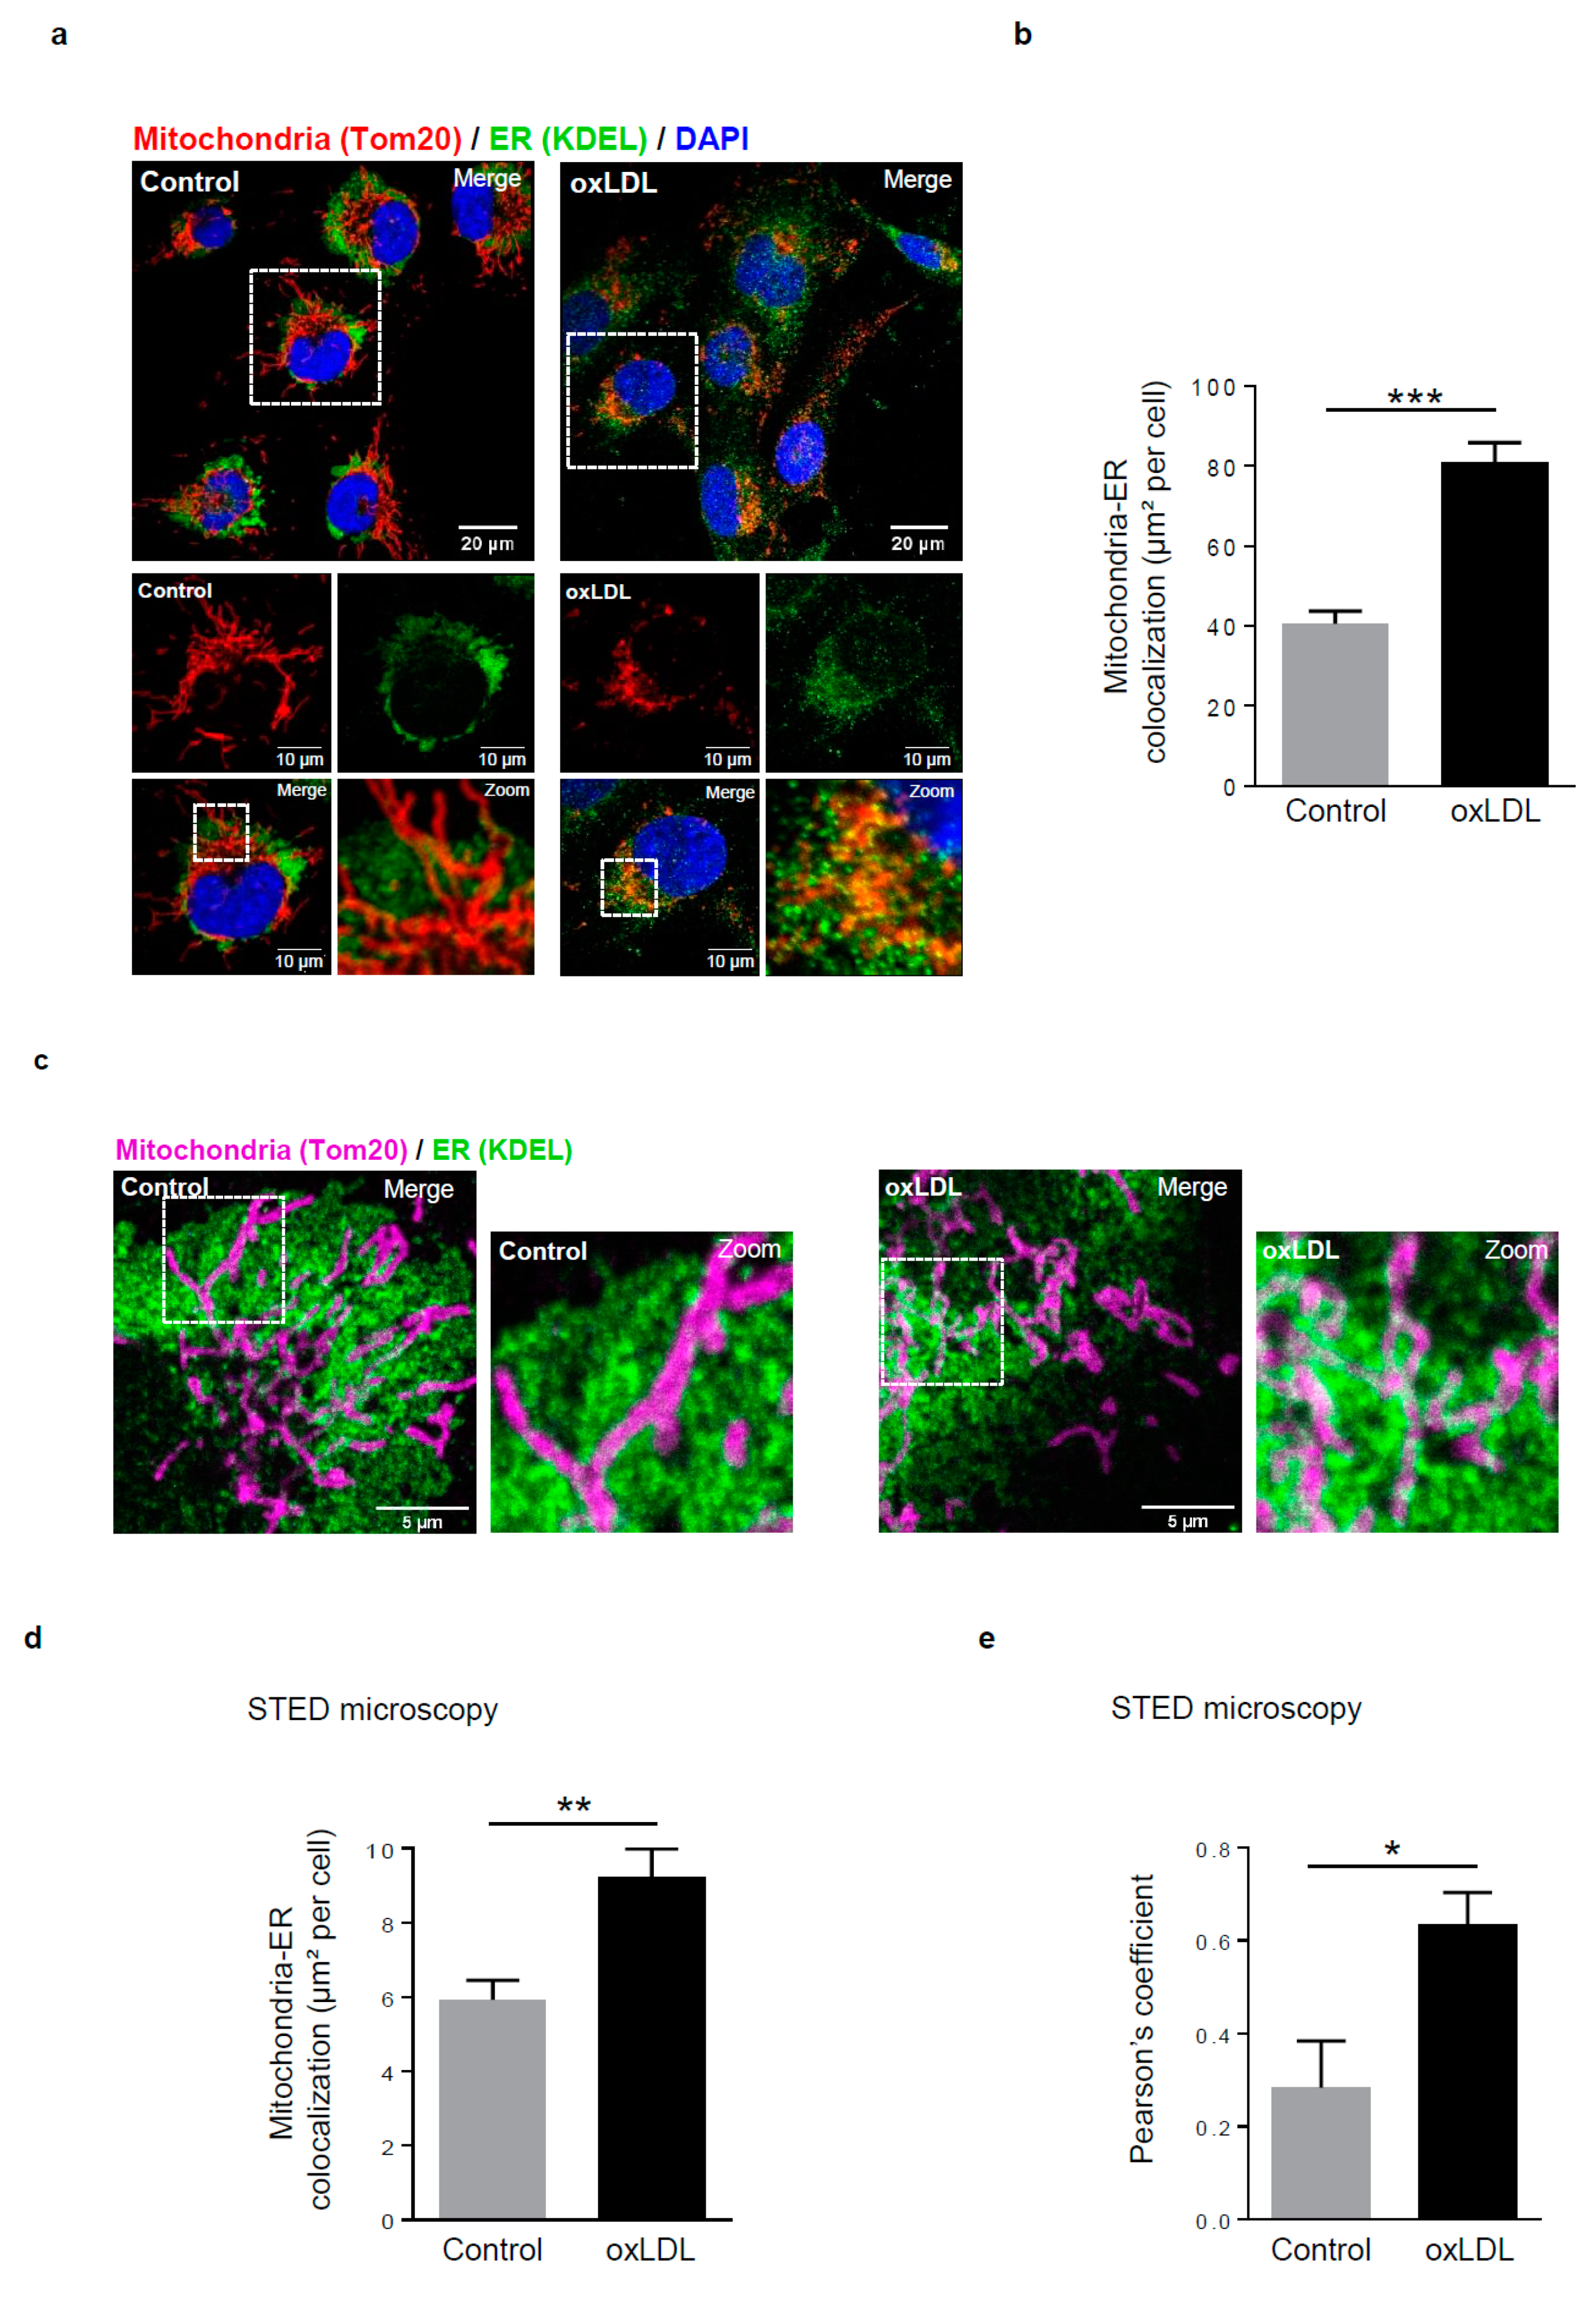
Figure 1.
Mitochondria-ER contact sites are increased in response to oxidized low-density lipoproteins (LDL) stimulation in human vascular smooth muscle cells (hVSMCs). (a) Representative images of mitochondria (Tom20, red) and ER (KDEL, green) contacts in hVSMCs at baseline conditions (Control) or stimulated with oxidized LDL (oxLDL, 200 µg ApoB/mL, 5 h). Images were obtained with an LSM 780 confocal microscope, scale bar 20 µm, zoom scale bar 10 µm. (b) Analysis of the colocalization area between mitochondria and ER using Image J software. The graph represents the mean ± SEM of 10 cells analyzed per experiment for each condition (n = 3; Student’s t test, *** p < 0.001). (c) Representative images of mitochondria (Tom20, magenta) and ER (KDEL, green) contacts in hVSMCs at baseline conditions (Control) or stimulated with oxidized LDL (oxLDL, 200 µg ApoB/mL, 5 h). Images were obtained with the high-resolutive stimulated emission depletion (STED) technology on a SP8 confocal microscope, scale bar 5 µm. (d) The colocalization area between mitochondria and ER and (e) the Pearson’s colocalization coefficient were measured with Image J software. The graphs represent the mean ± SEM of 8 cells analyzed per experiment for each condition (n = 3; Student’s t and Mann–Whitney tests, * p < 0.05, ** p < 0.01).
![Cells 08 00638 g001]()
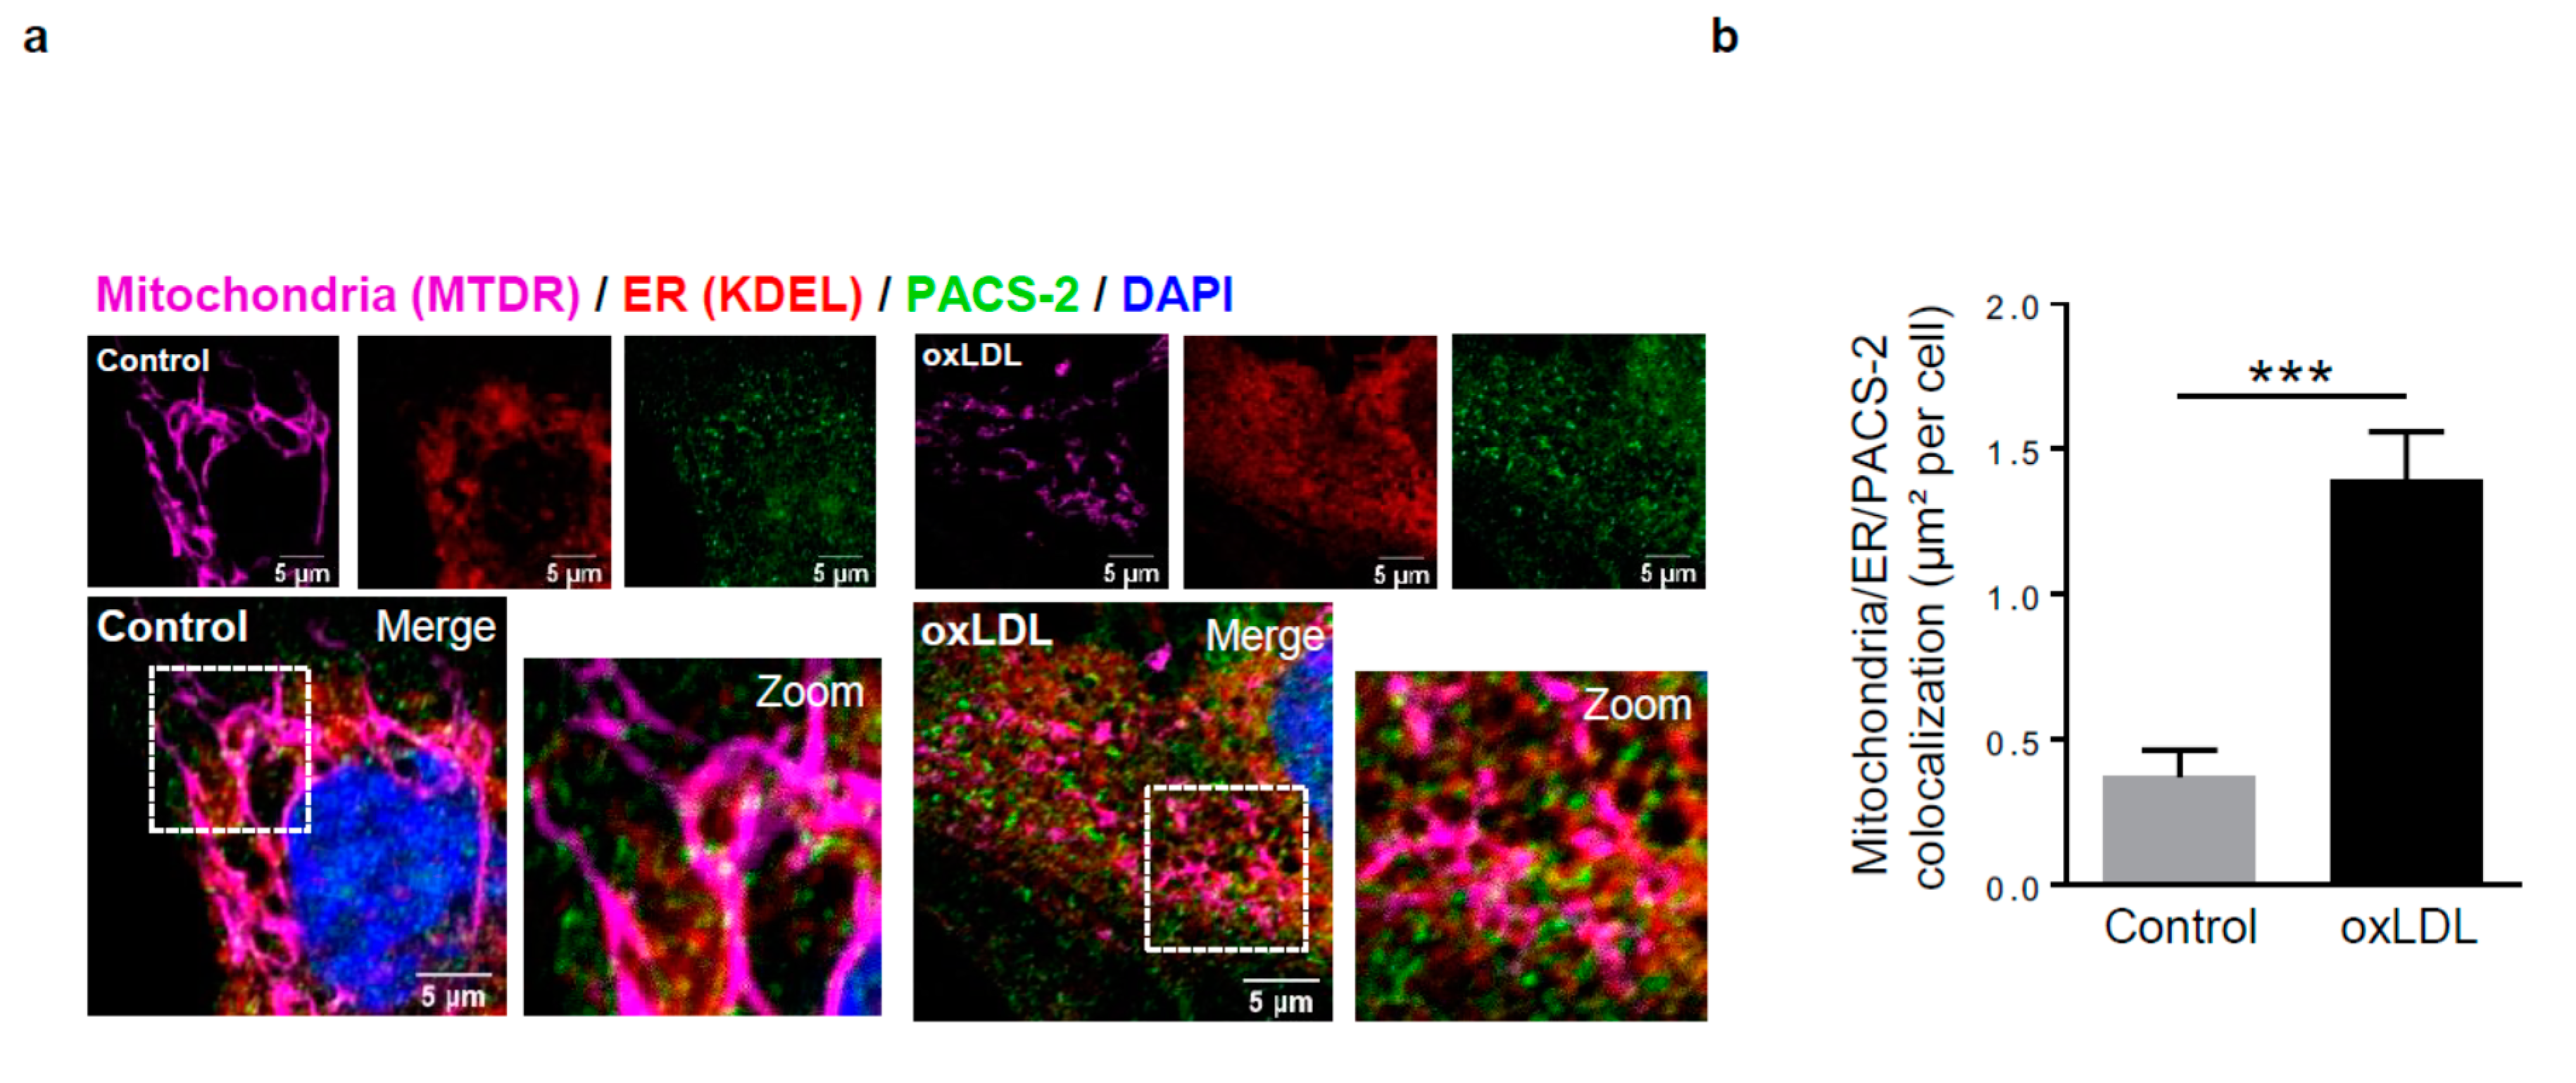
Figure 2.
Phosphofurin acidic cluster sorting protein 2 (PACS-2) accumulates at mitochondria-ER contact sites in response to oxidized LDL in hVSMCs and is required for mitochondria-associated ER membranes (MAM) interaction. (a) Representative images of mitochondria (Mitotracker Deep Red, MTDR, magenta), ER (KDEL, red) and PACS-2 (green) in hVSMCs at baseline conditions (Control) or stimulated with oxidized LDL (oxLDL, 200 µg ApoB/mL, 5 h). Images were obtained with an LSM 780 confocal microscope, scale bar 5 µm. (b) Analysis of the colocalization area between mitochondria, ER, and PACS-2 using Image J software. The graph represents the mean ± SEM of 10 cells analyzed per experiment for each condition (n = 3, Mann–Whitney test, *** p < 0.001). (c) Western-blot analysis of PACS-2 time course expression in hVSMCs stimulated with oxidized LDL (oxLDL, 200 µg ApoB/mL). (d) The graph represents the densitometric analysis of the expression level of the PACS-2 protein. The data are expressed as mean ± SEM of four independent experiments (one-way ANOVA test, ns, non-significant). (e) (right panel), western-blot analysis of PACS-2 and mitofusin 2 (MFN2) expression levels in hVSMCs after siRNA transfection (scr, scrambled); (left panel), Representative images of the interactions between two MAM proteins, voltage-dependent anion channel 1 (VDAC1) and inositol 1,4,5-trisphosphate receptor type 1 (IP3R1) (red dots), obtained by a proximity ligation assay (PLA). hVSMCs were transfected with scrambled siRNA (siScr), PACS-2 siRNA (siPACS-2) or MFN2 siRNA (siMFN2) and stimulated or not with oxidized LDL (oxLDL, 200 µg ApoB/mL, 5 h). Images were obtained with an LSM 780 confocal microscope. (f) The number of VDAC1/IP3R1 interactions per cell was analyzed using Image J software, the graph represents the mean ± SEM of 10 wide field images per experiment for each condition (n = 3; two-way ANOVA with treatment (*) and siRNA (#) as category factors and Tukey’s post-hoc test, ** p < 0.01, ### p < 0.001, ns, non-significant).
![Cells 08 00638 g002a]()
![Cells 08 00638 g002b]()
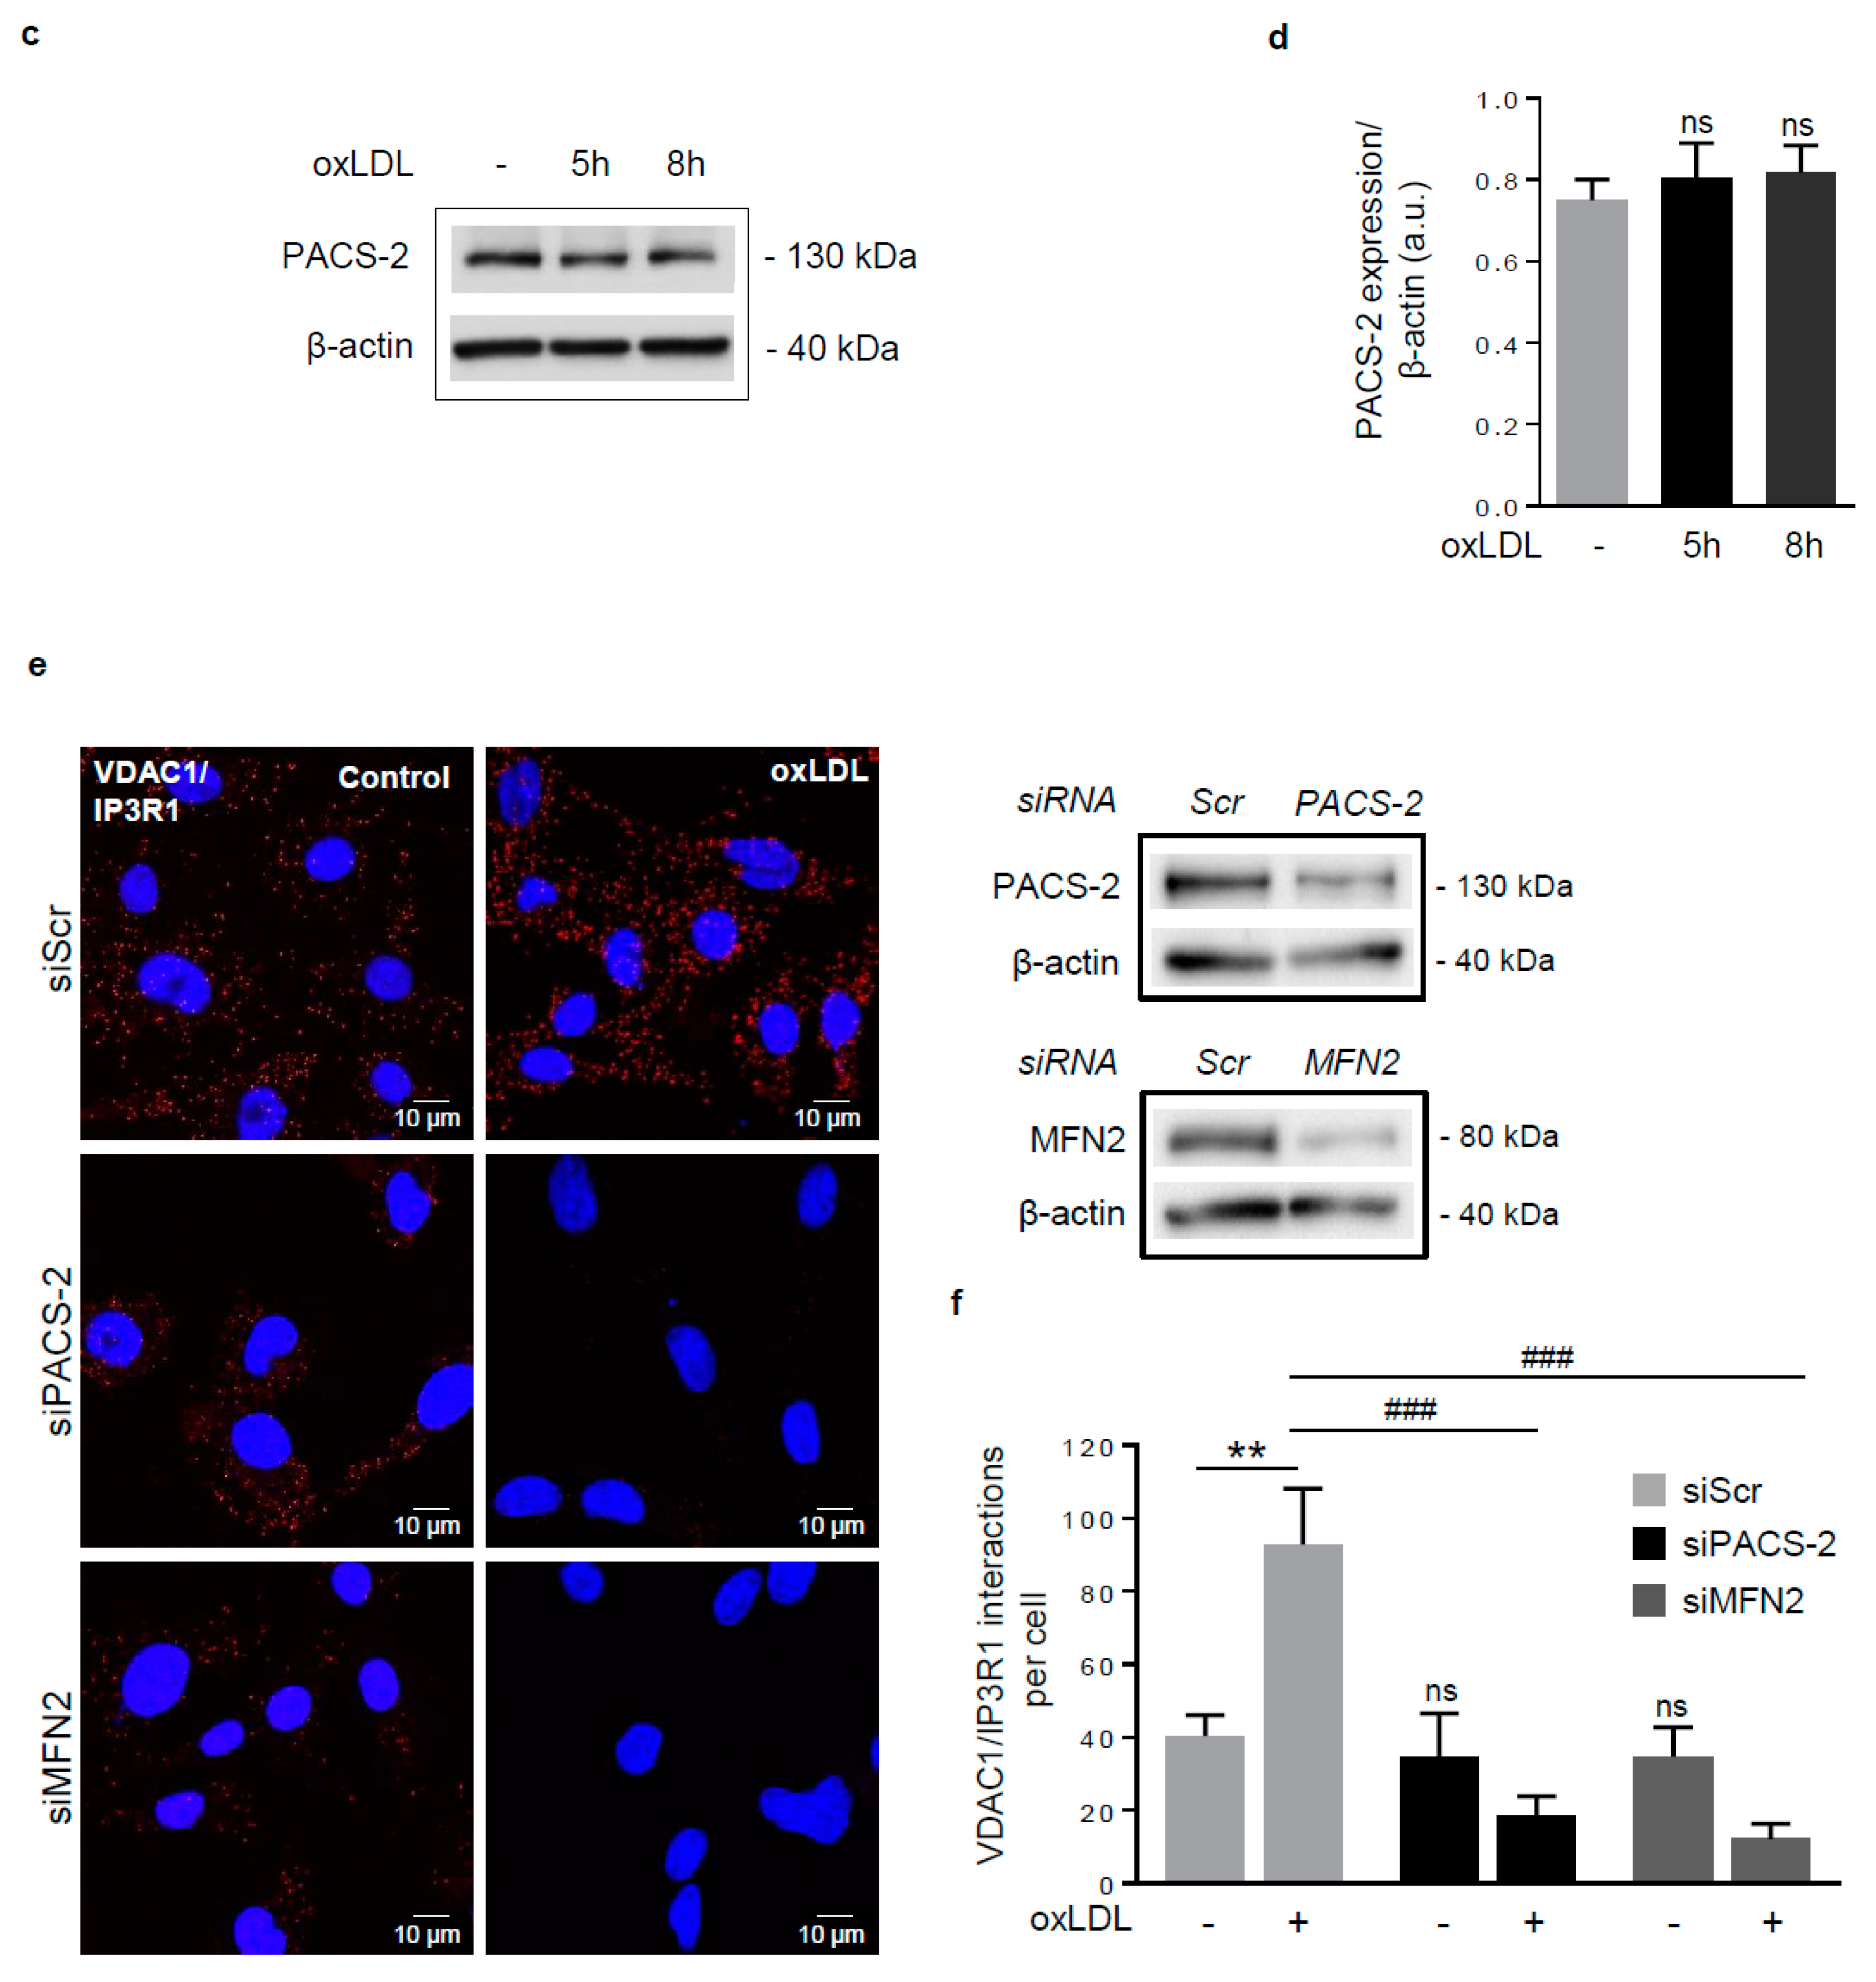
Figure 3.
Dysfunctional mitochondria form MAM contact sites in response to oxidized LDL. (a) Respiratory chain complexes I+III activities were measured in hVSMCs treated or not (Control) with oxidized LDL (oxLDL, 200 µg ApoB/mL, 5 h) or carbonyl cyanide 3-chlorophenylhydrazone (CCCP) (20 µM). The graph represents the mean ± SEM of the absorbance at 550 nm of reduced cytochrome c in presence of NADH substrate (n = 4; Kruskall–Wallis test, * p < 0.05, ** p < 0.01). (b) Seahorse profile for oxygen consumption rate (OCR) in hVSMCs treated or not (Control) with oxidized LDL (oxLDL, 200 µg ApoB/mL, 5 h) following treatment with oligomycin, carbonyl cyanide 4-(trifluoromethoxy) phenylhydrazone (FCCP), and antimycin A/rotenone. Data are the mean ± SEM (n = 5). (c) Graphs represent the basal respiration (last rate measurement before first injection—non mitochondrial respiration rate), the maximal respiration (maximal rate measurement after FCCP injection—non mitochondrial respiration rate), and ATP production (last rate measurement before first injection—minimum rate measurement after oligomycin injection) in hVSMCs treated or not (Control) with oxidized LDL (oxLDL, 200 µg ApoB/mL, 5 h). Data are the mean ± SEM (n = 5; Wilcoxon test, * p < 0.05). (d) Imaging of MitoTimer, hVSMCs were transfected with a SIN-PGK-MitoTimer plasmid and exposed or not (Control) to oxidized LDL (oxLDL, 200 µg ApoB/mL, 5 h). Merged images of the green and red channels are shown; smaller insets show the green and red channels—scale bar 10 µm. (e) Red/green fluorescent ratio quantification of 10 cells analyzed per experiment for each condition (mean ± SEM; n = 3, Student’s t test, *** p < 0.001). (f) Representative images of PACS-2 (magenta) and MitoTimer (green and red) in hVSMCs at baseline conditions (Control) or stimulated with oxidized LDL (oxLDL, 200 µg ApoB/mL, 5 h). Images were obtained with an LSM 780 confocal microscope, scale bar 5 µm. (g) Red/green fluorescent ratio quantification was performed for mitochondria colocalized or not with PACS-2. Analyses were done with Image J software, and the graph represents the mean ± SEM of 10 cells analyzed per experiment for each condition (n = 3, two-way ANOVA with treatment (*) and mitochondria/PACS-2 colocalization (#) as category factors and Tukey’s post-hoc test, ** p < 0.01, *** p < 0.001, # p < 0.05).
![Cells 08 00638 g003]()
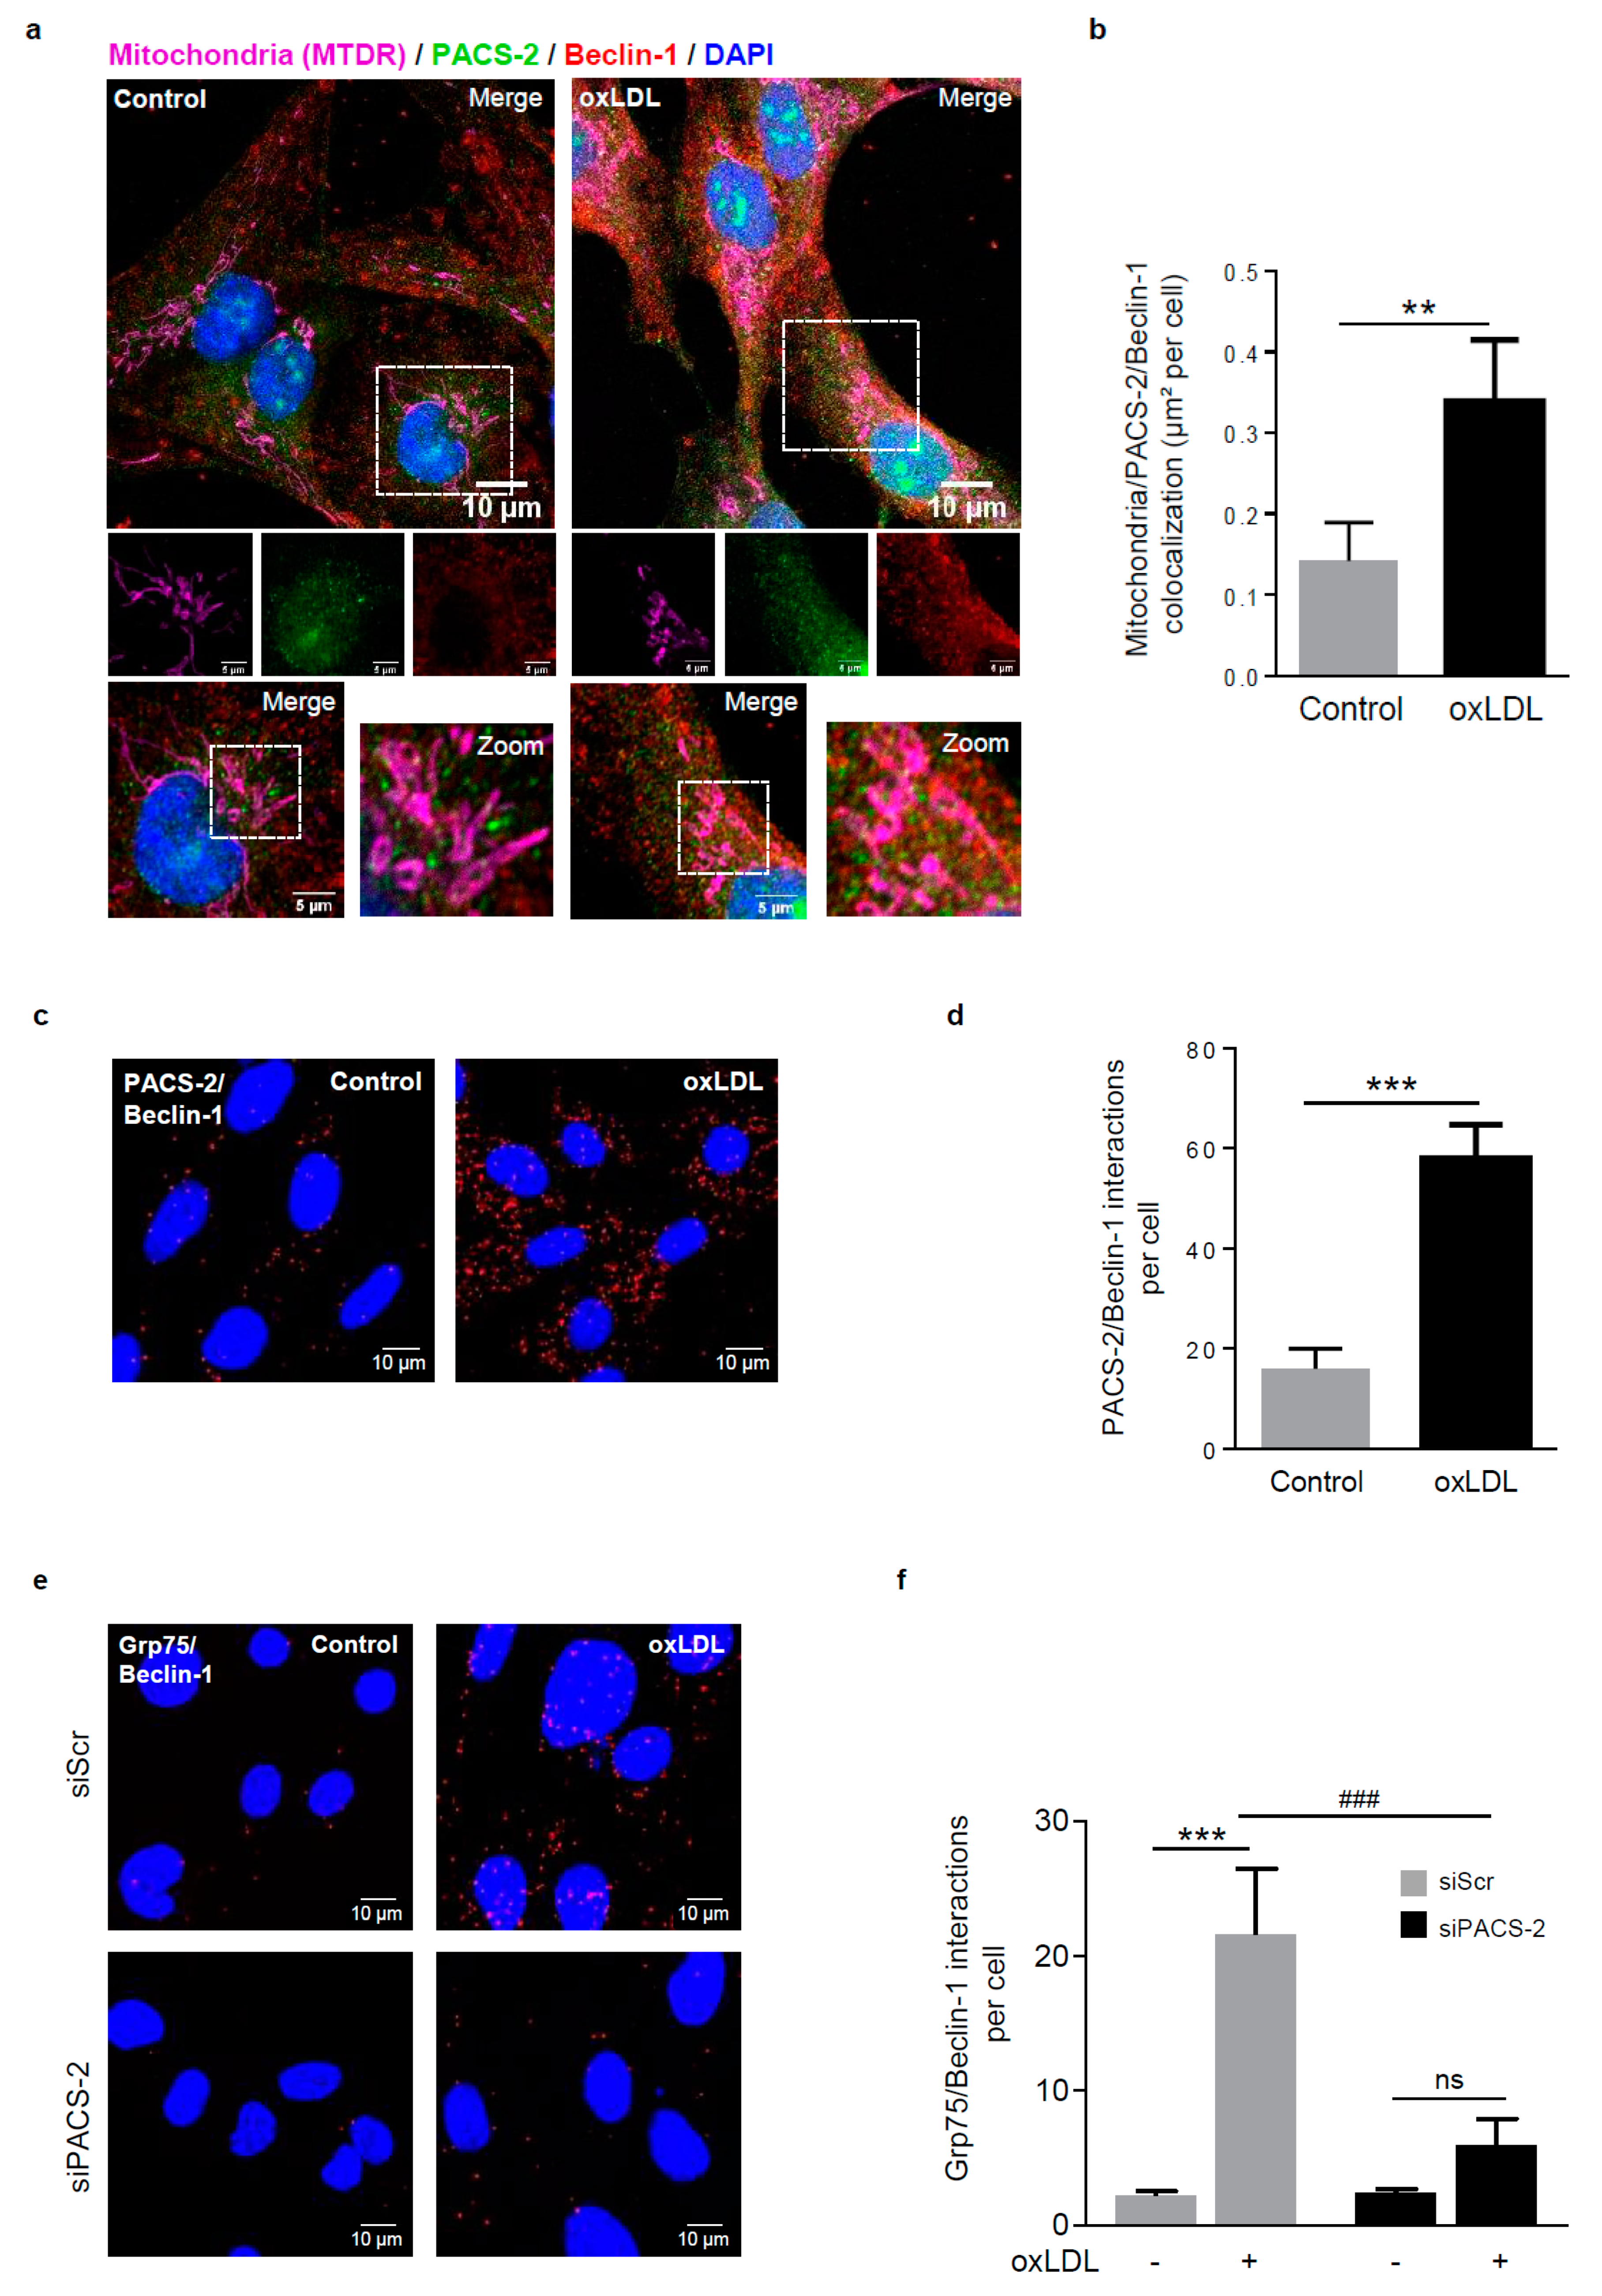
Figure 4.
Autophagosome formation during mitophagy requires PACS-2 and MAM contact sites in hVSMCs. (a) Representative images of mitochondria (MTDR, magenta), PACS-2 (green) and Beclin-1 (red) in hVSMCs at baseline conditions (Control) or stimulated with oxidized LDL (oxLDL, 200 µg ApoB/mL, 5 h). Images were obtained with an LSM 780 confocal microscope, scale bar 10 µm, zoom scale bar 5 µm. (b) Analysis of the colocalization area between mitochondria, PACS-2, and Beclin-1 using Image J software. The graph represents the mean ± SEM of 10 cells analyzed per experiment for each condition (n = 3, Mann–Whitney test, ** p < 0.01). (c) Representative images of the interactions between PACS-2 and Beclin-1 (red dots) obtained by a proximity ligation assay (PLA) in hVSMCs stimulated or not (Control) with oxidized LDL (oxLDL, 200 µg ApoB/mL, 5 h). Images were obtained with an LSM 780 confocal microscope. (d) The number of PACS-2/Beclin-1 interactions per cell was analyzed using Image J software; the graph represents the mean ± SEM of five wide field images per experiment for each condition (n = 4; Mann–Whitney test, *** p < 0.001). (e) Representative images of the interactions between glucose-regulated protein 75 (GRP75) and Beclin-1 (red dots) obtained by proximity ligation assay (PLA). hVSMCs were transfected with scrambled siRNA (siScr) or siRNA PACS-2 (siPACS-2) and stimulated or not (Control) with oxidized LDL (oxLDL, 200 µg ApoB/mL, 5 h). Images were obtained with an LSM 780 confocal microscope. (f) The number of GRP75/Beclin-1 interactions per cell was analyzed using Image J software, the graph represents the mean ± SEM of 5 wide field images per experiment for each condition (n = 3; two-way ANOVA with treatment (*) and siRNA (#) as category factors and Tukey’s post-hoc test, ***p < 0.001, ### p < 0.001, ns, non-significant).
![Cells 08 00638 g004]()
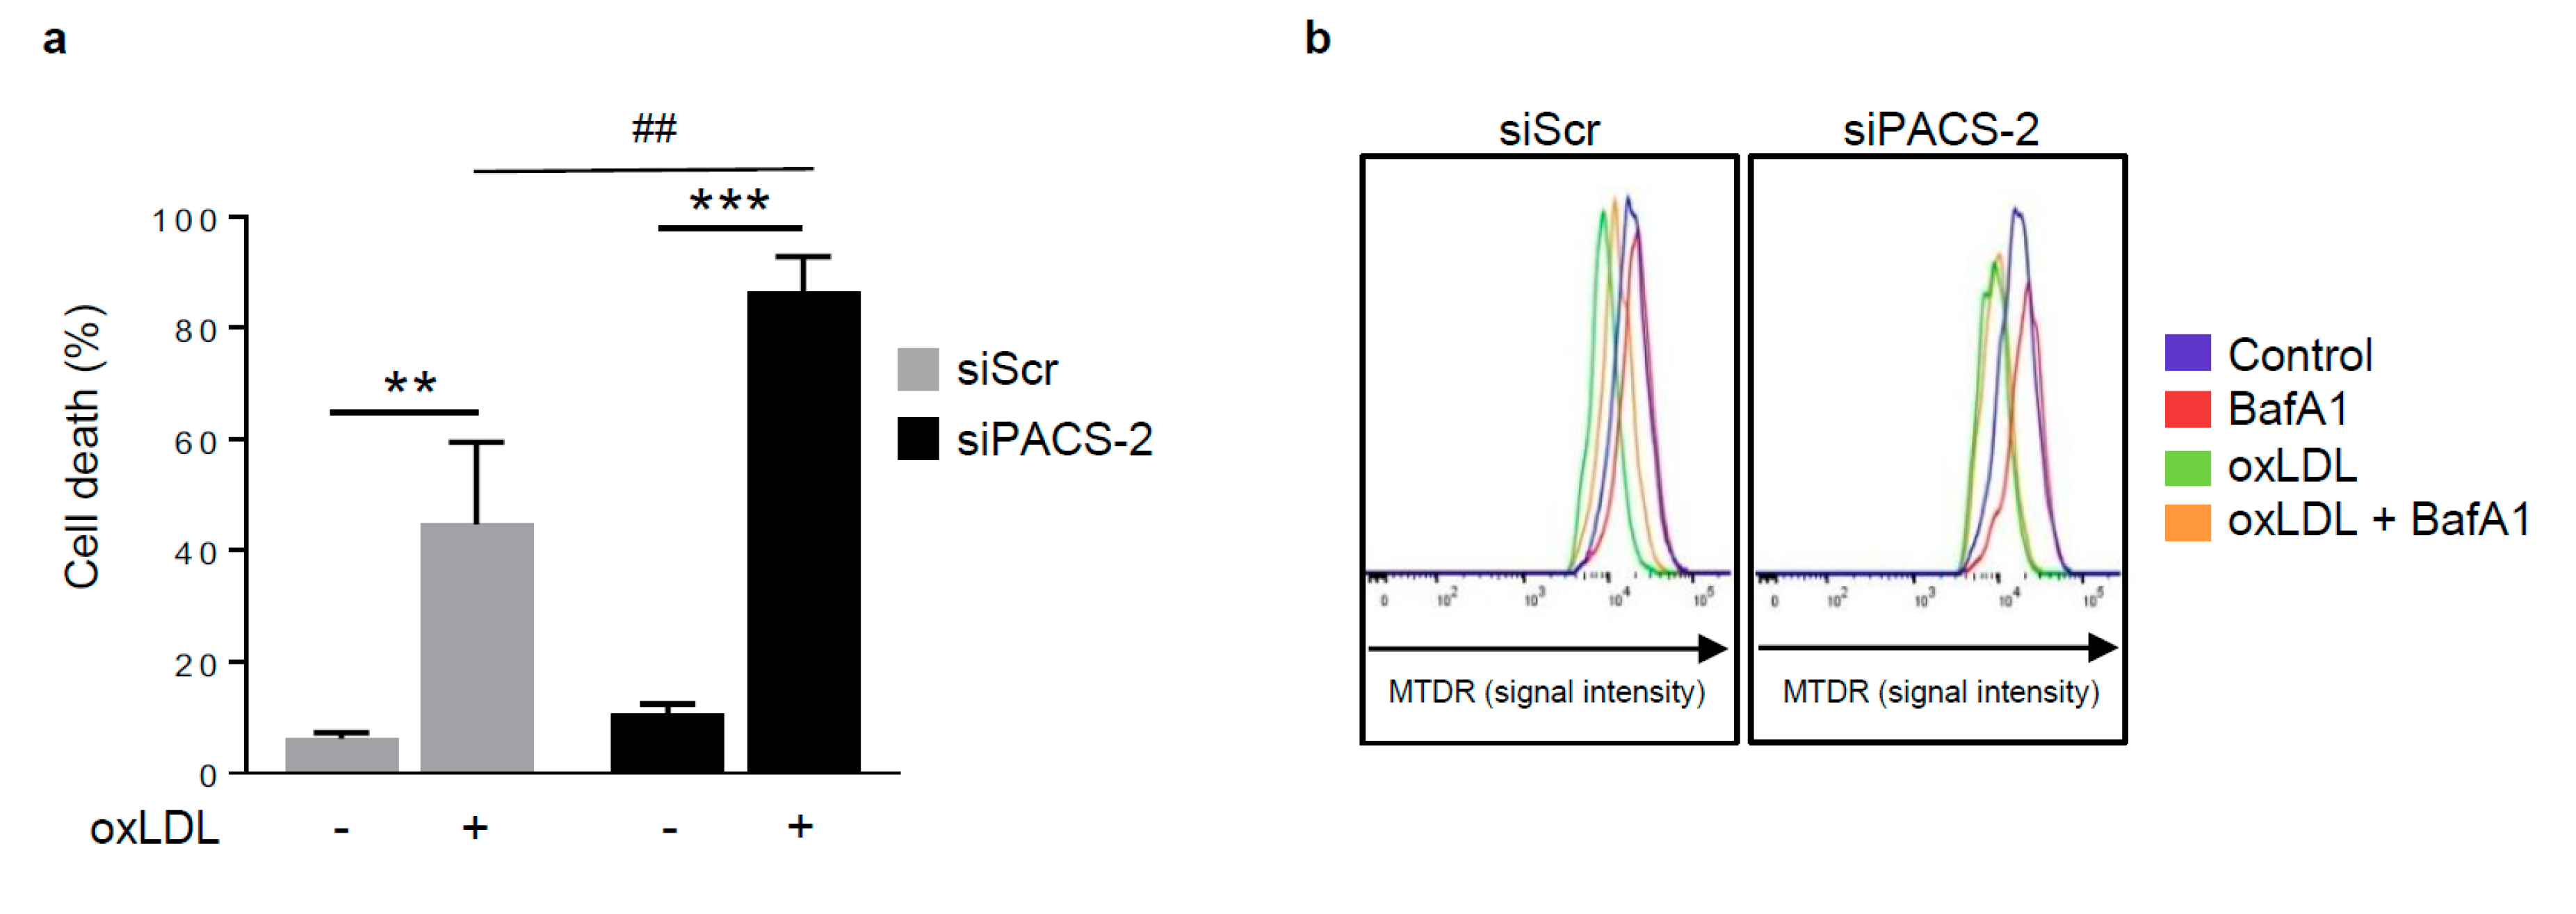
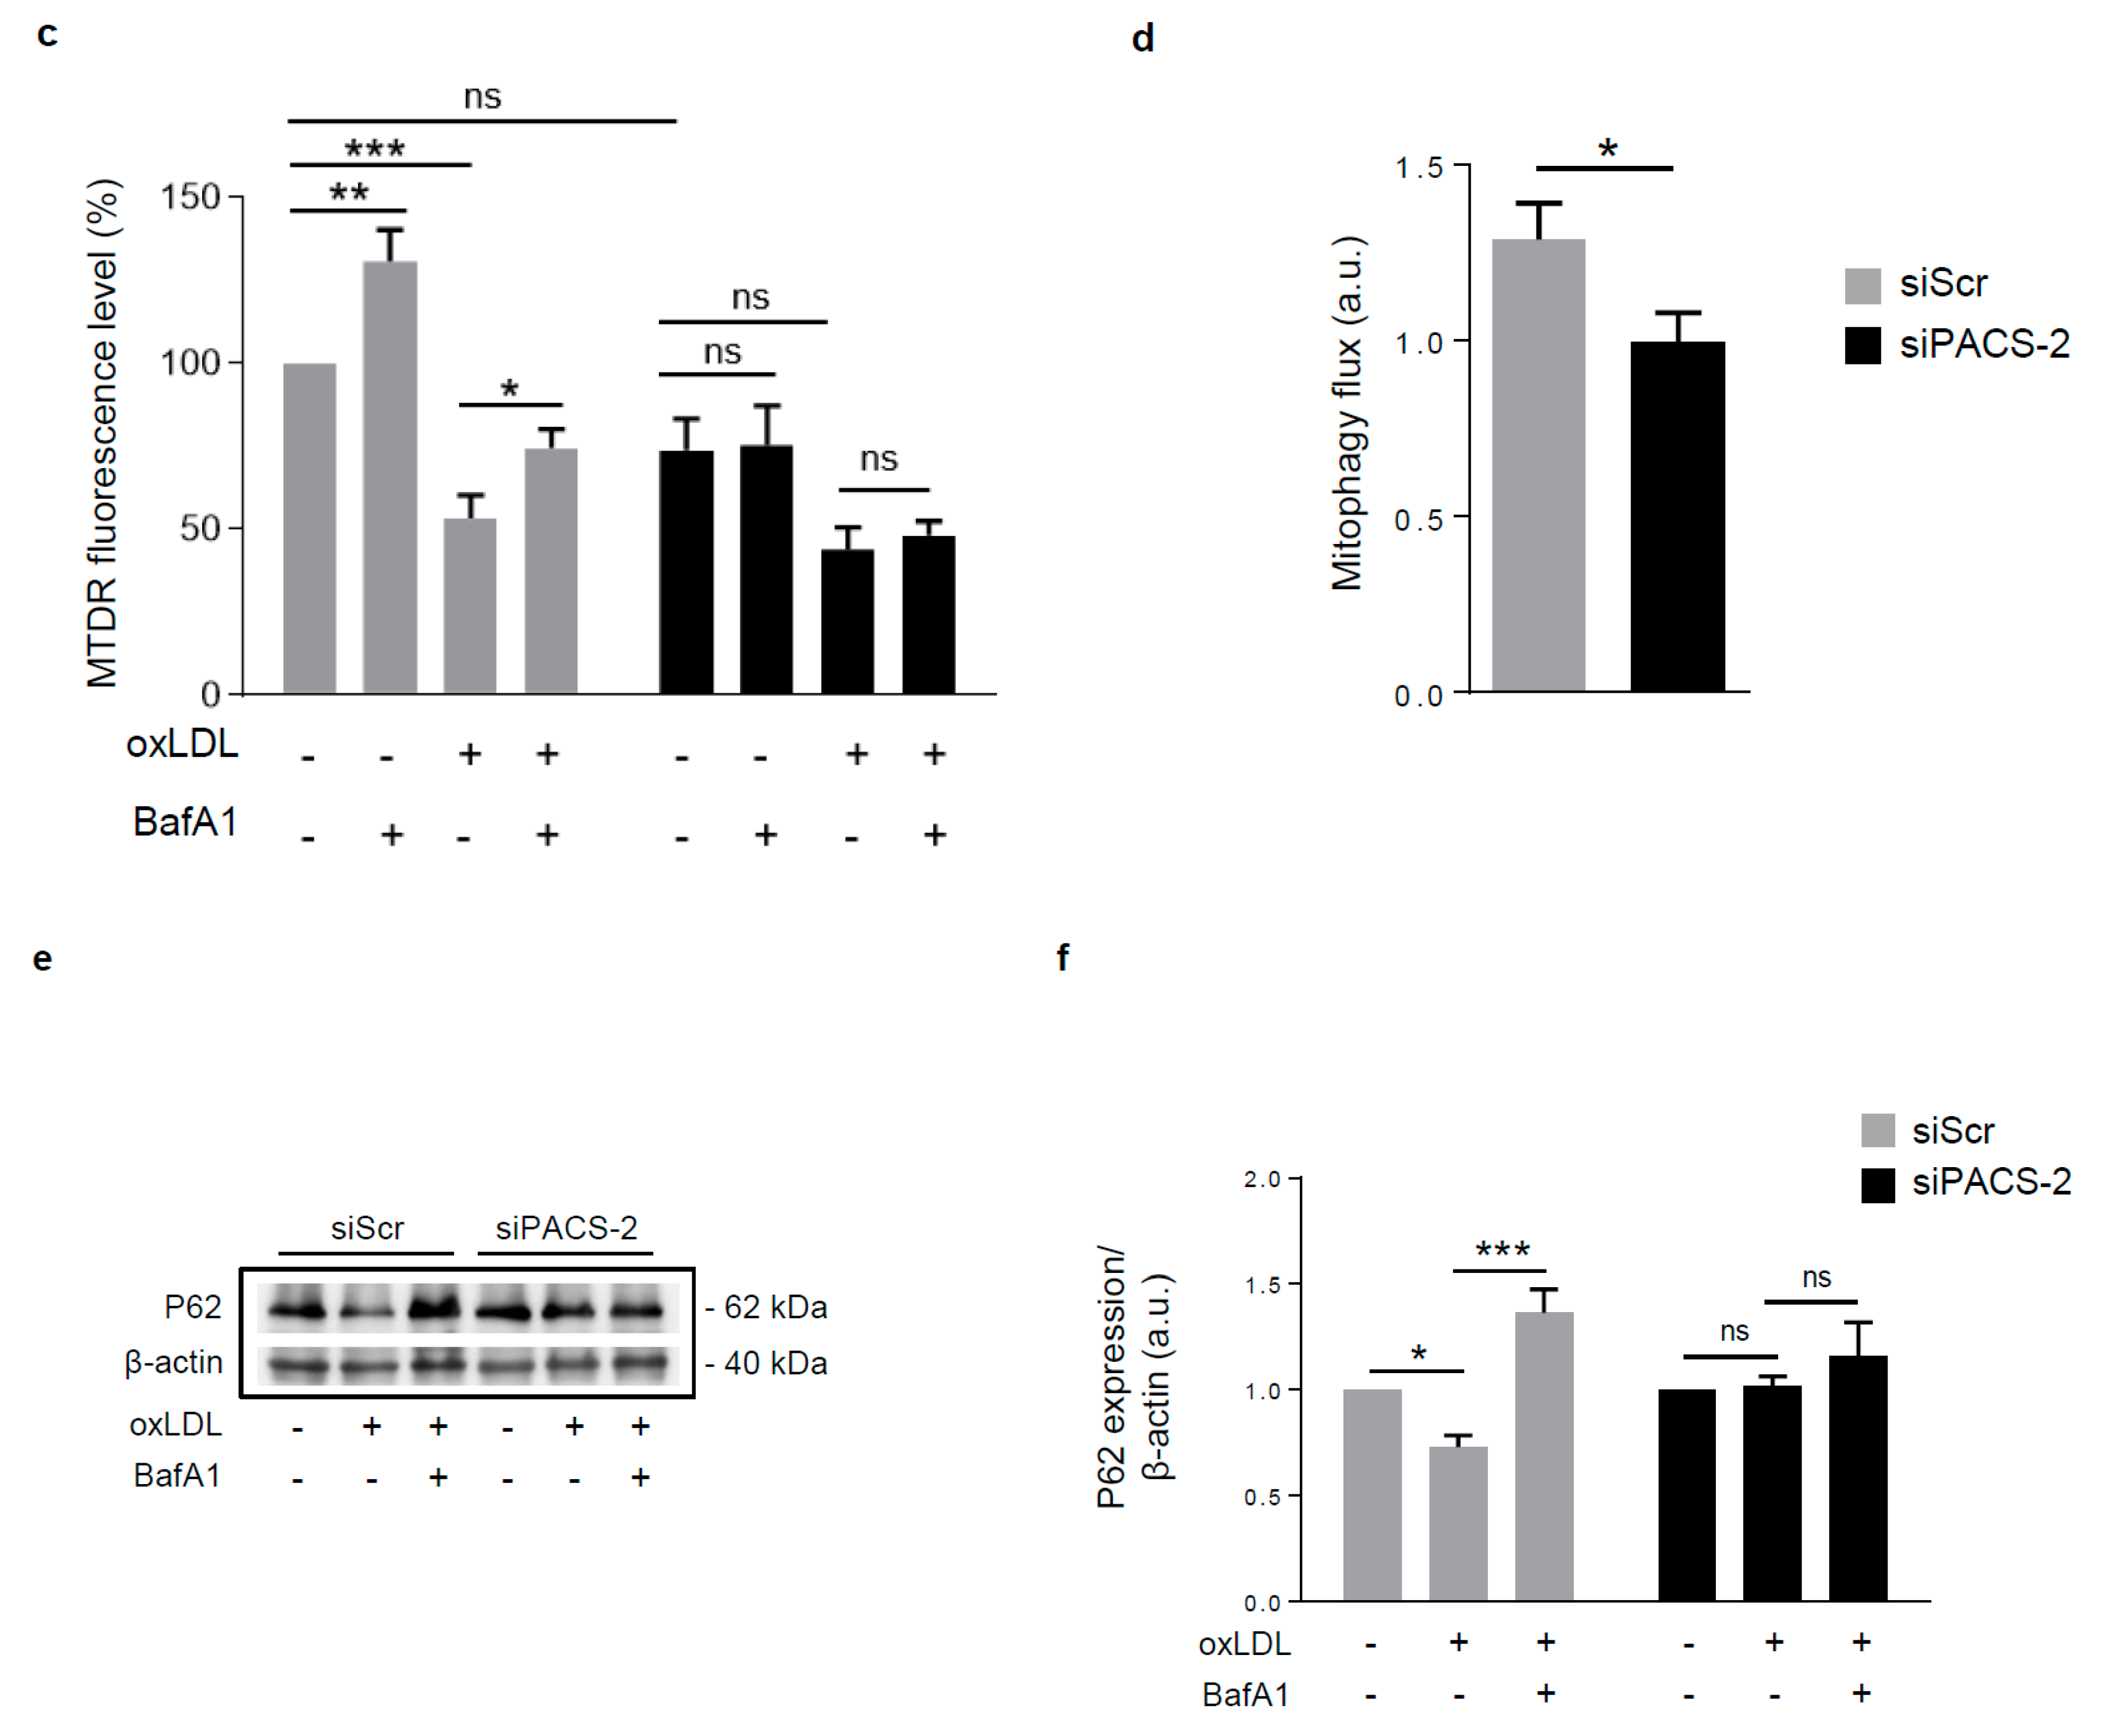
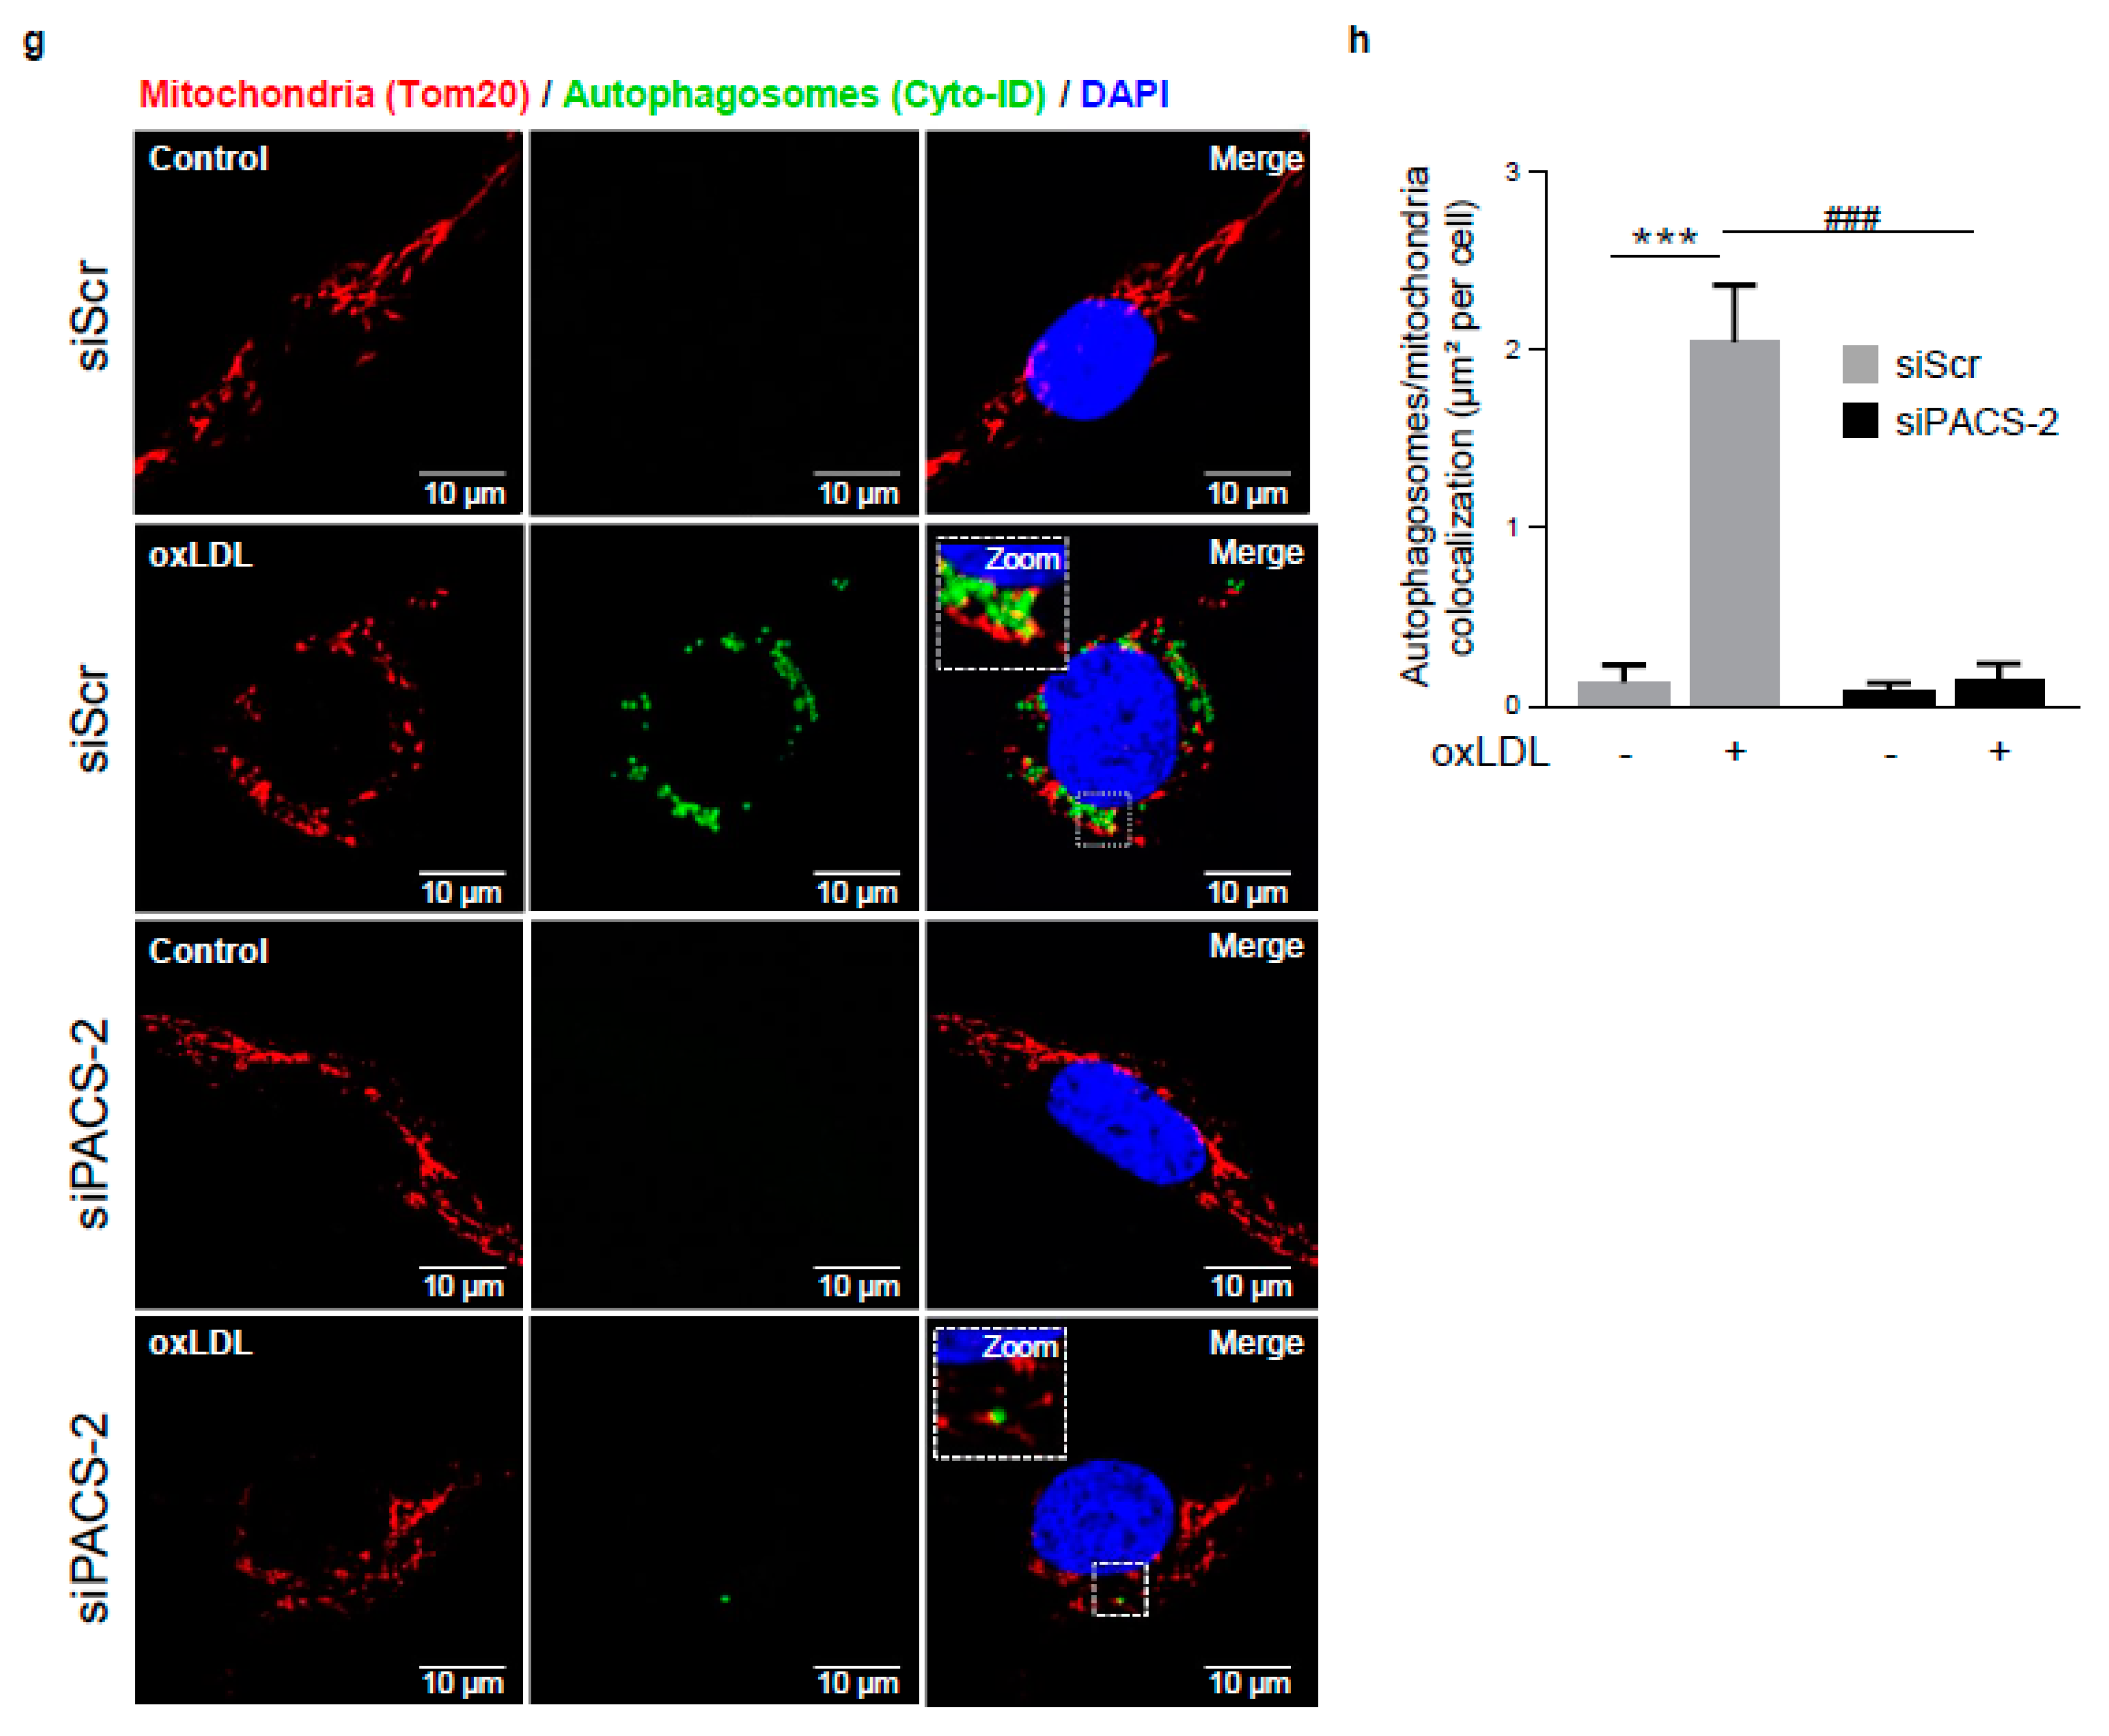
Figure 5.
PACS-2 deletion enhances hVSMCs death and impairs mitophagy in response to oxidized LDL. (a) Cell death assessment by Annexin V/PI staining followed by flow cytometry analysis in hVSMCs transfected with scrambled siRNA (siScr) or siRNA PACS-2 (siPACS-2) and stimulated or not (Control) with oxidized LDL (oxLDL, 200 µg ApoB/mL, 8 h). The graph represents the quantitative analysis of the percentage of dead cells, data are expressed as mean ± SEM (n = 5–7; two-way ANOVA with treatment (*) and siRNA (#) as category factors and Tukey’s post-hoc test, ** p < 0.01, *** p < 0.001, ## p < 0.01). (b) Representative overlays of mitophagy analysis determined by flow cytometry using the MTDR staining. Cells were transfected with scrambled siRNA (siScr) or siRNA PACS-2 (siPACS-2) and stimulated or not (Control) with oxidized LDL (oxLDL, 200 µg ApoB/mL, 8 h). Cells were treated with or without bafilomycin A1 (BafA1, 100 nM) before analysis to block lysosomal degradation and stained with MTDR for flow cytometry analysis. (c) Mitophagy assessment in hVSMCs. The graph represents the quantitative analysis of the percentage of MTDR fluorescence; data are expressed as mean ± SEM (n = 5–9; two-way ANOVA with treatment (*) and siRNA (#) as category factors and Holm–Sidak’s post-hoc test, * p < 0.05, ** p < 0.01, *** p < 0.001, ns, non-significant). (d) Mitophagy flux determination (arbitrary unit, a.u.) in hVSMCs transfected with scrambled siRNA (siScr) or siRNA PACS-2 (siPACS-2) and stimulated with oxidized LDL (oxLDL, 200 µg ApoB/mL, 8 h) in the presence of bafilomycin A1 (Baf1, 100 nM). Data are expressed as mean ± SEM (n = 5–9; Student’s t test, * p < 0.05). (e) Western-blot analysis of P62 expression in hVSMCs transfected with scrambled siRNA (siScr) or siRNA PACS-2 (siPACS-2) and stimulated or not (Control) with oxidized LDL (oxLDL, 200 µg ApoB/mL, 8 h) in the presence of bafilomycin A1 (Baf1, 100 nM). β-actin was used as the loading control. (f) The graph represents the densitometric analysis of the expression level of P62. The data are expressed as mean ± SEM of six independent experiments (one-way ANOVA and Holm–Sidak’s post-hoc test, * p < 0.05, *** p < 0.001, ns, non-significant). (g) Representative images of mitochondria (Tom20, red), autophagosomes (Cyto-ID, green) and nucleus (DAPI, blue) in hVSMCs transfected with scrambled siRNA (siScr) or siRNA PACS-2 (siPACS-2) and stimulated or not (Control) with oxidized LDL (oxLDL, 200 µg ApoB/mL, 8 h). Images were obtained with an LSM 780 confocal microscope, scale bar 10 µm. (h) Analysis of the colocalization area between autophagosomes and mitochondria using Image J software. The graph represents the mean ± SEM of 10 cells analyzed per experiment for each condition (n = 3, two-way ANOVA with treatment (*) and siRNA (#) as category factors and Holm–Sidak’s post-hoc test, *** p < 0.001, ### p < 0.001).
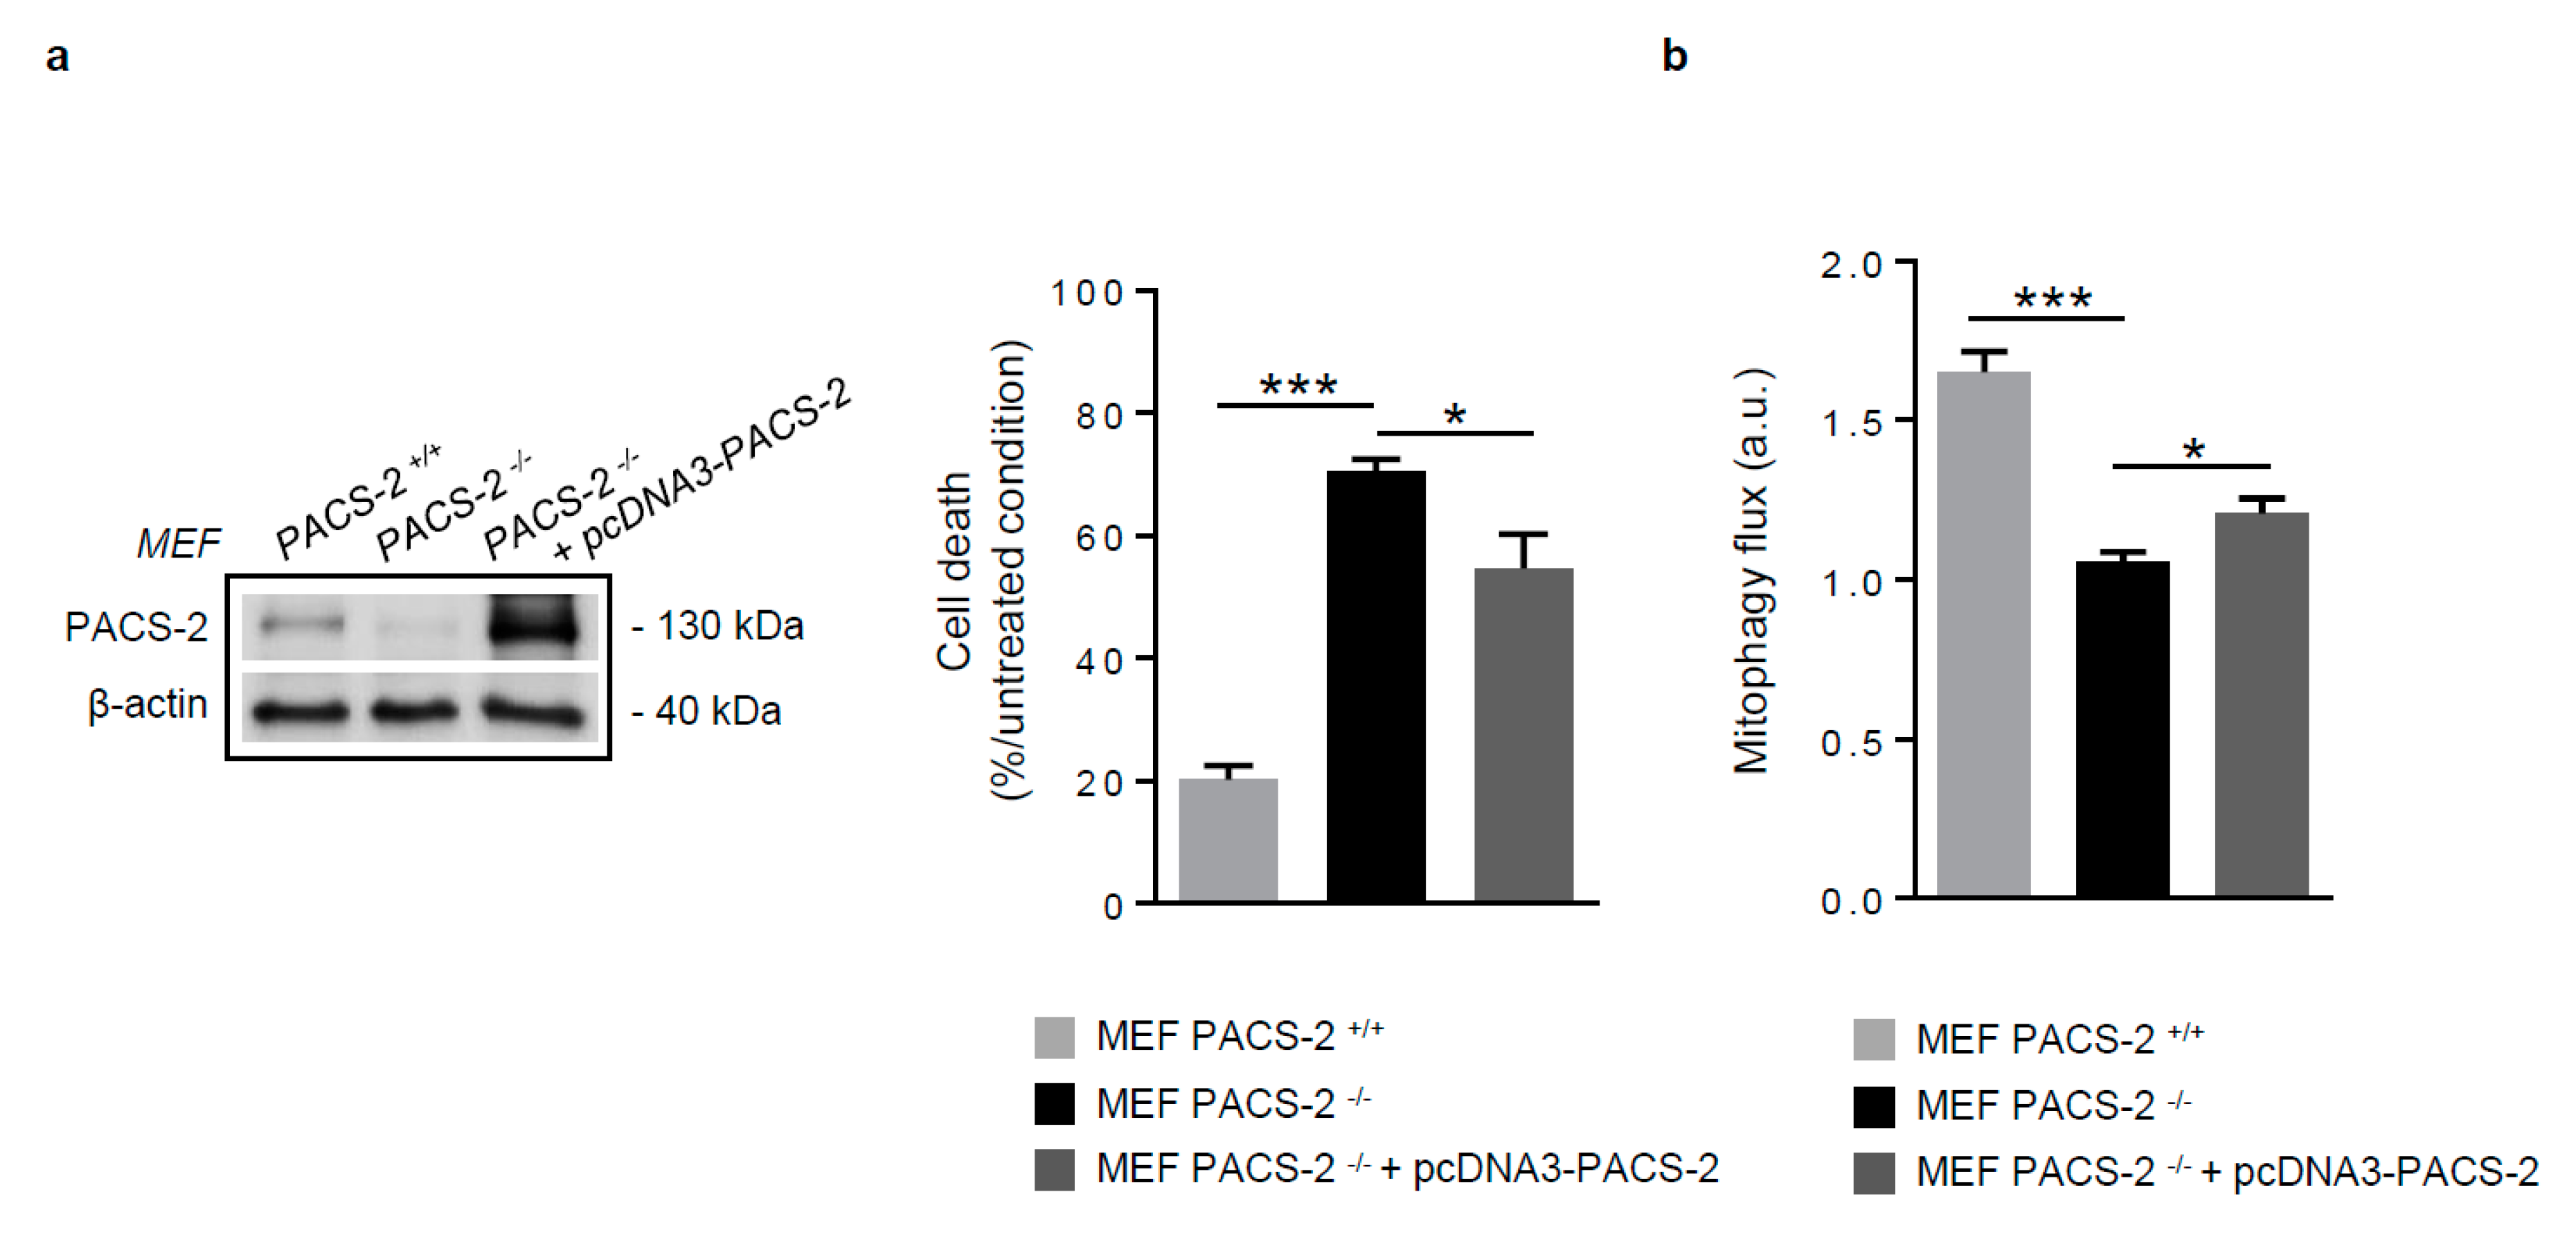
Figure 6.
PACS-2 rescue in PACS-2-deficient cells prevents cell death and restores mitophagy following oxidized LDL treatment. (a) Cell death assessment by Annexin V/PI staining followed by flow cytometry analysis, in mouse embryonic fibroblasts (MEF) PACS-2 +/+, MEF PACS-2 −/−, and MEF PACS-2 −/− transfected with pcDNA3-PACS-2 stimulated with oxidized LDL (oxLDL, 200 µg ApoB/mL, 8 h). Data are expressed as mean ± SEM (n = 3; one-way ANOVA and Holm–Sidak’s post-hoc test, * p < 0.05, *** p < 0.001). (b) Mitophagy flux determination (arbitrary unit, a.u.) in MEF PACS-2 +/+, MEF PACS-2 −/−, and MEF PACS-2 −/− transfected with pcDNA3-PACS-2 and stimulated with oxidized LDL (oxLDL, 200 µg ApoB/mL, 8 h) in the presence of bafilomycin A1 (Baf1, 100 nM). Data are expressed as mean ± SEM (n = 6; one-way ANOVA and Holm–Sidak’s post-hoc test, * p < 0.05, *** p < 0.001).
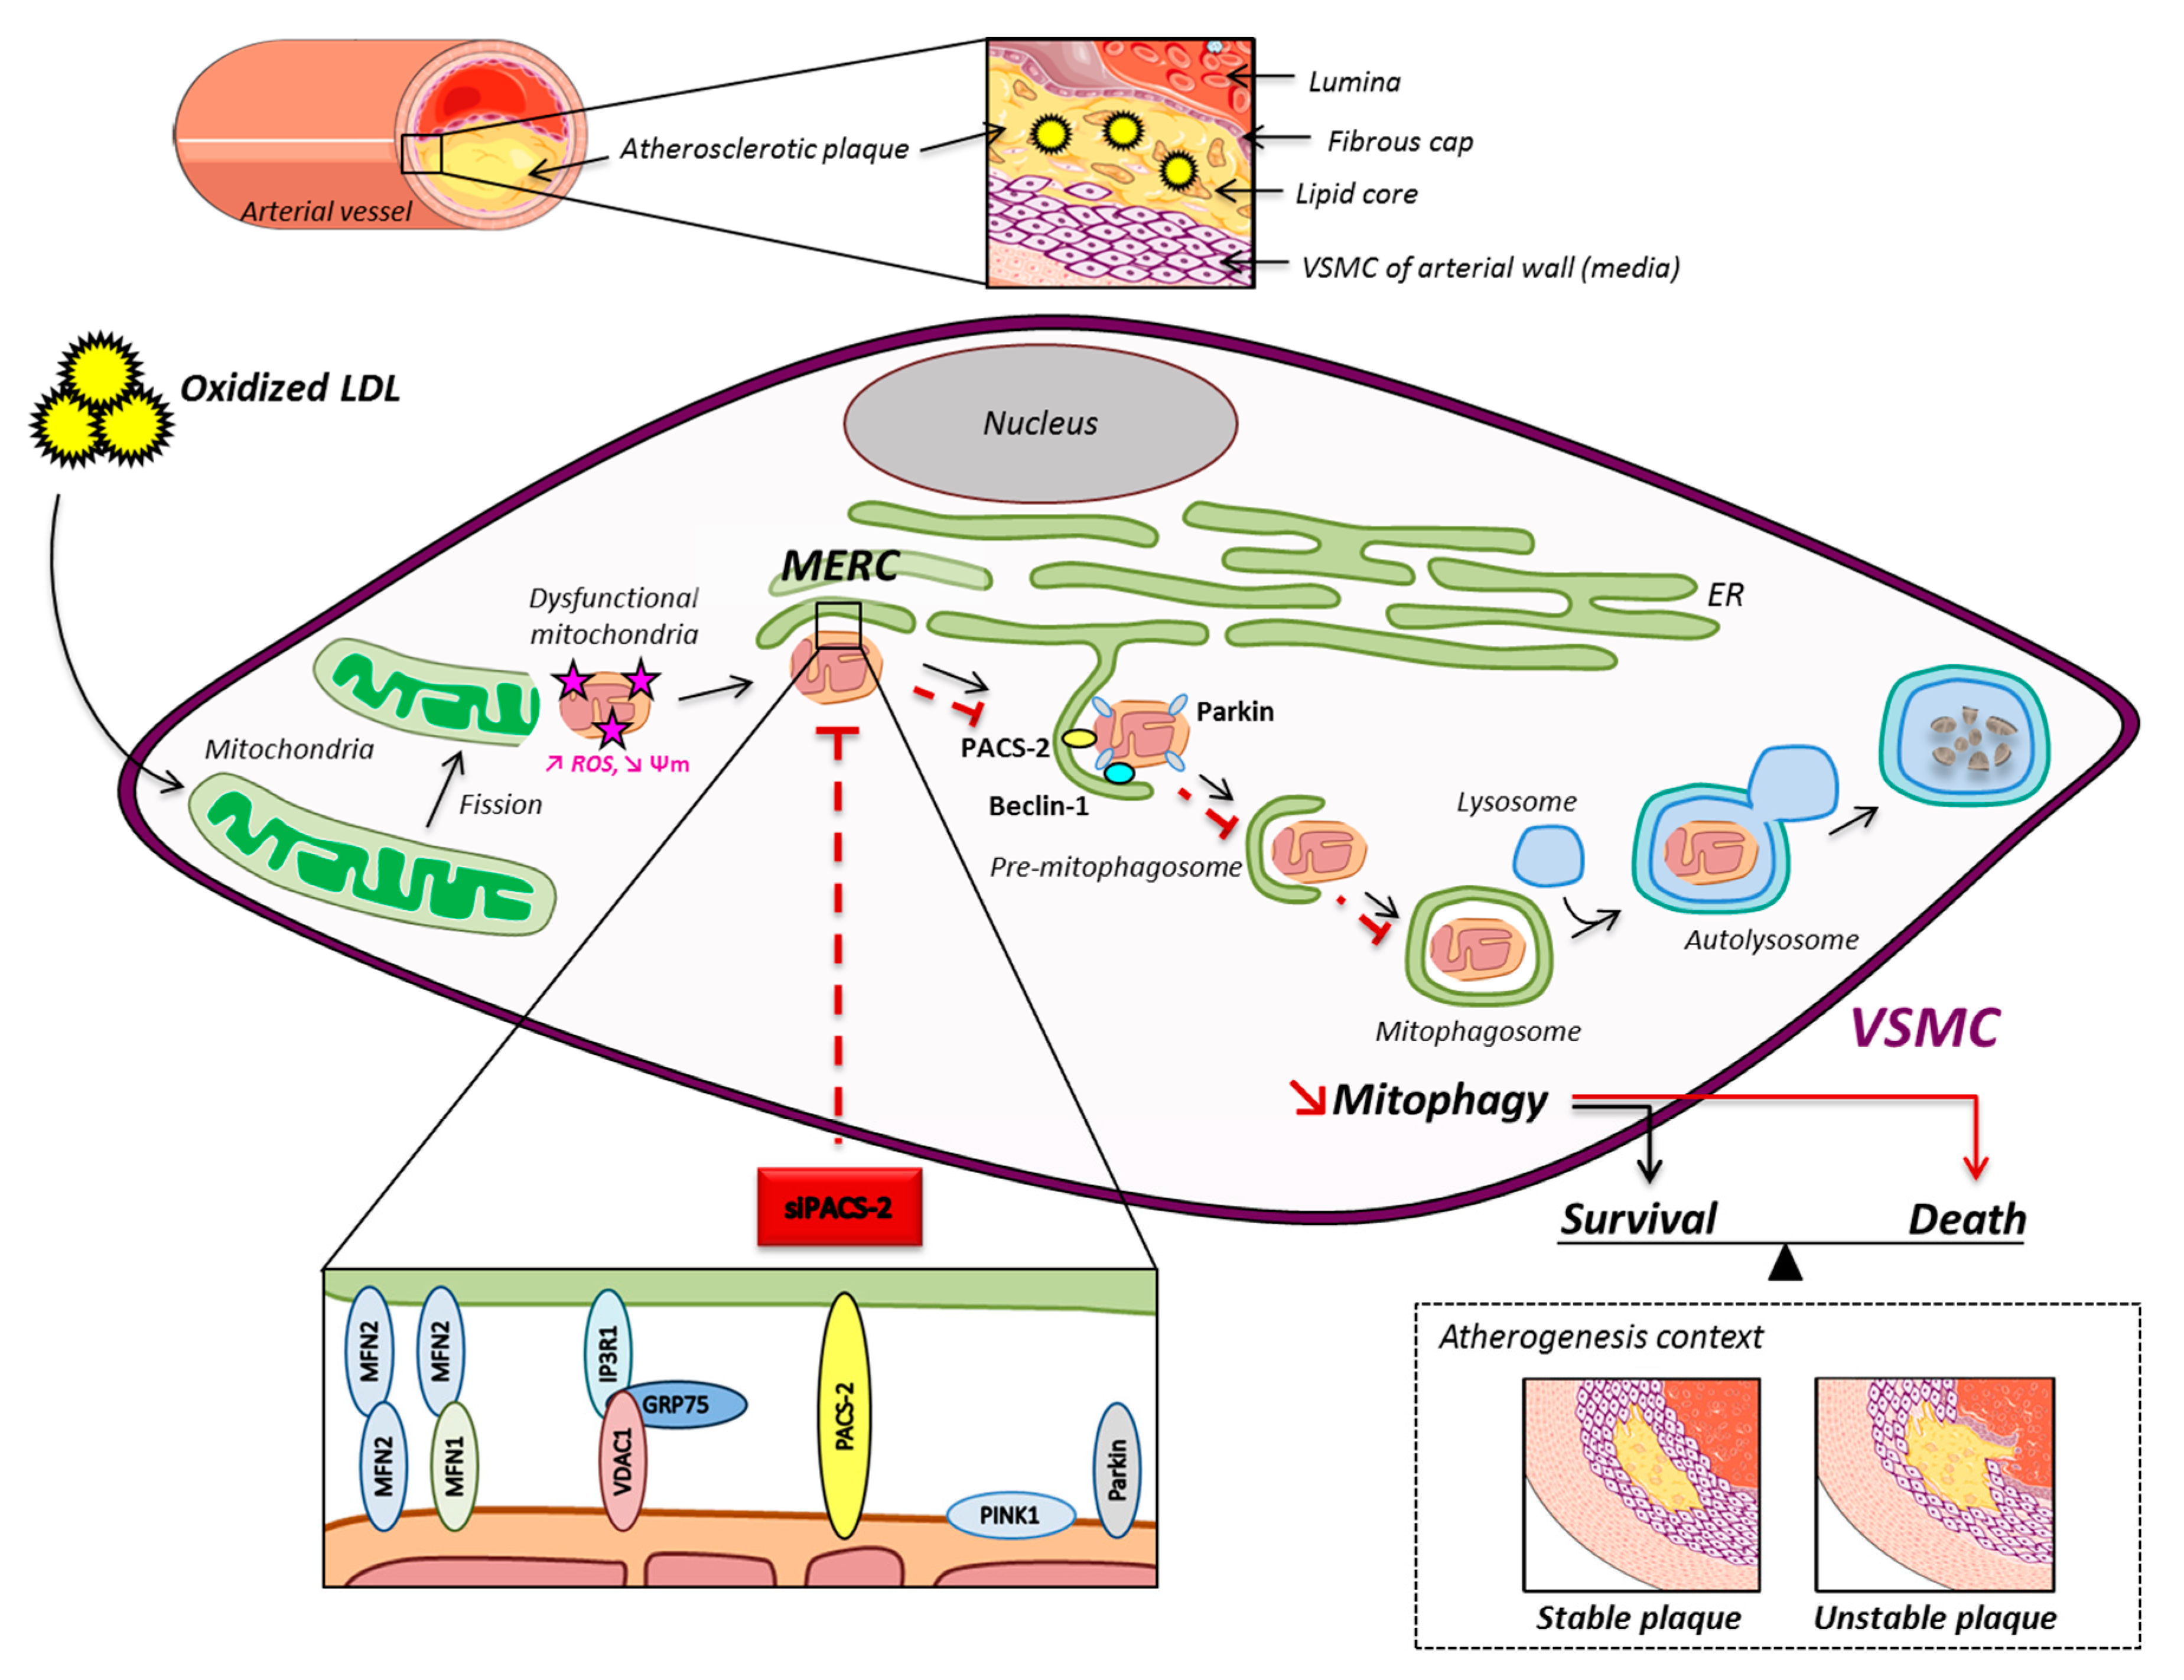
Figure 7.
Schematic overview of the oxidized LDL effects on mitochondria and ER contacts in hVSMCs. The mitochondrial network fragments upon oxidized LDL treatment, and damaged mitochondria interact with the ER to form MAM contact sites. These subcellular platforms are increased in the atherogenic condition, and PACS-2 is important for the tethering. The pro-autophagic proteins Beclin-1 and Parkin are recruited in MAM contacts to promote the formation of the phagosomal membranes. The degradation of altered mitochondria by the mitophagic process promotes the survival of VSMC, leading to the stability of the atherosclerotic plaque.

 ,
, 


