Article

Transcriptional Plasticity of Autophagy-Related Genes Correlates with the Genetic Response to Nitrate Starvation in Arabidopsis Thaliana

1
Institut Jean-Pierre Bourgin, INRAE, AgroParisTech, Université Paris-Saclay, 78000 Versailles, France
2
Bureau International des Poids et Mesures (BIPM), Pavillon de Breteuil, F-92312 Sèvres, France
*
Author to whom correspondence should be addressed.
Submission received: 21 February 2020 / Revised: 16 April 2020 / Accepted: 16 April 2020 / Published: 20 April 2020
(This article belongs to the Special Issue Advances in the Plant Autophagy)

Abstract

:
In eukaryotes, autophagy, a catabolic mechanism for macromolecule and protein recycling, allows the maintenance of amino acid pools and nutrient remobilization. For a better understanding of the relationship between autophagy and nitrogen metabolism, we studied the transcriptional plasticity of autophagy genes (ATG) in nine Arabidopsis accessions grown under normal and nitrate starvation conditions. The status of the N metabolism in accessions was monitored by measuring the relative expression of 11 genes related to N metabolism in rosette leaves. The transcriptional variation of the genes coding for enzymes involved in ammonium assimilation characterize the genetic diversity of the response to nitrate starvation. Starvation enhanced the expression of most of the autophagy genes tested, suggesting a control of autophagy at transcriptomic level by nitrogen. The diversity of the gene responses among natural accessions revealed the genetic variation existing for autophagy independently of the nutritive condition, and the degree of response to nitrate starvation. We showed here that the genetic diversity of the expression of N metabolism genes correlates with that of the ATG genes in the two nutritive conditions, suggesting that the basal autophagy activity is part of the integral response of the N metabolism to nitrate availability.

1. Introduction

Nitrogen (N), which is incorporated into amino acids, nucleic acids, phytohormones, and chlorophyll, is one of the essential macronutrients for plants. N fertilizers have been widely applied to archive high grain yields in recent decades [1]. However, commercial fertilizers represent the major cost in plant production and less than 50% of soil-applied N fertilizers is used by crops [2]. A major challenge for sustainable agriculture is to improve N use efficiency (NUE) of crop varieties to use less N fertilizer without affecting the yield and quality of harvested products.
Plants adapt their growth and development following the resources of the environment, in particular following the amount of nutrients available in the soil. Frequently, they encounter nitrate deficiency since nitrate has very weak affinity to form surface complexes with soil minerals [3]. Extensive transcriptome studies have characterized the transcriptomic response to N starvation [4,5,6,7,8]. In response to N deficiency, plants modulate root architecture, ammonium and nitrate uptake and assimilation [9,10]. When scarce, ammonium and nitrate uptake mostly proceed through high-affinity uptake systems [11,12,13]. In addition, face with N starvation, plants manage the different intra-cellular nitrogen sources to sustain N economy. The activities of the major enzymes in charge of the nitrate and ammonium assimilation decrease under starvation, while the activities of the enzymes involved in the catabolism of organic nitrogen (glutamate dehydrogenase; GDH) and remobilization (cytosolic glutamine synthetase; GS1) increase to reincorporate liberated ammonium into the whole plant metabolism [4,6,14]. Complex regulations at both transcription and post-translation levels fine-tune these N transporters and N enzymes activities to ensure a tight coordination between N and carbon metabolisms [15].
Extensive natural variations exist for adaptation to environmental changes among individuals belonging to a plant species [16]. Caused by spontaneously arising mutations, these intra-specific phenotypic variations have been maintained over generations by gene flow, genetic drift, and artificial and natural selection. Phenotypic plasticity affects various components of the plant adaptation, such as mineral and nutriment accumulations, primary metabolism, plant growth, and plant development [16]. Using a collection of natural accessions of Arabidopsis (Arabidopsis thaliana), we previously characterized the plasticity for growth and N management under normal and nitrogen starvation condition [17]. The vast plasticity existing among accessions defined different types of responses to N stress [17]. Further investigations on the N status of Arabidopsis accessions revealed that the natural diversity affect the management and the storage of various N pools—nitrate, ammonium, amino acids—in the cells [18,19]. The Arabidopsis accessions show different sensibility to nitrate availability and variations in their capacity to produce biomass at the same nitrogen nutrition index. The intra-specific plasticity of the response to low nitrate availability was also observed for N absorption from the media [20,21] and for the management of N fluxes from the rosette to new organs [22]. These studies reveal that the management of the cellular N pools through recycling are key factors for the adaptation of the plants to environmental N availability.
Macrophagy (hereafter referred to as autophagy) is a conserved catabolic process, essential for the removal and recycling of the cytoplasmic components, including damaged proteins and organelles [23]. Autophagy engulfs unwanted cytosolic materials within specialized autophagic vesicles, called autophagosomes, which are subsequently delivered to the vacuole for proteolysis or hydrolysis [24]. Active at very low level, autophagy is highly enhanced in response to many stresses and during leaf senescence [25,26,27,28]. In Arabidopsis, more than 30 autophagy-related (ATG) genes have been identified that cooperate in the autophagy machinery for induction, vesicle nucleation, formation of pre-autophagosomal structure, cargo recognition and packaging, vesicle expansion and completion, autophagy-associated protein cycling, vesicle fusion with the vacuole/lysosome, autophagic body breakdown, and recycling of the macromolecules [29]. Growth of the various atg mutants under suboptimal conditions indicates that autophagy plays an important role in nutrient recycling, especially during starvation. When the Arabidopsis null mutants of ATG4a/b, ATG5, ATG7, or ATG9, and ATG18a were grown under carbon- or nitrogen-deficient conditions, they exhibited early leaf senescence, accelerated bolting, and reduced seed yield [23,30,31,32,33]. The ATG18 defective RNAi line and mutants in ATG5 and ATG9 were impaired in autophagic flux and showed reduced nitrogen remobilization efficiency [33]. Conversely, the overexpression of several ATG8 genes increased autophagy activity and enhanced nitrogen remobilization from the rosette to the seeds during the reproductive phase [34].
In response to N starvation, autophagy has been reported to be mainly post-translationally enhanced due to the inactivation of the TOR (Target Of Rapamycin) kinase [35]. However, some reports provide evidence that ATG4, ATG7, ATG8, and ATG9 are also transcriptionally induced by N and C limiting conditions [30,36,37,38], suggesting a potential and complementary regulation of autophagy at the transcriptional level. The recent studies that screened transcription factors using high-throughput Y1H assays and DNA affinity purification sequencing (DAP-seq) revealed several regulator candidates for ATG8 genes [38,39]. Among these candidates, the TGA9 basic leucine-zipper protein (bZIP) transcription factor was shown to up-regulate the expression of several ATG8 genes by binding to their promoters [38]. TGA9 enhanced the expression of ATG8b and ATG8e in response to sucrose starvation and to osmotic stress. However, the role of ATG9 in the control of autophagy under N starvation was not reported. In the list of transcriptional factors binding the promoters of ATG8a, ATG8b, ATG8e and ATG8f, only TAG1 and TAG4 are known to be regulatory components of the nitrate response in roots [40]. Furthers investigations are needed to identify the transcriptional regulators of autophagy in the rosettes of plants submitted to N starvation.
The aim of our study was to assess the transcriptomic plasticity of ATG genes in Arabidopsis genotypes responding differentially to N starvation. We measured the transcriptional levels of two sets of genes that correspond to ATG genes and N metabolism-related genes, in nine natural accessions of Arabidopsis thaliana grown in hydroponic cultures under non-limiting supply or submitted for 24 h to nitrate starvation. By using this approach, we compared the accessions following their transcriptomic responses to N stress. The characterized transcriptional plasticity of ATG genes under stress and non-stress conditions suggested the existence of natural diversity of basal autophagy. We showed that the global expression of ATG genes correlated with expression of genes involved in the assimilation of ammonium.

2. Materials and Methods

2.1. Plant Material

Arabidopsis thaliana accessions used in this study were obtained from the Versailles stock center (http://publiclines.versailles.inra.fr/). The nine genotypes (Akita, Bay-0, Bur-0, Can-0, Col-0, Cvi-0, Edi-0, Sakata, Tsu-0) are part of the core collection of 24 accessions selected by McKhann et al. [41] on the basis of genetic variability.

2.2. Plant Growth Condition

Seeds were surface sterilized by using ethanol–‘bayrochlor’ (95/5%, v/v) prior to stratification in water at 4 °C for 3  days. Each seed was sown using a toothpick on the top of one cut Eppendorf tube filled with 0.7% Daishin agar (Duchefa Biochimine, Haarlem; The Netherlands). Tubes were inserted into 96-wells trays filled with demineralized water. After 3 days in the darkness at 4 °C, the trays containing tubes were transferred to a growth chamber in short days with 21 °C day and 17 °C night temperatures. Relative humidity in the growth chamber was 65%. The photon flux density was 165 μmol m−2 s−1. On the seventh day of growth, seedlings were transferred to plastic tanks, each with the capacity to grow 104 plants. Each genotype was represented by eight plants per nutrition condition. These plastic tanks were filled with 33.0 L of nutrient solution. The plants were cultivated hydroponically for 35 d (the entire vegetative growth). A short photoperiod (8 h day) was chosen to prevent early flowering.
One set of plants was fed on complete nutrient solution containing 4 mM nitrate as the N source (2 mM KNO3, 1 mM Ca(NO3)2, 0.15 mM KH2PO4, 0.15 mM MgSO4, 0.3 mM CaCl2) for 35 days. In the second condition, a set of control plants that were maintained on the complete nutrient solution for 34 days were fed for 24 h a complete N starvation with 0 mM N03 solution (0.15 mM KH2PO4, 0.5 mM K2SO4, 0.15 mM MgSO4, 0.18 mM CaCl2). All nutrient solutions contained microelements (15 μM MnSO4, 10 μM H3BO3, 3 μM ZnSO4, 0.01 μM CuSO4, 0.1 μM Na2MoO4, 22.3 μM Na-EDTA, 22.4 μM FeSO4, 0.01 μM CoCl2, and 0.5 μM KI). The pHs of the solutions were around 5.6. Solutions were renewed once during each week of culture up to harvest.
Two successive cultures were carried out to produce independent replicates of the experiment.

2.3. RNA Extraction and Gene Expression Analysis

Rosette leaves from each biological replicate were ground separately to a fine powder in liquid nitrogen and stored at −80 °C until use. Approximately 200 mg of the leaf powder were used for each extraction and added to 2 mL of TRIZOL® reagent (Invitrogen, Thermo Fischer Scientific, Les Ulis, France). Extractions followed manufacturer’s instructions, resuspending the final pellet in 100 µL of sterile water. RNA concentration was checked on a Nanodrop instrument and integrity was checked on a 1% agarose gel. Genomic DNA was removed using RQ1 DNAase (Promega France, Charbonnières-les-Bains, France) according to the manufacturer’s instructions, and removal was verified by PCR using Niia primers (Table S1). cDNA was synthetized from 2 µg of RNA using olido dT and M-MLV RNase H-Reverse Transcriptase (Promega) according to the manufacturer’s instructions. RNA and cDNA was stored at −80 °C until used.
Real time PCR was performed in a Roche Lightcycler using qPCRBIO Syber Green (Thermo Fischer Scientific, Les Ulis, France). Reactions were in 20 µL containing 20 ng of cDNA, 10 µL of Sybergreen, 2.4 µL of sterile water and 0.8 µL of each forward and reverse primer. Reactions were performed with a cycling program of: 95 °C for 120 s, followed by 40 cycles of 95 °C, and 72 °C for 30 s followed by a melting curve form 55 to 98 °C to verify primer specificity. All the primers used are listed in Table S1. Data were analyzed using the 2−ΔΔct method [42]. For all RT-qPCR analyses, APT1 (At1g27450), ACT2 (At3g18780) and PP2AA3 (At1g13320) were used as reference genes (Table S1). The quadratic mean was used to define a synthetic reference gene, which took into account the variation in expression of the three reference genes.

2.4. Statistical Analysis

Three-way ANOVA (R software package) was used to assess the effects of the experiment, genotype, nutritive condition, and the genotype by nutrition (G × N) interaction on the trait variation. Each contrast between the control condition and the other conditions was tested by using estimated marginal means with the function contrast of the R emmeans package. Pairwise differences between genotypes were tested by using estimated marginal means with the function CLD of the R emmeans package.
Data were also treated by hierarchical clustering using the R package pheatmap and by Principal Component Analysis (PCA) using the R package FactoMineR.

3. Results

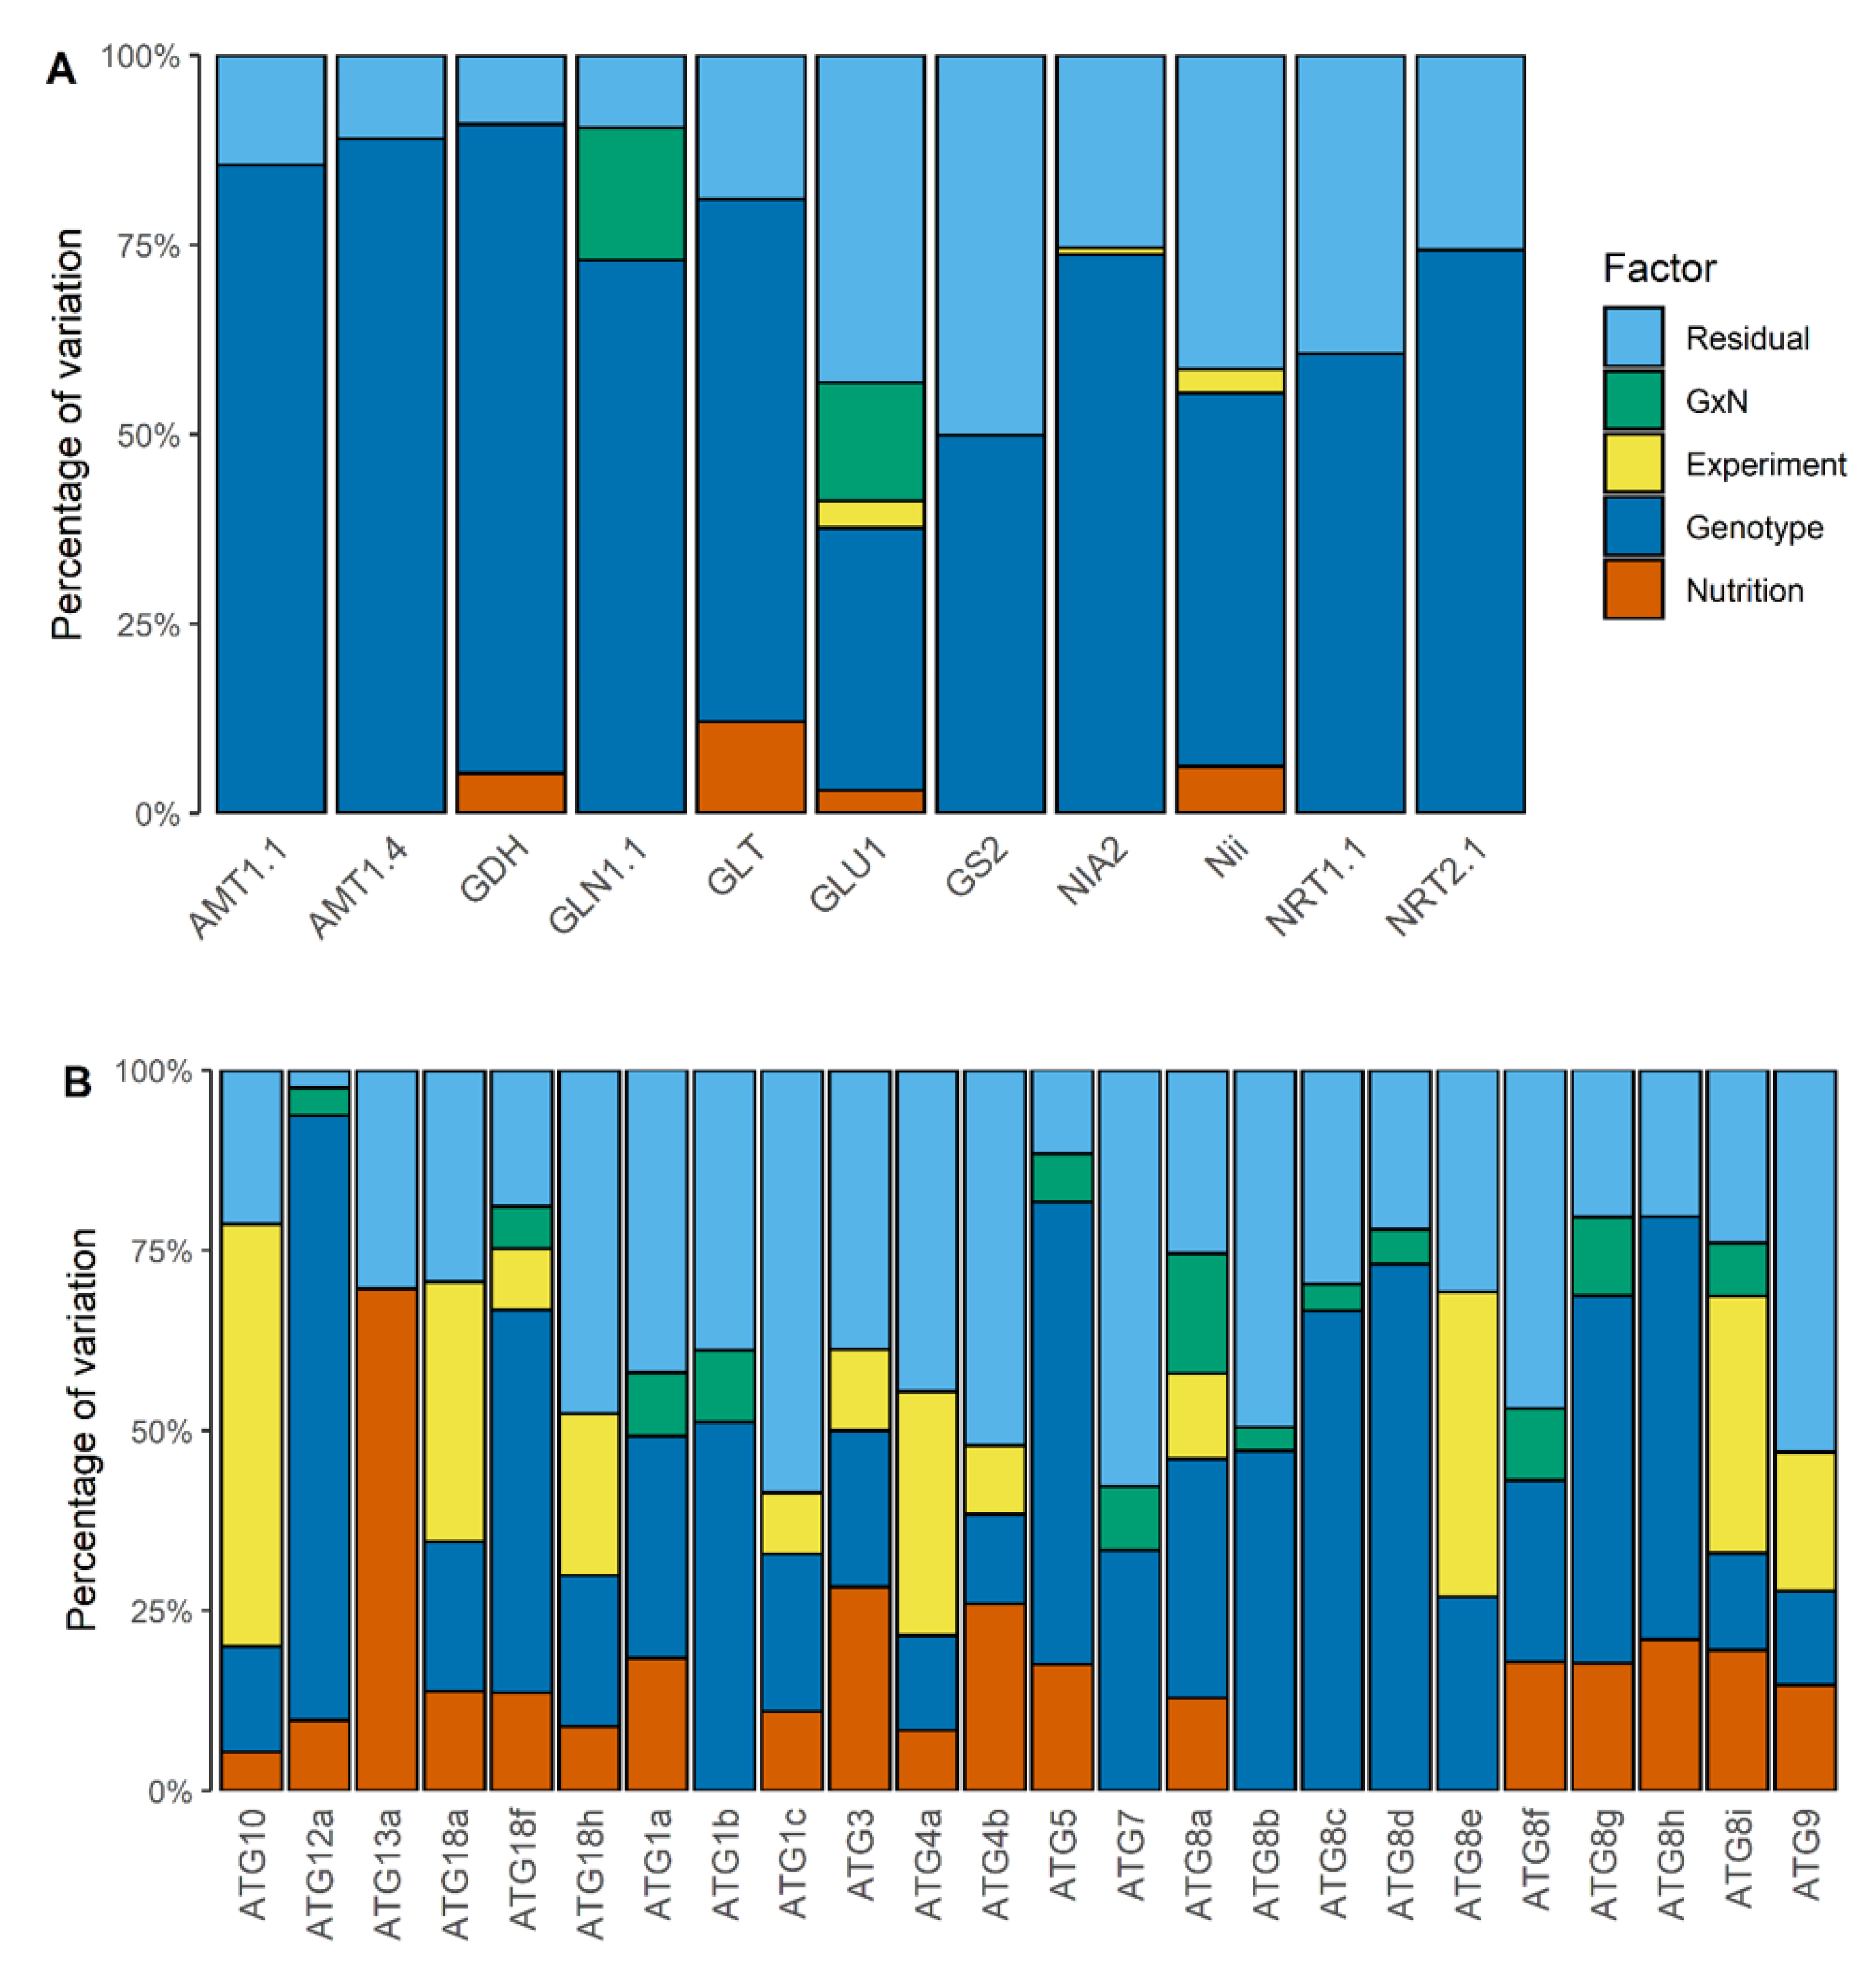
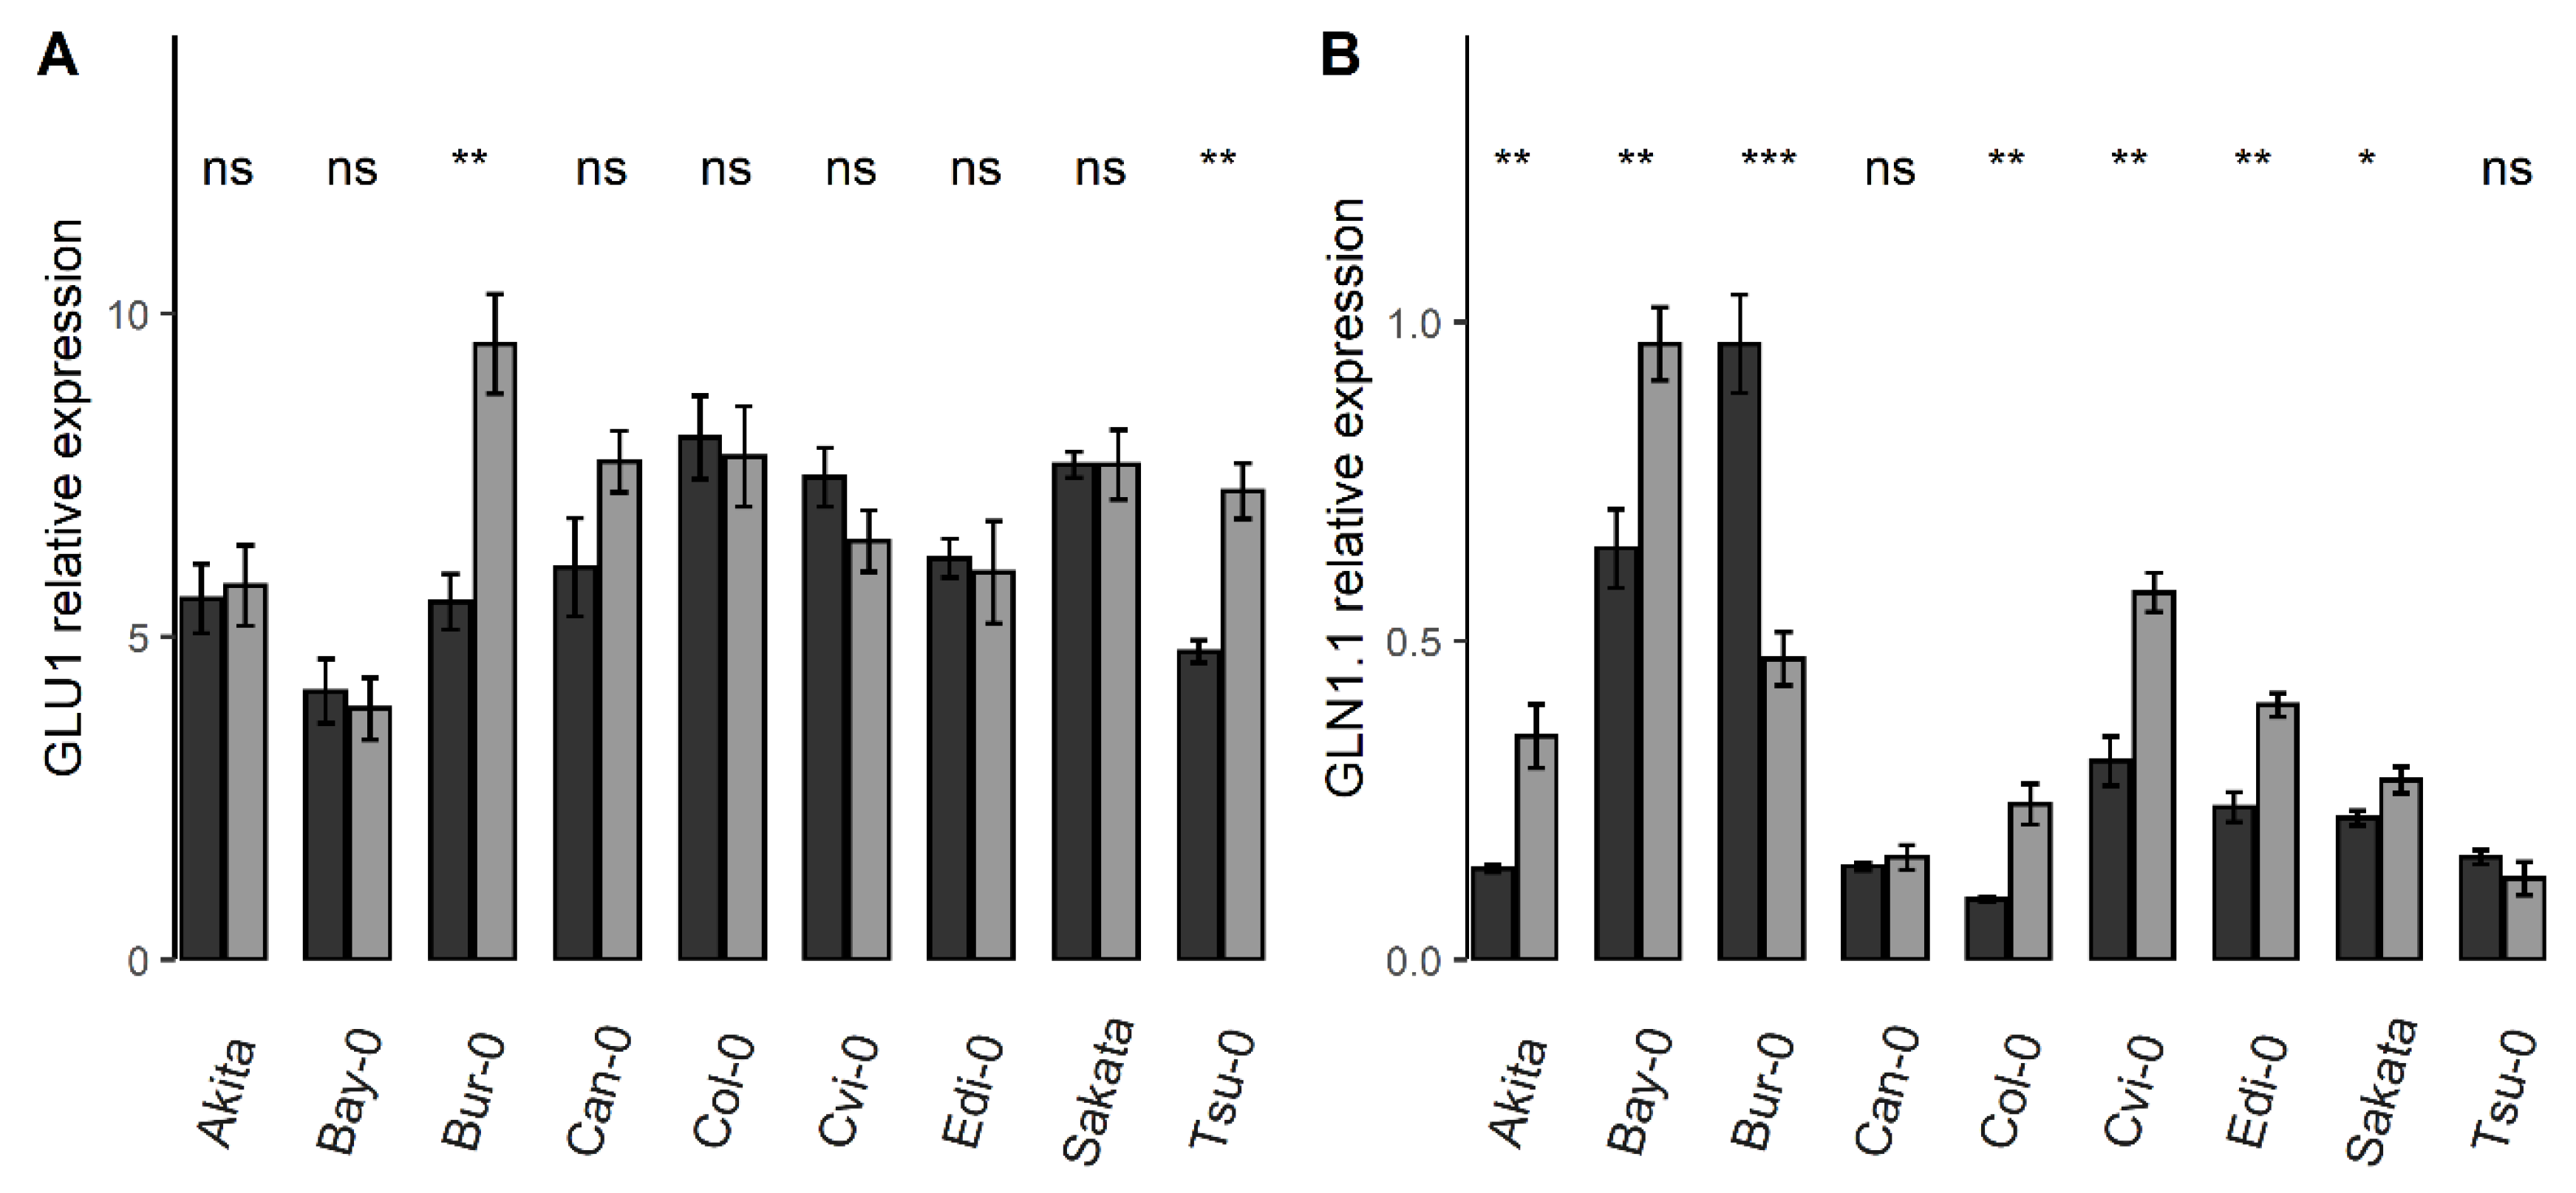
3.1. Variatons in GLN1.1, Nii, GDH, GLU1, and GLT Gene Expressions Are Good Markers to Characterize the Genotype-Response to N Starvation

To determine the degree of the response to nitrate starvation for each accession, we measured the relative expression of 11 genes related to N metabolism in their rosette leaves (Supplementary Table S3). The gene set included genes encoding for nitrate and ammonium transporters (NRT2.1, NRT2.1, AMT1.1 and AMT1.4), enzymes of nitrate reduction (NIA2, Nii) and enzymes of ammonium assimilation and recycling (GS2, GLN1.1, GDH, GLT, and GLU1). Thee-way ANOVAs were carried out to test the main factors on the expression variations, such as accession (i.e., genotype), nutrition and experiment, and their potential interactions, such as the genotype by nutrition (G × N) interaction. ANOVA results revealed that the genetic factor was the highest source of variation for all the studied genes (Figure 1A). It explained 35% to 89% of the observed variation.
Besides genetic effects, variations of expression levels for genes linked to nitrate availability were also identified. For four genes, the relative expression was significantly different between the control and starvation conditions (Table 1). The relative steady state transcript levels of Nii, GDH1, GLU1, and GLT were higher (from 12% to 31%) under the N starvation than in the control condition. The enzymes encoded by these four genes are well known to be involved in ammonium assimilation, and these genes are known to be sensitive to the cellular ammonium concentrations. Only GLU1 and GLN1.1 showed a significant G × N interaction in ANOVA, suggesting that the accessions responded differently to nitrate starvation with at least these two genes. The relative expression of GLU1 was not modified by nitrate starvation, except for the accessions Bur-0 and Tsu-0 in which N starvation enhanced the relative expression of GLU1 (Figure 2A). The relative expression of GLN1.1 was higher in the starvation condition compared to the control condition in most of the accessions except for Bur-0, and remained extremely low irrespective of N conditions in Can-0 and Tsu-0 (Figure 2B).
We deduced that the expression of GLN1.1, Nii, GDH, GLU1, and GLT characterized the genetic response of accessions to nitrate starvation, with or without G × N interactions.
To characterize the genetic plasticity among accessions, we classified the means of gene expression of each accession centered and scaled under the two conditions. The heatmap revealed the strong genetic effect on the N metabolism gene expressions since the clustering tree grouped most of the accessions by genotype and not by nutritive condition (Figure 3A). The heatmap isolated clearly the two extreme accessions Bur-0 and Bay-0 that showed the highest and lowest gene expressions respectively for all the genes, except GLN1.1, which had higher levels of transcripts in Bur-0 and Bay-0 than in any of the others accessions. We then run a PCA with the relative gene expression of GLN1.1, Nii, GDH, GLU1, and GLT (Figure 3B,C). The first PCA axis (Axis 1; Figure 3B) explained 48.6% of the global variation. The GLU1, GDH, GLT and Nii contributed the most to this component (Figure 3C). Although Axis1 did not separate totally the samples corresponding to the two conditions into two distinct groups, it clearly opposed the two conditions for each accession (Figure 3B). Projected distance onto this first component from an accession grown in the control condition to the same accession grown in the N starvation condition was always positive, corresponding to a global increase of expression of N metabolism-related genes (Figure 3B). The second axis (Axis 2, Figure 3B) explained 29.5% and it separated the samples following their genetic origin. Only GLN1.1, GDH and GLU1 contributed to this second component (Figure 3C), confirming the importance of these three genes in the strong G × N identified in ANOVA analysis.

3.2. The Relative Expressions of 18 Autophagy Genes Were Higher under Nitrate Starvation Than in the Control Condition

The relative expression of 24 autophagy-related (ATG) genes was monitored (Supplementary Table S3). Interestingly, most of these ATG genes showed a higher expression level under N starvation condition than in control condition (Table 2). The transcript levels of five of them (ATG1b, ATG7, ATG8b, ATG8c, ATG8d and ATG8e) were not significantly affected by the 24 h of nitrate starvation. The others responded to nitrate starvation by enhanced expression, ranging from +19% for ATG4a to more than +60% for ATG8h and ATG9.

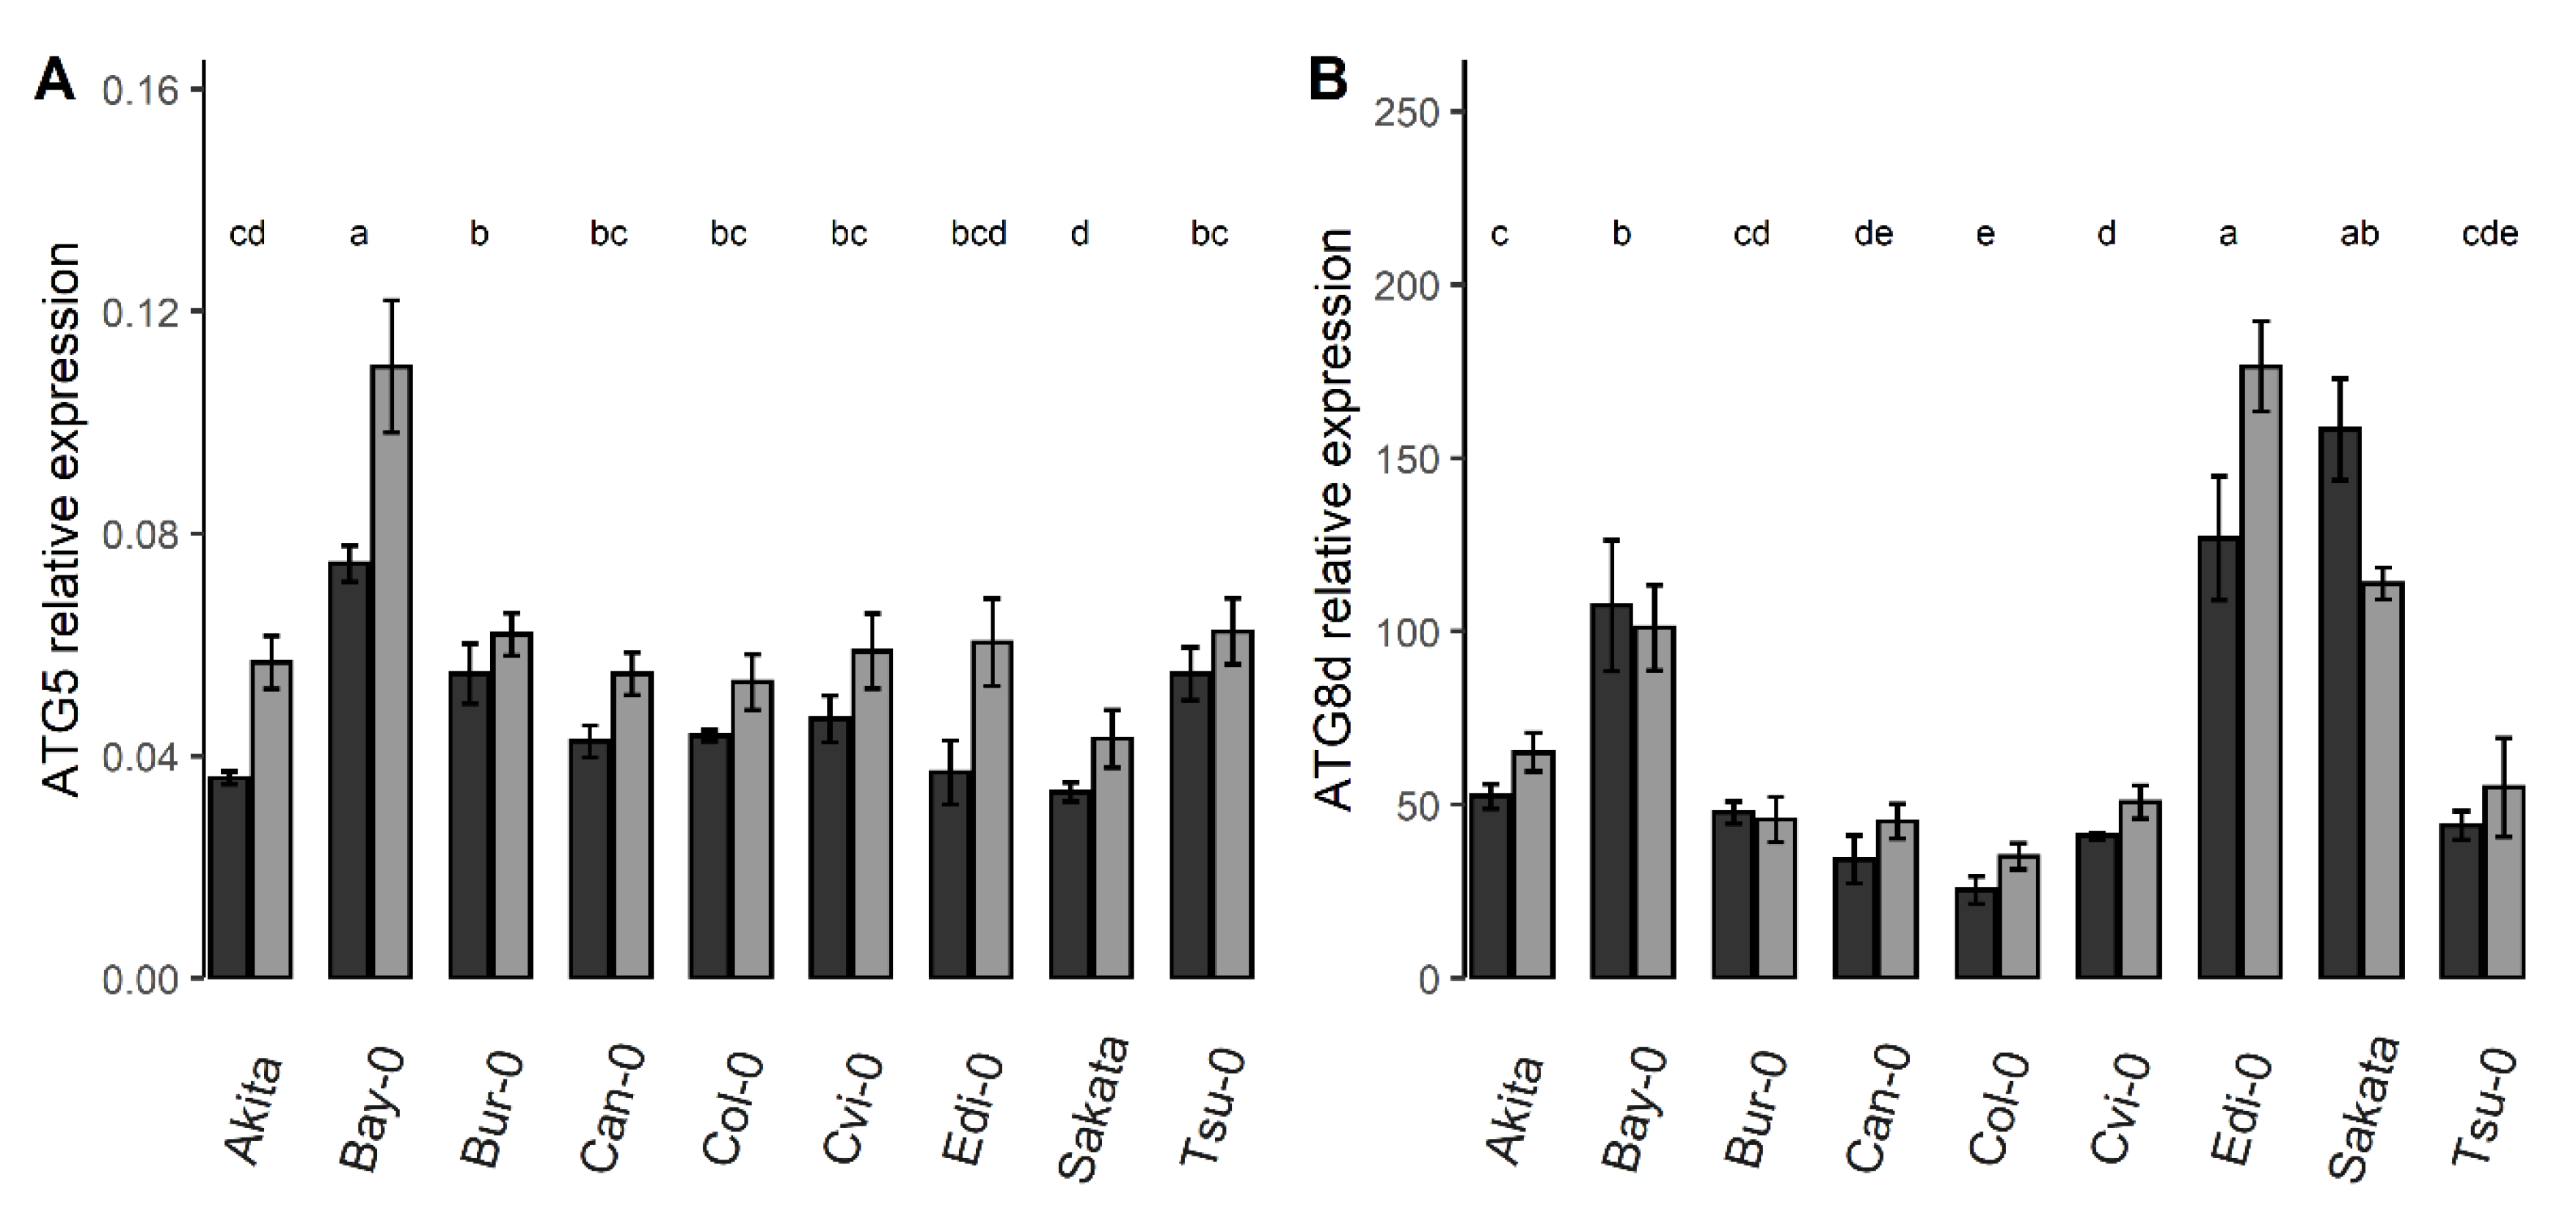
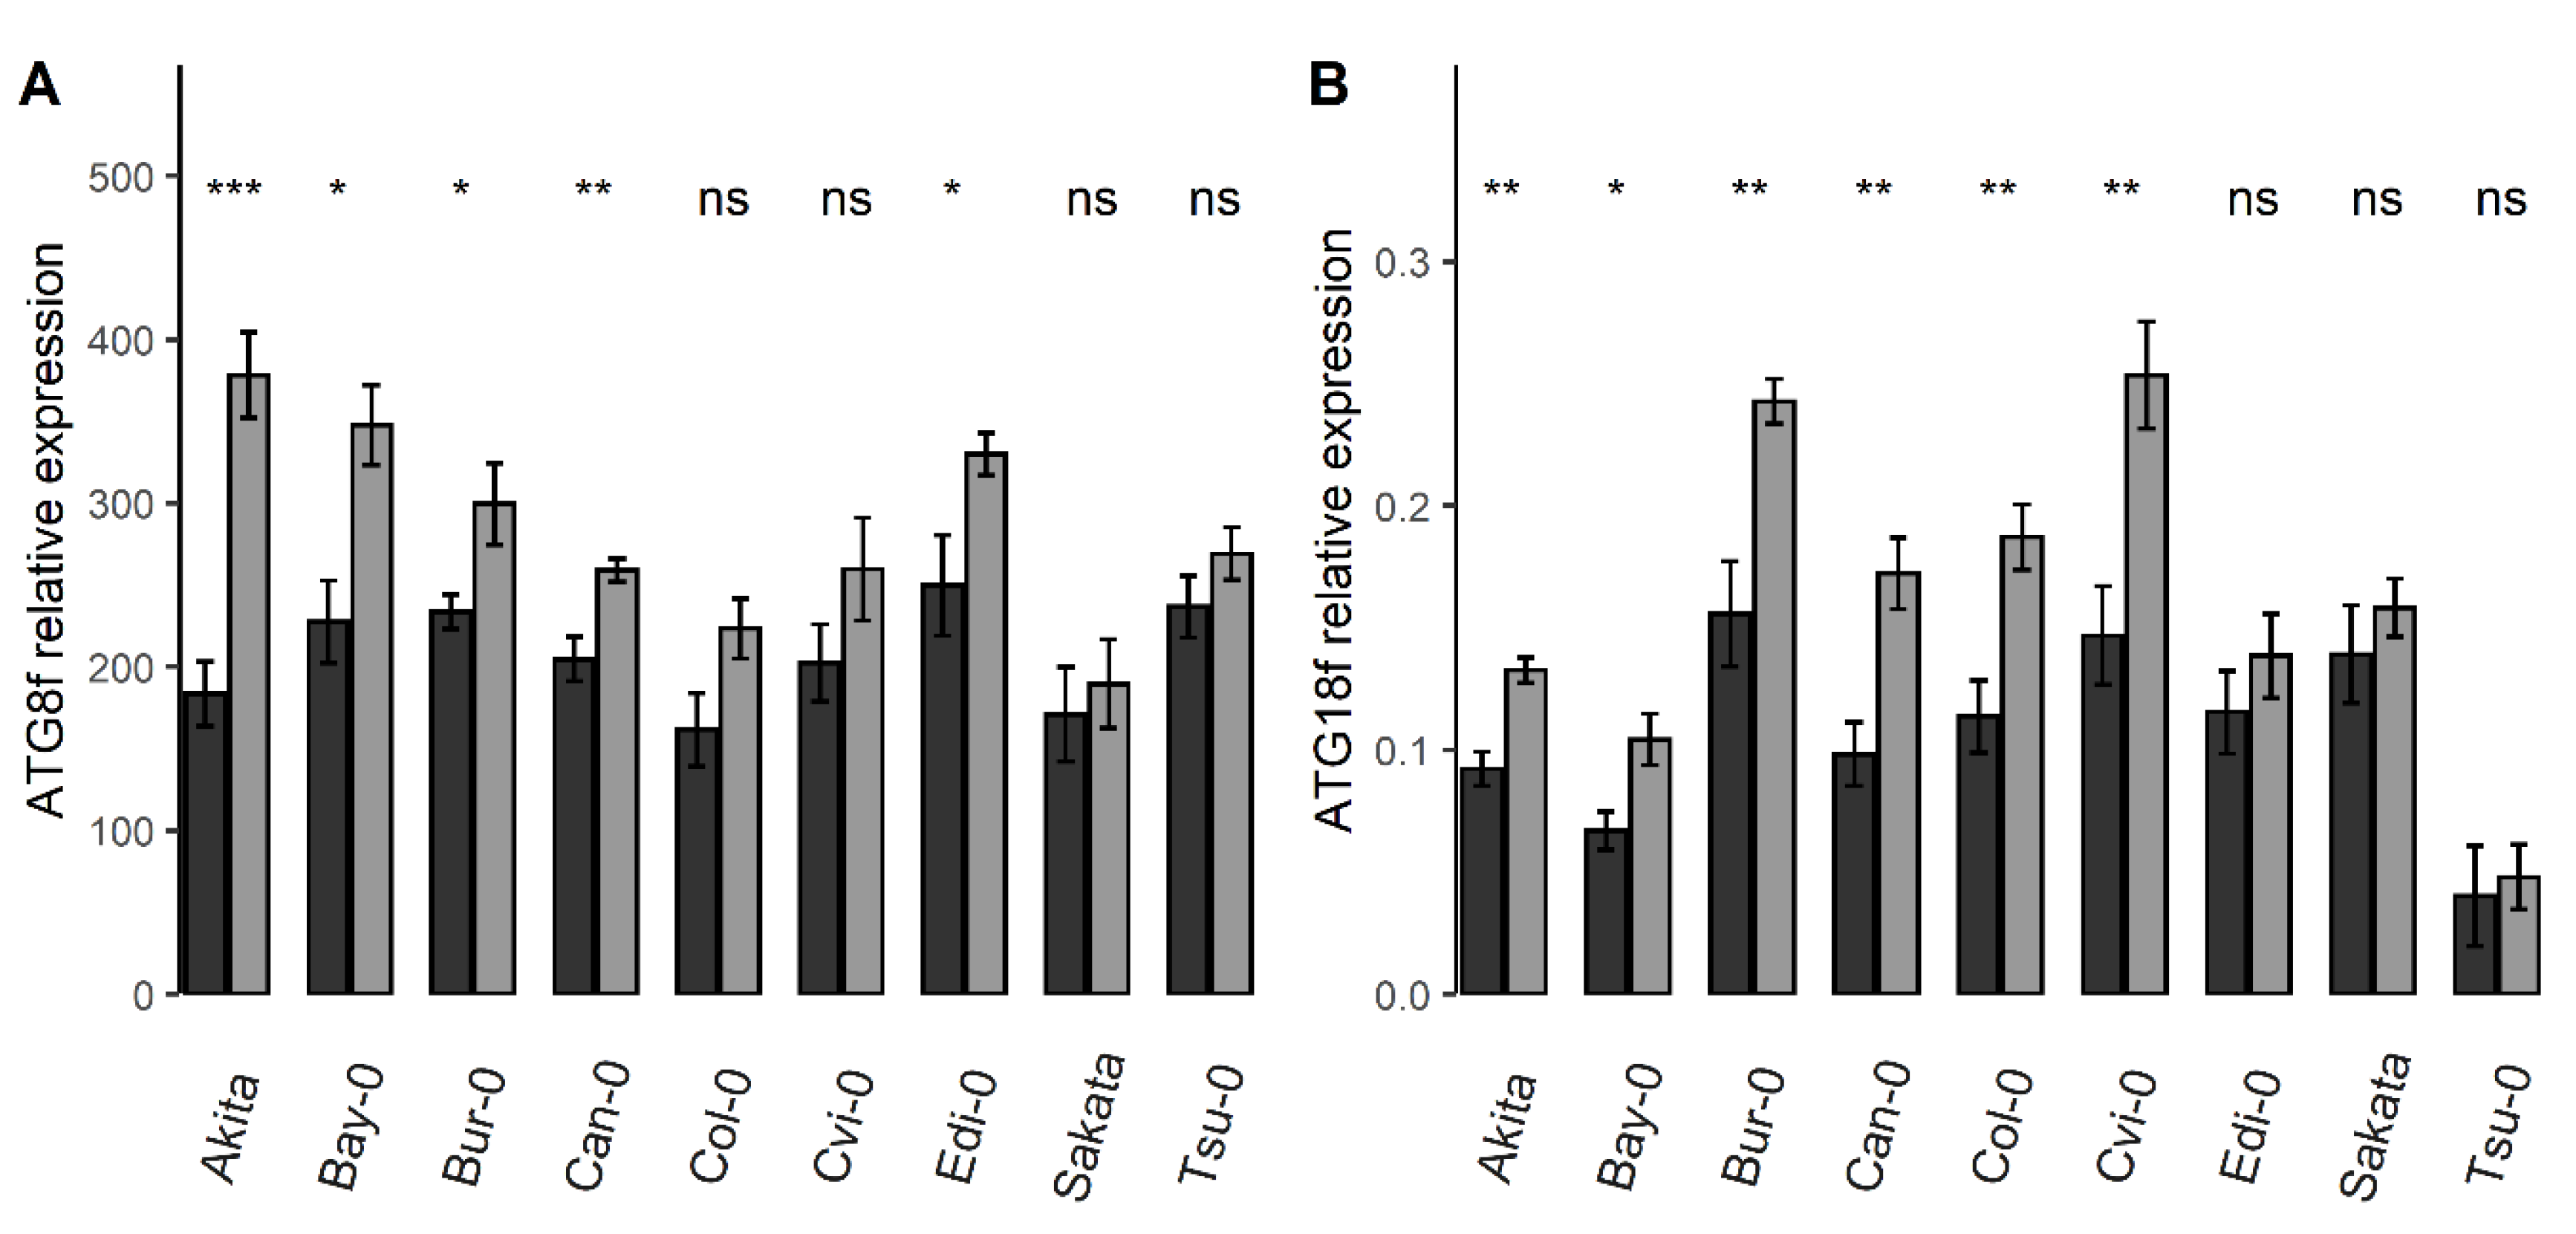
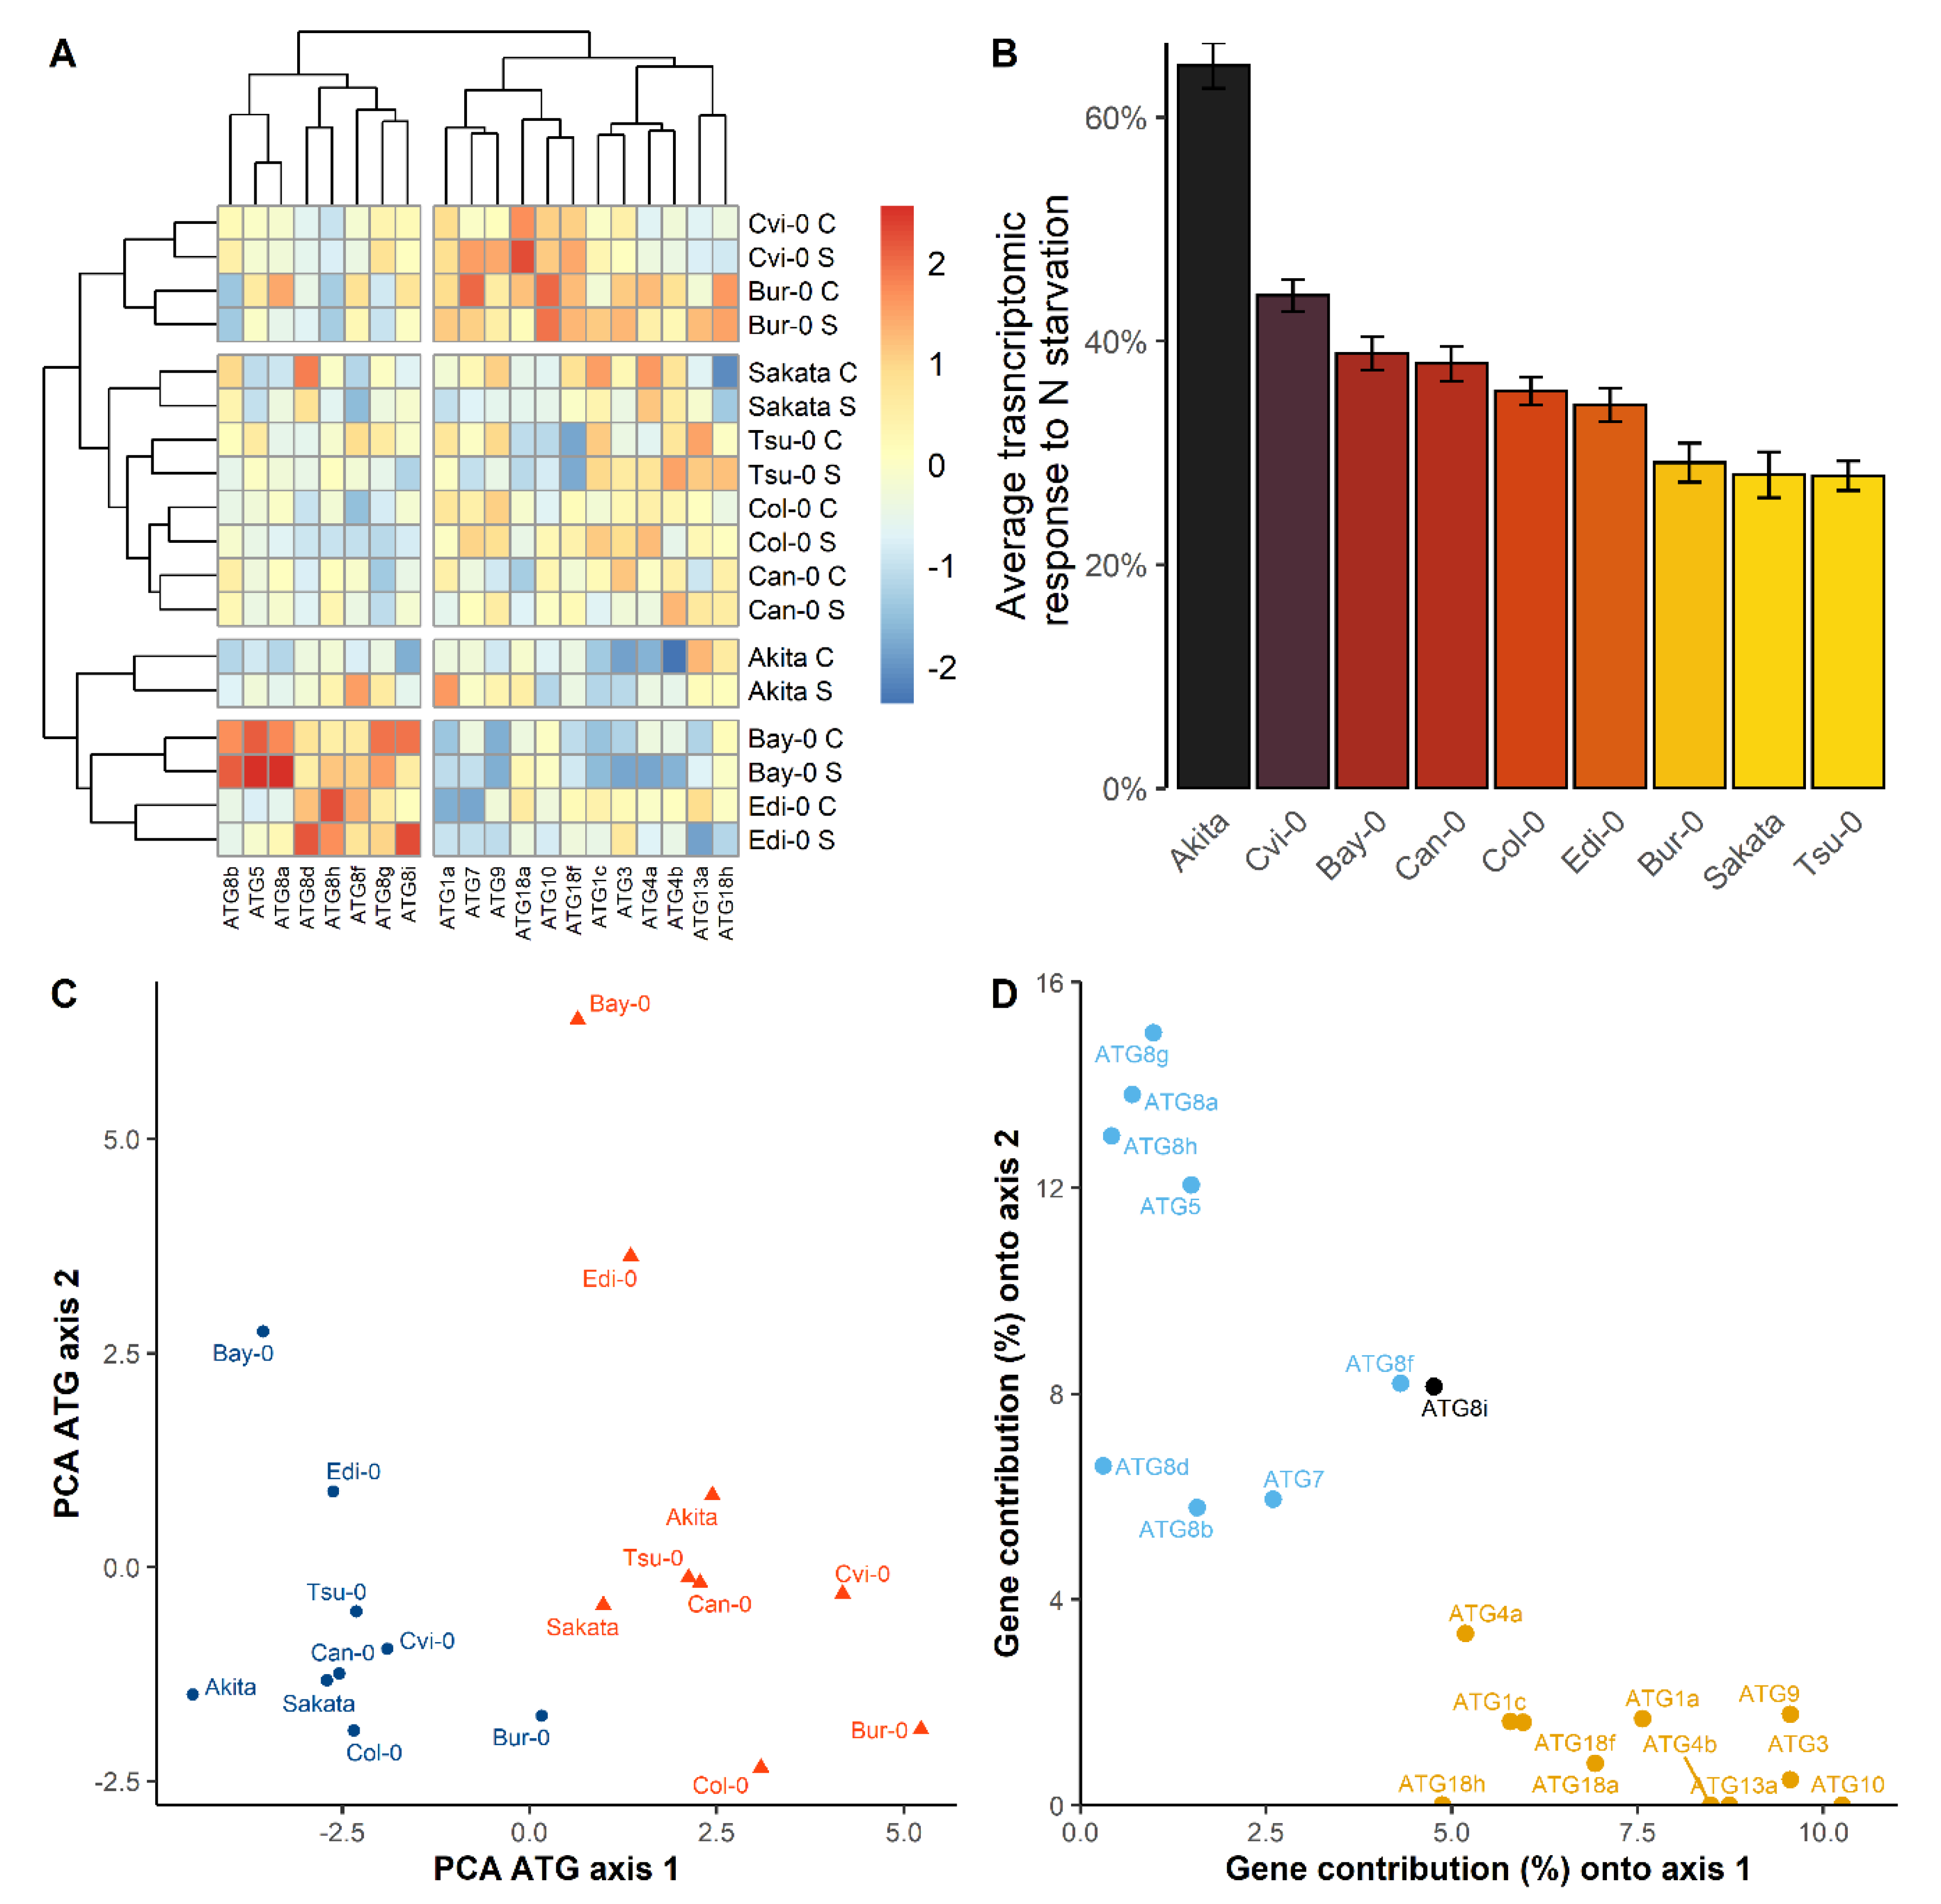
3.3. The Collection of Natural Accessions Revealed Genetic Variation of the Relative ATG Gene Expressions

The ANOVA analysis had shown that most of the ATG genes showed significant genotype-related variations (Figure 1B). However, unlike the N metabolism-related genes presented above, for which the genotype factor explained the largest part of the variation of their mRNA accumulation, the weights of genetic factor onto the transcript levels of the various ATG genes were quite variable. It explained less than 15% of the observed variation for ATG4a, ATG4b, ATG8i, ATG9, and ATG10, but more than 65% of the observed variation for ATG5, ATG8c, ATG8d, and ATG12a. For instance, the relative expression of ATG5 was much higher in Bay-0 than in all the other accessions and lower in Sakata (Figure 4A). This was different for ATG8d whose relative expression was sharply highest in Bay-0, Edi-0 and Sakata than in the other accessions (Figure 4B). Indeed, the accessions showing the highest relative gene expressions were different depending on each ATG gene.
In Figure 1B, the ANOVA had shown significant G × N interactions for 13 ATG genes (ATG1a, ATG1b, ATG5, ATG7, ATG8a, ATG8b, ATG8c, ATG8d, ATG8f, ATG8g, ATG8i, ATG12a and ATG18f), thus revealing that the level of response of the ATG genes to nitrate starvation varied among accessions. The Figure 5 illustrates this G × N interaction for ATG8f and ATG18f. We measured an overall increase of the relative expression of ATG8f and ATG18f in the N starvation condition compared to the control condition (Table 2). The increase of ATG8f expression was (i) significant and sharp in Akita and Bay-0 accessions (106% and 53%, respectively), (ii) significant but lower (less than 40%) in other accessions and (iii) suggested but not significant in Col-0, Cvi-0, Sakata, and Tsu-0. In similar manner, the increase of ATG18f expression was significant in almost all accessions; except in the three accessions Edi-0, Sakata, and Tsu-0. The rise of ATG18f expression under N starvation was especially important in Bur-0 and Cvi-0. Therefore, although results showed a general trend of increase of the relative expression level of ATG genes under N starvation, data mainly revealed that genetic variations were mostly independent of the growth conditions.
Considering that the global response of the ATG genes to the N starvation was genotype-dependent, we aimed at characterizing the specificity of each accession. We then clustered the matrix of the gene expression, scaled and centered by gene and nutritive conditions, selecting the 22 genes that responded to the growth conditions, with or without G × N. The heatmap that resulted from these data then showed that the clustering of the samples separated genotypes and not N nutrition (Figure 6A). Clustering then showed that the genetic diversity observed in the control condition remains similar in the N starvation condition. Some accessions were clearly distinguishable from the others. The Bay-0 and Edi-0 exhibited the higher expression values for several members of the ATG8 family and for ATG5 gene, whereas values for the other genes where globally the lowest as compared to the other accessions. Akita showed globally low ATG expression levels in the two conditions, while Cvi-0 and Bur-0 were mostly characterized by the high expressions of all the ATG genes in the two N conditions.
The global response of the nine accessions to nitrate starvation was then evaluated by computing for each accession the average differences of the expression levels of all the ATG genes between the control and N starvation conditions. This global difference of expression level was then normalized as percentage of the value expression in the control condition (Figure 6B). The global transcriptomic response to nitrate starvation was the highest in the Akita, Cvi-0, and Bay-0 and the lowest in Sakata, Bur-0, and Tsu-0. The highest average transcriptomic response rose to +66.7% in Akita accession. Interestingly, phenotype of leaf yellowing was observed solely on the Akita plants grown under the nitrate starvation condition (data not shown). We confirmed the early senescence of Akita by monitoring the relative expression of the SAG12 (Senescence Associated Gene 12) gene (Supplemental Figure S1).
PCA was run on the matrix of the expressions of the 22 ATG genes (Figure 6C). The first component explained 39.2% of the observed variation and separated well the plants growing under the two nutritive conditions (Axis 1). The second component (Axis 2) explained 23.9% and opposed mainly Bay-0 and Edi-0 from the other accessions. Twelve genes contributed to the first component. All the genes showing a strong effect of G × N interaction in ANOVA contributed to the second component (Figure 6D). On the first PCA axis, in the two nutritive conditions, Bur-0 and Cvi-0 accessions showed the highest values while Akita, Bay-0, and Sakata, showed the lowest. Interestingly, the projected position of accession Bur-0 in the control condition on the axis 1 is close to those of Sakata and Bay-0 in the N starvation condition. This result suggested that the overall expression of ATG genes in Bur-0 in the control condition is as high as that in Sakata and Bay-0 in the starvation condition.

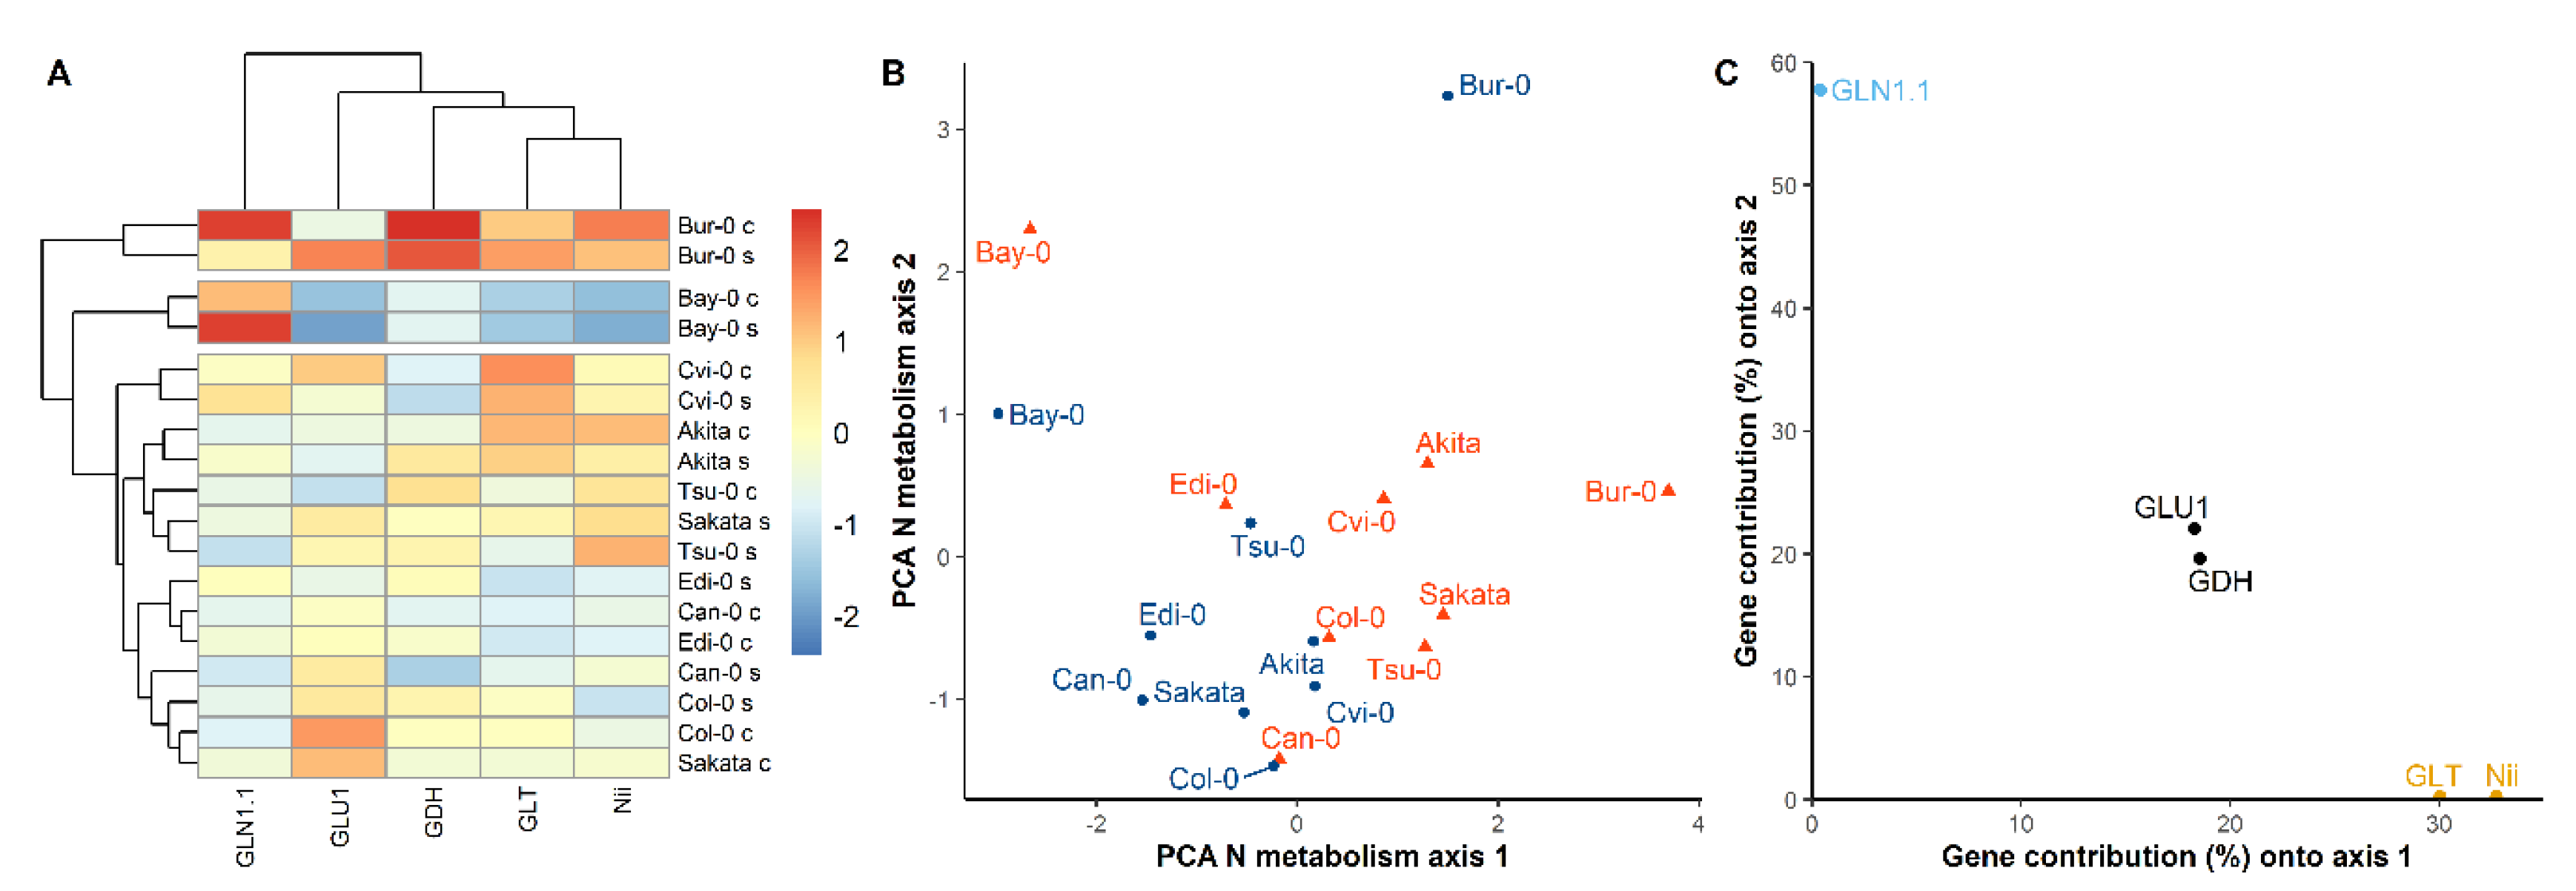
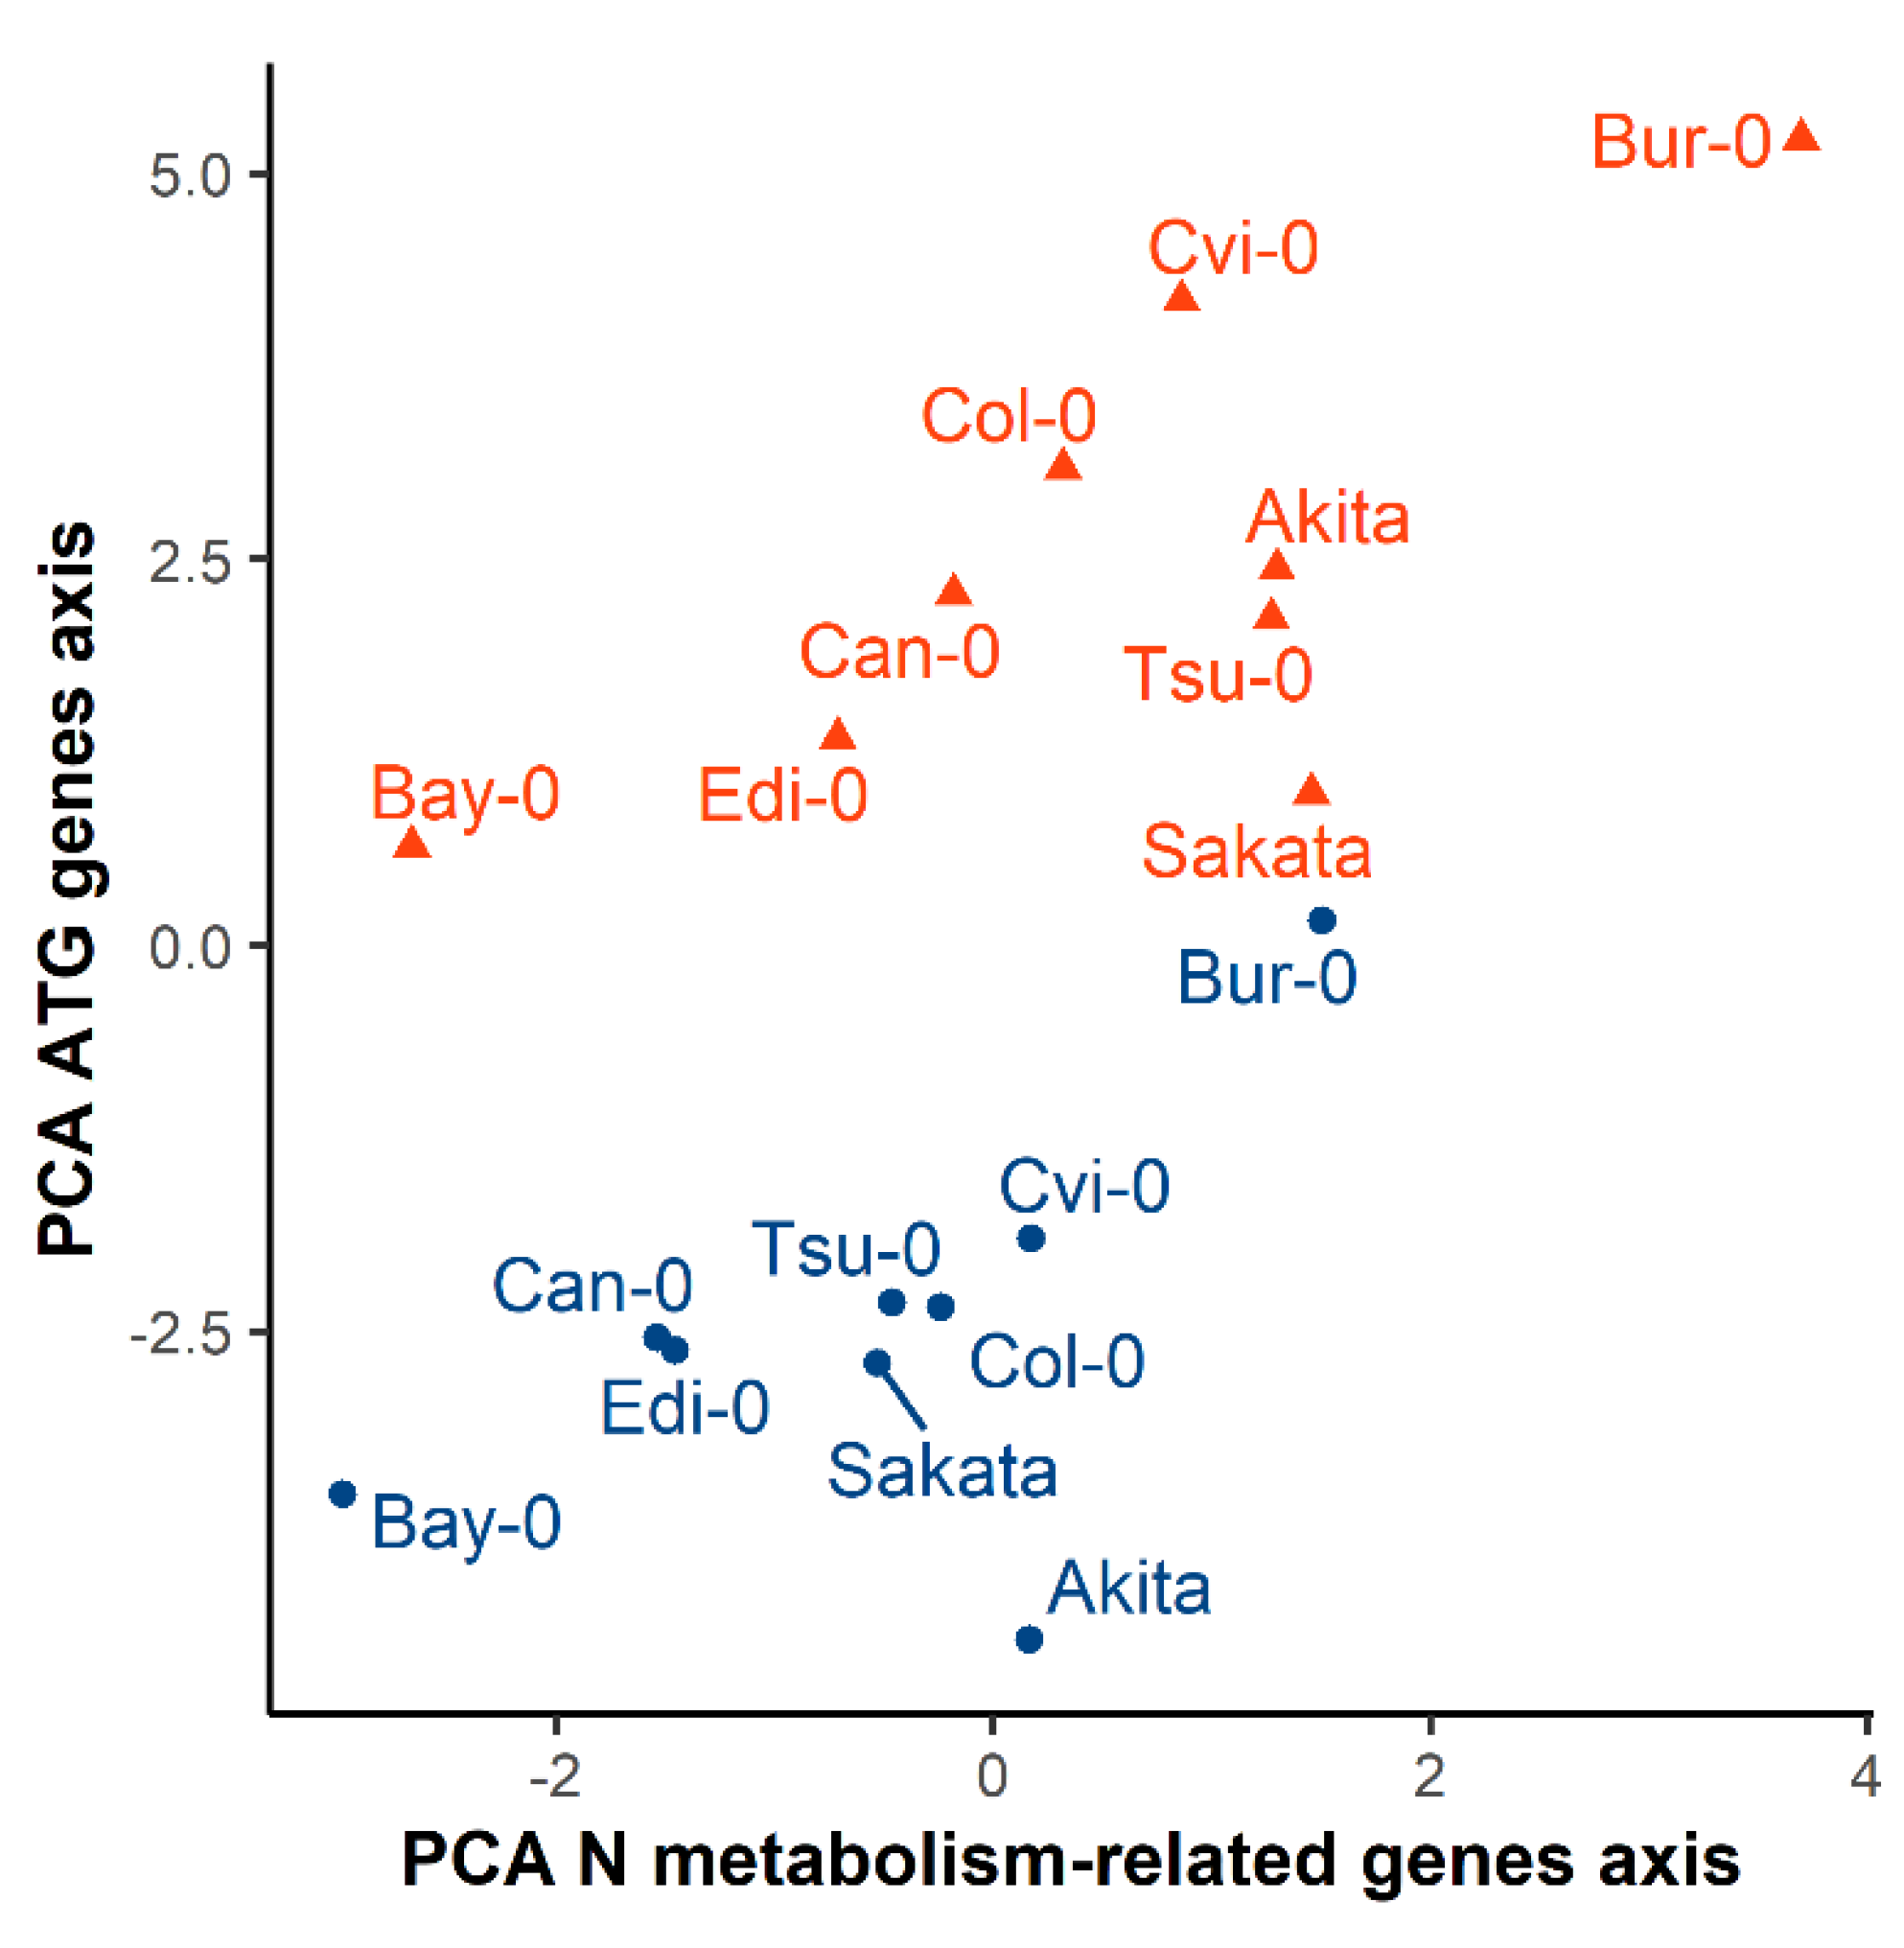
3.4. The Diversity of N Metabolism Gene Expressions and ATG Gene Expressions Are Correlated in the Two Nutritive Conditions

Finally, we investigated whether the strong genetic diversity of ATG gene expression is associated with the plant response to N starvation. To address this issue, we compared the genetic diversity of the two biological processes: autophagy and N metabolism. We assumed that the first PCA axes in the two PCA made with N metabolism-related and ATG gene expressions presented in Figure 3C and Figure 6C, were linear combinations underling the genetic diversity of the response of the genes to N starvation. Therefore, we recorded the coordinates obtained for each accession on the axis 1 of each PCA and plotted the coordinate values of ATG genes against the coordinates of the N metabolism-related genes (Figure 7). The whole set of data obtained on control and starvation condition revealed positive correlations between ATG gene coordinates and N metabolism gene coordinates (r = 0.62). Similar positive correlation was obtained in each nutritive condition separately (r = 0.56 and 0.71, respectively in the control and starvation conditions). The accessions showing the lowest expression levels of ATG genes, such as Bay-0, Can-0, and Edi-0, showed the lowest expression levels of N metabolism related genes, irrespective of the nutritive condition. The accessions showing the highest levels of N metabolism transcripts, such as Bur-0, had the highest ATG gene expression in the two conditions. We concluded that the plasticity in ATG gene expression within accessions was associated with the diversity of expression of genes involved in the ammonium assimilation.

4. Discussion

4.1. Coordinated Regulation of ATG Genes in Response to N Stress Condition

The macro-autophagy process is a vesicular mechanism involving 38 genes in Arabidopsis [29]. We recorded the relative expression level of 24 ATG genes in the rosette of plants grown under constant nitrate-rich condition (control) or submitted to N starvation for 24 h. We investigated nine Arabidopsis accessions to estimate the transcriptional plasticity of autophagy. In both ANOVA and multivariate analysis, the nutrition and genotype effects on the variations of gene expressions were significant. In ANOVA, the nutrition and genotype explained on average 14% and 37% of the observed variations respectively (Figure 1B). In PCA, the first principal component opposed the genotypes between the 2 nutritive conditions and explained 41% of the observed variation (Figure 6C). The expression level of the ATG genes was globally higher in the plants submitted to N starvation (Figure 3A–C). On average across all genotypes, no ATG transcripts abundance was lower in the starvation condition. The results were consistent with the studies showing the induction of autophagy under C and N limiting conditions [30,36,37]. Besides Arabidopsis, autophagy was shown to be induced in response to nitrogen deficiency in barley [43,44], foxtail millet [45], maize [46] and apple [47,48,49,50]. The global induction of several ATG genes by N starvation strongly suggests the existence of a coordinated regulation of the expression of ATG genes in response to nutritive starvation. The C/N balance is reported to regulate post-translationally the autophagy in response to nutriment and sugar deficiency in plants [51]. In low nutriment availability, the SnRK1 complex is activated whereas the TOR kinase complex is inhibited allowing the positive post-translational regulation of the autophagy activity [52]. Recent reports showed the phosphorylation of ATG proteins by TOR complex in a large-scale phosphoproteomics screen [53]. Recently, the transcription factor TGA9 has been reported as a master regulator of ATG8b and ATG8e gene expressions in response to C deficiency and to osmotic stress [38]. However, the molecular regulators involved in the up-regulation of autophagy gene expression by N limitation remains unknown. It could be an indirect effect on the C/N balance via the TOR pathway or an direct effect of the N pathway via some key actors of the nitrate response, such as NLP, TGA1 or TGA4 transcription factors [38,54].
Among the proteins involved in the core-machinery of autophagy, some ATG proteins are coded by a single gene whereas others are coded by small gene families. We have observed a great diversity of response levels in the collection of the 20 ATG genes differentially expressed during nitrate deficiency. The list of genes responding the most strongly to the N starvation included some genes that are unique in the autophagy process (like ATG3, ATG5, ATG9, and ATG10) and some specific members belonging to ATG gene families (Table 2). On the three members of the ATG1 family, only ATG1a and ATG1c were differentially expressed between the two conditions. The two members of ATG4 family also differed in their degree of response since ATG4b was more enhanced than ATG4a. Among the three ATG18 members investigated, ATG18f showed the highest response. Interestingly, five of the nine members of the ATG8 family (ATG8a, ATG8f, ATG8g, ATG8h and ATG8i) highly responded to nitrate starvation, while the expression of other members was little or not modified by N stress. This could be explained by the fact that some ATG8 isoforms are involved in non-canonical autophagy processes and then not regulated as others [55,56,57]. The high differential expression of genes, which are present in single copy in the Arabidopsis genome, support the hypothesis of a general transcriptional activation of autophagy in the N stress condition. In contrast, the absence of differential expression of the unique ATG7 gene could be surprising, but it may be explained by a strong regulation of its mRNA stability. In human, the binding of mir190A to the 3′-UTR of ATG7 mRNA regulates its stability [58]. Conservation of similar mechanism to control of ATG7 expression remains to be discovered in plants.
The activation of particular members of gene families, such as ATG1, ATG4 and ATG8 families, underlines their importance in the response to N starvation. The abundance transcripts of ATG8 members is notable since the ATG8 proteins are well known to be at the basis of the selectivity of the autophagy by interacting with specific cargo materials [59]. The ATG8 genes enhanced by C starvation are almost the same members as we found in the present study to respond to N starvation, with some exceptions. In our condition, the N limiting condition did not affect ATG8b expression but enhanced ATG8f expression (Table 2), while previous studies report an enhancement of ATG8b expression, without any effect on ATG8f expression, in both the N limited and fixed-carbon starvation conditions [36,38]. Difference in activation of ATG8 transcripts may due to difference in plant growth conditions and the duration of the stress. Moreover, in most studies about autophagy in Arabidopsis, the accession Col-0 was chosen as reference, while in our study the effect of nutrition was estimated on our whole collection. Variation between of the global trend observed in a collection of genotypes and the specificity of a single accession may generate the differences in the observation. Nevertheless, from the consistent finding of the response of ATG8 genes to the C and N limiting conditions, we hypothesized that ATG8a, ATG8g, ATG8h and ATG8i are involved in the nutritional response to the C/N balance while ATG8b accumulation is specific of the C limiting conditions and ATG8f is specific of the N limiting conditions. We noticed that ATG8h was the most highly induced by N starvation in here and in previous studies [36,38]. Interestingly, this gene has lower similarity to other members of ATG8 family. It possesses an exposed Gly residue essential for lipidation, and is thus not supposed to be subjected to cleavage by ATG4 as the other ATG8 members [32]. Moreover, ATG8h is well known to interact with several cargo proteins, such as the ATG8-interaction protein ATI1 in Arabidopsis [55] or plant cell death suppressor ADI3 in tomato [60], suggesting that protein is a key actor of the response to the C/N balance.

4.2. Transcriptinal Diversity of ATG Genes among Arabidopsis Accessions

We investigated the genetic diversity of ATG genes among nine Arabidopsis accessions. We first noticed a genetic variation of the accumulation of the ATG transcripts, even in the control condition. Almost all tested genes showed a genetic variation, independently of the nutrition factor (Figure 1B). In the PCA analysis, the natural diversity is even more obvious (Figure 6C). In the two nutritive conditions, the accessions Akita, Sakata, and Bay-0 showed a lower level of ATG transcript accumulation than other accessions. By contrast, Bur-0 and Cvi-0, presented globally high ATG transcript levels. We concluded that the basal autophagy activity naturally varies depending on the genotype. This plasticity of basal autophagy was enhanced by a natural variation for the overall increase of ATG genes during the N deficiency (Figure 6B). The average of transcriptomic increase across all ATG genes was more than 40% in accessions Akita, Cvi-0 and Bay-0 whereas it was less than 30% in accessions Bur-0 and Tsu-0, suggesting that the three first accessions responded more strongly to N starvation than the latter accessions.
We noticed that three accessions Bay-0, Edi-0 and Akita had particular patterns of ATG expression (Figure 6A). The accession Bay-0, and in a latter extend Edi-0, accumulated together more transcripts of ATG5 and of several ATG8 members, but they had relatively fewer transcripts of other ATG genes compared to the other accessions. The transcripts of almost all ATG genes are relatively less in the accession Akita. To explain these genetic variations, we hypnotized that the autophagy was less efficient in Bay-0, Edi-0, and Akita compared to the other accessions. Indeed, it has reported that autophagy mutants (atg5, atg9, atg18a, atg10) had higher ATG8 transcript levels than wild type although they are autophagy deficient [36,61,62]. This could be because the absence of N-recycling is sensed as N deficiency in these mutants. The observation of early senescence phenotype (data not shown) and relative accumulation of senescence associated gene SAG12 in the accessions Akita and Bay-0 (Supplemental Figure S1) support this hypothesis since the rosettes of Arabidopsis atg mutants show also early senescence phenotype [23,33].
The demonstration of large natural variation for autophagy, and the description of accessions with high or low autophagy, indicate that it could be possible to modulate the expression level of ATG genes (and possibly autophagy activity) avoiding the dramatic effect of k.o. mutants or the use of plants with over-expressing genes.

4.3. Autophagy Is Part of the Integral Response of the N Metabolism to N Availability

One aim of our study was to determine whether the natural diversity in the ability of genotypes to enhance gene expressions in response to N starvation could provide some advantage/disadvantage to the adaptation of Arabidopsis to nitrogen scarcity. Polymorphisms in ATG genes in animal have been observed and associated with disease resistance. For instance, a genome-wide association study in human identified polymorphisms in ATG gene, ATG16L, associated with differences in disease pathogenesis [63]. In worms, the diversity of LLG-2, an homologous gene of Arabidopsis ATG8 genes, is correlated with the microsporidia colonization inside intestinal cells [64]. In our present study, we did not look for genomic polymorphism of ATG genes in our collection of accessions. However, the sequenced genomes of six studied accessions (Cvi-0, Can-0, Col-0, Edi-0, Bur-0, and Tsu-0) are available in the 1001 genome database [65]. Within the sequences, we checked the polymorphism in ATG genes in the six accessions but only the accession Bur-0 showed polymorphisms in the two genes ATG8a and ATG8e. The lack of massive detected polymorphism in the coding sequences of ATG genes suggest that the recorded variability of mRNA accumulation is due to variation of regulators or polymorphisms in the promoter region.
Autophagy is well known to be involved in the regulation of plant growth in response to environmental stress [26]. On one hand, disruption of ATG genes results in early leaf senescence and low N remobilization efficiency from the rosette to the seeds in Arabidopsis [33], whereas enhanced autophagy leads to increased seed yield under nitrate limitation and allows a better N remobilization under full nitrate conditions [34]. On the other hand, there is a large natural variation for plant adaptation to N starvation and N limitation [17,18,19], as well as for the N uptake and N remobilization efficiency among Arabidopsis accessions [21,22]. In the present study, we evaluated the plant adaptation to nitrate starvation by monitoring the transcripts accumulation of 11 genes involved in N metabolism. In addition to the strong genetic difference between accessions, we showed that five genes, GLN1.1, Nii, GDH, GLU1, and GLT, were good markers to characterize the natural diversity for adaptation to N starvation among accessions (Figure 2B). Recently, the expression of GLU1 was proposed also to be a biomarker for NUE in a collection of 101 Arabidopsis accessions, following the pattern lower expression in the shoots of lines with high NUE [66]. Compared to Col-0, Bur-0 was described as an accession well adapted to N limitation [17,20,21]. At a same nitrogen nutrition index, defined as the ratio of the N amounts of plants growing in deficient and sufficient conditions, Bur-0 was an efficient accession for shoot biomass production whereas Col-0 was an inefficient accession [18]. Since GLN1.1, GDH and GLU1 transcripts were highly accumulated in Bur-0 accession in the N starvation condition (Figure 2A), our results did not support the hypothesis of Meyer et al. [66].
We compared the results obtained in this study with published transcriptomic data on the response of genes to nitrate starvation in supplemental Table S4. In this table, we added our results obtained first on the average of all the accessions (from Table 1; Table 2), and second in the specific Col-0 accession (from Supplemental Tables S2 and S3), since Col-0 is commonly used as a reference in the literature. From Table S4, we conclude that:
(i)
the results of our study are consistent with the other experiments,
(ii)
the average on the nine accessions allowed us to obtain more congruent results than with a single accession, supporting then the relevance of our approach based on the natural diversity,
(iii)
our study provides new results, in particular for ATG genes, that remain poorly documented in the published transcriptomic data cited in Table S4.
The small heterogeneity between transcriptomic studies supported the previous observation reported by Prof Gutiérrez’s team, which was that the response of “biological process” Gene ontology terms to nitrate deficiency is less sensitive to the experimental context than the gene expressions [67]. In the same way as authors proposed compare gene expressions between studies using the “biological processes”, we have synthetized the response of our genes to nitrate starvation differentiating N metabolism and autophagy as the two biological processes. This was done by working on the PCA axis that are linear combinations of gene expressions that reduced the heterogeneity obtained for one particular gene. This strategy provided a score for each accession, in the two conditions, and for the two processes. Considering that the first components of PCA for ATG and N metabolism genes summarized the global diversity of accession for autophagy and of N metabolism, we observed a strong positive relationship between the level of accumulation of the mRNA of ATG genes and the level of accumulation of mRNA of N enzymes, regardless the nutrition status (Figure 7). Accessions, such as Bay-0 and Edi-0, have naturally low transcript levels of ATG and of ammonium assimilation-related gene compared to accessions such as Bur-0 (Figure 7). Interestingly, the high level of ATG transcripts in Bur-0 might be well associated with its high NUE [17,20]. Indeed, the accession Bur-0 previously showed an enhanced remobilization compared to other accessions such as Col-0 and Edi-0 [22]. Bur-0 displayed phenotypes that could remind the ATG8 over-expressing lines analyzed by Chen et al. [34] that displayed higher N remobilization from the rosette to the seeds and higher N% in seeds under normal N conditions. Altogether, results suggest that the basal activity of autophagy could be associated with capacity of genotypes to be adapted to low N availability. Further experimentations now need to be carried out to explain the observed relationships. Several factors may affect the expression of ATG genes and N remobilization genes. The duration of the N starvation, the kinetics of gene expression, the circadian rhythm, aging, and natural senescence are all well-known external and internal regulators of autophagy and central metabolism that could be investigated.

Supplementary Materials

The following are available online at https://0-www-mdpi-com.brum.beds.ac.uk/2073-4409/9/4/1021/s1. Supplemental Table S1: List of primers used. Supplemental Table S2: Results of qPCR of N metabolism related genes among accessions in two conditions. Supplemental Table S3: Results of qPCR of ATG genes among accessions in two conditions. Supplemental Table S4: Comparison with Publicly Available Microarray Data. Supplemental Figure S1: Relative expression of SAG12 gene in nine accessions grown in the control and N starvation conditions. Blue and red bars are the relative expressions of SAG12 in nine Arabidopsis accessions grown respectively in the control and N starvation conditions.

Author Contributions

F.C. conceived and supervised this study. F.C. and M.B. designed the research and conducted the experiments. A.M. provided expertise and help with pPCR measurements. F.C. and C.M.-D. wrote the manuscript. All authors have read and agreed to the published version of the manuscript.

Funding

The authors thank the ANR program (ANR-12-ADAPT-0010-0) for financial support. The IJPB benefits from the support of Saclay Plant Sciences-SPS (ANR-17-EUR-0007). This work has benefited from the support of IJPB’s Plant Observatory technological platforms.

Conflicts of Interest

The authors declare no conflict of interest.

References

  1. Masclaux-Daubresse, C.; Daniel-Vedele, F.; Dechorgnat, J.; Chardon, F.; Gaufichon, L.; Suzuki, A. Nitrogen uptake, assimilation and remobilization in plants: Challenges for sustainable and productive agriculture. Ann. Bot. 2010, 105, 1141–1157. [Google Scholar] [CrossRef] [Green Version]
  2. Lassaletta, L.; Billen, G.; Grizzetti, B.; Anglade, J.; Garnier, J. 50 year trends in nitrogen use efficiency of world cropping systems: The relationship between yield and nitrogen input to cropland. Environ. Res. Lett. 2014, 9, 105011. [Google Scholar] [CrossRef]
  3. Strahm, B.D.; Harrison, R.B. Nitrate Sorption in a Variable-Charge Forest Soil of the Pacific Northwest. Soil Sci. 2006, 171, 313–321. [Google Scholar] [CrossRef]
  4. Tschoep, H.; Gibon, Y.; Carillo, P.; Armengaud, P.; Szecowka, M.; Nunes-Nesi, A.; Fernie, A.R.; Koehl, K.; Stitt, M. Adjustment of growth and central metabolism to a mild but sustained nitrogen-limitation in Arabidopsis. Plant Cell Environ. 2009, 32, 300–318. [Google Scholar] [CrossRef] [PubMed]
  5. Bi, Y.M.; Wang, R.L.; Zhu, T.; Rothstein, S.J. Global transcription profiling reveals differential responses to chronic nitrogen stress and putative nitrogen regulatory components in Arabidopsis. BMC Genom. 2007, 8, 281. [Google Scholar] [CrossRef] [PubMed] [Green Version]
  6. Krapp, A.; Berthomé, R.; Orsel, M.; Mercey-Boutet, S.; Yu, A.; Castaings, L.; Elftieh, S.; Major, H.; Renou, J.P.; Daniel-Vedele, F. Arabidopsis roots and shoots show distinct temporal adaptation patterns toward nitrogen starvation. Plant Physiol. 2011, 157, 1255–1282. [Google Scholar] [CrossRef] [Green Version]
  7. Menz, J.; Li, Z.; Schulze, W.X.; Ludewig, U. Early nitrogen-deprivation responses in Arabidopsis roots reveal distinct differences on transcriptome and (phospho-) proteome levels between nitrate and ammonium nutrition. Plant J. 2016, 88, 717–734. [Google Scholar] [CrossRef]
  8. Scheible, W.R.; Morcuende, R.; Czechowski, T.; Fritz, C.; Osuna, D.; Palacios-Rojas, N.; Schindelasch, D.; Thimm, O.; Udvardi, M.K.; Stitt, M. Genome-wide reprogramming of primary and secondary metabolism, protein synthesis, cellular growth processes, and the regulatory infrastructure of arabidopsis in response to nitrogen. Plant Physiol. 2004, 136, 2483–2499. [Google Scholar] [CrossRef] [Green Version]
  9. Kiba, T.; Krapp, A. Plant Nitrogen Acquisition Under Low Availability: Regulation of Uptake and Root Architecture. Plant Cell Physiol. 2016, 57, 707–714. [Google Scholar] [CrossRef] [Green Version]
  10. Krapp, A.; David, L.C.; Chardin, C.; Girin, T.; Marmagne, A.; Leprince, A.-S.; Chaillou, S.; Ferrario-Méry, S.; Meyer, C.; Daniel-Vedele, F. Nitrate transport and signalling in Arabidopsis. J. Exp. Bot. 2014, 65, 789–798. [Google Scholar] [CrossRef]
  11. Nacry, P.; Bouguyon, E.; Gojon, A. Nitrogen acquisition by roots: Physiological and developmental mechanisms ensuring plant adaptation to a fluctuating resource. Plant Soil 2013, 370, 1–29. [Google Scholar] [CrossRef] [Green Version]
  12. Loqué, D.; Yuan, L.; Kojima, S.; Gojon, A.; Wirth, J.; Gazzarrini, S.; Ishiyama, K.; Takahashi, H.; von Wirén, N. Additive contribution of AMT1;1 and AMT1;3 to high-affinity ammonium uptake across the plasma membrane of nitrogen-deficient Arabidopsis roots. Plant J. 2006, 48, 522–534. [Google Scholar] [CrossRef] [PubMed]
  13. Yuan, L.; Loqué, D.; Kojima, S.; Rauch, S.; Ishiyama, K.; Inoue, E.; Takahashi, H.; Von Wiréna, N. The organization of high-affinity ammonium uptake in Arabidopsis roots depends on the spatial arrangement and biochemical properties of AMT1-type transporters. Plant Cell 2007, 19, 2636–2652. [Google Scholar] [CrossRef] [PubMed] [Green Version]
  14. Takabayashi, A.; Niwata, A.; Tanaka, A. Direct interaction with ACR11 is necessary for post-transcriptional control of GLU1-encoded ferredoxin-dependent glutamate synthase in leaves. Sci. Rep. 2016, 6, 29668. [Google Scholar] [CrossRef] [Green Version]
  15. Krapp, A. Plant nitrogen assimilation and its regulation: A complex puzzle with missing pieces. Curr. Opin. Plant Biol. 2015, 25, 115–122. [Google Scholar] [CrossRef]
  16. Alonso-Blanco, C.; Aarts, M.G.M.; Bentsink, L.; Keurentjes, J.J.B.; Reymond, M.; Vreugdenhil, D.; Koornneef, M. What has natural variation taught us about plant development, physiology, and adaptation? Plant Cell 2009, 21, 1877–1896. [Google Scholar] [CrossRef] [Green Version]
  17. Ikram, S.; Bedu, M.; Daniel-Vedele, F.; Chaillou, S.; Chardon, F. Natural variation of Arabidopsis response to nitrogen availability. J. Exp. Bot. 2012, 63, 91–105. [Google Scholar] [CrossRef] [Green Version]
  18. Chietera, G.; Chaillou, S.; Bedu, M.; Marmagne, A.; Masclaux-Daubresse, C.; Chardon, F. Impact of the genetic–environment interaction on the dynamic of nitrogen pools in arabidopsis. Agriculture 2018, 8, 28. [Google Scholar] [CrossRef] [Green Version]
  19. North, K.A.; Ehlting, B.; Koprivova, A.; Rennenberg, H.; Kopriva, S. Natural variation in Arabidopsis adaptation to growth at low nitrogen conditions. Plant Physiol. Biochem. 2009, 47, 912–918. [Google Scholar] [CrossRef]
  20. Menz, J.; Range, T.; Trini, J.; Ludewig, U.; Neuhäuser, B. Molecular basis of differential nitrogen use efficiencies and nitrogen source preferences in contrasting Arabidopsis accessions. Sci. Rep. 2018, 8, 3373. [Google Scholar] [CrossRef] [Green Version]
  21. Chardon, F.; Barthélémy, J.; Daniel-Vedele, F.; Masclaux-Daubresse, C. Natural variation of nitrate uptake and nitrogen use efficiency in arabidopsis thaliana cultivated with limiting and ample nitrogen supply. J. Exp. Bot. 2010, 61, 2293–2302. [Google Scholar] [CrossRef] [PubMed] [Green Version]
  22. Masclaux-Daubresse, C.; Chardon, F. Exploring nitrogen remobilization for seed filling using natural variation in Arabidopsis thaliana. J. Exp. Bot. 2011, 62, 2131–2142. [Google Scholar] [CrossRef] [Green Version]
  23. Thompson, A.R.; Vierstra, R.D. Autophagic recycling: Lessons from yeast help define the process in plants. Curr. Opin. Plant Biol. 2005, 8, 165–173. [Google Scholar] [CrossRef]
  24. Li, F.; Vierstra, R.D. Autophagy: A multifaceted intracellular system for bulk and selective recycling. Trends Plant Sci. 2012, 17, 526–537. [Google Scholar] [CrossRef] [PubMed]
  25. Havé, M.; Marmagne, A.; Chardon, F.; Masclaux-Daubresse, C. Nitrogen remobilization during leaf senescence: Lessons from Arabidopsis to crops. J. Exp. Bot. 2017, 68, 2513–2529. [Google Scholar]
  26. Slavikova, S.; Ufaz, S.; Avin-Wittenberg, T.; Levanony, H.; Galili, G. An autophagy-associated Atg8 protein is involved in the responses of Arabidopsis seedlings to hormonal controls and abiotic stresses. J. Exp. Bot. 2008, 59, 4029–4043. [Google Scholar] [CrossRef] [PubMed] [Green Version]
  27. Liu, Y.; Xiong, Y.; Bassham, D.C. Autophagy is required for tolerance of drought and salt stress in plants. Autophagy 2009, 5, 954–963. [Google Scholar] [CrossRef] [Green Version]
  28. Fagard, M.; Launay, A.; Clément, G.; Courtial, J.; Dellagi, A.; Farjad, M.; Krapp, A.; Soulié, M.C.; Masclaux-Daubresse, C.; Clement, G.; et al. Nitrogen metabolism meets phytopathology. J. Exp. Bot. 2014, 65, 5643–5656. [Google Scholar] [CrossRef]
  29. Mizushima, N.; Yoshimori, T.; Ohsumi, Y. The Role of Atg Proteins in Autophagosome Formation. Annu. Rev. Cell Dev. Biol. 2011, 27, 107–132. [Google Scholar] [CrossRef] [PubMed]
  30. Yoshimoto, K.; Hanaoka, H.; Sato, S.; Kato, T.; Tabata, S.; Noda, T.; Ohsumi, Y. Processing of ATG8s, ubiquitin-like proteins, and their deconjugation by ATG4s are essential for plant autophagy. Plant Cell 2004, 16, 2967–2983. [Google Scholar] [CrossRef]
  31. Hanaoka, H.; Noda, T.; Shirano, Y.; Kato, T.; Hayashi, H.; Shibata, D.; Tabata, S.; Ohsumi, Y. Leaf senescence and starvation-induced chlorosis are accelerated by the disruption of an Arabidopsis autophagy gene. Plant Physiol. 2002, 129, 1181–1193. [Google Scholar] [CrossRef] [PubMed] [Green Version]
  32. Doelling, J.H.; Walker, J.M.; Friedman, E.M.; Thompson, A.R.; Vierstra, R.D. The APG8/12-activating enzyme APG7 is required for proper nutrient recycling and senescence in Arabidopsis thaliana. J. Biol. Chem. 2002, 277, 33105–33114. [Google Scholar] [CrossRef] [PubMed] [Green Version]
  33. Guiboileau, A.; Yoshimoto, K.; Soulay, F.; Bataillé, M.-P.; Avice, J.-C.; Masclaux-Daubresse, C. Autophagy machinery controls nitrogen remobilization at the whole-plant level under both limiting and ample nitrate conditions in Arabidopsis. New Phytol. 2012, 194, 732–740. [Google Scholar] [CrossRef] [PubMed]
  34. Chen, Q.; Soulay, F.; Saudemont, B.; Elmayan, T.; Marmagne, A.; Masclaux-Daubresse, C. Overexpression of ATG8 in Arabidopsis Stimulates Autophagic Activity and Increases Nitrogen Remobilization Efficiency and Grain Filling. Plant Cell Physiol. 2019, 60, 343–352. [Google Scholar] [CrossRef] [PubMed]
  35. Liu, Y.; Bassham, D.C. TOR Is a Negative Regulator of Autophagy in Arabidopsis thaliana. PLoS ONE 2010, 5, e11883. [Google Scholar] [CrossRef] [Green Version]
  36. Thompson, A.R.; Doelling, J.H.; Suttangkakul, A.; Vierstra, R.D. Autophagic nutrient recycling in Arabidopsis directed by the ATG8 and ATG12 conjugation pathways. Plant Physiol. 2005, 138, 2097–2110. [Google Scholar] [CrossRef] [Green Version]
  37. Buchanan-Wollaston, V.; Page, T.; Harrison, E.; Breeze, E.; Lim, P.O.; Nam, H.G.; Lin, J.-F.; Wu, S.-H.; Swidzinski, J.; Ishizaki, K.; et al. Comparative transcriptome analysis reveals significant differences in gene expression and signalling pathways between developmental and dark/starvation-induced senescence in Arabidopsis. Plant J. 2005, 42, 567–585. [Google Scholar] [CrossRef]
  38. Wang, P.; Nolan, T.M.; Yin, Y.; Bassham, D.C. Identification of transcription factors that regulate ATG8 expression and autophagy in Arabidopsis. Autophagy 2020, 16, 123–139. [Google Scholar] [CrossRef]
  39. O’Malley, R.C.; Huang, S.S.C.; Song, L.; Lewsey, M.G.; Bartlett, A.; Nery, J.R.; Galli, M.; Gallavotti, A.; Ecker, J.R. Cistrome and Epicistrome Features Shape the Regulatory DNA Landscape. Cell 2016, 165, 1280–1292. [Google Scholar] [CrossRef] [Green Version]
  40. Alvarez, J.M.; Riveras, E.; Vidal, E.A.; Gras, D.E.; Contreras-López, O.; Tamayo, K.P.; Aceituno, F.; Gómez, I.; Ruffel, S.; Lejay, L.; et al. Systems approach identifies TGA1 and TGA4 transcription factors as important regulatory components of the nitrate response of Arabidopsis thaliana roots. Plant J. 2014, 80, 1–13. [Google Scholar] [CrossRef]
  41. McKhann, H.I.; Camilleri, C.; Bérard, A.; Bataillon, T.; David, J.L.; Reboud, X.; Le Corre, V.; Caloustian, C.; Gut, I.G.; Brunel, D. Nested core collections maximizing genetic diversity in Arabidopsis thaliana. Plant J. 2004, 38, 193–202. [Google Scholar] [CrossRef]
  42. Livak, K.J.; Schmittgen, T.D. Analysis of relative gene expression data using real-time quantitative PCR and the 2-ΔΔCT method. Methods 2001, 25, 402–408. [Google Scholar] [CrossRef] [PubMed]
  43. Zeng, X.; Zeng, Z.; Liu, C.; Yuan, W.; Hou, N.; Bian, H.; Zhu, M.; Han, N. A barley homolog of yeast ATG6 is involved in multiple abiotic stress responses and stress resistance regulation. Plant Physiol. Biochem. 2017, 115, 97–106. [Google Scholar] [CrossRef] [PubMed] [Green Version]
  44. Avila-Ospina, L.; Marmagne, A.; Soulay, F.; Masclaux-Daubresse, C. Identification of Barley (Hordeum vulgare L.) Autophagy Genes and Their Expression Levels during Leaf Senescence, Chronic Nitrogen Limitation and in Response to Dark Exposure. Agronomy 2016, 6, 15. [Google Scholar] [CrossRef] [Green Version]
  45. Li, W.; Chen, M.; Wang, E.; Hu, L.; Hawkesford, M.J.; Zhong, L.; Chen, Z.; Xu, Z.; Li, L.; Zhou, Y.; et al. Genome-wide analysis of autophagy-associated genes in foxtail millet (Setaria italica L.) and characterization of the function of SiATG8a in conferring tolerance to nitrogen starvation in rice. BMC Genom. 2016, 17, 797. [Google Scholar] [CrossRef] [Green Version]
  46. Li, F.; Chung, T.; Pennington, J.G.; Federico, M.L.; Kaeppler, H.F.; Kaeppler, S.M.; Otegui, M.S. Autophagic recycling plays a central role in maize nitrogen remobilization. Plant Cell 2015, 27, 1389–1408. [Google Scholar] [CrossRef] [PubMed] [Green Version]
  47. Sun, X.; Jia, X.; Huo, L.; Che, R.; Gong, X.; Wang, P.; Ma, F. MdATG18a overexpression improves tolerance to nitrogen deficiency and regulates anthocyanin accumulation through increased autophagy in transgenic apple. Plant. Cell Environ. 2018, 41, 469–480. [Google Scholar] [CrossRef]
  48. Wang, P.; Sun, X.; Jia, X.; Ma, F. Apple autophagy-related protein MdATG3s afford tolerance to multiple abiotic stresses. Plant Sci. 2017, 256, 53–64. [Google Scholar] [CrossRef]
  49. Wang, P.; Sun, X.; Jia, X.; Wang, N.; Gong, X.; Ma, F. Characterization of an Autophagy-Related Gene MdATG8i from Apple. Front. Plant Sci. 2016, 7, 720. [Google Scholar] [CrossRef] [Green Version]
  50. Wang, P.; Sun, X.; Wang, N.; Jia, X.; Ma, F. Ectopic expression of an autophagy-associated MdATG7b gene from apple alters growth and tolerance to nutrient stress in Arabidopsis thaliana. Plant Cell. Tissue Organ Cult. 2017, 128, 9–23. [Google Scholar] [CrossRef]
  51. Van Janse Rensburg, H.C.; Van den Ende, W.; Signorelli, S. Autophagy in plants: Both a puppet and a puppet master of sugars. Front. Plant Sci. 2019, 10, 14. [Google Scholar] [CrossRef] [PubMed] [Green Version]
  52. Xiong, Y.; Sheen, J. Novel links in the plant TOR kinase signaling network. Curr. Opin. Plant Biol. 2015, 28, 83–91. [Google Scholar] [CrossRef] [PubMed] [Green Version]
  53. Van Leene, J.; Han, C.; Gadeyne, A.; Eeckhout, D.; Matthijs, C.; Cannoot, B.; De Winne, N.; Persiau, G.; Van De Slijke, E.; Van de Cotte, B.; et al. Capturing the phosphorylation and protein interaction landscape of the plant TOR kinase. Nat. Plants 2019, 5, 316–327. [Google Scholar] [CrossRef] [PubMed]
  54. Ueda, Y.; Konishi, M.; Yanagisawa, S. Molecular basis of the nitrogen response in plants. Soil Sci. Plant Nutr. 2017, 63, 329–341. [Google Scholar] [CrossRef] [Green Version]
  55. Avin-Wittenberg, T.; Michaeli, S.; Honig, A.; Galili, G. ATI1, a newly identified atg8-interacting protein, binds two different Atg8 homologs. Plant Signal. Behav. 2012, 7, 685–687. [Google Scholar] [CrossRef] [Green Version]
  56. Jia, M.; Liu, X.; Xue, H.; Wu, Y.; Shi, L.; Wang, R.; Chen, Y.; Xu, N.; Zhao, J.; Shao, J.; et al. Noncanonical ATG8–ABS3 interaction controls senescence in plants. Nat. Plants 2019, 5, 212–224. [Google Scholar] [CrossRef]
  57. Honig, A.; Avin-Wittenberg, T.; Ufaz, S.; Galili, G. A new type of compartment, defined by plant-specific Atg8-interacting proteins, is induced upon exposure of Arabidopsis plants to carbon starvation. Plant Cell 2012, 24, 288–303. [Google Scholar] [CrossRef] [Green Version]
  58. Zhu, J.; Tian, Z.; Li, Y.; Hua, X.; Zhang, D.; Li, J.; Jin, H.; Xu, J.; Chen, W.; Niu, B.; et al. ATG7 Promotes Bladder Cancer Invasion via Autophagy-Mediated Increased ARHGDIB mRNA Stability. Adv. Sci. 2019, 6, 1801927. [Google Scholar] [CrossRef] [Green Version]
  59. Marshall, R.S.; Vierstra, R.D. Autophagy: The Master of Bulk and Selective Recycling. Annu. Rev. Plant Biol. 2018, 69, 173–208. [Google Scholar] [CrossRef]
  60. Devarenne, T.P. The plant cell death suppressor Adi3 interacts with the autophagic protein Atg8h. Biochem. Biophys. Res. Commun. 2011, 412, 699–703. [Google Scholar] [CrossRef]
  61. Masclaux-Daubresse, C.; Clément, G.; Anne, P.; Routaboul, J.M.; Guiboileau, A.; Soulay, F.; Shirasu, K.; Yoshimoto, K. Stitching together the multiple dimensions of autophagy using metabolomics and transcriptomics reveals impacts on metabolism, development, and plant responses to the environment in Arabidopsis. Plant Cell 2014, 26, 1857–1877. [Google Scholar] [CrossRef] [PubMed] [Green Version]
  62. Phillips, A.R.; Suttangkakul, A.; Vierstra, R.D. The ATG12-conjugating enzyme ATG10 is essential for autophagic vesicle formation in Arabidopsis thaliana. Genetics 2008, 178, 1339–1353. [Google Scholar] [CrossRef] [PubMed] [Green Version]
  63. Rioux, J.D.; Xavier, R.J.; Taylor, K.D.; Silverberg, M.S.; Goyette, P.; Huett, A.; Green, T.; Kuballa, P.; Barmada, M.M.; Datta, L.W.; et al. Genome-wide association study identifies new susceptibility loci for Crohn disease and implicates autophagy in disease pathogenesis. Nat. Genet. 2007, 39, 596–604. [Google Scholar] [CrossRef]
  64. Balla, K.M.; Lažetić, V.; Troemel, E.R. Natural variation in the roles of C. elegans autophagy components during microsporidia infection. PLoS ONE 2019, 14, e0216011. [Google Scholar] [CrossRef] [PubMed] [Green Version]
  65. Alonso-Blanco, C.; Andrade, J.; Becker, C.; Bemm, F.; Bergelson, J.; Borgwardt, K.M.M.; Cao, J.; Chae, E.; Dezwaan, T.M.M.; Ding, W.; et al. 1,135 Genomes Reveal the Global Pattern of Polymorphism in Arabidopsis thaliana. Cell 2016, 166, 481–491. [Google Scholar] [CrossRef] [Green Version]
  66. Meyer, R.C.; Gryczka, C.; Neitsch, C.; Müller, M.; Bräutigam, A.; Schlereth, A.; Schön, H.; Weigelt-Fischer, K.; Altmann, T. Genetic diversity for nitrogen use efficiency in Arabidopsis thaliana. Planta 2019, 250, 41–57. [Google Scholar] [CrossRef] [Green Version]
  67. Canales, J.; Moyano, T.C.; Villarroel, E.; Gutiérrez, R.A. Systems analysis of transcriptome data provides new hypotheses about Arabidopsis root response to nitrate treatments. Front. Plant Sci. 2014, 5, 22. [Google Scholar] [CrossRef] [Green Version]
Figure 1. ANOVA of transcript abundance variation for N metabolism-(A) and autophagy-(B) related genes among the Arabidopsis accessions. Models are adjusted within are tested an experiment repeat effect (Experiment), a nutrition effect (Nutrition), a genotype effect (Genotype), a genotype by nutrition interaction factor (G × N) and residual error (Residual). Only significant effects are showed (p < 0.05).
Cells 09 01021 g001
Figure 2. The relative expression of N metabolism-related genes varied depending on accessions and N conditions. Relative expression of GLU1 (A) and GLN1.1 (B) illustrating the differential responses to starvation among accessions (means ± SE). Stars indicate the significance of the difference between the means of the control and of the N starvation condition for each accession: ns non-significant, * p < 0.05, ** p < 0.01, *** p < 0.001, n = 8. Dark and light greys show the plant in the control and N starvation conditions, respectively.
Cells 09 01021 g002
Figure 3. Classification of Arabidopsis accessions following their relative expression of N metabolism-related genes. (A) Heatmap of gene expression measured in nine accessions grown in the control or N starvation conditions. Red and blue represented relative high or low gene expression among genotypes. Genotypes were grouped based on the similarity of their expression. For each condition, the matrix of gene expression was centered and scaled over all accessions. (B) PCA analysis of expression of N metabolism-related genes. Blue dots and red triangles show the plants grown in the control and N starvation conditions, respectively. (C) Contribution of genes to the two first PCA components. The genes contributing above 4.5% to the first, second, or both components are respectively in orange, black, or blue.
Cells 09 01021 g003
Figure 4. Genetic effect on the ATG transcript levels among accessions in the control and starvation conditions. Bars are the relative expressions of ATG5 (A) and ATG8d (B) in nine Arabidopsis accessions grown in the control and N starvation conditions (means ± SE). Letters indicate significant distinct groups of accession (p < 0.05, n = 8). Dark and light greys show the plant in the control and N starvation conditions, respectively.
Cells 09 01021 g004
Figure 5. Genetic by Nutrition (G × N) interaction effect on the ATG transcript levels. Bars are the relative expressions of ATG8f (A) and ATG18f (B) in nine Arabidopsis accessions grown in the control and N starvation conditions (means ± SE). Significant differences between groups are indicated by asterisks (* p < 0.05, ** p < 0.01, *** p < 0.01, n = 8). Dark and light greys show the plant in the control and N starvation conditions, respectively.
Cells 09 01021 g005
Figure 6. Classification of Arabidopsis accessions following their relative expressions of ATG genes. (A) Heatmap of ATG gene expressions measured in nine accessions grown in the control (c) or N starvation (s) conditions. Red and blue represented relative high or low gene expressions among genotypes. Genotypes were grouped based on the similarity of their expressions. For each condition, the matrix of gene expression was centered and scaled over all accessions. (B) Average transcriptomic response to N starvation of the accessions (mean ± SE) on the 22 genes. The bars are the average differences for each genotype between the expression values in the control and N starvation condition in percentage of value expression in the control condition. (C) PCA analysis of the expression of ATG genes. Blue dots and red triangles show the plants grown in the control and N starvation conditions, respectively. (D) Contribution of ATG genes to the two first PCA components. The genes contributing above 4.5% to the first, second, or both components are respectively in orange, black, or blue.
Cells 09 01021 g006
Figure 7. Comparison of global genes expressions among the nine Arabidopsis accessions following the groups of N metabolism related genes and ATG genes. The accessions are distributed in the two conditions following their coordinates onto the PCA N metabolism-related genes axis 1 and the PCA ATG genes axis 1. Blue dots and red triangles show the plants grown respectively in the control and N starvation conditions.
Cells 09 01021 g007
Table 1. Averages on all accessions of differential gene expression between the control and starvation conditions.
Gene NameAGI CodeControlStarvationDifferential Variationp-ValueSignificant
Difference
MeanSdMeanSd
NRT2.1At1g080900.0110.0070.0090.005−19.0%0.050ns
NRT1.1At1g121100.1190.0380.1170.044−1.0%0.861ns
NIA2At1g371301.6510.7891.5410.743−6.7%0.398ns
NiiAt2g156201.8170.5602.0550.54113.1%0.013*
GS2At5g356304.8441.4925.1621.4436.6%0.204ns
GLN1.1At5g376000.3350.3180.4090.27221.9%0.146ns
AMT1.1At4g135100.1560.1000.1650.1015.9%0.591ns
AMT1.4At4g287000.0030.0020.0040.00219.5%0.104ns
GDH1At5g181700.0660.0300.0790.02219.4%0.005**
GLU1At5g041406.2081.8356.9722.14112.3%0.026*
GLTAt5g161500.2840.1100.3720.13931.0%0.000***
* p < 0.05, ** p < 0.01, *** p < 0.001, ns = not statistically significant.
Table 2. Averages of differential expression of ATG genes between the control and starvation conditions.
Gene NameAGI CodeControlStarvationDifferential Variationp-ValueSignificant
Difference
MeanSdMeanSd
ATG1aAt3g619605.7271.9437.8412.45536.9%0.000***
ATG1bAt3g539300.0340.0080.0330.010−3.7%0.395ns
ATG1cAt2g378400.1570.0880.2150.08336.7%0.000***
ATG3At5g615000.3680.1250.5090.11738.4%0.000***
ATG4aAt2g441400.0530.0190.0630.01618.9%0.002**
ATG4bAt3g599500.1170.0460.1640.03640.0%0.000***
ATG5At5g172900.0470.0160.0630.01933.9%0.000***
ATG7At5g459008.3862.2848.8302.5235.3%0.280ns
ATG8aAt4g219800.5000.2220.7020.24440.3%0.000***
ATG8bAt4g0462022.15910.22722.61413.1822.1%0.820ns
ATG8cAt1g6204065.79534.43273.97739.54512.4%0.196ns
ATG8dAt2g0563066.02351.70571.98946.1369.0%0.474ns
ATG8eAt2g451700.0600.0440.0690.04015.3%0.199ns
ATG8fAt4g16520214.77363.636280.68279.54530.7%0.000***
ATG8gAt3g6064024.1488.38132.38611.64834.1%0.000***
ATG8hAt3g0642015.3417.27324.5459.65960.0%0.000***
ATG8iAt3g155800.7330.2841.0970.38649.6%0.000***
ATG9At2g312600.0650.0360.1060.04362.6%0.000***
ATG10At3g075250.0350.0130.0430.02522.6%0.020*
ATG12aAt1g542100.1890.1360.2970.18456.8%0.000***
ATG13aAt3g495900.2470.0440.3740.05351.1%0.000***
ATG18aAt3g627700.2030.0990.2770.10836.4%0.000***
ATG18fAt5g547300.1070.0560.1620.06952.0%0.000***
ATG18hAt1g547100.1880.0900.2380.09326.7%0.002**
* p < 0.05, ** p < 0.01, *** p < 0.001, ns = not statistically significant.

