In Vitro Effects of Streptococcus oralis Biofilm on Peri-Implant Soft Tissue Cells
by
 , ,
, ,
Alexandra Ingendoh-Tsakmakidis
1,* ,
,
Jörg Eberhard
1,†,
Christine S. Falk
2,
Meike Stiesch
1 and
Andreas Winkel
1 1
Department of Prosthetic Dentistry and Biomedical Materials Science, Hannover Medical School, Carl-Neuberg-Str. 1, 30625 Hannover, Germany
2
Institute of Transplant Immunology, Hannover Medical School, Carl-Neuberg-Str. 1, 30625 Hannover, Germany
*
Author to whom correspondence should be addressed.
†
Current Address: University of Sydney, Sydney Dental School, 2 Chalmers St, Westmead NSW 2010, Australia.
Cells 2020, 9(5), 1226; https://0-doi-org.brum.beds.ac.uk/10.3390/cells9051226
Submission received: 1 May 2020
/
Accepted: 12 May 2020
/
Published: 15 May 2020
(This article belongs to the Special Issue Immunomodulatory Factors in Host Defense)
Abstract
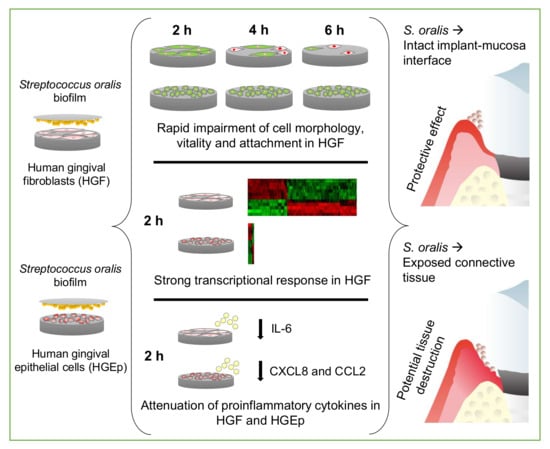
:Human gingival epithelial cells (HGEps) and fibroblasts (HGFs) are the main cell types in peri-implant soft tissue. HGEps are constantly exposed to bacteria, but HGFs are protected by connective tissue as long as the mucosa–implant seal is intact. Streptococcus oralis is one of the commensal bacteria, is highly abundant at healthy implant sites, and might modulate soft tissue cells—as has been described for other streptococci. We have therefore investigated the effects of the S. oralis biofilm on HGEps and HGFs. HGEps or HGFs were grown separately on titanium disks and responded to challenge with S. oralis biofilm. HGFs were severely damaged after 4 h, exhibiting transcriptional inflammatory and stress responses. In contrast, challenge with S. oralis only induced a mild transcriptional inflammatory response in HGEps, without cellular damage. HGFs were more susceptible to the S. oralis biofilm than HGEps. The pro-inflammatory interleukin 6 (IL-6) was attenuated in HGFs, as was interleukin 8 (CXCL8) in HGEps. This indicates that S. oralis can actively protect tissue. In conclusion, commensal biofilms can promote homeostatic tissue protection, but only if the implant–mucosa interface is intact and HGFs are not directly exposed.
1. Introduction
The insertion of dental implants to restore missing teeth is a widespread practice [1] and titanium is currently the material of choice [2]. ‘Healthy’ implants possess a well-developed soft tissue seal [3,4,5,6]. This soft tissue consists of an epithelial layer at the tissue border, as well as underlying connective tissue, mainly including gingival fibroblasts and collagen [7]. The epithelial cells actively participate in re-epithelialization, and in innate and antimicrobial host defense [8]. Gingival fibroblasts exert a similar role, and are responsible for the turnover of connective tissue and the inflammatory response [9,10,11]. Many studies on infection have employed epithelial cells, which cover the whole soft tissue [12,13,14,15,16,17]. However, after injury, during the initial stage of implant insertion or in peri-implant disease, gingival fibroblasts too may come into contact with oral bacteria [10], which attach to implant materials and form biofilms [18]. Subsequently, the healthy peri-implant mucosa builds an essential barrier against biofilm penetration [19].
Dental implants are colonized by oral bacteria, mainly streptococci, as soon as 30 min after insertion [18]. In healthy implants, biofilms are primarily composed of commensal bacteria species, such as Streptococcus oralis, the predominant initial colonizer [3,4,5,6,20,21,22,23,24,25]. Previous studies have addressed the roles of these bacteria, besides their participation in initial colonization [25,26,27,28,29,30,31,32,33,34,35,36,37,38,39,40]. For instance, the role of S. oralis in systemic diseases—including bacteremia and cardiovascular diseases—has been extensively studied [25,26,27,28,29,30,31,32]. Moreover, S. oralis serves as an anchor for intermediate and late pathogenic colonizers [33,34], and can enhance bacterial pathogenicity [36] and the virulence of Candida albicans [21,36,37,38]. Nevertheless, it has been shown that S. oralis can antagonize bacterial pathogens and thereby promote homeostasis [39,40]. Although previous studies have shown that other streptococci may modulate the host and thus lead to tissue protection [16,41,42,43,44,45,46], little is known about how an S. oralis biofilm could modulate peri-implant tissue. As S. oralis is highly abundant at implant sites and human gingival fibroblasts (HGFs) and human gingival epithelial cells (HGEps) are the main cell types in peri-implant tissue, we have investigated the effects of S. oralis biofilm on these cell types.
We hypothesized that S. oralis biofilm has modulatory effects on peri-implant soft tissue cells—as observed for other streptococci. We assumed that host modulation by S. oralis would similarly promote tissue protection against destruction to that demonstrated for the other Streptococcus spp. Moreover, we expected that HGFs and HGEps would exhibit distinct responses to the commensal S. oralis biofilm, in accordance with their tissue topography. As already described, HGEps are located at tissue borders and, during evolution, they were in constant contact with bacteria and other factors in the oral cavity [16,46]. In contrast, HGFs reside in connective tissue—as long as tissue integrity is preserved [7,10]. We therefore compared the responses of HGFs and HGEps.
2. Materials and Methods
2.1. Formation of Streptococcus oralis Biofilm
Streptococcus oralis DSM 20627 (DSMZ, Braunschweig, Germany) was grown at 37 °C in tryptic soy broth (TSB, CM0129, Oxoid, Hampshire, UK), supplemented with 0.3% w/v yeast extract (Carl Roth GmbH + Co. KG, Karlsruhe, Germany), for 18 hours under anaerobic conditions (80% N2, 10% H2, 10% CO2, Don Whitley Scientific Limited, Shipley, UK) and with stirring. The S. oralis biofilm was grown on supporting hydrophilic polyethersulfone membrane (Merck Millipore, Darmstadt, Germany). Sterile membranes with 13 mm diameter were placed into 24-well plates with the dull side up and washed in 1 mL PBS for 18 hours under anaerobic conditions with parallel shaking. The overnight bacterial culture was centrifuged at 4,000× g for 15 min at 4 °C and diluted in brain heart infusion broth (BHI, CM1135, Oxoid, Hampshire, UK), supplemented with 5% w/v D(+)-saccharose (4621.2, Carl Roth GmbH, Karlsruhe, Germany) to give an optical density of 0.06 at 600 nm, corresponding to 8.7 × 10⁷CFU/mL. This S. oralis suspension was added on top of the membranes (600 μL/well). For the control groups, the sterile culture medium was used. Membranes were incubated at 37 °C in a humidified atmosphere with 5% CO2 for 72 hours. The medium was replenished on alternate days.
2.2. Human Tissue Cell Culture and Titanium Colonization
Primary human gingival fibroblasts (HGF) were purchased from Provitro AG (1210412, Berlin, Germany). The HGFs were cultured in Dulbecco’s Modified Eagle Medium (DMEM, FG0435, Merck Millipore, Darmstadt, Germany) supplemented with 10% FBS and 1% v/v penicillin/streptomycin at 37 °C in a humidified atmosphere with 5% CO2. The cells were passaged after reaching 80–90% confluency. Primary human gingival epithelial cells (HGEps) were purchased from CELLnTEC Advanced Cell Systems AG (HGEPp-05, Bern, Switzerland). The HGEps were cultured in CnT Prime medium (CnT-PR, CELLnTEC Advanced Cell Systems AG, Bern, Switzerland) at 37 °C in a humidified atmosphere with 5% CO2. The cells were passaged at 70–80% confluency.
To simulate the adherence of mucosal tissue to the titanium implant, we colonized titanium disks with the main cell types, HGF or HGEp. The two cell types were grown separately on titanium disks (grade 4, Ø 12 mm, ground with 45 μm profile). Sterile titanium disks were placed into 24-well plates and washed once with DMEM or CnT Prime. The HGFs were seeded onto the titanium disks at a density of 15,000 cells per mL per well in fully supplemented DMEM. The HGEps were seeded at a density of 45,000 cells per mL per well in CnT Prime medium. Titanium disks were incubated at 37 °C in a humidified atmosphere with 5% CO2 for four days with a single medium replacement after two days.
2.3. Co-Culture of Tissue Cells Grown on Titanium with Streptococcus oralis Biofilm
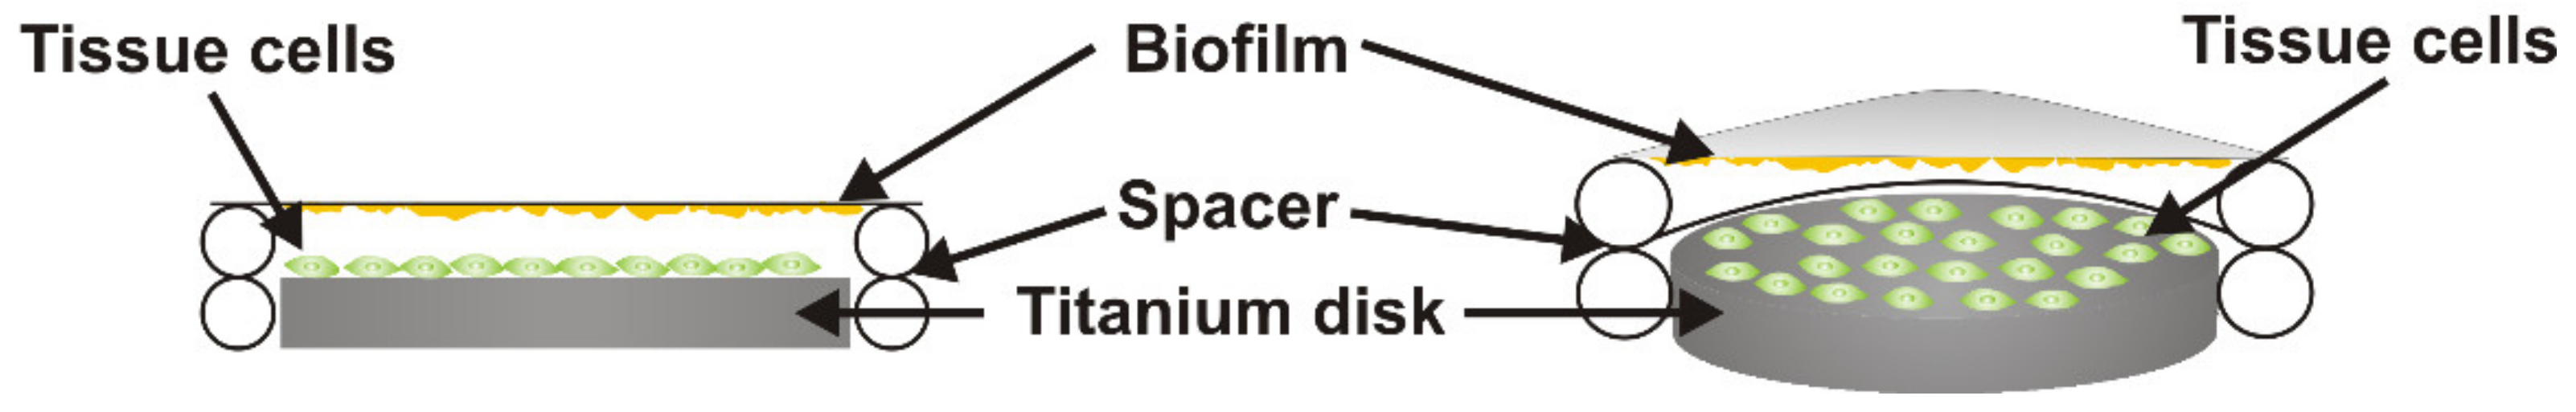
The cell-colonized titanium disks were transferred into 24-well plates with 1 mL fresh culture medium without antibiotics. The DMEM medium without any additions was used for HGFs and the CnT prime medium for HGEps. Sterile spacers were placed around the titanium disks. The S. oralis biofilms and the control membranes were washed five times with sterile PBS and then placed on the spacers facing the cells grown on the titanium disks (Figure 1). The distance between biofilm and tissue cells was 1 mm. These co-culture constructs were incubated at 37 °C in a humidified atmosphere with 5% CO2 for a period of 2, 4, or 6 h. At each time point, samples were processed for analysis.
2.4. Qualitative LIVE/DEAD Staining and Quantitative Analysis of Cell Attachment of Gingival Tissue Cells after Biofilm Challenge
A LIVE/DEAD staining of tissue cells was performed after co-culture with the S. oralis biofilm. For the staining solution, calcein AM (C3099, Thermo Fisher Scientific Inc., Waltham, USA) and propidium iodide (P4864, Sigma-Aldrich Corporation, St. Louis, USA) were diluted 1:1000 in sterile PBS. The co-culture supernatants were carefully collected, and 1 mL of the LIVE/DEAD staining solution was added for 30 min at 37 °C in a humidified atmosphere with 5% CO2. The staining solution was removed and replaced by PBS for microscopic examination using CLSM (Confocal Scanning Laser Microscope, Leica TCS SP2 or Leica TCS SP8, Leica Microsystems, Wetzlar, Germany).
After examination of the LIVE/DEAD staining, the tissue cells were fixed with 4% v/v paraformaldehyde (335.2, Carl Roth GmbH, Karlsruhe, Germany) in PBS for 10 min. The samples were carefully washed with PBS and permeabilized with 1% v/v triton-X-100 (93418, Sigma-Aldrich Corporation, St. Louis, USA) in PBS for 10 min followed by a wash with PBS. Then, the cell nuclei were stained with 1 µg/mL 4′,6-Diamidino-2-phenylindole dihydrochloride (DAPI, D9542, Sigma-Aldrich Corporation, St. Louis, USA) in PBS for 15 min. All steps were performed at room temperature and in the dark. The stained samples were washed with PBS and five random images were acquired using CLSM (Confocal Scanning Laser Microscope, Leica TCS SP8, Leica Microsystems, Wetzlar, Germany). All images of cell nuclei were automatically counted using ImageJ (http://rsbweb.nih.gov/ij/), a public domain Java image processing program [47]. Briefly, images were converted to an 8-bit format, the threshold was adjusted to exclude background and then the smooth tool was applied. The watershed tool was applied to separate closely attached cell nuclei before automatic particle analysis. Resulting cell numbers were used for further statistical analysis. The assumption that one cell nucleus corresponds to one cell was made.
2.5. RNA Extraction of Tissue Cells
The RNeasy ® Mini Kit from QIAGEN (74104, Hilden, Germany) was used for RNA isolation from the gingival tissue cells. The isolation was performed with the DNase I treatment according to the manufacturer’s instructions. The RLT buffer was supplemented with 1% (v/v) β-mercaptoethanol (M6250, Sigma-Aldrich Corporation, St. Louis, USA) and tissue cells were scratched with a cell scraper from the disk surface.
2.6. Array Hybridization and Data Analysis
The hybridization was performed on the Whole Genome Oligo Microarray Kit 4x44K v2 including 44495 probes with roughly 26,000 transcripts. The aminoallyl-UTP-modified (aaUTP) cRNA was prepared using 70 ng total RNA and halved reaction volumes according to the manufacturer’s protocol (AM1753, Life Technologies, Carlsbad, USA). The labeling of the aaUTP-cRNA was performed using the Alexa Fluor 555 Reactive Dye. Before the reverse transcription reaction, 1 µL of Agilent’s One-Color spike-in Kit stock solution (1:100,000) was added to each single RNA sample. For the hybridization, 500 ng of labeled cRNA was used. The cRNA fragmentation, hybridization, and washing steps were followed using the One-Color Microarray-Based Gene Expression Analysis Protocol V5.7. Slide scanning was performed on the Agilent Micro Array Scanner G2565CA (Agilent Scientific Instruments, Santa Clara, USA) pixel resolution 5 µm, bit depth 20) and the data were extracted with the Feature Extraction Software V10.7.3.1 (extraction protocol file GE1_107_Sep09.xlm). The microarray-based data are available in Gene Expression Omnibus (GEO); the related accession number is GSE134481.
The gene expression data were analyzed using the Qlucore Omics Explorer (Qlucore AB, Lund, Sweden) bioinformatics software. The two-group comparison (t-test) was applied to filter the gene expression data of the control and biofilm treated groups. Before analysis, the replicate factor was eliminated; the p-value was set to 0.01, and the fold change filter was set to 2.
The pathway analysis was performed using DAVID (Database for Annotation, Visualization, and Integrated Discovery) [48,49]. The generated gene lists after analysis with the Qlucore Omics Explorer were submitted to DAVID. The lists of up- and down-regulated genes after S. oralis biofilm challenge were uploaded separately and pathway analysis was performed with default settings. Differentially regulated genes within the enriched pathway were designated to their role in the pathway according to the KEGG (Kyoto Encyclopedia of Genes and Genomes) [50,51,52] and were visualized with Pathview, a tool for pathway-based data integration and visualization [53,54].
2.7. Cytokine Detection in Co-Culture Supernatants
To quantify the cytokines in the co-culture supernatants, they were centrifuged at 4,000× g for 5 min. Clear supernatants were transferred into new tubes and stored at −80 °C. The concentrations of interleukin 6 (IL-6), interleukin 8 (CXCL8), monocyte chemoattractant protein-1 (MCP-1/CCL2), tumor necrosis factor-α (TNF-α), growth regulated oncogene-α (Gro-α/CXCL1), and growth regulated oncogene-β (Gro-β/CXCL2) were quantified by the Luminex-based multiplex technique according to the manufacturer’s instructions (Bio-Rad, Hercules, USA). Standard curves and concentrations were calculated using the Bio-Plex Manager 6.0 with protein detection sensitivity between 1 pg/mL and 40 µg/mL. All samples were measured as triplicates.
2.8. Statistical Analysis
The cell numbers were statistically analyzed using GraphPad Prism 8 (GraphPad Software, San Diego, CA, USA). Statistical significance was determined using the two-way ANOVA with Sidak’s multiple comparisons test. Data points are represented as Box and Whiskers with Tukey error bars.
The statistical analysis of cytokine measurements was performed by GraphPad Prism 7 (GraphPad Software, San Diego, CA, USA). The normal distribution was tested by applying the D’ Agostino–Pearson normality test. The statistical significance was determined using the Holm–Sidak method and data were presented as Box and Whiskers with Tukey error bars.
3. Results
3.1. Cell Morphology, Vitality, and Attachment of HGF were Rapidly Impaired After Challenge with the S. oralis Biofilm, whereas HGEp Remained Unaffected
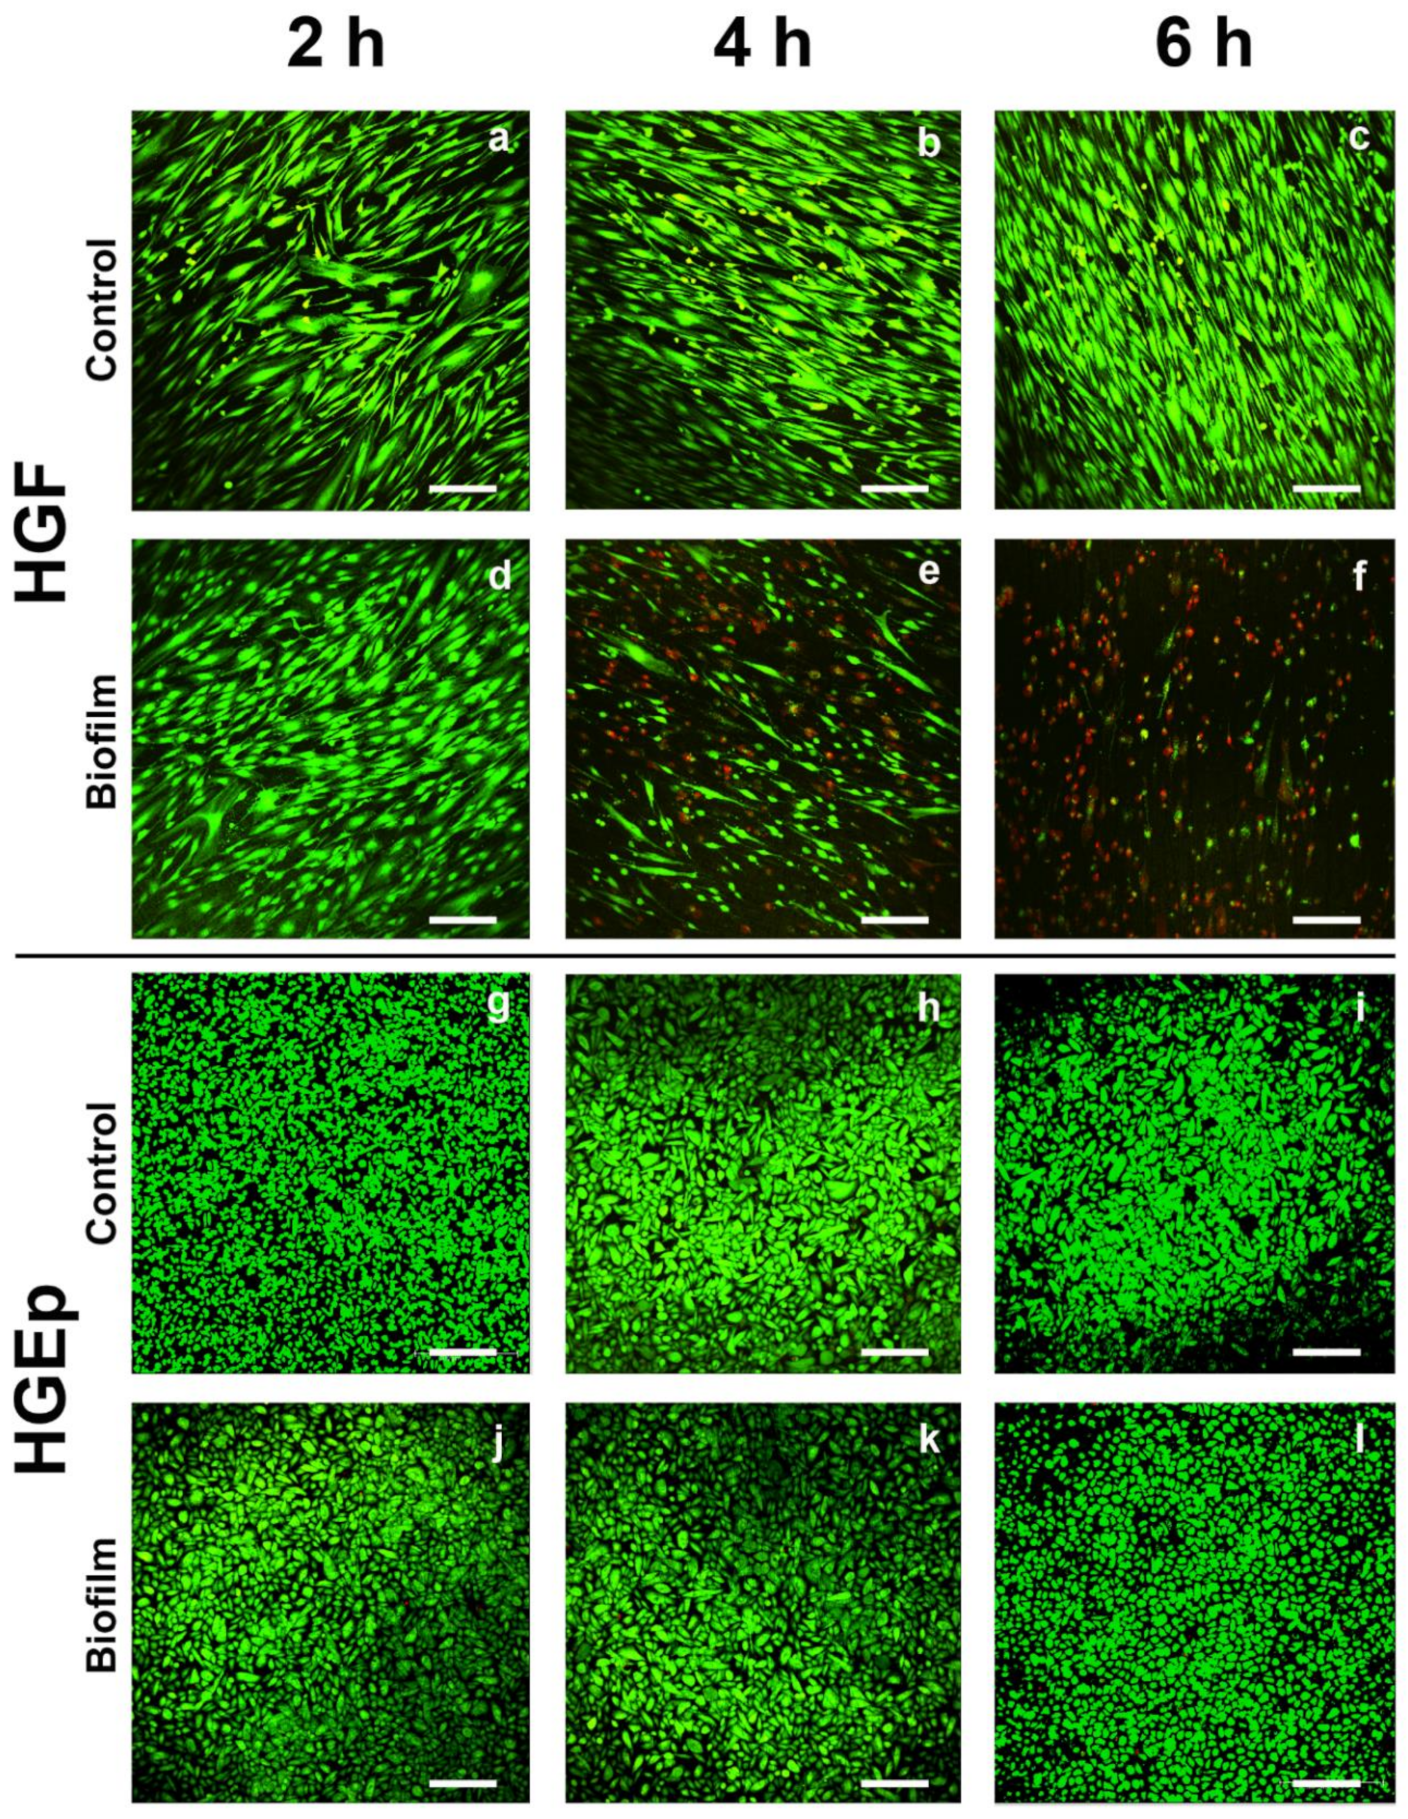
The effects of the S. oralis biofilm on the cell morphology and vitality of the tissue cells were evaluated by qualitative LIVE/DEAD staining and microscopic examination. The cell morphology of the HGF was similar to the control cells after 2 h biofilm challenge (Figure 2a,d). After 4 h, most cells lost their fibroblastic morphology, and they were rounded and dead according to the staining (Figure 2e). After 6 h, almost all cells were dead and many were detached from the titanium surface (Figure 2f) compared to the control (Figure 2c). The morphology and vitality of the biofilm-challenged HGEps were similar to those of the control cells at all time points (Figure 2g–l). The co-culture of HGF with the S. oralis biofilm, initiated cell death and a change in the cell morphology after only 4 h. In contrast, the vital status and morphology of HGEps remained unaffected during co-culture with the S. oralis biofilm.
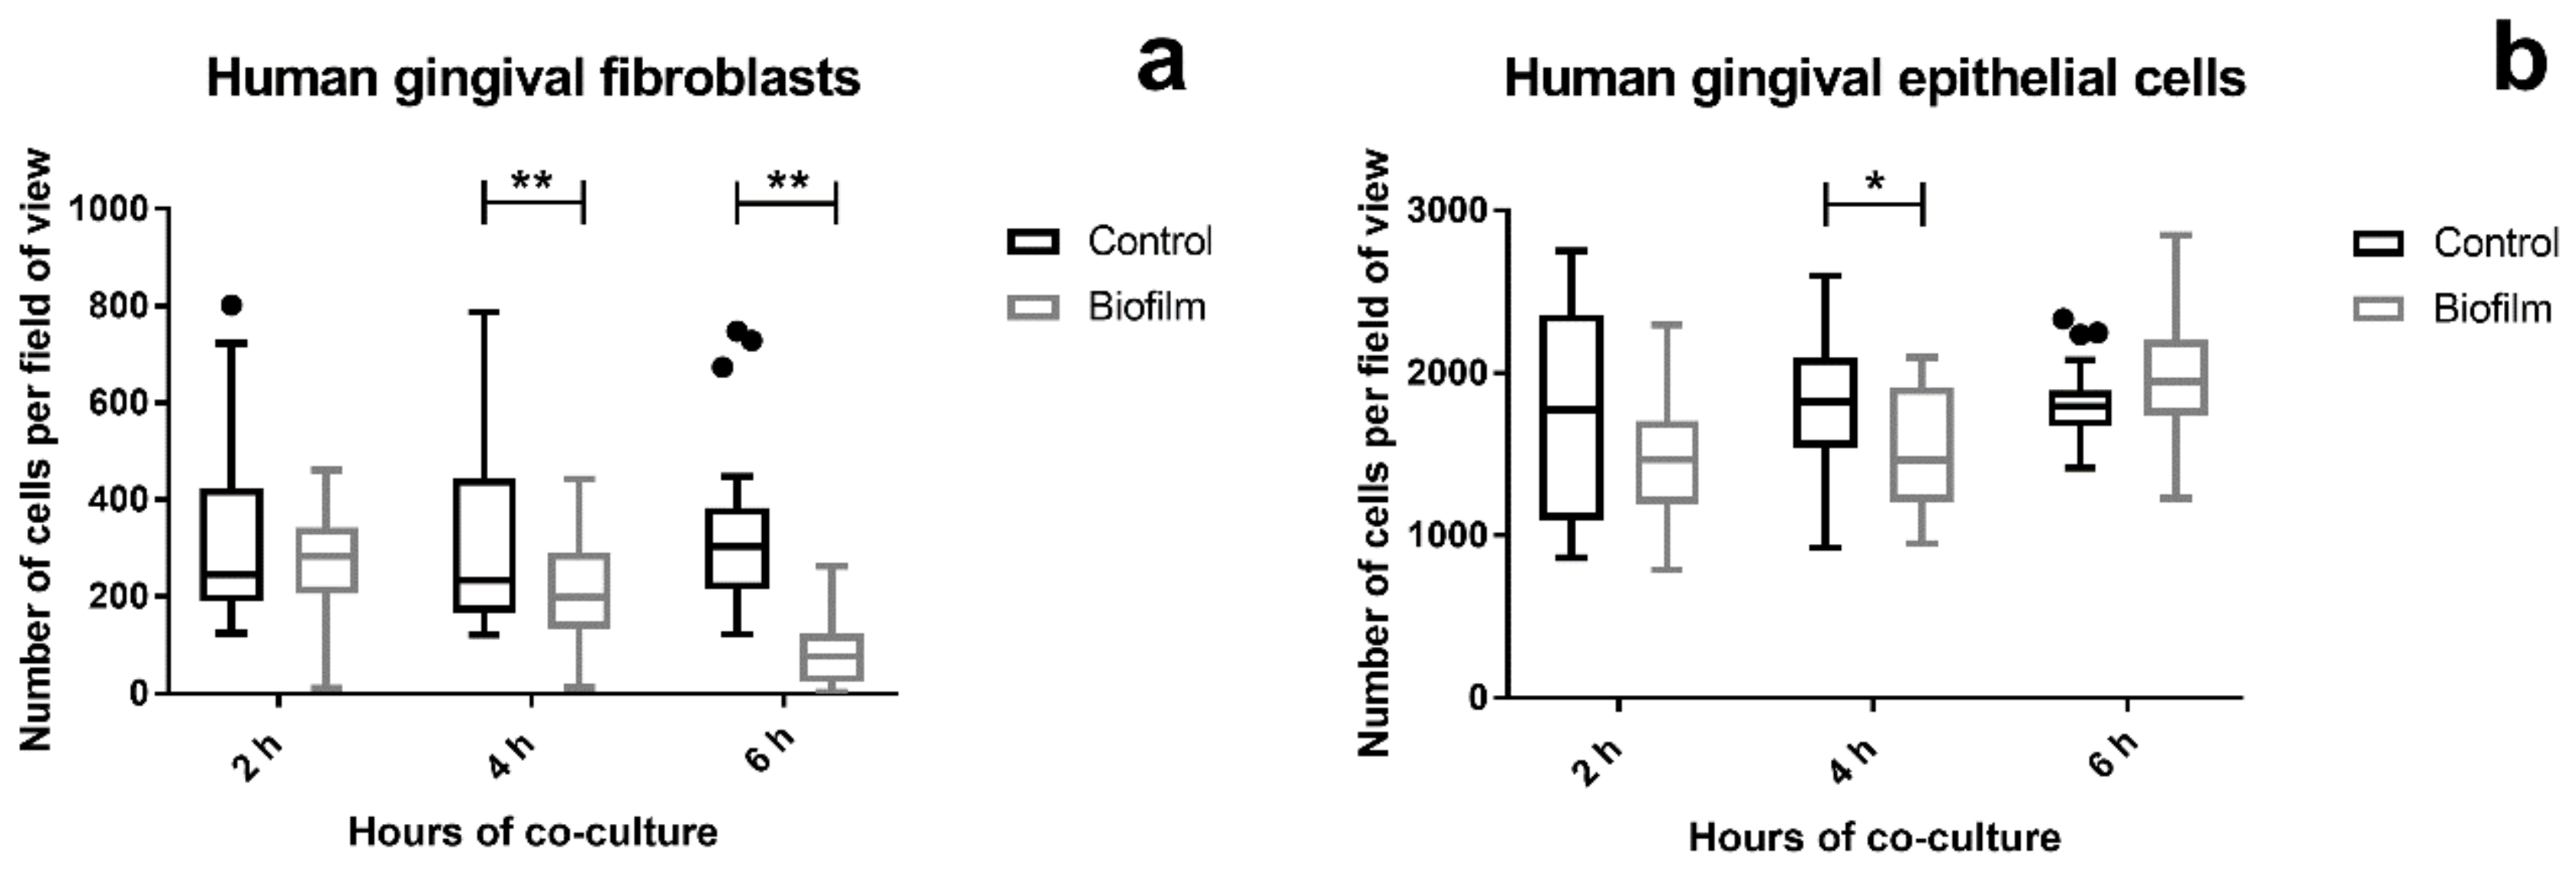
Changes in cell attachment on titanium disks were quantified by staining and counting the cell nuclei after microscopic examination of the LIVE/DEAD stained tissue cells. The cell attachment of HGF significantly decreased after 4 h of co-culture with the S. oralis biofilm compared to the control. This phenomenon was more prominent after 6 h (Figure 3a and Figure S1). In contrast, the cell attachment of HGEp was mostly the same in all groups. Only after 4 h challenge with the biofilm, slightly fewer HGEps were counted (Figure 3b and Figure S2), which could be due to fluctuations in confluency. The co-culture of the S. oralis biofilm induced cell attachment of the HGF over time, while HGEp remained unaffected.
It was indicated by the qualitative LIVE/DEAD staining that HGF detached from titanium disks in parallel to the raising cell death over time. This observation was then confirmed by quantitative cell counting.
3.2. Strong Transcriptional Response to Commensal S. oralis biofilm in HGF Compared to HGEp
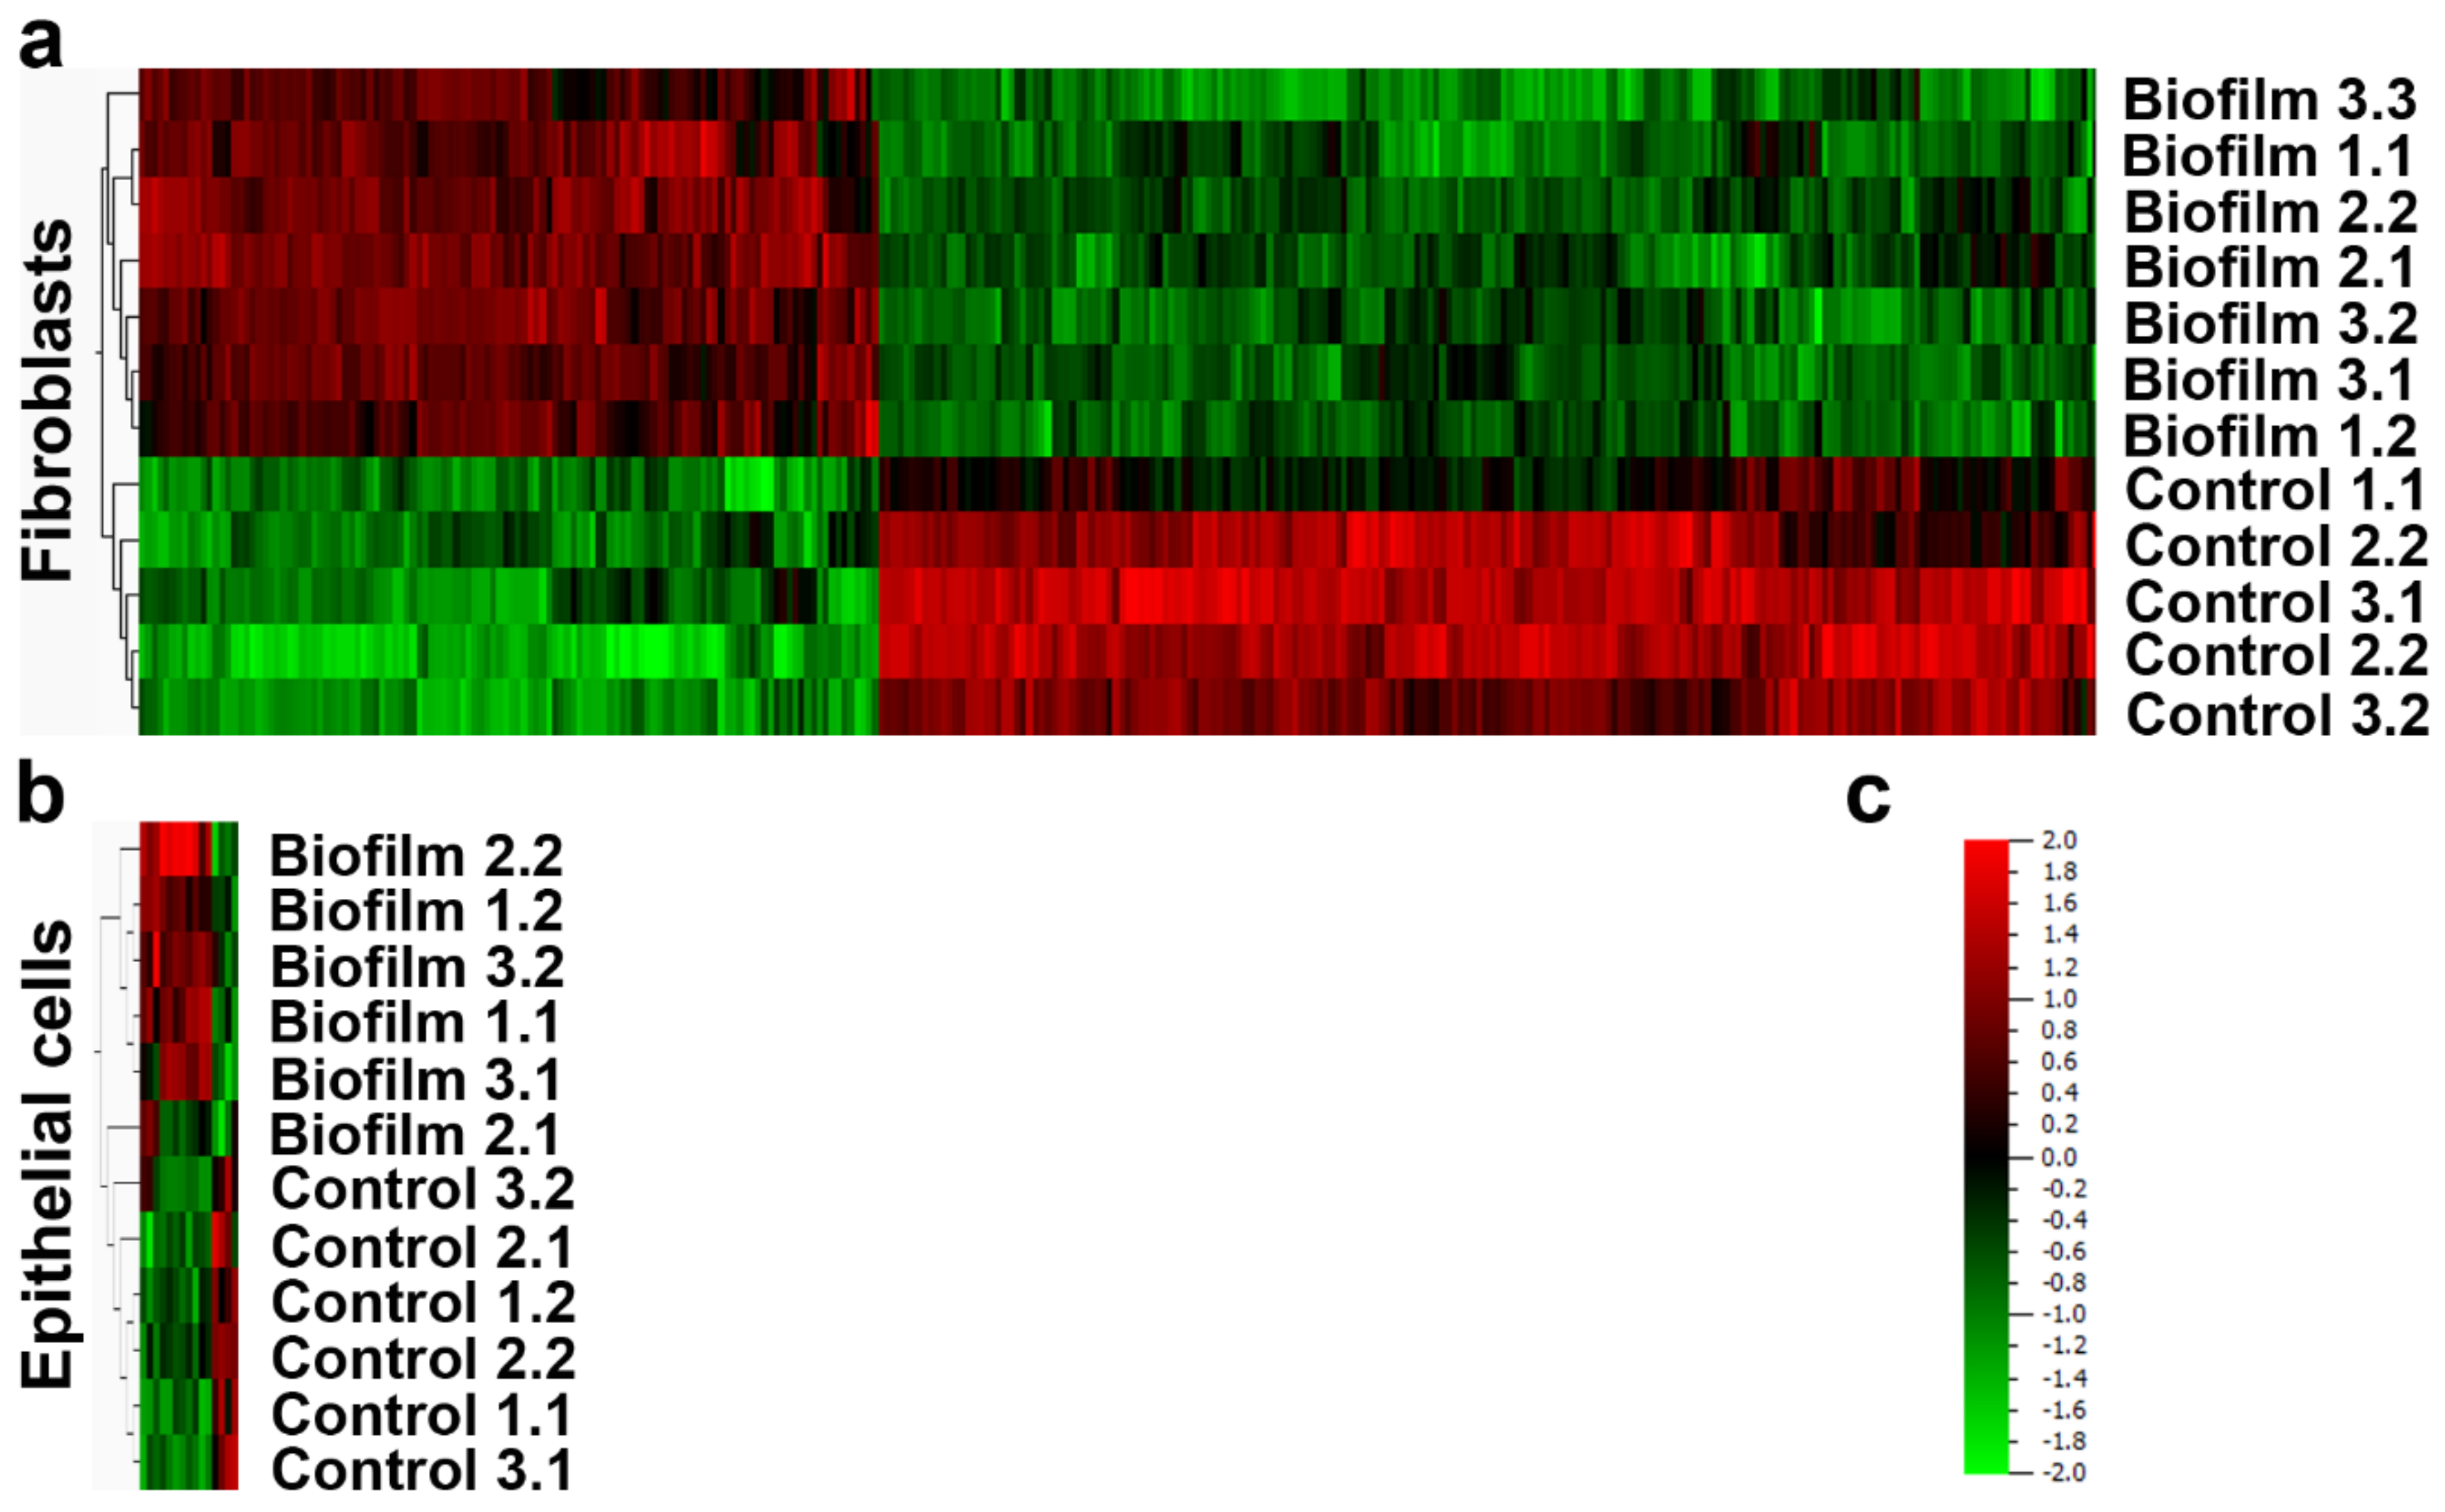
The RNA of HGFs was already hydrolyzed to a large extent after 4 h of co-culture (Table S1). Therefore, the gene expression analysis through microarrays was performed after 2 h, to retain adequate RNA quality (Table S2). After the biofilm challenge, 302 genes were differentially regulated in HGFs (Figure 4a and Tables S3 and S4). Pathways related to inflammation, immune response, cell-cycle regulation, differentiation, apoptosis, development, and microbial detection were enriched after pathway analysis of the upregulated genes (Table 1). Despite the high number of downregulated genes in the biofilm group, no pathway enrichment was observed—indicating that those genes have extremely diverse functions. Transcriptional analysis of HGEps resulted in 15 regulated genes (Figure 4b and Tables S5 and S6). All upregulated genes in the biofilm group were related to inflammation or the immune response (Table 1). Pathway enrichment of the downregulated genes was not observed for HGEps either.
After comparing transcriptional analysis between the investigated cell types, we observed that the number of genes regulated in HGF was 20 times more than in HGEp (Figure 4). The common enriched pathways in HGF and HGEp were related to proinflammatory and the immune response, including genes of proinflammatory factors, IL6, CCL2, CXCL8, CXCL1, and CXCL2 (Table 1). Also, the upregulated genes in HGF included genes encoding ligands, receptors, transcription factors, and inductive or inhibitory signal transducers of related pathways, whereas the activity of upregulated genes in HGEp is arranged only at the beginning and the end of each pathway (Table 1). Overall, the transcriptional response of HGEps to the S. oralis biofilm was narrow and focused on the inflammatory response without indication for regulation within the enriched pathways. In contrast, HGFs expressed many additional genes, which could participate in the downstream regulation of the enriched pathways. These genes might lead to diverse cell functions including cell-cycle regulation, apoptosis, differentiation, and development. The directionality of whole pathways was not indicated since this requires further investigation with proteomic data. Even so, pathway analysis allowed the conversion of gene expression data into biological meaningful data, which revealed regulated biological processes and molecular functions after S. oralis biofilm challenge.
3.3. Attenuation of Proinflammatory Cytokines in HGF and HGEp after Their Co-Culture with S. oralis Biofilm
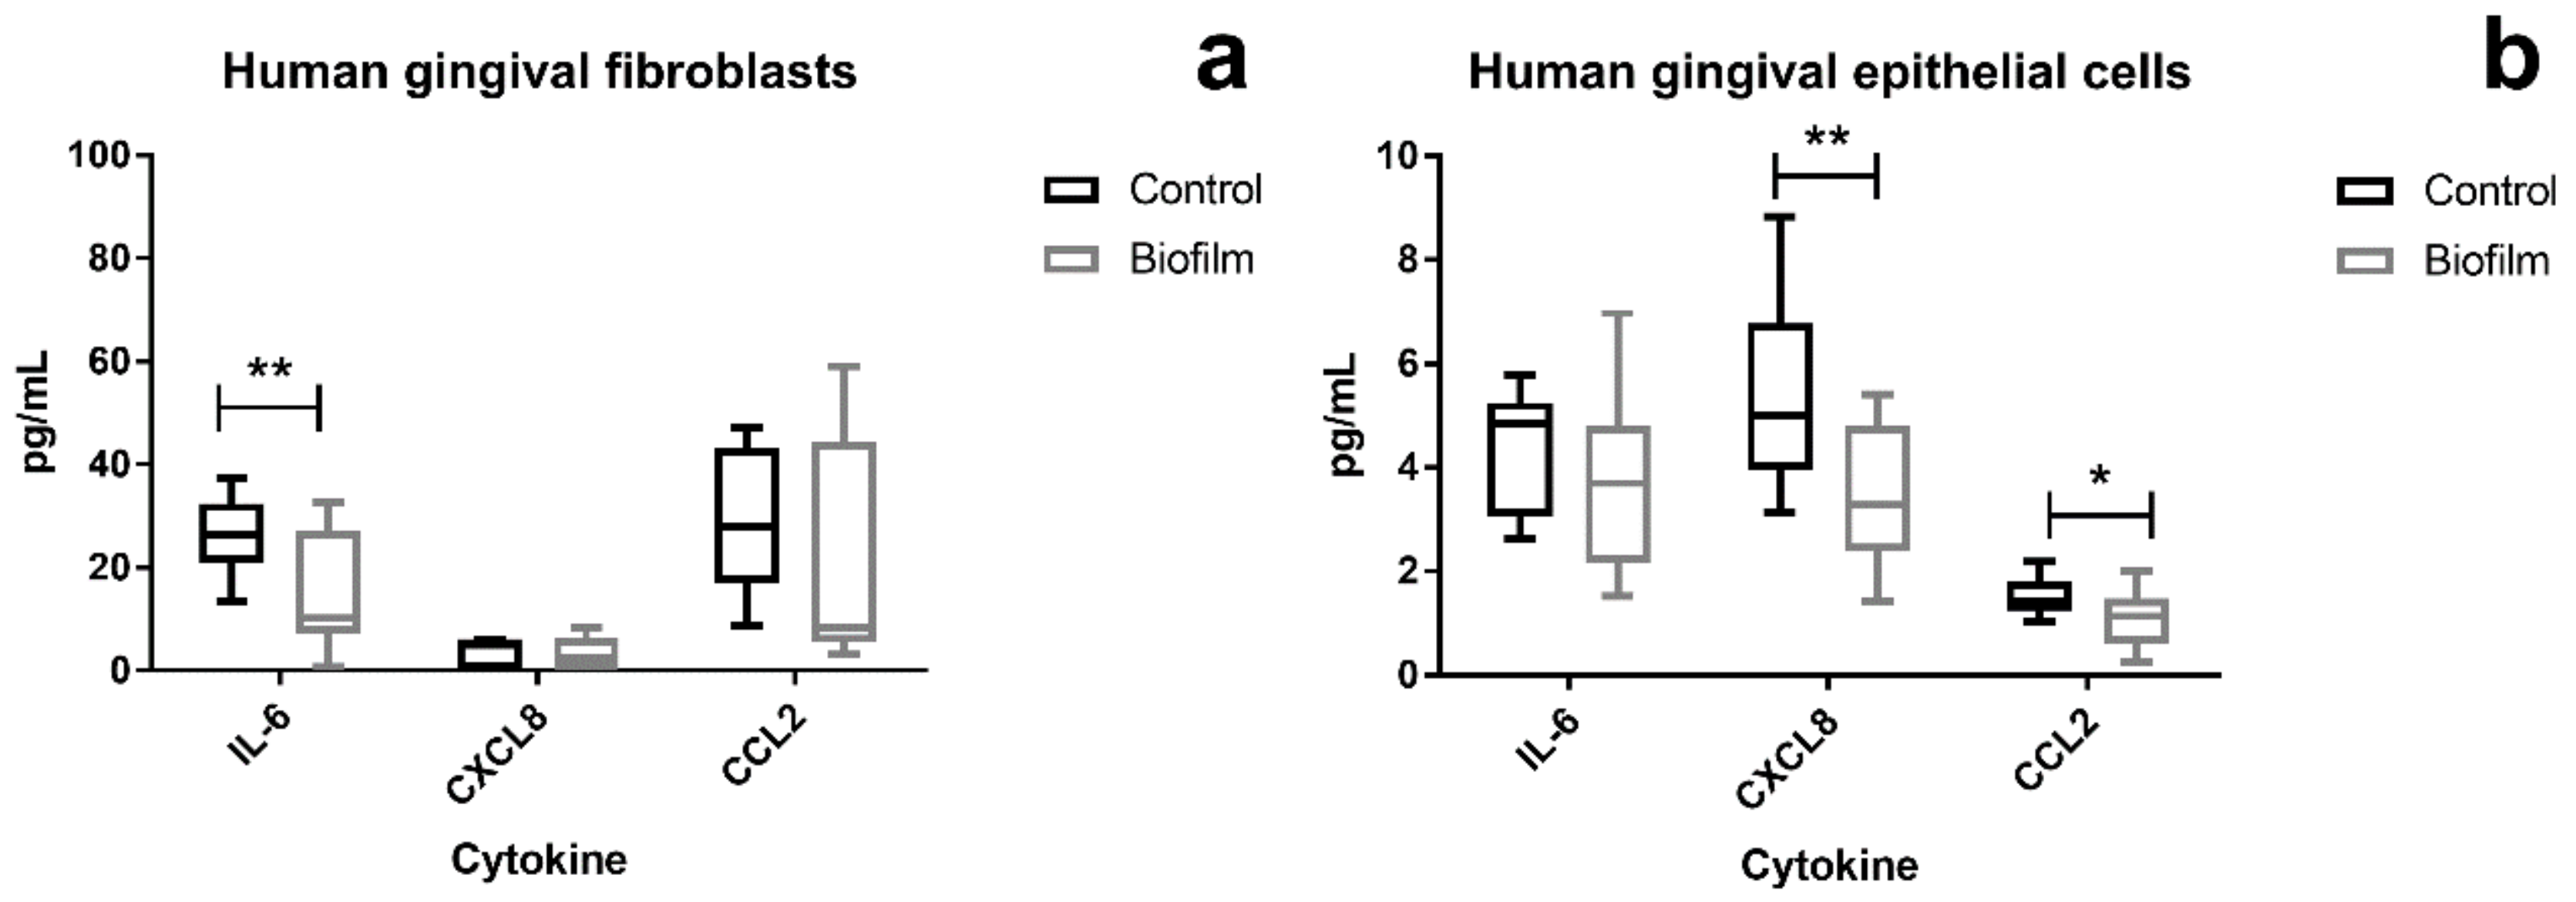
Genes of proinflammatory factors were upregulated in both cell types after biofilm challenge, and the protein levels, which were secreted into the co-culture supernatants, were measured. The levels of IL-6, CXCL8, MCP-1/CCL2, TNF-α, Gro-α/CXCL1, and Gro-β/CXCL2 that can be secreted by the tissue cells were measured using the Luminex technology. The levels of IL-6, CXCL8, and CCL2 were in the detectable range of the cytokine assay (Bio-Plex Pro Human Chemokine 6plx EXP, Bio-Rad Laboratories, Inc., US) (Figure 5). In HGFs, the IL-6 levels were significantly lower after 2 h S. oralis biofilm challenge (Figure 5a), whereas the levels of CXCL8 and CCL2 were significantly lower in HGEps than in the control group (Figure 5b).
4. Discussion
Dental implants are surrounded by mucosal soft tissue [6,55]. The major cell types in soft tissue are HGEps and HGFs. The HGEps face the oral cavity, whereas HGFs are located within the connective tissue. HGEps are subsequently in constant contact with oral biofilms, whereas HGFs are protected by the epithelial layer until the tissue of the epithelium is injured [7,9,10,56]. Previous studies indicated that oral commensal streptococci protect tissue [16,41,42,43]. We compared the response of HGEps and HGFs in a peri-implant microenvironment to commensal S. oralis, which can be present in high numbers at implant sites in oral health [21,57]. HGFs and HGEps showed distinct responses to the S. oralis biofilm and we concluded that S. oralis can only protect tissue when the peri-implant mucosa is intact.
The cell morphology and vitality of HGFs were rapidly impaired after challenge with an S. oralis biofilm (Figure 2d–f). In contrast, the morphology and vitality of HGEps remained unaffected (Figure 2j–l). Despite this difference, both cell types probably sensed the presence of S. oralis, as indicated by the transcriptional analysis, where pathways involved in bacteria recognition—such as toll-like receptor (TLR) and nucleotide-binding oligomerization domain (NOD)-like receptor signaling—were enriched (Table 1). These pathways are involved in bacteria recognition, mainly through the pathogen recognition receptors (PRRs) [58,59], which may sense the peptidoglycans in the cell wall of S. oralis [58]. It was previously shown that HGEps and HGFs constitutively express PRRs (i.e., TLR1 to 9 as well as NOD1 and NOD2) [60,61]. Any differential expression of PRRs was not observed after the analysis of gene expression (Tables S3–S6). Pathways related to the inflammatory cell response were enriched in both cell types. In HGFs, additional genes and pathways were upregulated, and these were related to cell-cycle regulation, apoptosis, development, and differentiation. Moreover, more genes were differentially regulated than in HGEps (Figure 4). More genes were regulated within enriched pathways in HGFs (Table 1) indicating a more intense response to the S. oralis biofilm. Besides, regulated genes in HGF are distributed within the pathways, whereas regulated genes in HGEps are almost only at the beginning and end of each pathway (Table 1 and Figures S4–S19). Thus, we assume that pathway regulations are more probable in HGF. Our results highlight the susceptibility of HGFs, which exhibited morphological and transcriptional stress responses. The HGEps exhibited an inflammatory response to the S. oralis biofilm, but their cell morphology and vitality were not affected. This difference in response between HGFs and HGEps might emerge from their distinct tissue topography. HGEp topography at tissue borders allowed host adaptation since the cells were in constant contact with the highly abundant commensal bacteria [62]. Belibasakis et al. showed that the transcriptional response of HGF is not specifically dependent on the composition of subgingival biofilms. The HGF response was similar to biofilms, unrelated to whether they included the three ‘red complex’ pathogens (i.e., Porphyromonas gingivalis, Treponema denticola, and Tannerella forsythia) or not [5,10]. This observation also underlines the lack in HGFs of adaptive coevolution with oral bacteria, which are protected within the connective tissue [7]. Another group showed that the transcriptional response of HGEps to the commensals Streptococcus gordonii and Fusobacterium nucleatum is similar; however, it differs from the response to the pathogens Aggregatibacter actinomycetemcomitans and P. gingivalis [16,63]. This indicates that HGEps are probably able to distinguish between bacterial species and highlights their coevolution with bacteria. Our study presents a direct comparison between HGFs and HGEps. The results of this comparison revealed that the HGFs were more susceptible to challenge with the S. oralis biofilm than were HGEps. This may be linked to their different topographies relative to soft tissue—with HGEp being located at the epithelial layer facing the oral cavity and HGFs underneath and within the connective tissue.
As previously discussed, genes of proinflammatory factors were upregulated in both cell types after biofilm challenge. The corresponding protein levels in the co-culture supernatants were not in line with the upregulated gene expression. Instead, IL-6 was lower after challenge with the S. oralis in HGFs and CXCL8 was lower in HGEps (Figure 5). In addition, CCL2, which was not regulated transcriptionally, was lower in HGEps. During the steady-state of a cell, the protein levels normally have an ideal correlation to the mRNA levels, however, during differentiation or stress response this correlation might be disrupted [64]. Cytokine production is not only regulated during transcription but also post-transcriptionally through mRNA stabilization or decay [65]. Another checkpoint for cytokines is the modulation of storage and secretion [66]. So, it is not surprising that the elevated mRNA levels of CXCL8, IL-6, and CCL2 after biofilm challenge are not necessarily associated with increased protein levels.
Attenuation of proinflammatory cytokines by S. oralis might support tissue protection. Basso et al. demonstrated that high levels of IL-6 and CXCL8 affect directly HGFs and HGEps. These factors induce apoptosis and decrease cell migration in both gingival cell types, this negative effect on their mucosal healing properties was more evident in HGFs [67], although they express low levels of IL-6 receptor [68]. Besides that direct effect, high levels of proinflammatory factors also activate and recruit immune cells, which can, in turn, promote tissue destruction [56,69,70]. Decreased IL-6 and CXCL8 levels were also detected in HGEps after co-culture with S. gordonii, whereas pathways leading to secretion of proinflammatory factors were enriched (i.e., mitogen-activated protein kinase (MAPK) signaling pathway and TLR pathway) [16]. This observation from Hasegawa et al. was in line with the transcriptional analysis (Table 1) and secreted cytokine levels in response to S. oralis (Figure 5). It has been shown that other streptococci (i.e., Streptococcus salivarius K12 and Streptococcus cristatus) attenuate CXCL8 levels too, even after stimulation with F. nucleatum, which induces CXCL8 [41,42,43]. It is also noteworthy that the mRNA of CXCL8 was not regulated after bacterial challenge in these studies [41,42,43]. It has been proposed that commensal species can modulate the host response to become hyporesponsive; thereby, they could limit tissue destruction induced by pathogenic bacteria [16,54]. A clinical study reported reduced CXCL8 levels and improved clinical appearance in patients with mild oral inflammation after the use of chewing gums containing Lactobacillus reuteri [71]. Furthermore, the clinical application of S. salivarius 24SMB and S. oralis 89a was effective against recurrent acute otitis media and recurrent acute pharyngotonsillitis [72,73]. These strains can inhibit biofilm formation by upper respiratory tract pathogens [40]. Similar biofilm inhibition against periodontopathogens has also been shown for other species [74]. Commensal streptococci seem to exert tissue-protective properties, although different commensal species may induce distinct immune responses in host cells—which may explain differences between species in cell response [41].
The values for cytokine secretion suggest that S. oralis biofilm might protect tissue; however, in HGFs transcriptional inflammatory and stress responses were induced as well as a loss of cell vitality and attachment. Biofilm challenge also induced a transcriptional inflammatory response in HGEps, but the overall condition and attachment of these cells remained unaffected and there was no additional stress response linked to apoptosis. The S. oralis biofilm induced a transcriptional inflammatory response in both cell types, in contrast to the changes in secreted proinflammatory factors, which were in the opposite direction. Since HGFs were rapidly damaged—as also reflected in the RNA quality (Table S1)—a direct comparison to HGEp was limited to the 2 h response. Cell vitality and attachment of HGFs were dramatically impaired after 6 h of co-culture (Figure 2). Considering this limitation for HGFs, the cell condition of HGEps was also investigated up to 6 h for a direct comparison. The HGEps may exhibit a comparable response to HGF at time points later than 6 h, if we bear in mind that the exposure of monolayers to biofilms differs from that of epithelial tissue. In another study, where HGFs and HGEps were stimulated with LPS (lipopolysaccharide), which allows longer periods, the viable HGFs decreased already after 24 h, whereas the HGEps after 48 h indicating a delayed response [75]. Nevertheless, even delayed response of HGEp supports the conclusion that HGFs are more susceptible than HGEps and their initial responses to the S. oralis biofilm differ. Stimulation of HGEps with synthetic TLR (toll-like receptor) and NOD agonists did not lead to increased secretion of CXCL8, IL-6, and CCL2. Instead, activation of TLRs and NODs induced the expression of antibacterial PGRPs (peptidoglycan recognition proteins) [59,76]. By that mechanism, HGEps probably prevent bacterial invasion without intense inflammatory response, which might cause tissue destruction [59,76]. In contrast, stimulation of HGFs resulted in the augmentation of CXCL8, IL-6, and CCL2 [60]. Since HGEps are in constant contact with the normal oral flora, it is justified that they do not secrete proinflammatory factors with potential tissue destructive action. HGFs secreted proinflammatory factors upon stimulation with microbial components. Normally, HGFs are isolated from normal flora; however, in the case of tissue injury, they will interact with oral bacteria [60]. We did not detect such a discrepancy in our study. This could be attributed to the use of the S. oralis biofilm with potential proteolytic activity [77,78,79], instead of synthetic microbial components or it could be that the surface of the titanium disk also affects the cytokine secretion. It has been shown that cytokine secretion might change in response to different implant surfaces [80]. Nonetheless, the general observation that HGFs react more intense than HGEps to the biofilm challenge is following previous comparisons between these cell types. Even though IL-6 is attenuated, the impact of S. oralis is prominent on HGFs especially at later time points, where cells die and detach from the titanium disk. On the one hand, the lower IL-6 levels most probably would affect the surrounding tissue avoiding further tissue destruction by other host cells. On the other hand, the cell detachment and death of HGFs would destroy the connective tissue in response to S. oralis. Our results indicate the tissue-protective properties of S. oralis, which are reflected in its full extent in HGEps, which were not damaged by the S. oralis biofilm during the observed timeframe.
To our knowledge, this is the first study showing the direct comparison of HGFs and HGEps in response to a biofilm. The results indicate that the S. oralis biofilm has a protective role on the peri-implant tissue borders and highlights the adaptive co-evolution of epithelial cells with oral commensal bacteria; however, if the underlying connective tissue is exposed, S. oralis can affect the HGFs, which are susceptible. This could induce further tissue destruction. Overall, the results underline the importance of an intact implant–epithelium interface and indicate that any lesions may lead to the initial response of tissue destruction by HGFs in connective tissue, even if pathogens are absent. These cell-specific responses should be considered during the in vitro investigation of host–pathogen interactions. Future studies using in vitro systems including both cell types could provide further details.
5. Conclusions
We could gain new insights into the response of the two main cell types of the peri-implant mucosa to the commensal S. oralis, a highly abundant species on healthy dental implants [3,4,5,6,20,21,22,23]. HGEps—which are in constant contact with the S. oralis—exhibited a subtle reaction without impact on their cell condition and attachment. In contrast, HGF, which is protected by the epithelial layer under physiological conditions, was highly susceptible. Our results provide evidence that an intact soft-tissue seal at the implant is required to maintain health and is a prerequisite for a protective effect of commensal biofilms, which can promote homeostasis. Our findings might support future guidelines for the prevention and treatment of peri-implant disease.
Supplementary Materials
The following are available online at https://0-www-mdpi-com.brum.beds.ac.uk/2073-4409/9/5/1226/s1, Table S1: Quality of RNA isolated from human gingival fibroblasts after 2, 4, or 6 h of co-culture with the S. oralis biofilm, Table S2: Quality of RNA isolated from human gingival fibroblasts and epithelial cells after 2 h of co-culture with the S. oralis biofilm, Table S3: List of upregulated genes in human gingival fibroblasts after 2 h S oralis biofilm challenge, Table S4: List of downregulated genes in human gingival fibroblasts after 2 h S. oralis biofilm challenge, Table S5: List of upregulated genes in human gingival epithelial cells after 2 h S. oralis biofilm challenge, Table S6: List of downregulated genes in human gingival epithelial cells after 2 h S. oralis biofilm challenge, Table S7: List of all enriched pathways in fibroblasts and epithelial cells after 2 h S. oralis biofilm challenge, Figure S1: Cell nuclei of HGFs on titanium disks after S. oralis biofilm challenge, Figure S2: Cell nuclei of HGEps on titanium disks after S. oralis biofilm challenge, Figure S3: Effect of cell culture media on S. oralis biofilm volume and vitality, Figures S4-S11: Role of differentially regulated genes in HGF and HGEp within common enriched pathways, Figures S12-S17: Role of differentially regulated genes in HGF within the enriched pathways, Figures S18-S19: Role of differentially regulated genes in HGEp within the enriched pathways.
Author Contributions
Conceptualization, A.I.-T., J.E., M.S. and A.W.; data curation, A.I.-T.; formal analysis, A.I.-T. and C.S.F.; funding acquisition, M.S; investigation, A.I.-T. and C.S.F.; methodology, A.I.-T., J.E., C.S.F. and A.W.; project administration, M.S., A.W.; resources, C.S.F., M.S, and A.W; supervision, J.E., M.S, and A.W.; validation, A.I.-T., J.E., C.S.F., M.S. and A.W.; visualization, A.I.-T.; writing—original draft, A.I.-T.; writing—review and editing, J.E., C.S.F., M.S. and A.W. All authors have read and agreed to the published version of the manuscript.
Funding
This research was funded by the Niedersächsisches Ministerium für Wissenschaft und Kultur and the Volkswagen Foundation, grant number WVZN2860. The APC was funded by the Open Access Publication Fund of Hannover Medical School (MHH).
Acknowledgments
The current research study was conducted within the interdisciplinary research consortium BIOFABRICATION for NIFE. Microarray data used or referred to in this publication were generated by the Research Core Unit Genomics at Hannover Medical School. We would like to thank Dr. Oliver Dittrich-Breiholz and Heike Schneider for their support and advice. The authors would like to thank Hannes Haacke, Kerstin Beushausen, and Jana Keil for their technical assistance. We acknowledge support by the German Research Foundation (DFG) and the Open Access Publication Fund of Hannover Medical School (MHH).
Conflicts of Interest
The authors declare no conflict of interest. The funders had no role in the design of the study; in the collection, analyses, or interpretation of data; in the writing of the manuscript, or in the decision to publish the results.
References
- Belibasakis, G.N. Microbiological and immuno-pathological aspects of peri-implant diseases. Arch. Oral Biol. 2014, 59, 66–72. [Google Scholar] [CrossRef] [PubMed] [Green Version]
- Irshad, M.; Scheres, N.; Anssari Moin, D.; Crielaard, W.; Loos, B.G.; Wismeijer, D.; Laine, M.L. Cytokine and matrix metalloproteinase expression in fibroblasts from peri-implantitis lesions in response to viable Porphyromonas gingivalis. J. Periodontal Res. 2013, 48, 647–656. [Google Scholar] [CrossRef] [PubMed]
- Charalampakis, G.; Belibasakis, G.N. Microbiome of peri-implant infections: Lessons from conventional, molecular and metagenomic analyses. Virulence 2015, 6, 183–187. [Google Scholar] [CrossRef] [PubMed] [Green Version]
- Araujo, M.G.; Lindhe, J. Peri-implant health. J. Clin. Periodontol. 2018, 45, S230–S236. [Google Scholar] [CrossRef] [PubMed] [Green Version]
- Belibasakis, G.N.; Charalampakis, G.; Bostanci, N.; Stadlinger, B. Peri-implant infections of oral biofilm etiology. Adv. Exp. Med. Biol. 2015, 830, 69–84. [Google Scholar] [PubMed]
- Berglundh, T.; Armitage, G.; Araujo, M.G.; Avila-Ortiz, G.; Blanco, J.; Camargo, P.M.; Chen, S.; Cochran, D.; Derks, J.; Figuero, E.; et al. Peri-implant diseases and conditions: Consensus report of workgroup 4 of the 2017 World Workshop on the Classification of Periodontal and Peri-Implant Diseases and Conditions. J. Periodontol. 2018, 89, S313–S328. [Google Scholar] [CrossRef] [PubMed]
- Kinikoglu, B.; Damour, O.; Hasirci, V. Tissue engineering of oral mucosa: A shared concept with skin. J. Artif. Organs 2015, 18, 8–19. [Google Scholar] [CrossRef]
- Dale, B.A. Fascination with Epithelia: Architecture, Proteins, and Functions. J. Dent. Res. 2003, 82, 866–869. [Google Scholar] [CrossRef]
- Abiko, Y.; Hiratsuka, K.; Kiyama-Kishikawa, M.; Tsushima, K.; Ohta, M.; Sasahara, H. Profiling of differentially expressed genes in human gingival epithelial cells and fibroblasts by DNA microarray. J. Oral Sci. 2004, 46, 19–24. [Google Scholar] [CrossRef] [Green Version]
- Belibasakis, G.N.; Bao, K.; Bostanci, N. Transcriptional profiling of human gingival fibroblasts in response to multi-species in vitro subgingival biofilms. Mol. Oral Microbiol. 2014, 29, 174–183. [Google Scholar] [CrossRef] [Green Version]
- Palaiologou, A.A.; Yukna, R.A.; Moses, R.; Lallier, T.E. Gingival, Dermal, and Periodontal Ligament Fibroblasts Express Different Extracellular Matrix Receptors. J. Periodontol. 2001, 72, 798–807. [Google Scholar] [CrossRef] [PubMed]
- Eberhard, J.; Menzel, N.; Dommisch, H.; Winter, J.; Jepsen, S.; Mutters, R. The stage of native biofilm formation determines the gene expression of human beta-defensin-2, psoriasin, ribonuclease 7 and inflammatory mediators: A novel approach for stimulation of keratinocytes with in situ formed biofilms. Oral Microbiol. Immunol. 2008, 23, 21–28. [Google Scholar] [CrossRef]
- Guggenheim, B.; Gmur, R.; Galicia, J.C.; Stathopoulou, P.G.; Benakanakere, M.R.; Meier, A.; Thurnheer, T.; Kinane, D.F. In vitro modeling of host-parasite interactions: The ‘subgingival’ biofilm challenge of primary human epithelial cells. BMC Microbiol. 2009, 9, 280–2180. [Google Scholar] [CrossRef] [PubMed] [Green Version]
- Millhouse, E.; Jose, A.; Sherry, L.; Lappin, D.F.; Patel, N.; Middleton, A.M.; Pratten, J.; Culshaw, S.; Ramage, G. Development of an in vitro periodontal biofilm model for assessing antimicrobial and host modulatory effects of bioactive molecules. BMC Oral Health 2014, 14, 80–6831. [Google Scholar] [CrossRef] [PubMed] [Green Version]
- Ramage, G.; Lappin, D.F.; Millhouse, E.; Malcolm, J.; Jose, A.; Yang, J.; Bradshaw, D.J.; Pratten, J.R.; Culshaw, S. The epithelial cell response to health and disease associated oral biofilm models. J. Periodont. Res. 2017, 52, 325–333. [Google Scholar] [CrossRef] [Green Version]
- Hasegawa, Y.; Mans, J.J.; Mao, S.; Lopez, M.C.; Baker, H.V.; Handfield, M.; Lamont, R.J. Gingival epithelial cell transcriptional responses to commensal and opportunistic oral microbial species. Infect. Immun. 2007, 75, 2540–2547. [Google Scholar] [CrossRef] [Green Version]
- Ebersole, J.L.; Peyyala, R.; Gonzalez, O.A. Biofilm-induced profiles of immune response gene expression by oral epithelial cells. Mol. Oral Microbiol. 2019, 34. [Google Scholar] [CrossRef] [Green Version]
- Furst, M.M.; Salvi, G.E.; Lang, N.P.; Persson, G.R. Bacterial colonization immediately after installation on oral titanium implants. Clin. Oral Implants Res. 2007, 18, 501–508. [Google Scholar] [CrossRef]
- Gomez-Florit, M.; Ramis, J.M.; Xing, R.; Taxt-Lamolle, S.; Haugen, H.J.; Lyngstadaas, S.P.; Monjo, M. Differential response of human gingival fibroblasts to titanium- and titanium-zirconium-modified surfaces. J. Periodontal Res. 2014, 49, 425–436. [Google Scholar] [CrossRef]
- Diaz, P.I.; Chalmers, N.I.; Rickard, A.H.; Kong, C.; Milburn, C.L.; Palmer, R.J.; Kolenbrander, P.E. Molecular characterization of subject-specific oral microflora during initial colonization of enamel. Appl. Environ. Microbiol. 2006, 72, 2837–2848. [Google Scholar] [CrossRef] [Green Version]
- Diaz, P.I.; Xie, Z.; Sobue, T.; Thompson, A.; Biyikoglu, B.; Ricker, A.; Ikonomou, L.; Dongari-Bagtzoglou, A. Synergistic interaction between Candida albicans and commensal oral streptococci in a novel in vitro mucosal model. Infect. Immun. 2012, 80, 620–632. [Google Scholar] [CrossRef] [PubMed] [Green Version]
- Socransky, S.S.; Haffajee, A.D. Dental biofilms: Difficult therapeutic targets. Periodontology 2000, 28, 12–55. [Google Scholar] [CrossRef] [PubMed]
- Carrouel, F.; Viennot, S.; Santamaria, J.; Veber, P.; Bourgeois, D. Quantitative Molecular Detection of 19 Major Pathogens in the Interdental Biofilm of Periodontally Healthy Young Adults. Front. Microbiol. 2016, 7, 840. [Google Scholar] [CrossRef] [PubMed]
- Boutin, S.; Hagenfeld, D.; Zimmermann, H.; El Sayed, N.; Hopker, T.; Greiser, H.K.; Becher, H.; Kim, T.S.; Dalpke, A.H. Clustering of Subgingival Microbiota Reveals Microbial Disease Ecotypes Associated with Clinical Stages of Periodontitis in a Cross-Sectional Study. Front. Microbiol. 2017, 8, 340. [Google Scholar] [CrossRef] [Green Version]
- Douglas, C.W.; Heath, J.; Hampton, K.K.; Preston, F.E. Identity of viridans streptococci isolated from cases of infective endocarditis. J. Med. Microbiol. 1993, 39, 179–182. [Google Scholar] [CrossRef] [Green Version]
- Beighton, D.; Carr, A.D.; Oppenheim, B.A. Identification of viridans streptococci associated with bacteraemia in neutropenic cancer patients. J. Med. Microbiol. 1994, 40, 202–204. [Google Scholar] [CrossRef]
- Ahmed, R.; Hassall, T.; Morland, B.; Gray, J. Viridans streptococcus bacteremia in children on chemotherapy for cancer: An underestimated problem. Pediatr. Hematol. Oncol. 2003, 20, 439–444. [Google Scholar] [CrossRef]
- Dyson, C.; Barnes, R.A.; Harrison, G.A.J. Infective endocarditis: An epidemiological review of 128 episodes. J. Infect. 1999, 38, 87–93. [Google Scholar] [CrossRef]
- Koren, O.; Spor, A.; Felin, J.; Fak, F.; Stombaugh, J.; Tremaroli, V.; Behre, C.J.; Knight, R.; Fagerberg, B.; Ley, R.E.; et al. Human oral, gut, and plaque microbiota in patients with atherosclerosis. Proc. Natl. Acad. Sci. USA 2011, 108 (Suppl. 1), 4592–4598. [Google Scholar] [CrossRef] [Green Version]
- Lehtiniemi, J.; Karhunen, P.J.; Goebeler, S.; Nikkari, S.; Nikkari, S.T. Identification of different bacterial DNAs in human coronary arteries. Eur. J. Clin. Investig. 2005, 35, 13–16. [Google Scholar] [CrossRef]
- Nagata, E.; de Toledo, A.; Oho, T. Invasion of human aortic endothelial cells by oral viridans group streptococci and induction of inflammatory cytokine production. Mol. Oral Microbiol. 2011, 26, 78–88. [Google Scholar] [CrossRef] [PubMed]
- De Toledo, A.; Nagata, E.; Yoshida, Y.; Oho, T. Streptococcus oralis coaggregation receptor polysaccharides induce inflammatory responses in human aortic endothelial cells. Mol. Oral Microbiol. 2012, 27, 295–307. [Google Scholar] [CrossRef] [PubMed]
- Ammann, T.W.; Belibasakis, G.N.; Thurnheer, T. Impact of early colonizers on in vitro subgingival biofilm formation. PLoS ONE 2013, 8, e83090. [Google Scholar] [CrossRef] [PubMed]
- Kolenbrander, P.E.; Andersen, R.N.; Blehert, D.S.; Egland, P.G.; Foster, J.S.; Palmer, R.J. Communication among oral bacteria. Microbiol. Mol. Biol. Rev. 2002, 66, 486–505. [Google Scholar] [CrossRef] [Green Version]
- Whitmore, S.E.; Lamont, R.J. The pathogenic persona of community-associated oral streptococci. Mol. Microbiol. 2011, 81, 305–314. [Google Scholar] [CrossRef] [Green Version]
- Xu, H.; Sobue, T.; Thompson, A.; Xie, Z.; Poon, K.; Ricker, A.; Cervantes, J.; Diaz, P.I.; Dongari-Bagtzoglou, A. Streptococcal co-infection augments Candida pathogenicity by amplifying the mucosal inflammatory response. Cell Microbiol. 2014, 16, 214–231. [Google Scholar] [CrossRef]
- Xu, H.; Sobue, T.; Bertolini, M.; Thompson, A.; Dongari-Bagtzoglou, A. Streptococcus oralis and Candida albicans Synergistically Activate mu-Calpain to Degrade E-cadherin From Oral Epithelial Junctions. J. Infect. Dis. 2016, 214, 925–934. [Google Scholar] [CrossRef] [Green Version]
- Koo, H.; Andes, D.R.; Krysan, D.J. Candida-streptococcal interactions in biofilm-associated oral diseases. PLoS Pathog. 2018, 14, e1007342. [Google Scholar] [CrossRef] [Green Version]
- Thurnheer, T.; Belibasakis, G.N. Streptococcus oralis maintains homeostasis in oral biofilms by antagonizing the cariogenic pathogen Streptococcus mutans. Mol. Oral Microbiol. 2018, 33, 234–239. [Google Scholar] [CrossRef] [Green Version]
- Bidossi, A.; De Grandi, R.; Toscano, M.; Bottagisio, M.; De Vecchi, E.; Gelardi, M.; Drago, L. Probiotics Streptococcus salivarius 24SMB and Streptococcus oralis 89a interfere with biofilm formation of pathogens of the upper respiratory tract. BMC Infect. Dis. 2018, 18, 653. [Google Scholar] [CrossRef]
- Cosseau, C.; Devine, D.A.; Dullaghan, E.; Gardy, J.L.; Chikatamarla, A.; Gellatly, S.; Yu, L.L.; Pistolic, J.; Falsafi, R.; Tagg, J.; et al. The commensal Streptococcus salivarius K12 downregulates the innate immune responses of human epithelial cells and promotes host-microbe homeostasis. Infect. Immun. 2008, 76, 4163–4175. [Google Scholar] [CrossRef] [PubMed] [Green Version]
- Zhang, G.; Chen, R.; Rudney, J.D. Streptococcus cristatus attenuates Fusobacterium nucleatum-induced interleukin-8 expression in oral epithelial cells. J. Periodontal Res. 2008, 43, 408–416. [Google Scholar] [CrossRef] [PubMed]
- Zhang, G.; Chen, R.; Rudney, J.D. Streptococcus cristatus modulates the Fusobacterium nucleatum-induced epithelial interleukin-8 response through the nuclear factor-kappa B pathway. J. Periodontal Res. 2011, 46, 558–567. [Google Scholar] [CrossRef] [PubMed]
- Ohshima, J.; Wang, Q.; Fitzsimonds, Z.R.; Miller, D.P.; Sztukowska, M.N.; Jung, Y.J.; Hayashi, M.; Whiteley, M.; Lamont, R.J. Streptococcus gordonii programs epithelial cells to resist ZEB2 induction by Porphyromonas gingivalis. Proc. Natl. Acad. Sci. USA 2019, 116, 8544–8553. [Google Scholar] [CrossRef] [PubMed] [Green Version]
- Darveau, R.P. Periodontitis: A polymicrobial disruption of host homeostasis. Nat. Rev. Microbiol. 2010, 8, 481–490. [Google Scholar] [CrossRef]
- Devine, D.A.; Marsh, P.D.; Meade, J. Modulation of host responses by oral commensal bacteria. J. Oral Microbiol. 2015, 7. [Google Scholar] [CrossRef]
- Schneider, C.A.; Rasband, W.S.; Eliceiri, K.W. NIH Image to ImageJ: 25 years of image analysis. Nat. Methods 2012, 9, 671–675. [Google Scholar] [CrossRef]
- Huang da, W.; Sherman, B.T.; Lempicki, R.A. Bioinformatics enrichment tools: Paths toward the comprehensive functional analysis of large gene lists. Nucleic Acids Res. 2009, 37, 1–13. [Google Scholar] [CrossRef] [Green Version]
- Huang da, W.; Sherman, B.T.; Lempicki, R.A. Systematic and integrative analysis of large gene lists using DAVID bioinformatics resources. Nat. Protoc. 2009, 4, 44–57. [Google Scholar] [CrossRef]
- Kanehisa, M.; Sato, Y.; Furumichi, M.; Morishima, K.; Tanabe, M. New approach for understanding genome variations in KEGG. Nucleic Acids Res. 2019, 47, D590–D595. [Google Scholar] [CrossRef] [Green Version]
- Kanehisa, M. Toward understanding the origin and evolution of cellular organisms. Protein Sci. 2019, 28, 1947–1951. [Google Scholar] [CrossRef]
- Kanehisa, M.; Goto, S. KEGG: Kyoto encyclopedia of genes and genomes. Nucleic Acids Res. 2000, 28, 27–30. [Google Scholar] [CrossRef]
- Luo, W.; Brouwer, C. Pathview: An R/Bioconductor package for pathway-based data integration and visualization. Bioinformatics 2013, 29, 1830–1831. [Google Scholar] [CrossRef] [Green Version]
- Luo, W.; Pant, G.; Bhavnasi, Y.K.; Blanchard, S.G.; Brouwer, C. Pathview Web: User friendly pathway visualization and data integration. Nucleic Acids Res. 2017, 45, W501–W508. [Google Scholar] [CrossRef]
- Berglundh, T.; Lindhe, J.; Ericsson, I.; Marinello, C.P.; Liljenberg, B.; Thomsen, P. The soft tissue barrier at implants and teeth. Clin. Oral Implants Res. 1991, 2, 81–90. [Google Scholar] [CrossRef]
- Groeger, S.E.; Meyle, J. Epithelial barrier and oral bacterial infection. Periodontology 2000, 69, 46–67. [Google Scholar] [CrossRef]
- Schincaglia, G.P.; Hong, B.Y.; Rosania, A.; Barasz, J.; Thompson, A.; Sobue, T.; Panagakos, F.; Burleson, J.A.; Dongari-Bagtzoglou, A.; Diaz, P.I. Clinical, Immune, and Microbiome Traits of Gingivitis and Peri-implant Mucositis. J. Dent. Res. 2017, 96, 47–55. [Google Scholar] [CrossRef]
- Sukhithasri, V.; Nisha, N.; Biswas, L.; Anil Kumar, V.; Biswas, R. Innate immune recognition of microbial cell wall components and microbial strategies to evade such recognitions. Microbiol. Res. 2013, 168, 396–406. [Google Scholar] [CrossRef]
- Uehara, A.; Sugawara, Y.; Kurata, S.; Fujimoto, Y.; Fukase, K.; Kusumoto, S.; Satta, Y.; Sasano, T.; Sugawara, S.; Takada, H. Chemically synthesized pathogen-associated molecular patterns increase the expression of peptidoglycan recognition proteins via toll-like receptors, NOD1 and NOD2 in human oral epithelial cells. Cell Microbiol. 2005, 7, 675–686. [Google Scholar] [CrossRef]
- Uehara, A.; Takada, H. Functional TLRs and NODs in human gingival fibroblasts. J. Dent. Res. 2007, 86, 249–254. [Google Scholar] [CrossRef]
- Sugawara, Y.; Uehara, A.; Fujimoto, Y.; Kusumoto, S.; Fukase, K.; Shibata, K.; Sugawara, S.; Sasano, T.; Takada, H. Toll-like receptors, NOD1, and NOD2 in oral epithelial cells. J. Dent. Res. 2006, 85, 524–529. [Google Scholar] [CrossRef]
- Mans, J.J.; von Lackum, K.; Dorsey, C.; Willis, S.; Wallet, S.M.; Baker, H.V.; Lamont, R.J.; Handfield, M. The degree of microbiome complexity influences the epithelial response to infection. BMC Genom. 2009, 10, 380–2164. [Google Scholar] [CrossRef] [Green Version]
- Handfield, M.; Mans, J.J.; Zheng, G.; Lopez, M.C.; Mao, S.; Progulske-Fox, A.; Narasimhan, G.; Baker, H.V.; Lamont, R.J. Distinct transcriptional profiles characterize oral epithelium-microbiota interactions. Cell Microbiol. 2005, 7, 811–823. [Google Scholar] [CrossRef]
- Liu, Y.; Beyer, A.; Aebersold, R. On the Dependency of Cellular Protein Levels on mRNA Abundance. Cell 2016, 165, 535–550. [Google Scholar] [CrossRef] [Green Version]
- Anderson, P. Post-transcriptional control of cytokine production. Nat. Immunol. 2008, 9, 353–359. [Google Scholar] [CrossRef]
- Stow, J.L.; Murray, R.Z. Intracellular trafficking and secretion of inflammatory cytokines. Cytokine Growth Factor Rev. 2013, 24, 227–239. [Google Scholar] [CrossRef]
- Basso, F.G.; Pansani, T.N.; Turrioni, A.P.; Soares, D.G.; de Souza Costa, C.A.; Hebling, J. Tumor Necrosis Factor-α and Interleukin (IL)-1β, IL-6, and IL-8 Impair In Vitro Migration and Induce Apoptosis of Gingival Fibroblasts and Epithelial Cells, Delaying Wound Healing. J. Periodontol. 2016, 87, 990–996. [Google Scholar] [CrossRef]
- Naruishi, K.; Nagata, T. Biological effects of interleukin-6 on Gingival Fibroblasts: Cytokine regulation in periodontitis. J. Cell. Physiol. 2018, 233, 6393–6400. [Google Scholar] [CrossRef]
- Suchett-Kaye, G.; Morrier, J.J.; Barsotti, O. Interactions between non-immune host cells and the immune system during periodontal disease: Role of the gingival keratinocyte. Crit. Rev. Oral Biol. Med. 1998, 9, 292–305. [Google Scholar] [CrossRef]
- Pan, W.; Wang, Q.; Chen, Q. The cytokine network involved in the host immune response to periodontitis. Int. J. Oral Sci. 2019, 11, 1–13. [Google Scholar] [CrossRef] [Green Version]
- Twetman, S.; Derawi, B.; Keller, M.; Ekstrand, K.; Yucel-Lindberg, T.; Stecksen-Blicks, C. Short-term effect of chewing gums containing probiotic Lactobacillus reuteri on the levels of inflammatory mediators in gingival crevicular fluid. Acta Odontol. Scand. 2009, 67, 19–24. [Google Scholar] [CrossRef]
- La Mantia, I.; Varricchio, A.; Ciprandi, G. Bacteriotherapy with Streptococcus salivarius 24SMB and Streptococcus oralis 89a nasal spray for preventing recurrent acute otitis media in children: A real-life clinical experience. Int. J. Gen. Med. 2017, 10, 171–175. [Google Scholar] [CrossRef] [Green Version]
- Andaloro, C.; Santagati, M.; Stefani, S.; La Mantia, I. Bacteriotherapy with Streptococcus salivarius 24SMB and Streptococcus oralis 89a oral spray for children with recurrent streptococcal pharyngotonsillitis: A randomized placebo-controlled clinical study. Eur. Arch. Otorhinolaryngol. 2019, 276, 879–887. [Google Scholar] [CrossRef]
- Patini, R.; Cattani, P.; Marchetti, S.; Isola, G.; Quaranta, G.; Gallenzi, P. Evaluation of Predation Capability of Periodontopathogens Bacteria by Bdellovibrio Bacteriovorus HD100. An in Vitro Study. Materials (Basel) 2019, 12. [Google Scholar] [CrossRef] [Green Version]
- Basso, F.G.; Soares, D.G.; Pansani, T.N.; Turrioni, A.P.S.; Scheffel, D.L.; de Souza Costa, C.A.; Hebling, J. Effect of LPS treatment on the viability and chemokine synthesis by epithelial cells and gingival fibroblasts. Arch. Oral Biol. 2015, 60, 1117–1121. [Google Scholar] [CrossRef]
- Uehara, A.; Fujimoto, Y.; Fukase, K.; Takada, H. Various human epithelial cells express functional Toll-like receptors, NOD1 and NOD2 to produce anti-microbial peptides, but not proinflammatory cytokines. Mol. Immunol. 2007, 44, 3100–3111. [Google Scholar] [CrossRef]
- Homer, K.A.; Whiley, R.A.; Beighton, D. Proteolytic activity of oral streptococci. FEMS Microbiol. Lett. 1990, 55, 257–260. [Google Scholar] [CrossRef]
- Beighton, D.; Homer, K.A.; Kelley, S. The Production of Protease Activities by Streptococcus oralis Strains Isolated from Endocarditis. Microb. Ecol. Health Dis. 1995, 8, 213–218. [Google Scholar] [CrossRef] [Green Version]
- Rafay, A.M.; Homer, K.A.; Beighton, D. Effect of mucin and glucose on proteolytic and glycosidic activities of Streptococcus oralis. J. Med. Microbiol. 1996, 44, 409–417. [Google Scholar] [CrossRef]
- Stavroullakis, A.; Brito, C.; Chen, H.Y.; Bajenova, E.; Prakki, A.; Nogueira-Filho, G. Dental implant surface treatments may modulate cytokine secretion in Porphyromonas gingivalis-stimulated human gingival fibroblasts: A comparative study. J. Biomed. Mater. Res. A 2015, 103, 1131–1140. [Google Scholar] [CrossRef]
Figure 1.
Schematic representation of the co-culture set up. Titanium disks were colonized by primary human gingival epithelial cells (HGEps) or fibroblasts (HGFs) (green). The S. oralis biofilm (yellow) was placed on top of spacers and was facing the tissue cell monolayers at a distance of 1 mm. The well was filled with an antibiotic-free cell culture medium. Left: 2D cross-section of the co-culture set up. Right: 3D representation with a cross-section of spacer and biofilm.

Figure 2.
The vitality of gingival tissue cells after the S. oralis biofilm challenge. Tissue cells grown on titanium disks were co-cultured with the S. oralis biofilm or a control membrane for up to 6 h. Subsequently, the cells were stained for LIVE/DEAD. Green depicts live cells and red dead cells. The HGF remained vital in the control samples after 2, 4, or 6 h—(a), (b), and (c), respectively. After 2 h of co-culture with the S. oralis biofilm, the vitality of HGF was similar to that of the control (d). Many dead cells were detected after 4 h (e) and almost all were dead after 6 h (f). The HGEp remained vital in the control samples after 2, 4, or 6 h—(g), (h), and (i), respectively. The HGEps remained unaffected after co-culture with the S. oralis biofilm for 2, 4, or 6 h—(j), (k), and (l), respectively. Typical pictures from four to five independent experiments. Scale bars: 200 µm.

Figure 3.
Cell attachment of gingival tissue cells after S. oralis biofilm challenge. Tissue cells grown on titanium disks were co-cultured with the S. oralis biofilm or a control membrane for up to 6 h. The cells were fixed after examination of the LIVE/DEAD staining and their nuclei were stained with 4′,6-Diamidino-2-phenylindole dihydrochloride (DAPI). Five random images were acquired from each sample and nuclei were automatically counted using ImageJ. Cell attachment of HGF decreased over time in response to the S. oralis biofilm (a). In HGEp, the cell attachment remained mainly unaffected, except for a slight decrease in cell numbers after 4 h of co-culture with the biofilm (b). Statistical significance was determined using the two-way ANOVA with Sidak’s multiple comparisons test. Data points are represented as Box and Whiskers with Tukey error bars. Asterisks indicate p < 0.05 and double asterisks p < 0.01. HGFs: data from two independent experiments (six control cultures and six co-cultures). HGEps: data from two independent experiments (five control cultures and five co-cultures). HGF 4 h: p = 0.0057; HGF 6 h: p < 0.0001; HGEp 4 h: p = 0.04442.

Figure 4.
Transcriptional analysis of peri-implant tissue cells after 2 h challenge with S. oralis biofilm. The HGFs (a) showed a broader response than the HGEps (b). The heat-maps were generated using Qlucore Omics Explorer 3.2 after the hierarchical clustering of the experimental groups and the differentially regulated genes (data from three independent experiments). The intensity of red indicates the upregulation of genes after co-culture and intensity of green downregulation (c). Detailed gene lists of upregulated and downregulated genes are recorded in the supplementary material (Tables S3–S6). HGF: data from three independent experiments (five control cultures and seven co-cultures). HGEp: data from three independent experiments (six control cultures and six co-cultures).

Figure 5.
Levels of secreted proinflammatory cytokines from peri-implant tissue cells after 2 h co-culture with the S. oralis biofilm. Cytokines were measured using a Bio-Plex Kit for multiplex analysis. In HGFs, interleukin 6 (IL-6) levels were significantly reduced after co-culture (a). The interleukin 8 (CXCL8) and CCL2 levels were significantly reduced in HGEps after biofilm challenge (b). Data were tested for normal distribution (D’Agostino–Pearson normality test) and statistical significance was determined using the multiple T-test with corrections for multiple comparisons using the Holm–Sidak method, when p < 0.05. Data points are represented as Box and Whiskers with Tukey error bars. Asterisks indicate p < 0.05 and double asterisks p < 0.01. HGFs: data from three independent experiments (five control cultures and seven co-cultures). HGEps: data from three independent experiments (six control cultures and six co-cultures). HGF IL-6: p = 0.02684; HGEp CXCL8: p = 0.001608; HGEp CCL2: p = 0.01979.


Table 1.
Enriched pathways of upregulated genes from HGFs and HGEps after challenge with the S. oralis biofilm for 2 h. The potential role of each gene in the signal transduction of respective pathways is indicated.
Table 1.
Enriched pathways of upregulated genes from HGFs and HGEps after challenge with the S. oralis biofilm for 2 h. The potential role of each gene in the signal transduction of respective pathways is indicated.
| Human Gingival Fibroblasts | Human Gingival Epithelial Cells | |||||
|---|---|---|---|---|---|---|
| Pathway | % | p | Genes | % | p | Genes |
| Chemokine signaling pathway | 5.32 | 0.0421 | CXCL1L, CCL2L, NCF1RS, CXCL3L, CXCL2L | 0.25 | 0.0068 | CXCL1L, CXCL2L, CXCL8L |
| Cytokine-cytokine receptor interaction | 5.32 | 0.0791 | CSF2L, IL6L, CCL2L, IL12AL, TNFSF9L | 0.25 | 0.0103 | IL6L, TNFL, CXCL8L |
| FoxO signaling pathway | 7.45 | 0.0003 | SGK1TI, IL6L, PLK3RS, PLK2RS, GADD45GRS, GADD45BRS, KLF2RS | |||
| Jak-STAT signaling pathway | 5.32 | 0.0190 | CSF2L, IL6L, SOCS3TI, IL12AL, MYCTF | |||
| MAPK signaling pathway | 10.64 | 0.0001 | DUSP5TI, FGF5L, FOSTF, DUSP2TI, DUSP1TI, JUNTF, GADD45GTA, GADD45BTA, MYCTF, NGFL | |||
| NF-kappa B signaling pathway | 0.17 | 0.0614 | TNFL, CXCL8RS | |||
| NOD-like receptor signaling pathway | 0.25 | 0.0006 | IL6RS, TNFRS, CXCL8RS | |||
| p53 signaling pathway | 3.19 | 0.0814 | GADD45GTI, RS, PMAIP1TA, GADD45BTI, RS | |||
| PI3K-Akt signaling pathway | 6.38 | 0.0959 | FGF5L, SGK1TA, IL6L, MYCTF, EPHA2RC, NGFL | |||
| TNF signaling pathway | 11.70 | 0.0000 | CXCL1RS, CSF2RS, FOSTF, RS, IL6RS, CCL2RS, SOCS3RS, CXCL3RS, JUNTF, RS, EDN1RS, CXCL2RS, JUNBTF,RS | 0.34 | 0.0000 | CXCL1RS, IL6L, TNFL, CXCL2RS |
| Toll-like receptor signaling pathway | 4.26 | 0.0389 | FOSTF, IL6RS, JUNTF, IL12ARS | 0.25 | 0.0023 | IL6RS, TNFRS, CXCL8RS |
| Wnt signaling pathway | 4.26 | 0.0739 | DKK1TI, JUNTF, BAMBITI, MYCTF | |||
Empty cells indicate no pathway enrichment for the cell type. Only relevant pathways for S. oralis cell response were included in the table (see Table S7). Role of genes in respective pathway is depicted by: L = ligand; RS = response to pathway activation; TI = transducer for inhibition; TA = transducer for activation; TF = transcription factor; RC = receptor. % = is calculated by the number of involved genes from the total number of human genes. p = is calculated from the number of genes present in each pathway in relation to the number of all regulated genes, which were submitted to DAVID.
© 2020 by the authors. Licensee MDPI, Basel, Switzerland. This article is an open access article distributed under the terms and conditions of the Creative Commons Attribution (CC BY) license (http://creativecommons.org/licenses/by/4.0/).
Share and Cite
MDPI and ACS Style
Ingendoh-Tsakmakidis, A.; Eberhard, J.; Falk, C.S.; Stiesch, M.; Winkel, A. In Vitro Effects of Streptococcus oralis Biofilm on Peri-Implant Soft Tissue Cells. Cells 2020, 9, 1226. https://0-doi-org.brum.beds.ac.uk/10.3390/cells9051226
AMA Style
Ingendoh-Tsakmakidis A, Eberhard J, Falk CS, Stiesch M, Winkel A. In Vitro Effects of Streptococcus oralis Biofilm on Peri-Implant Soft Tissue Cells. Cells. 2020; 9(5):1226. https://0-doi-org.brum.beds.ac.uk/10.3390/cells9051226
Chicago/Turabian StyleIngendoh-Tsakmakidis, Alexandra, Jörg Eberhard, Christine S. Falk, Meike Stiesch, and Andreas Winkel. 2020. "In Vitro Effects of Streptococcus oralis Biofilm on Peri-Implant Soft Tissue Cells" Cells 9, no. 5: 1226. https://0-doi-org.brum.beds.ac.uk/10.3390/cells9051226
Note that from the first issue of 2016, this journal uses article numbers instead of page numbers. See further details here.