ROS Dependent Wnt/β-Catenin Pathway and Its Regulation on Defined Micro-Pillars—A Combined In Vitro and In Silico Study

 ,
,  ,
, 
Abstract
:
1. Introduction
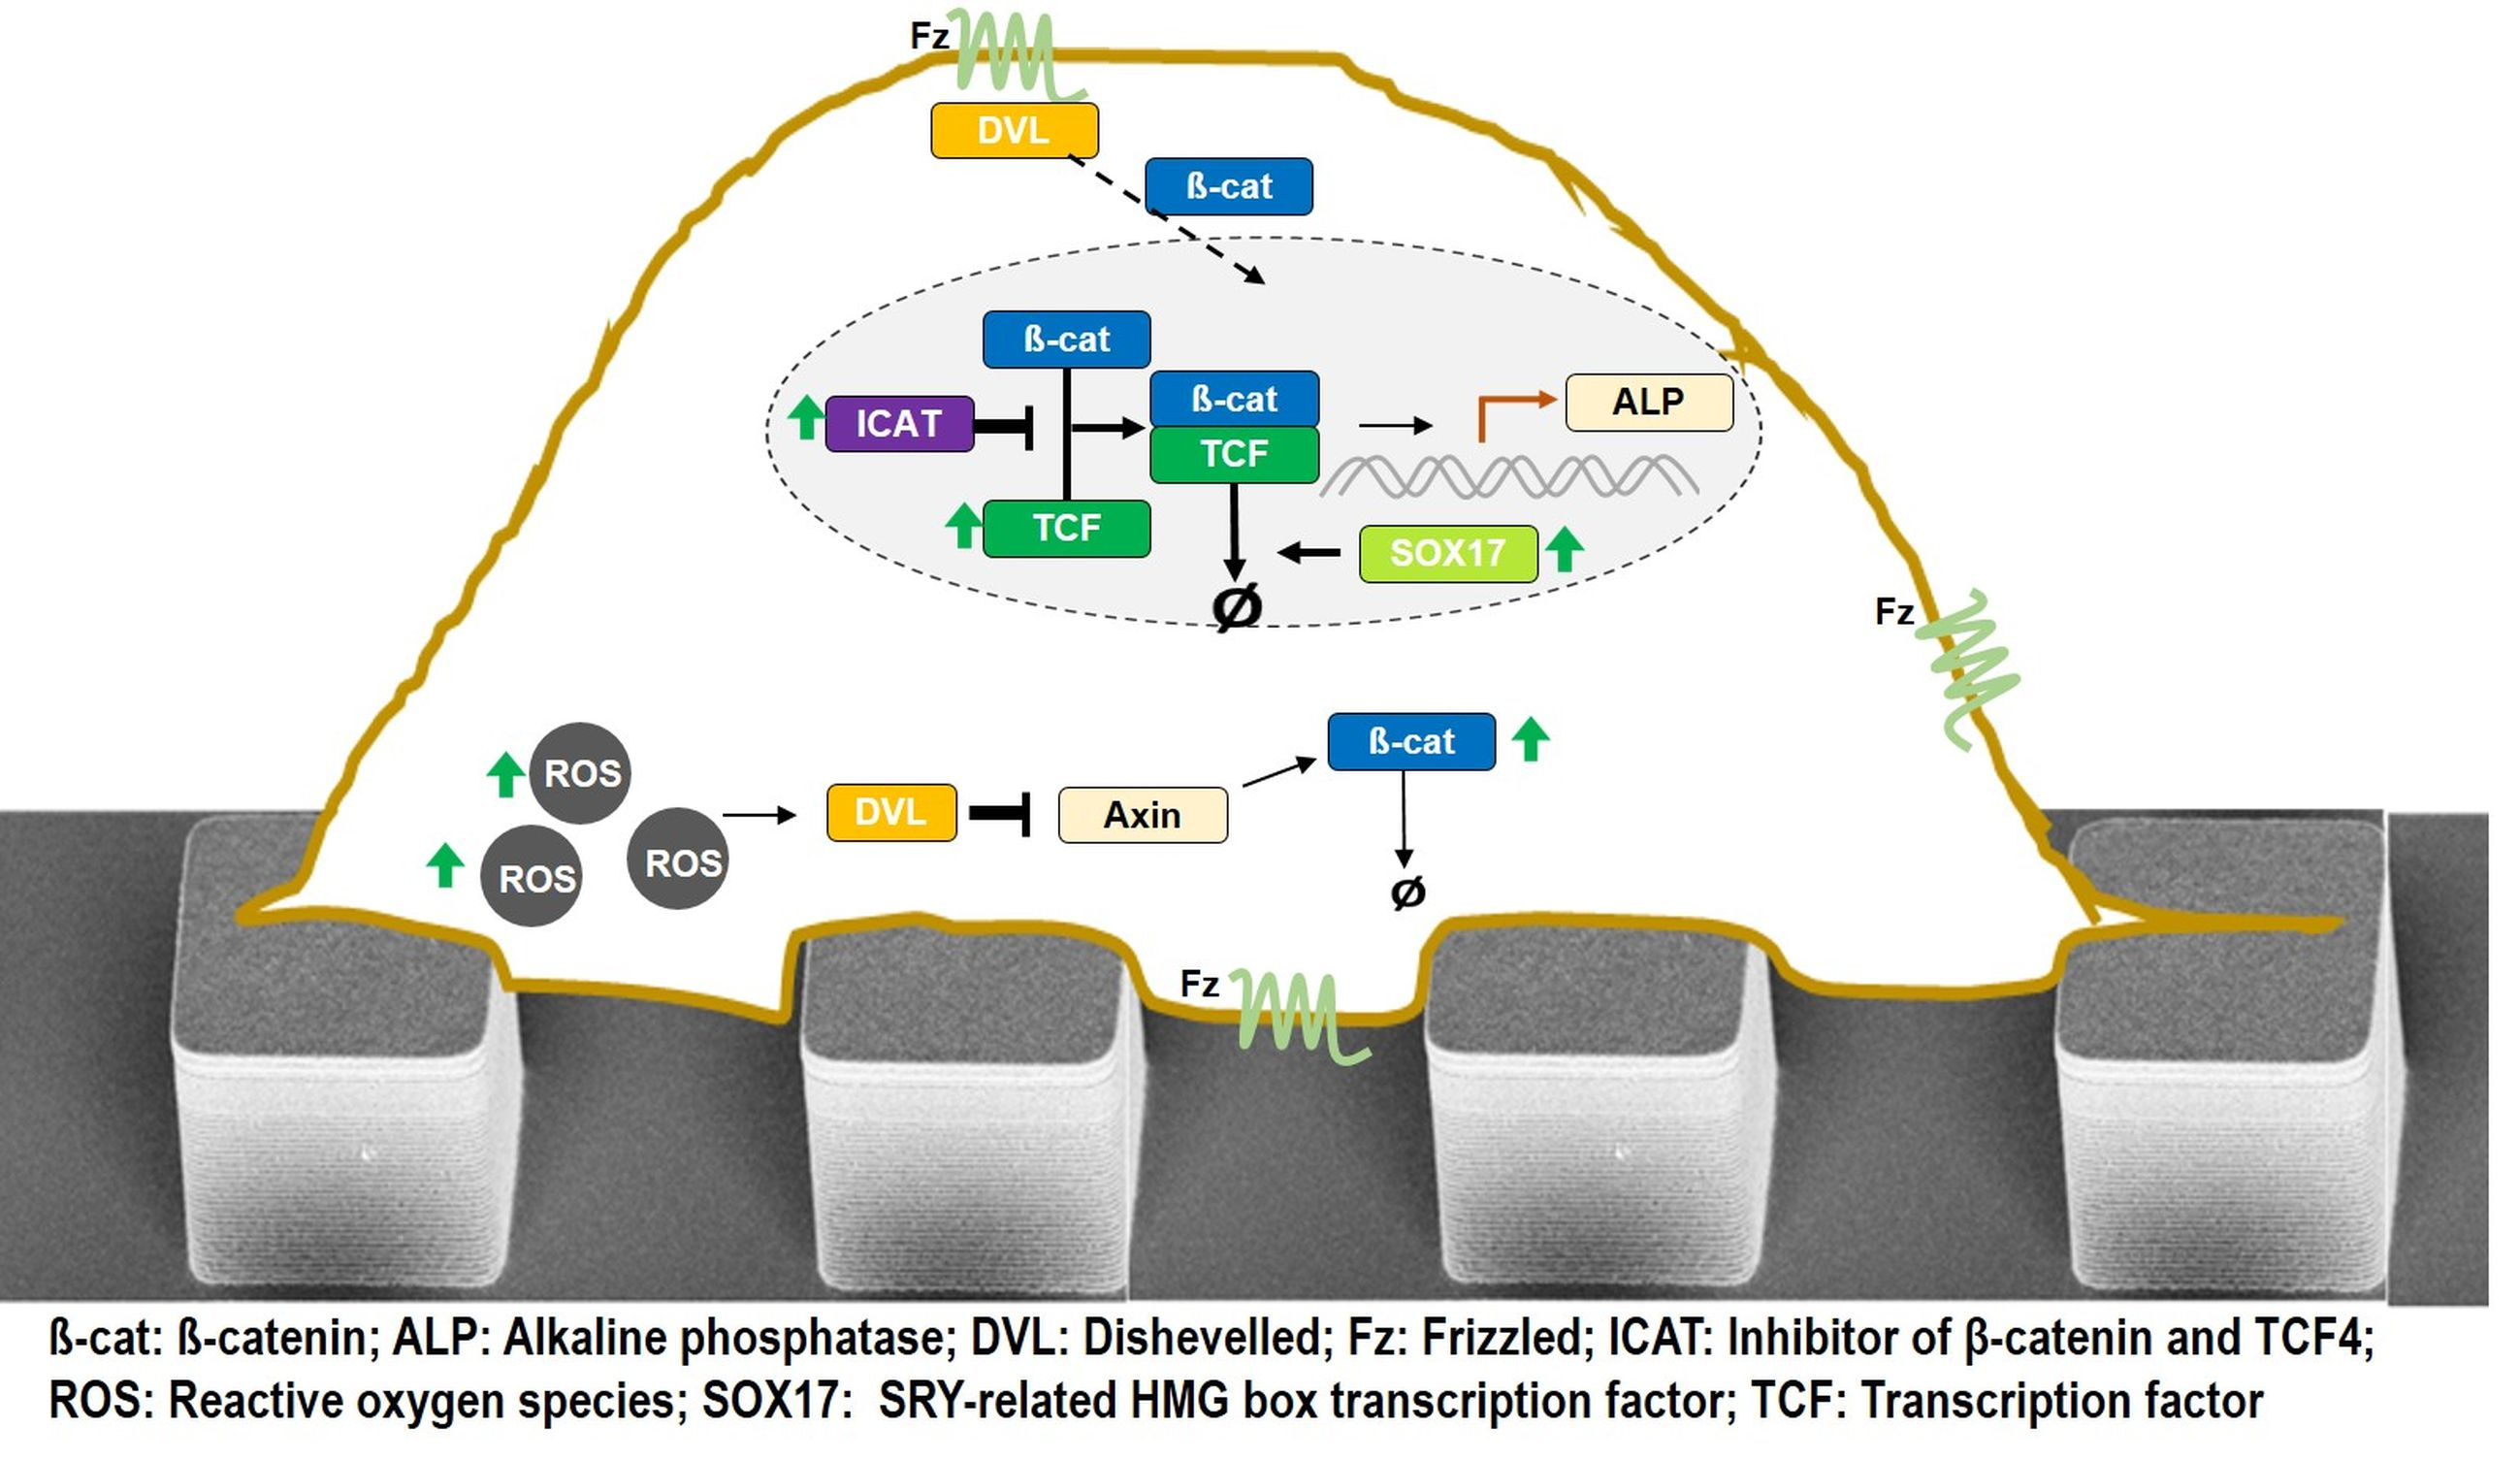
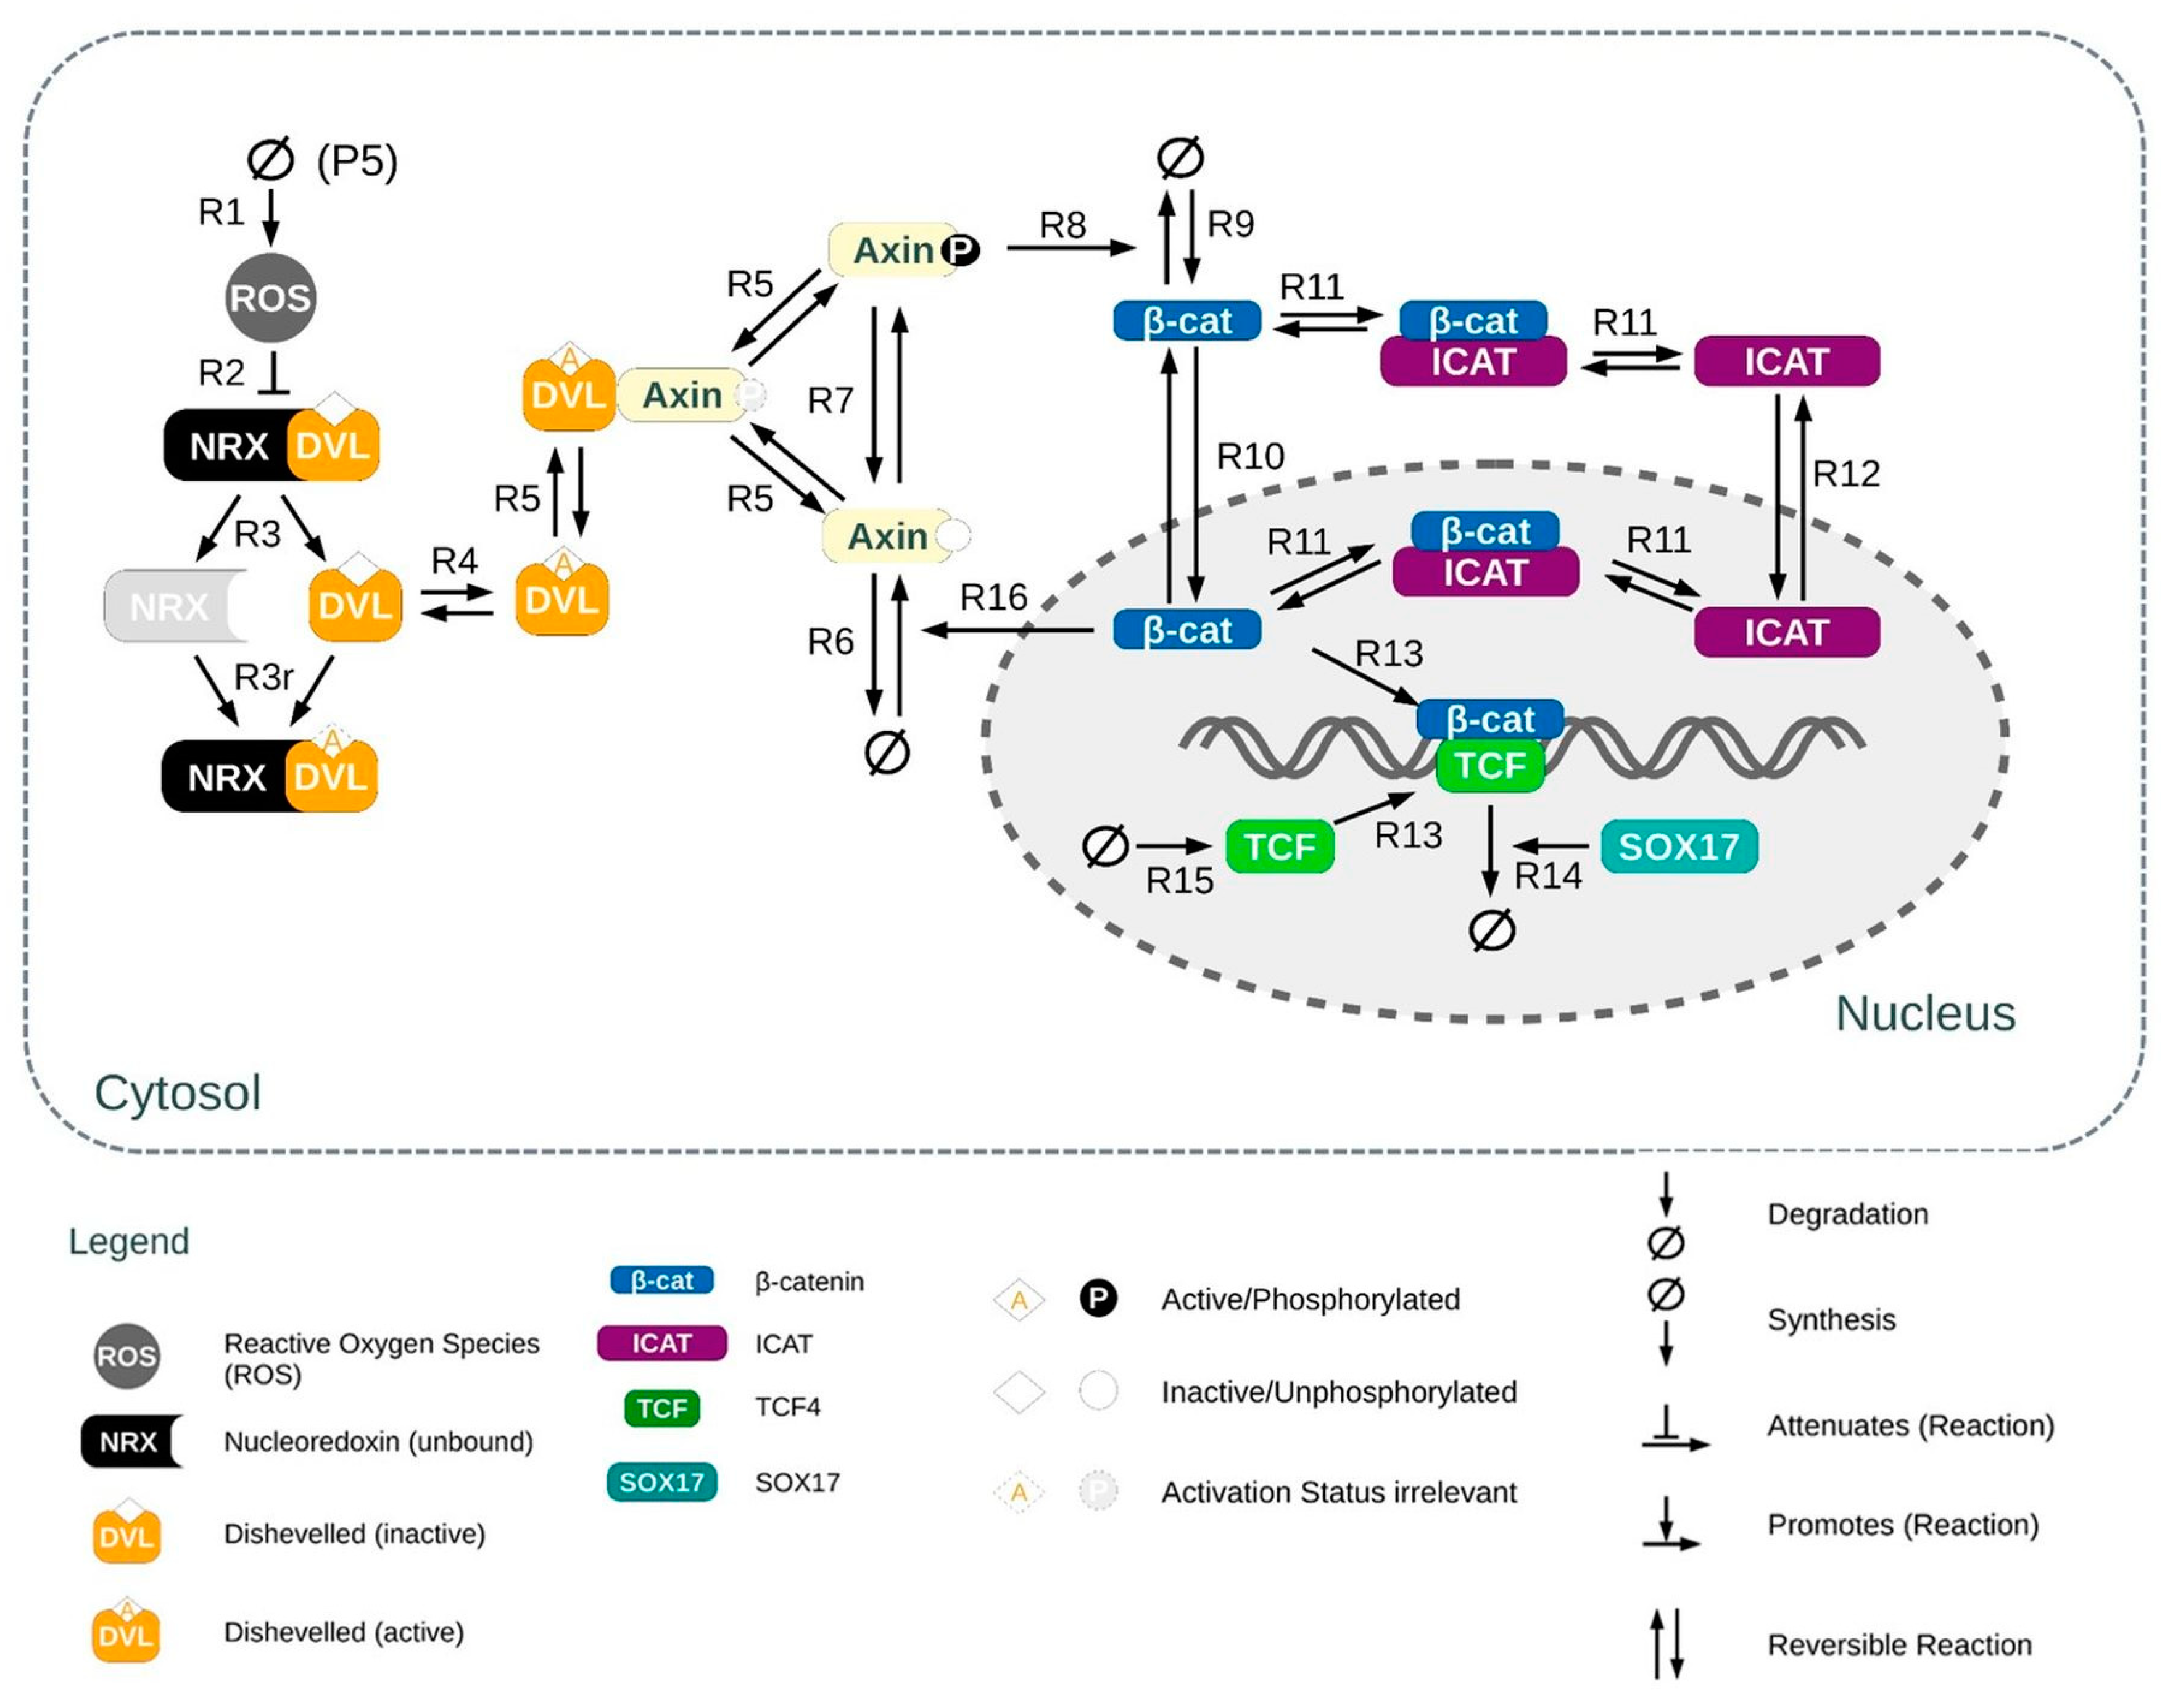
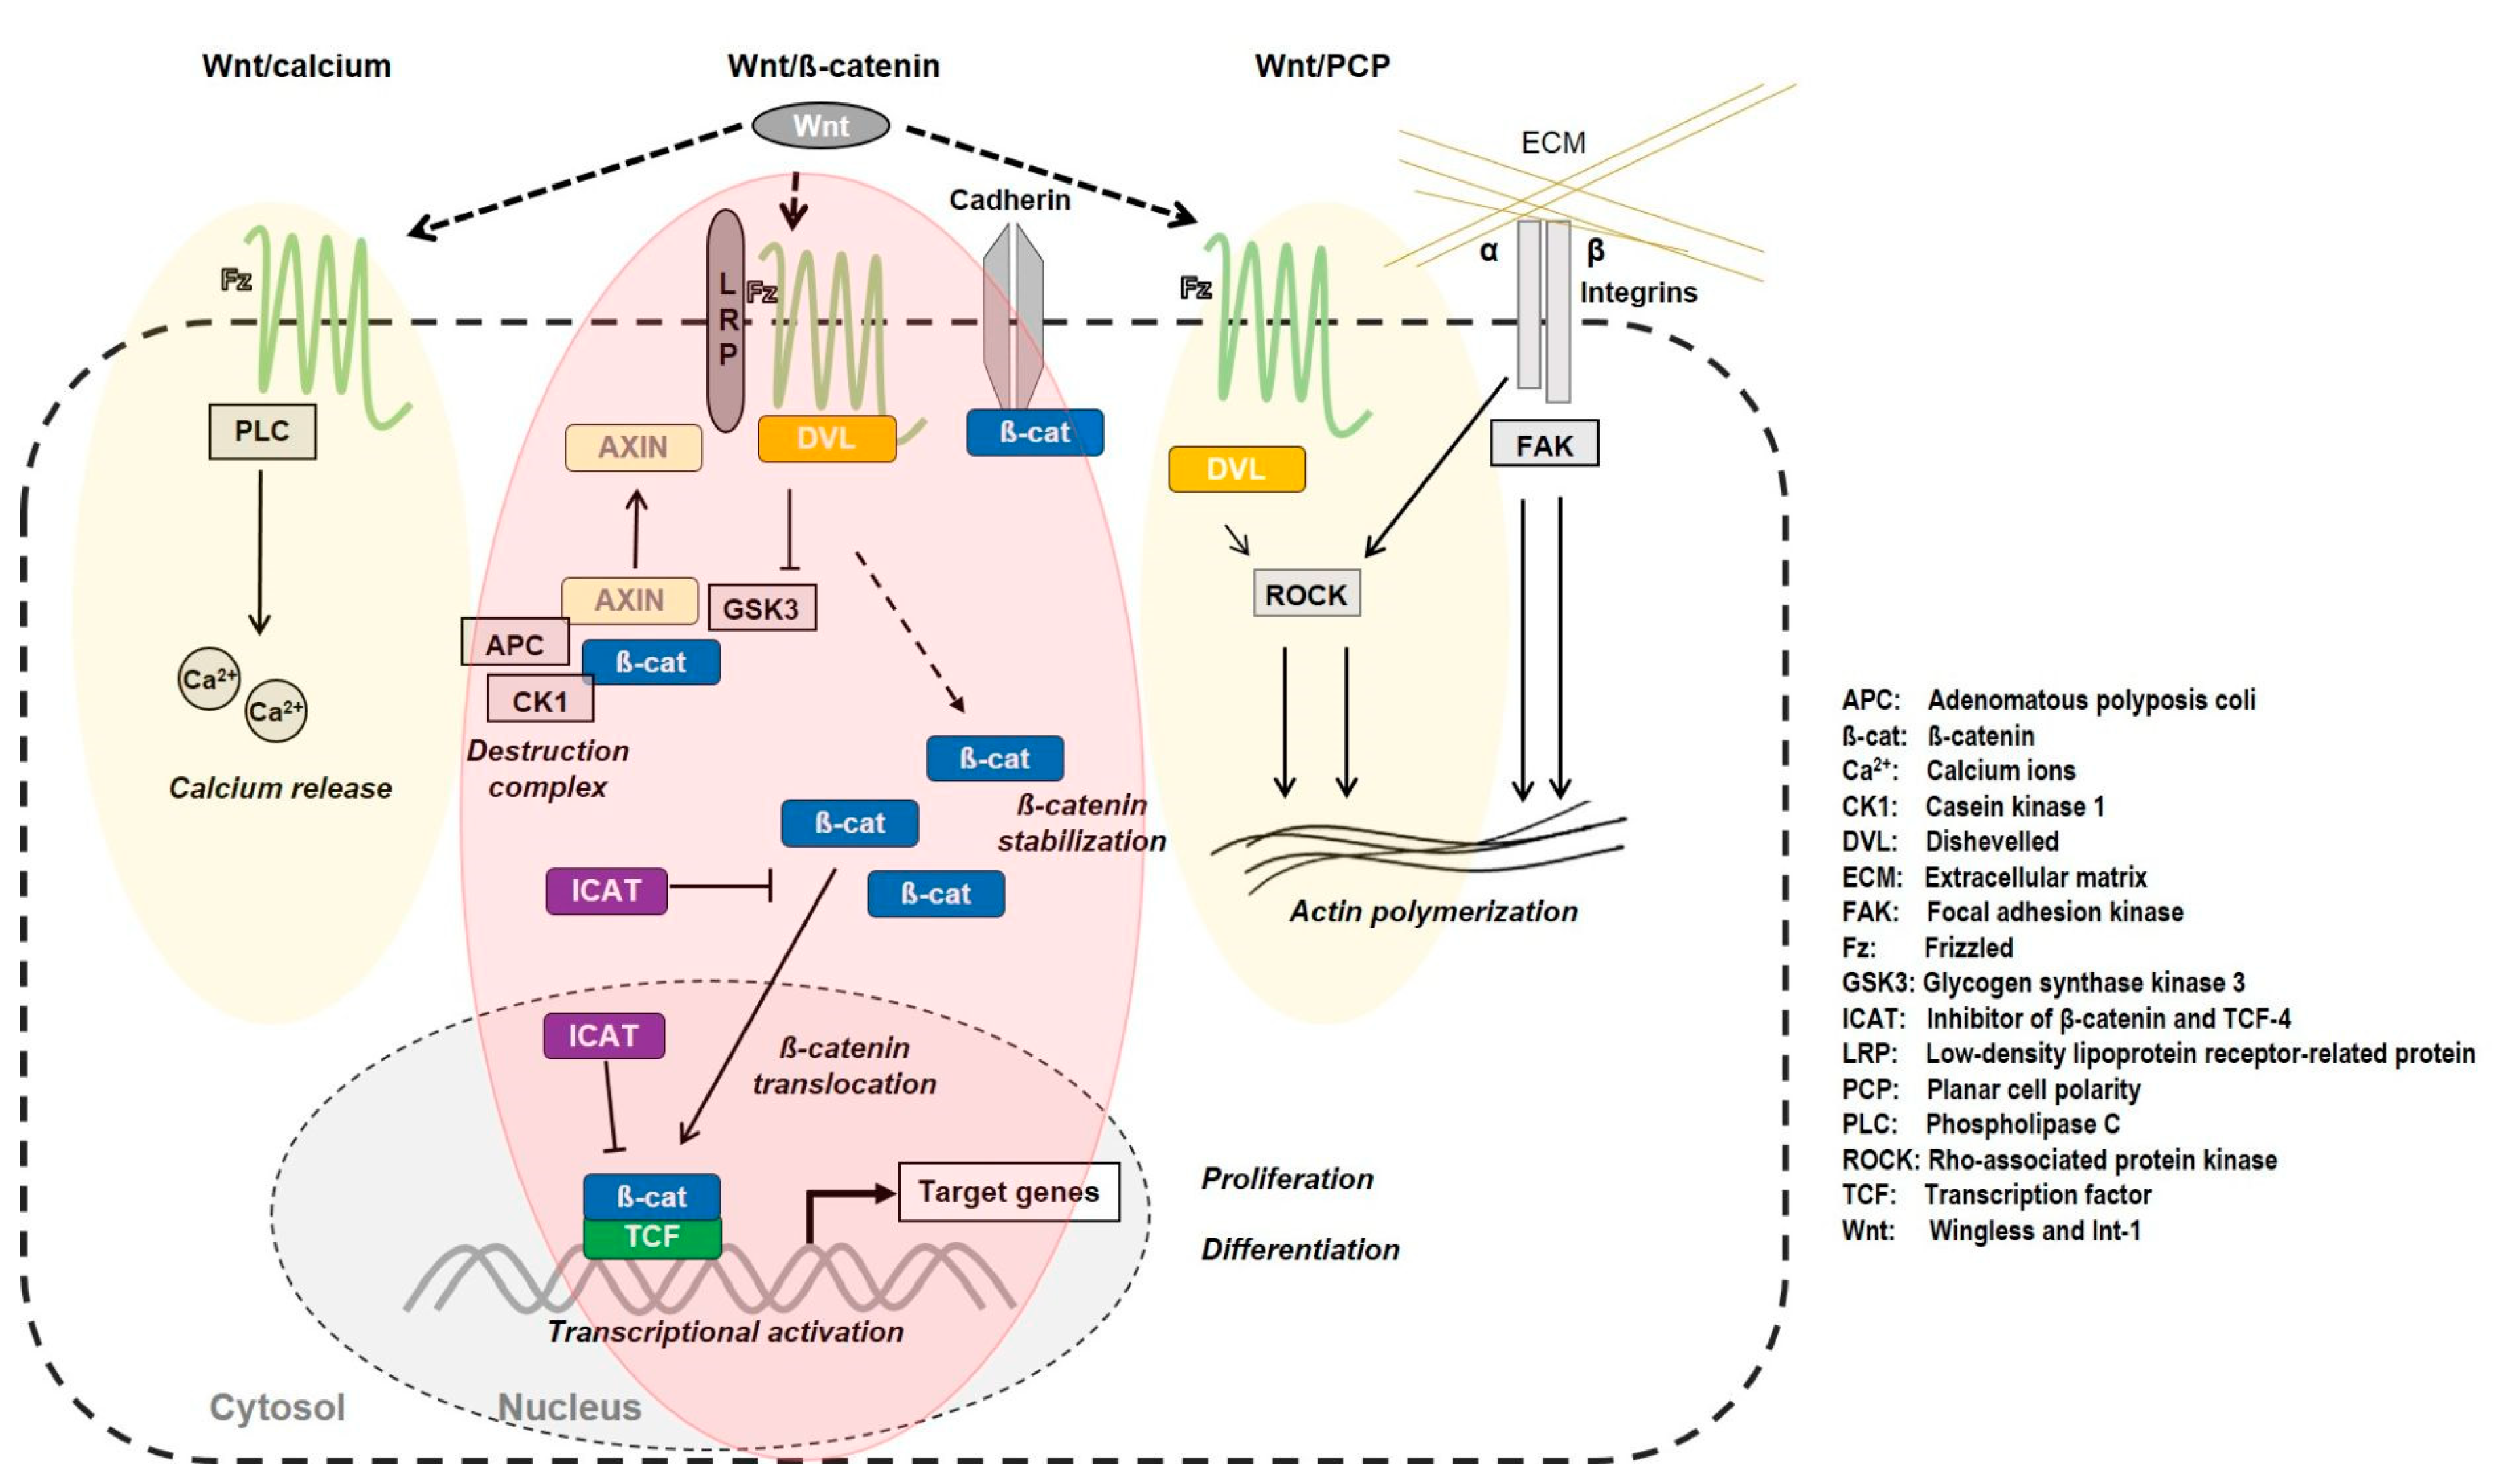
Wnt/β-Catenin Pathway
2. Materials and Methods
2.1. Titanium Samples—Micro-Pillars
2.2. Cell Culture and Subcellular Fractionation
2.3. Gene Expression Profiling
2.4. Immunofluorescence and Image Analysis
2.5. Flow Cytometry
2.6. Quantitative Western Blot Analysis
2.7. Bio-Plex Luminex Bead Multiplex Analysis
2.8. Enzyme-Linked Immunosorbent Assay (ELISA)
2.9. Detection of Reactive Oxygen Species (ROS) and Lipid Peroxidation
2.10. Statistics
2.11. In Silico Experiments: Modeling the Wnt/β-Catenin Pathway in Osteoblasts
3. Results
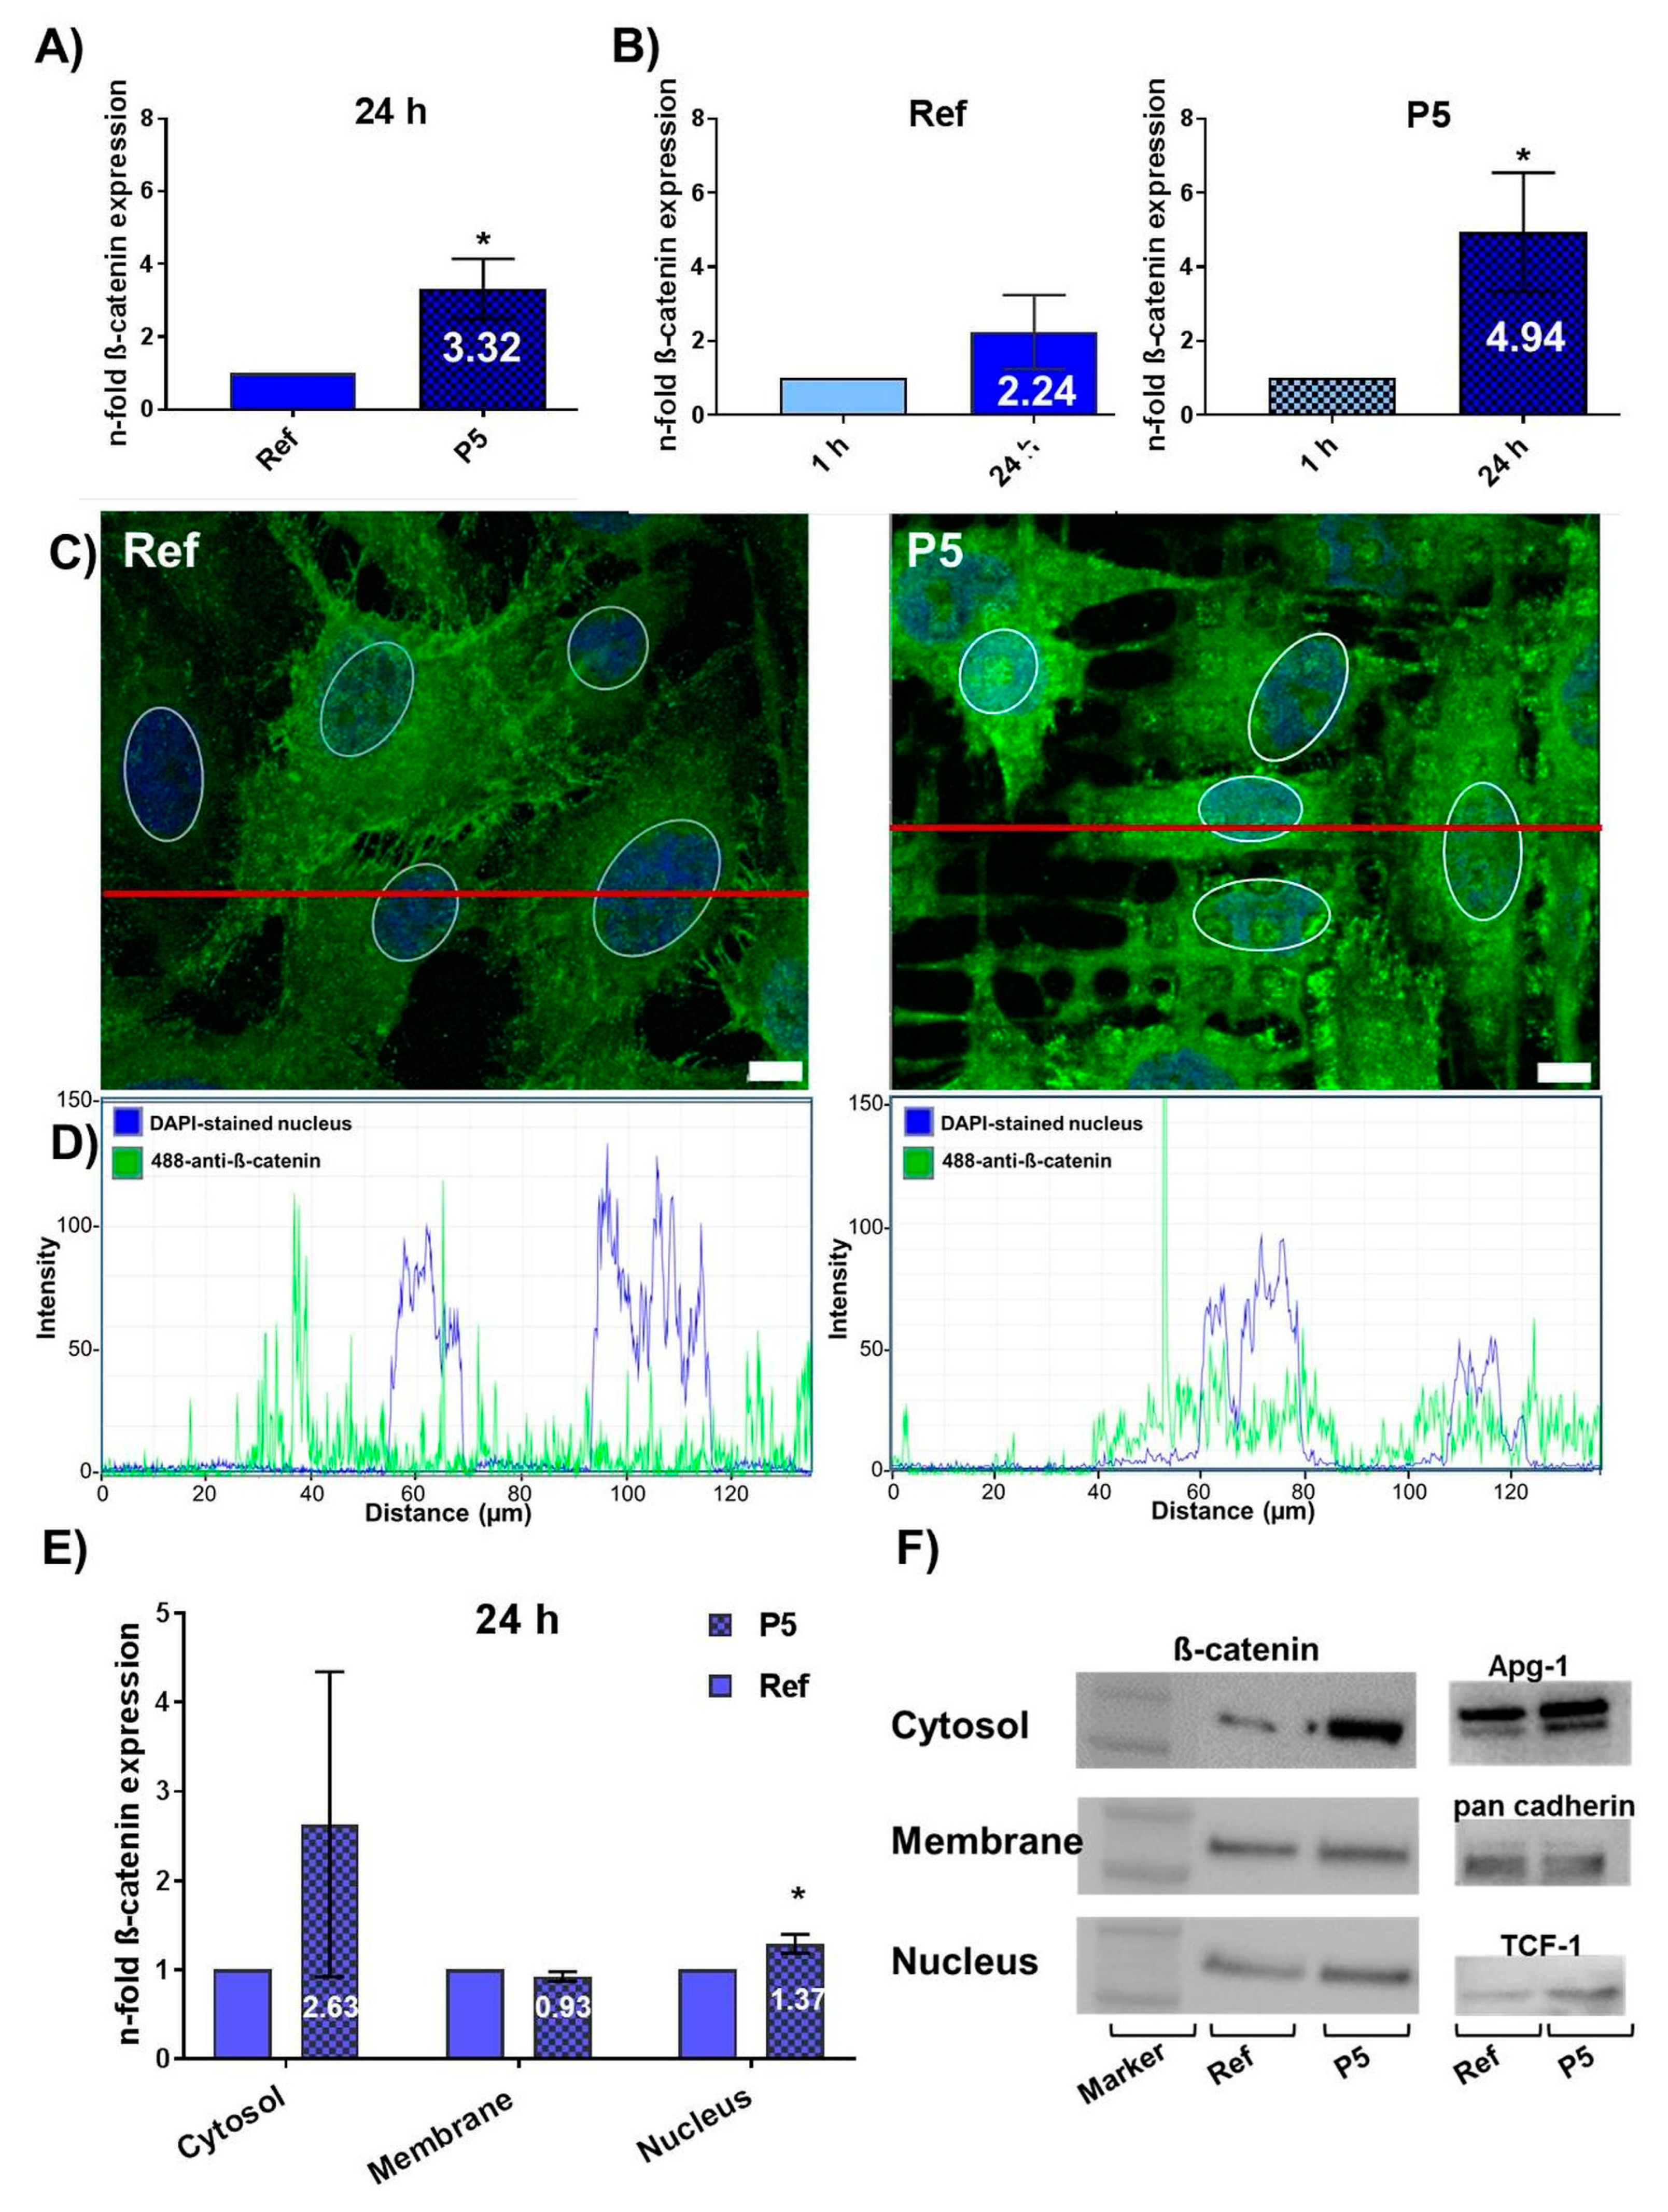
3.1. Topography-Dependent β-Catenin Accumulation and Translocation into the Nucleus
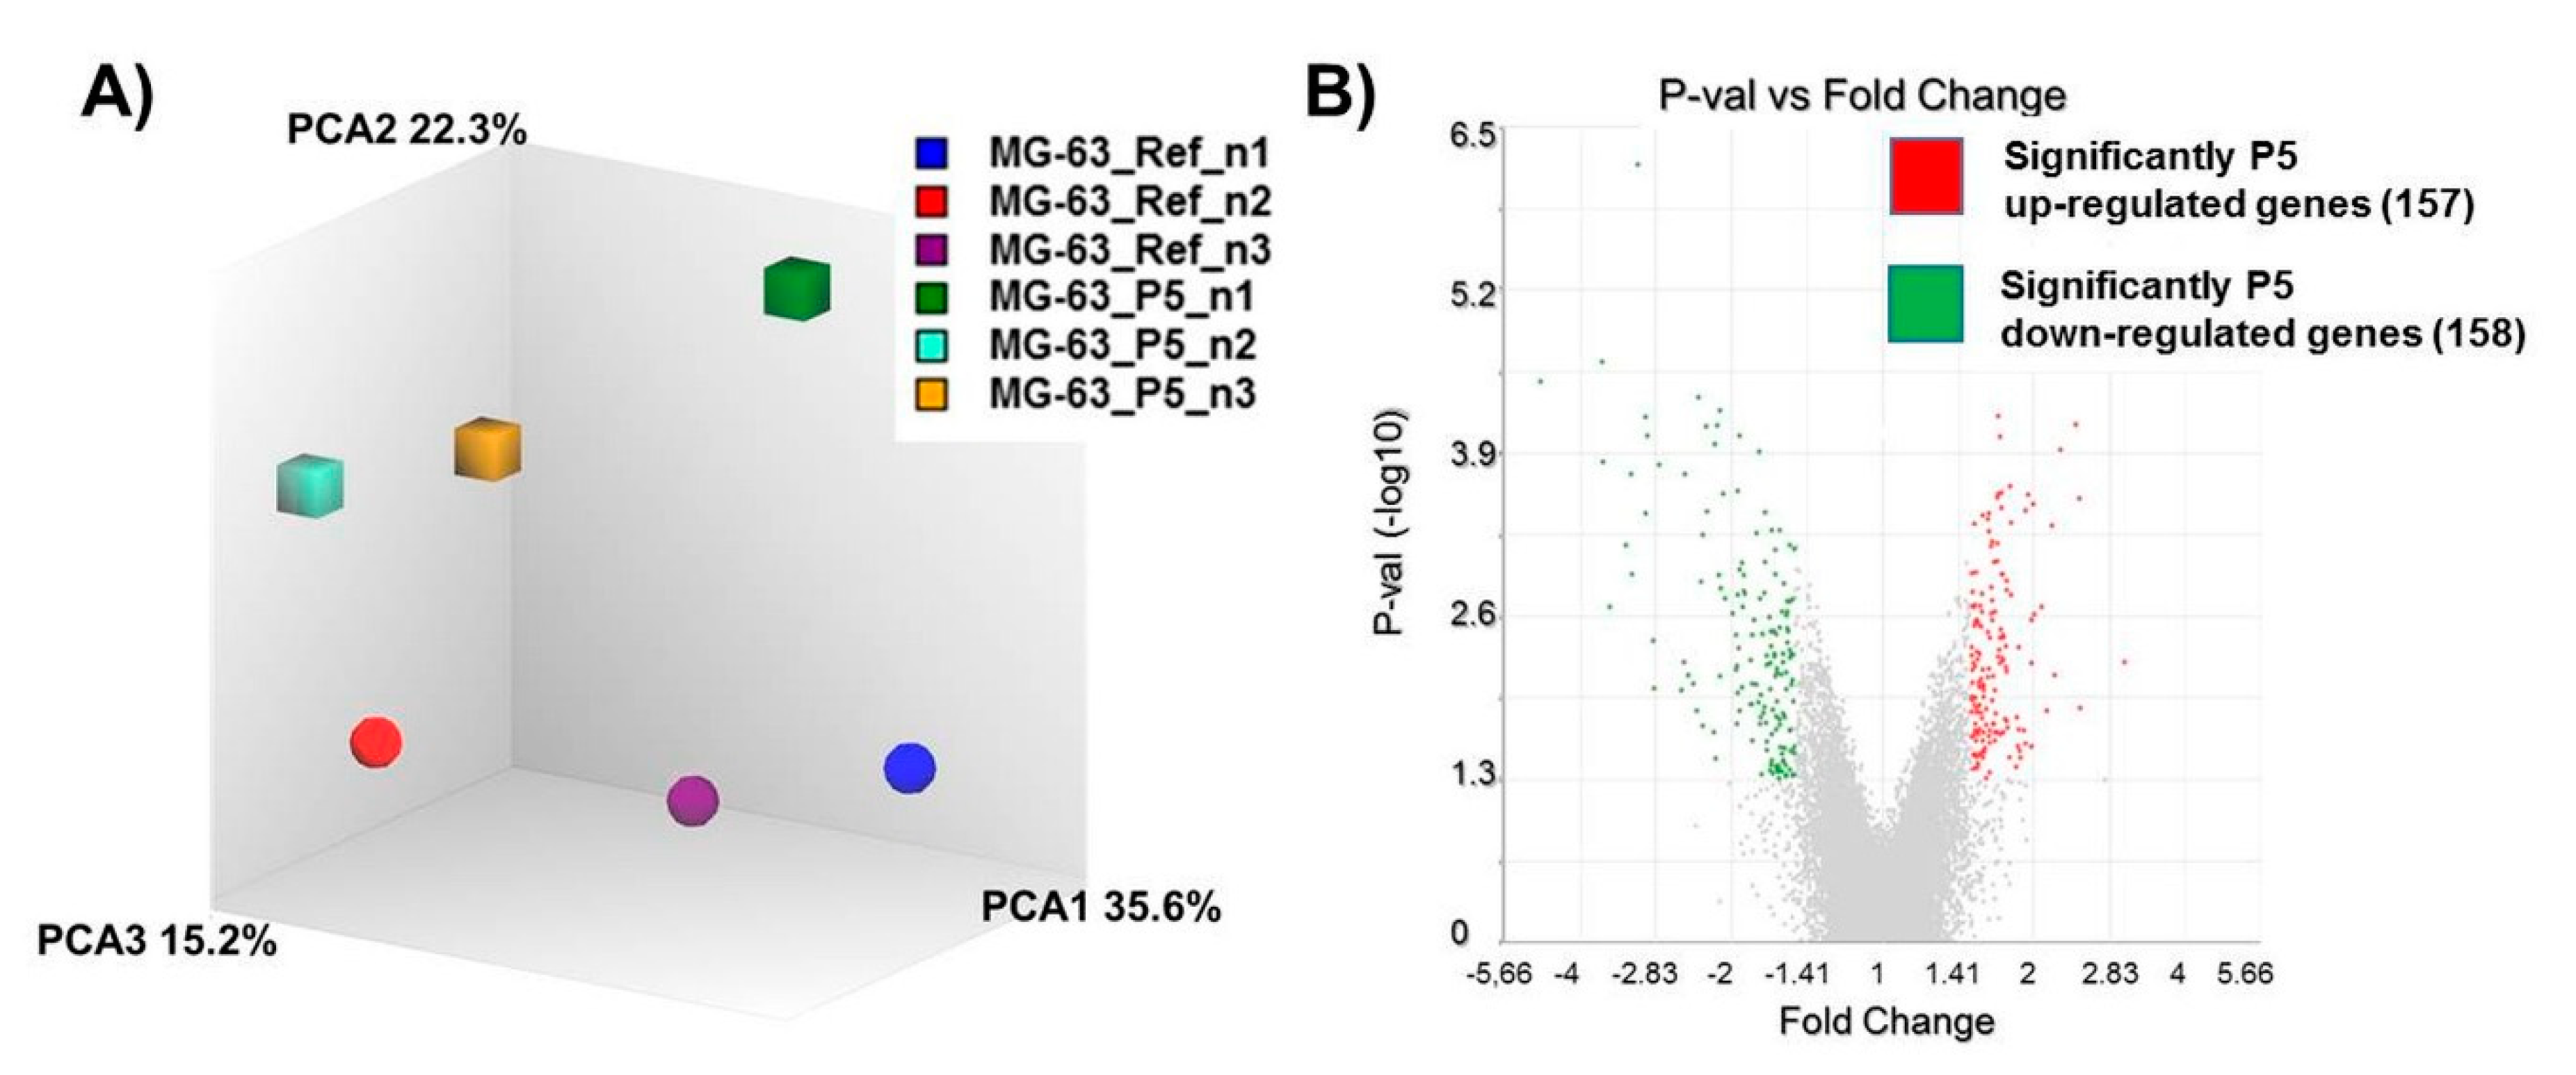
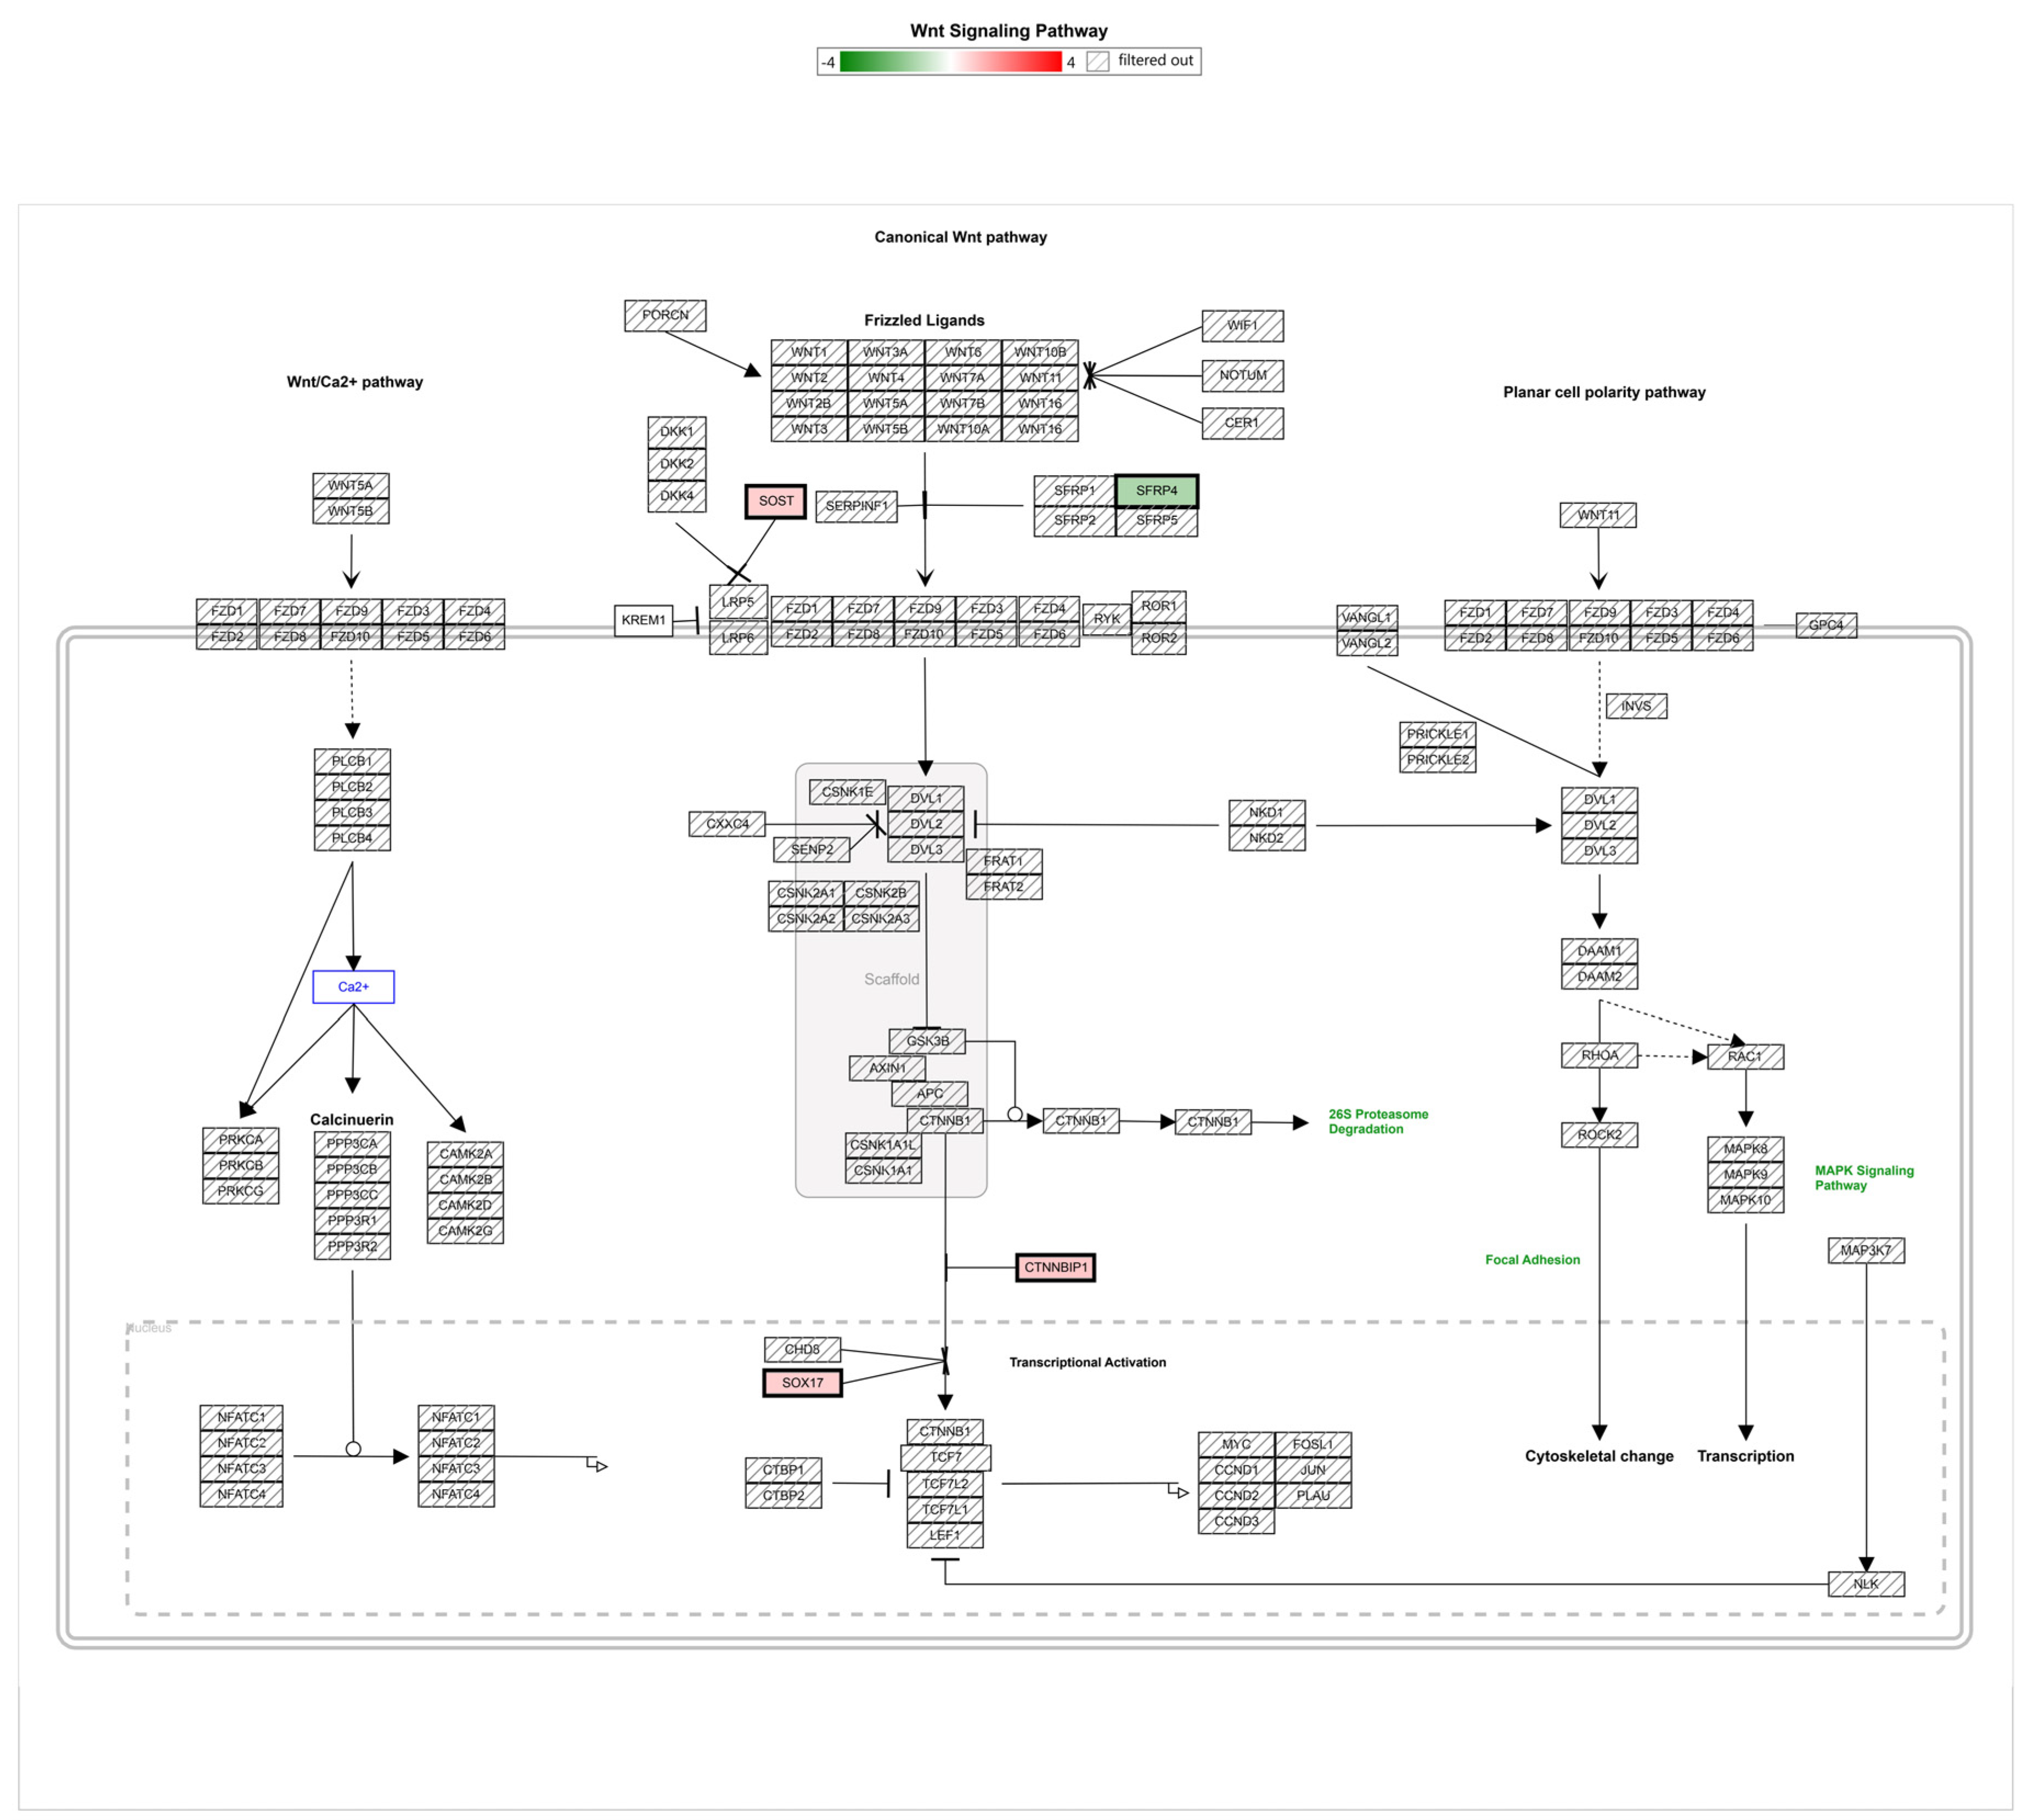
3.2. Gene Regulation of Wnt Signaling Components Dependent on Micro-Pillars
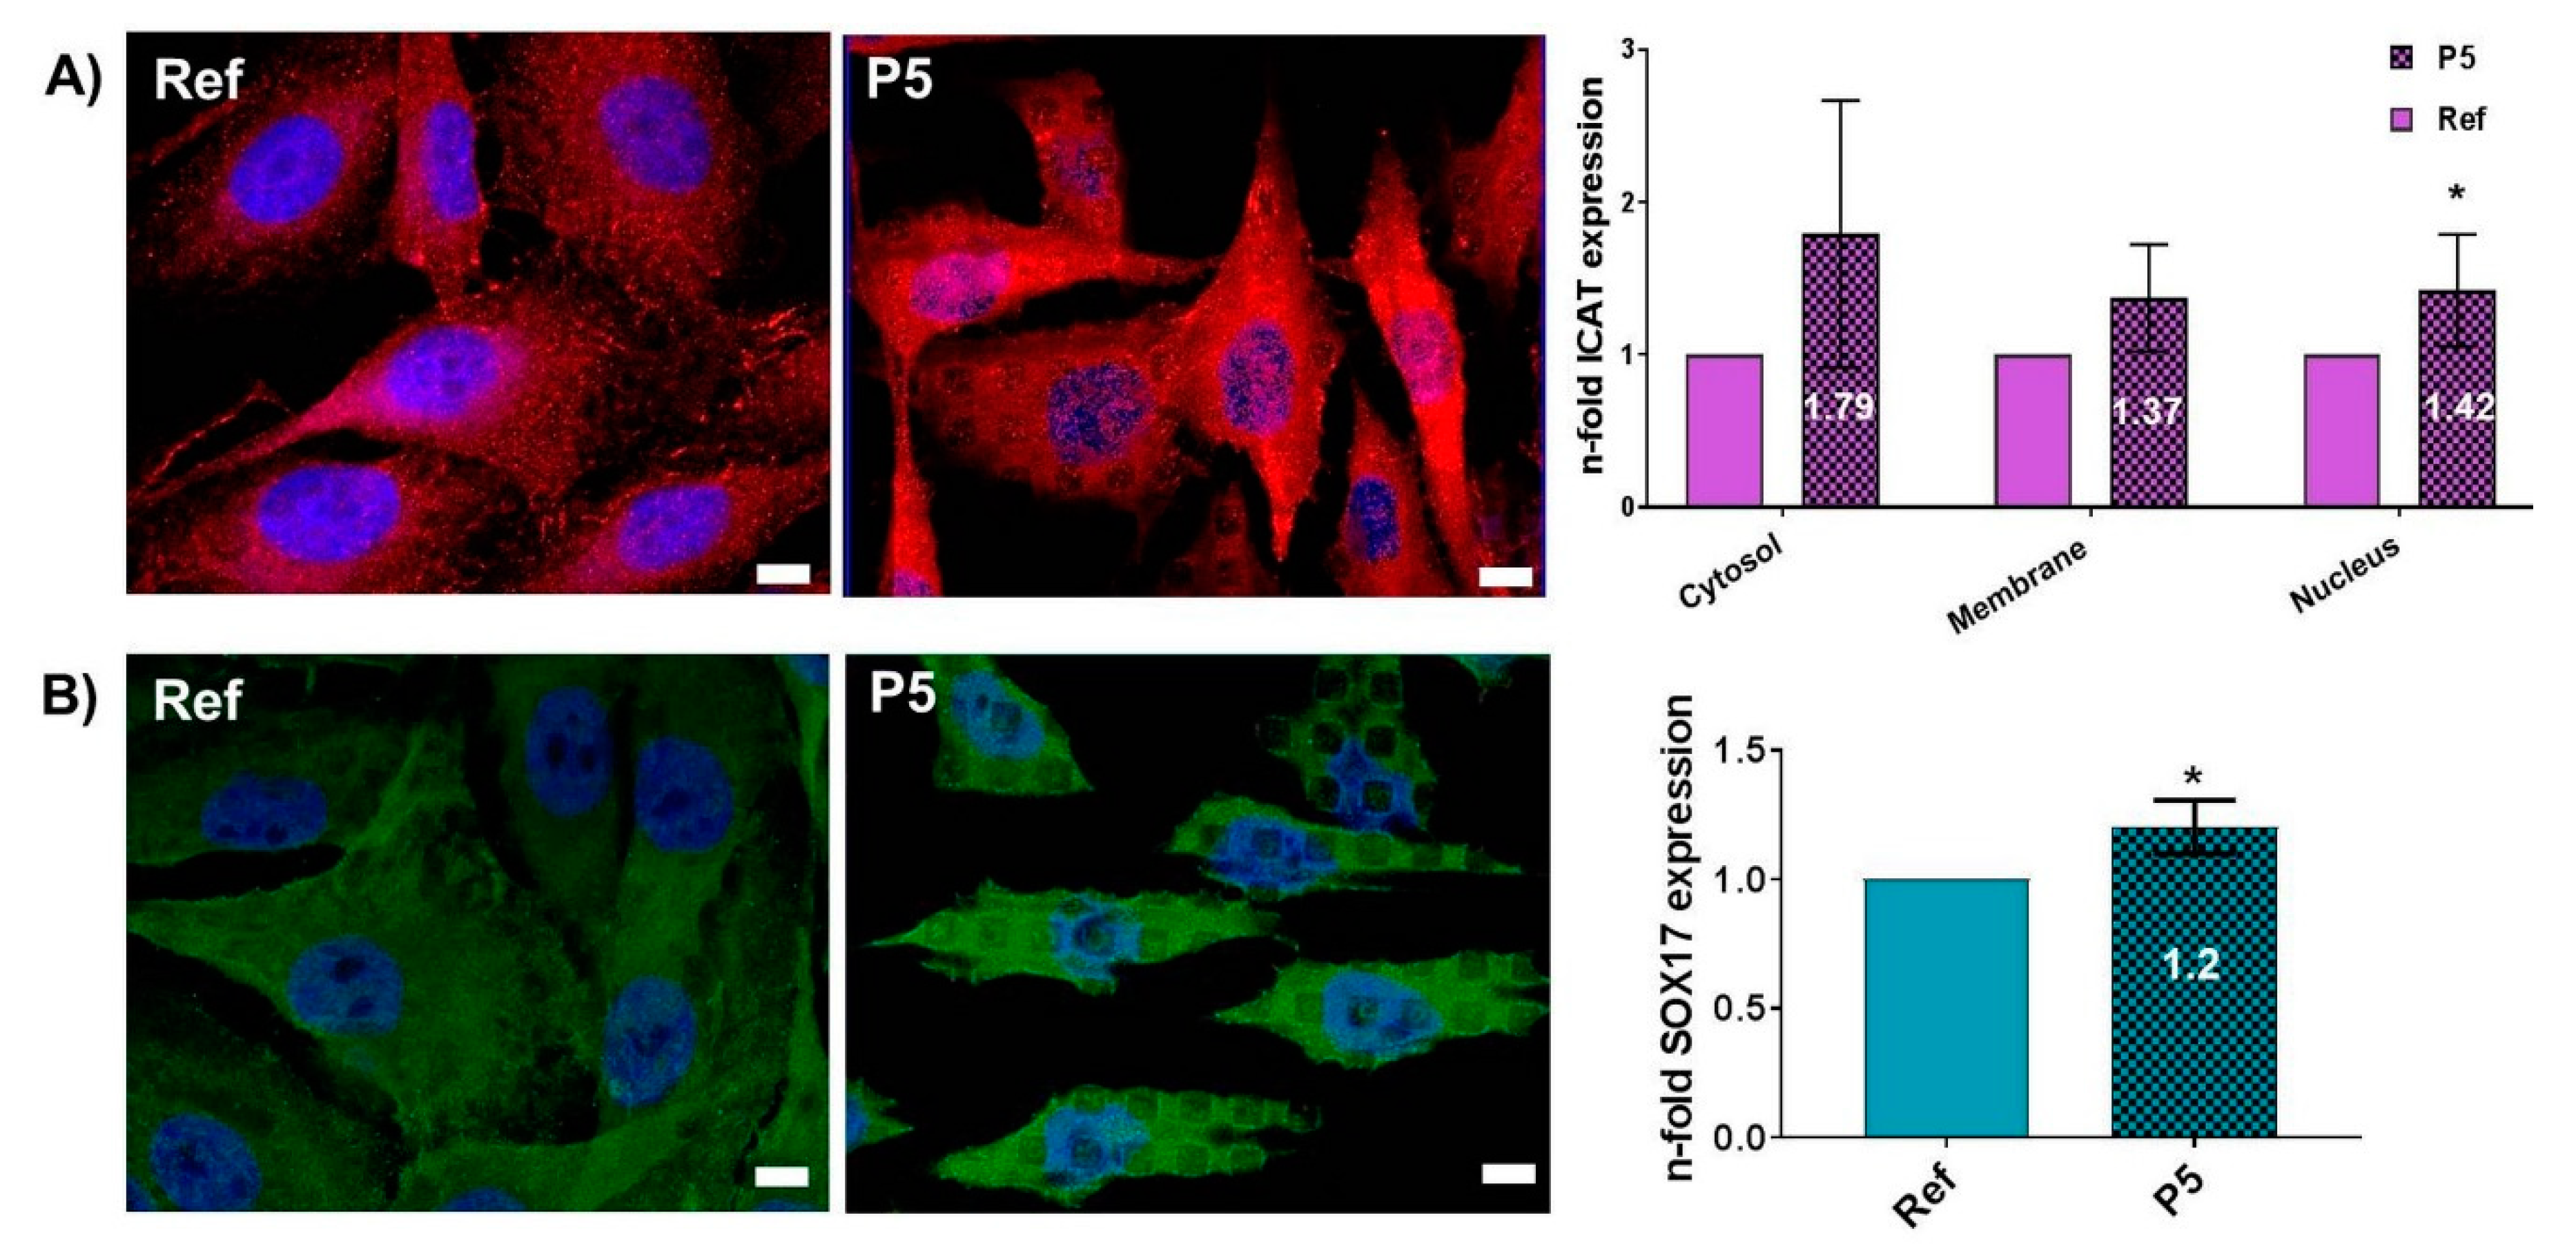
3.3. Topography-Dependent Protein Expression of β-Catenin Inhibitors ICAT and SOX17
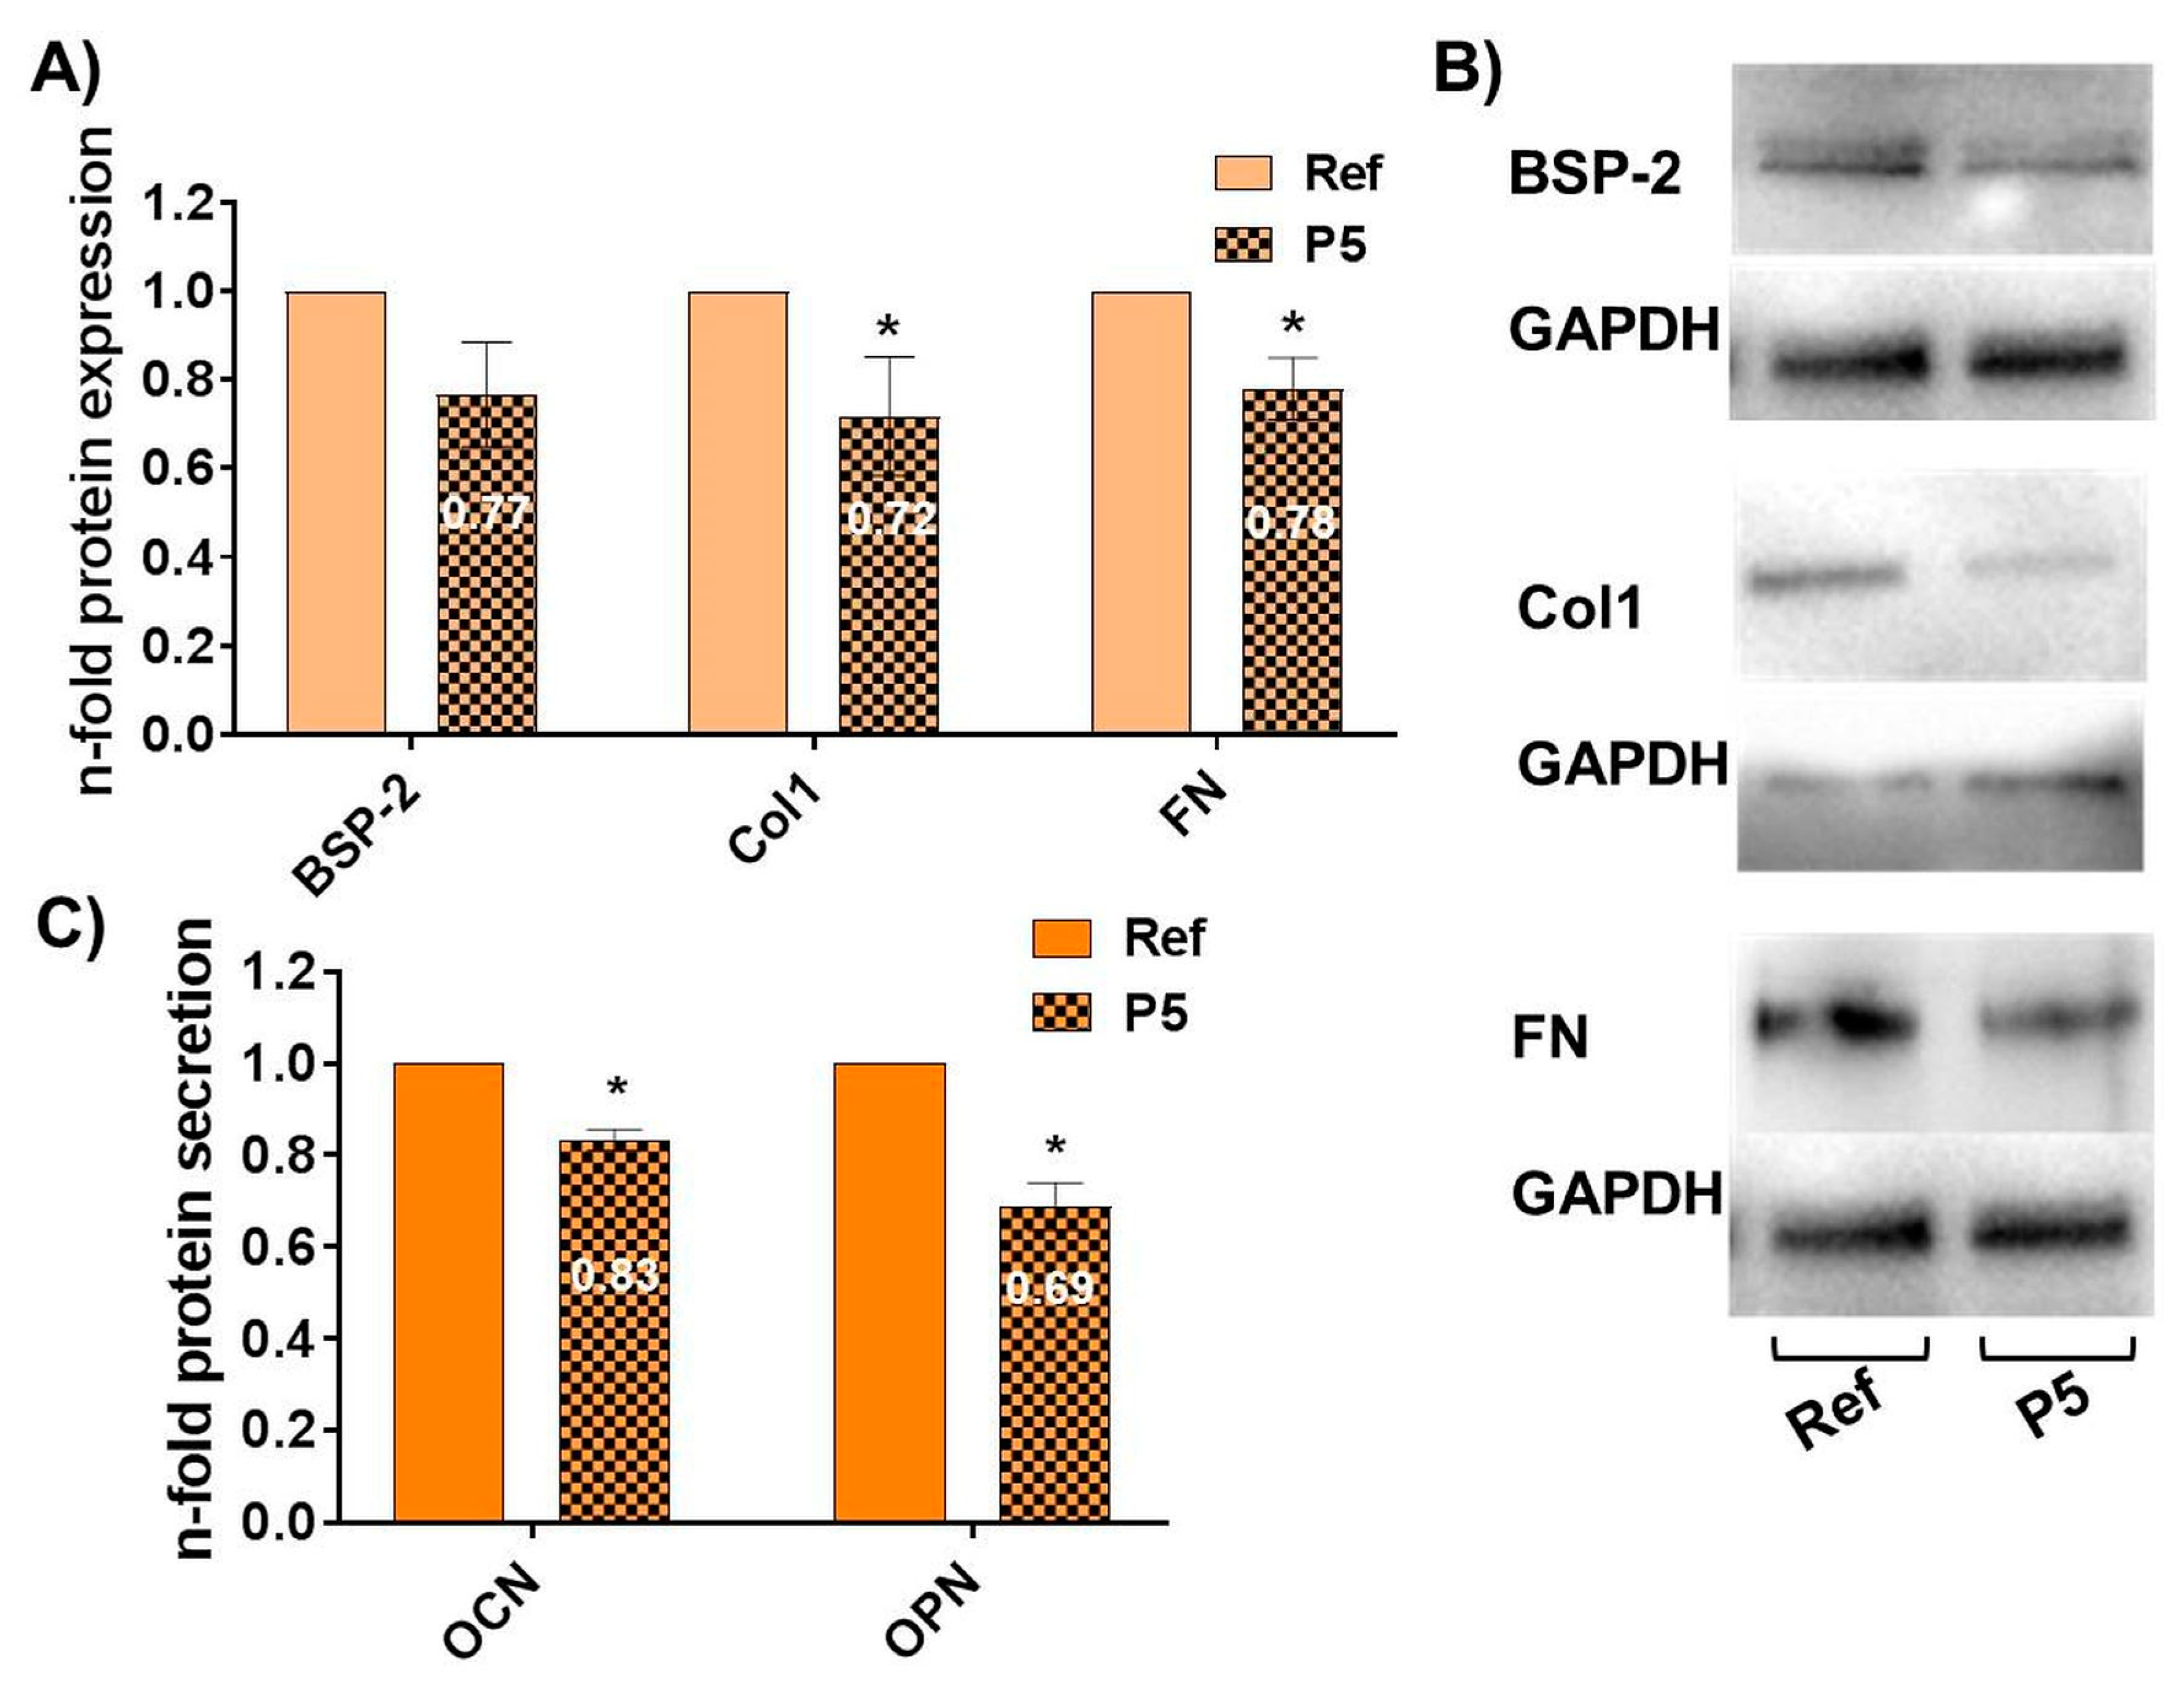
3.4. Topography-Dependent Reduction of the Osteoblast-Specific Function after 96 h
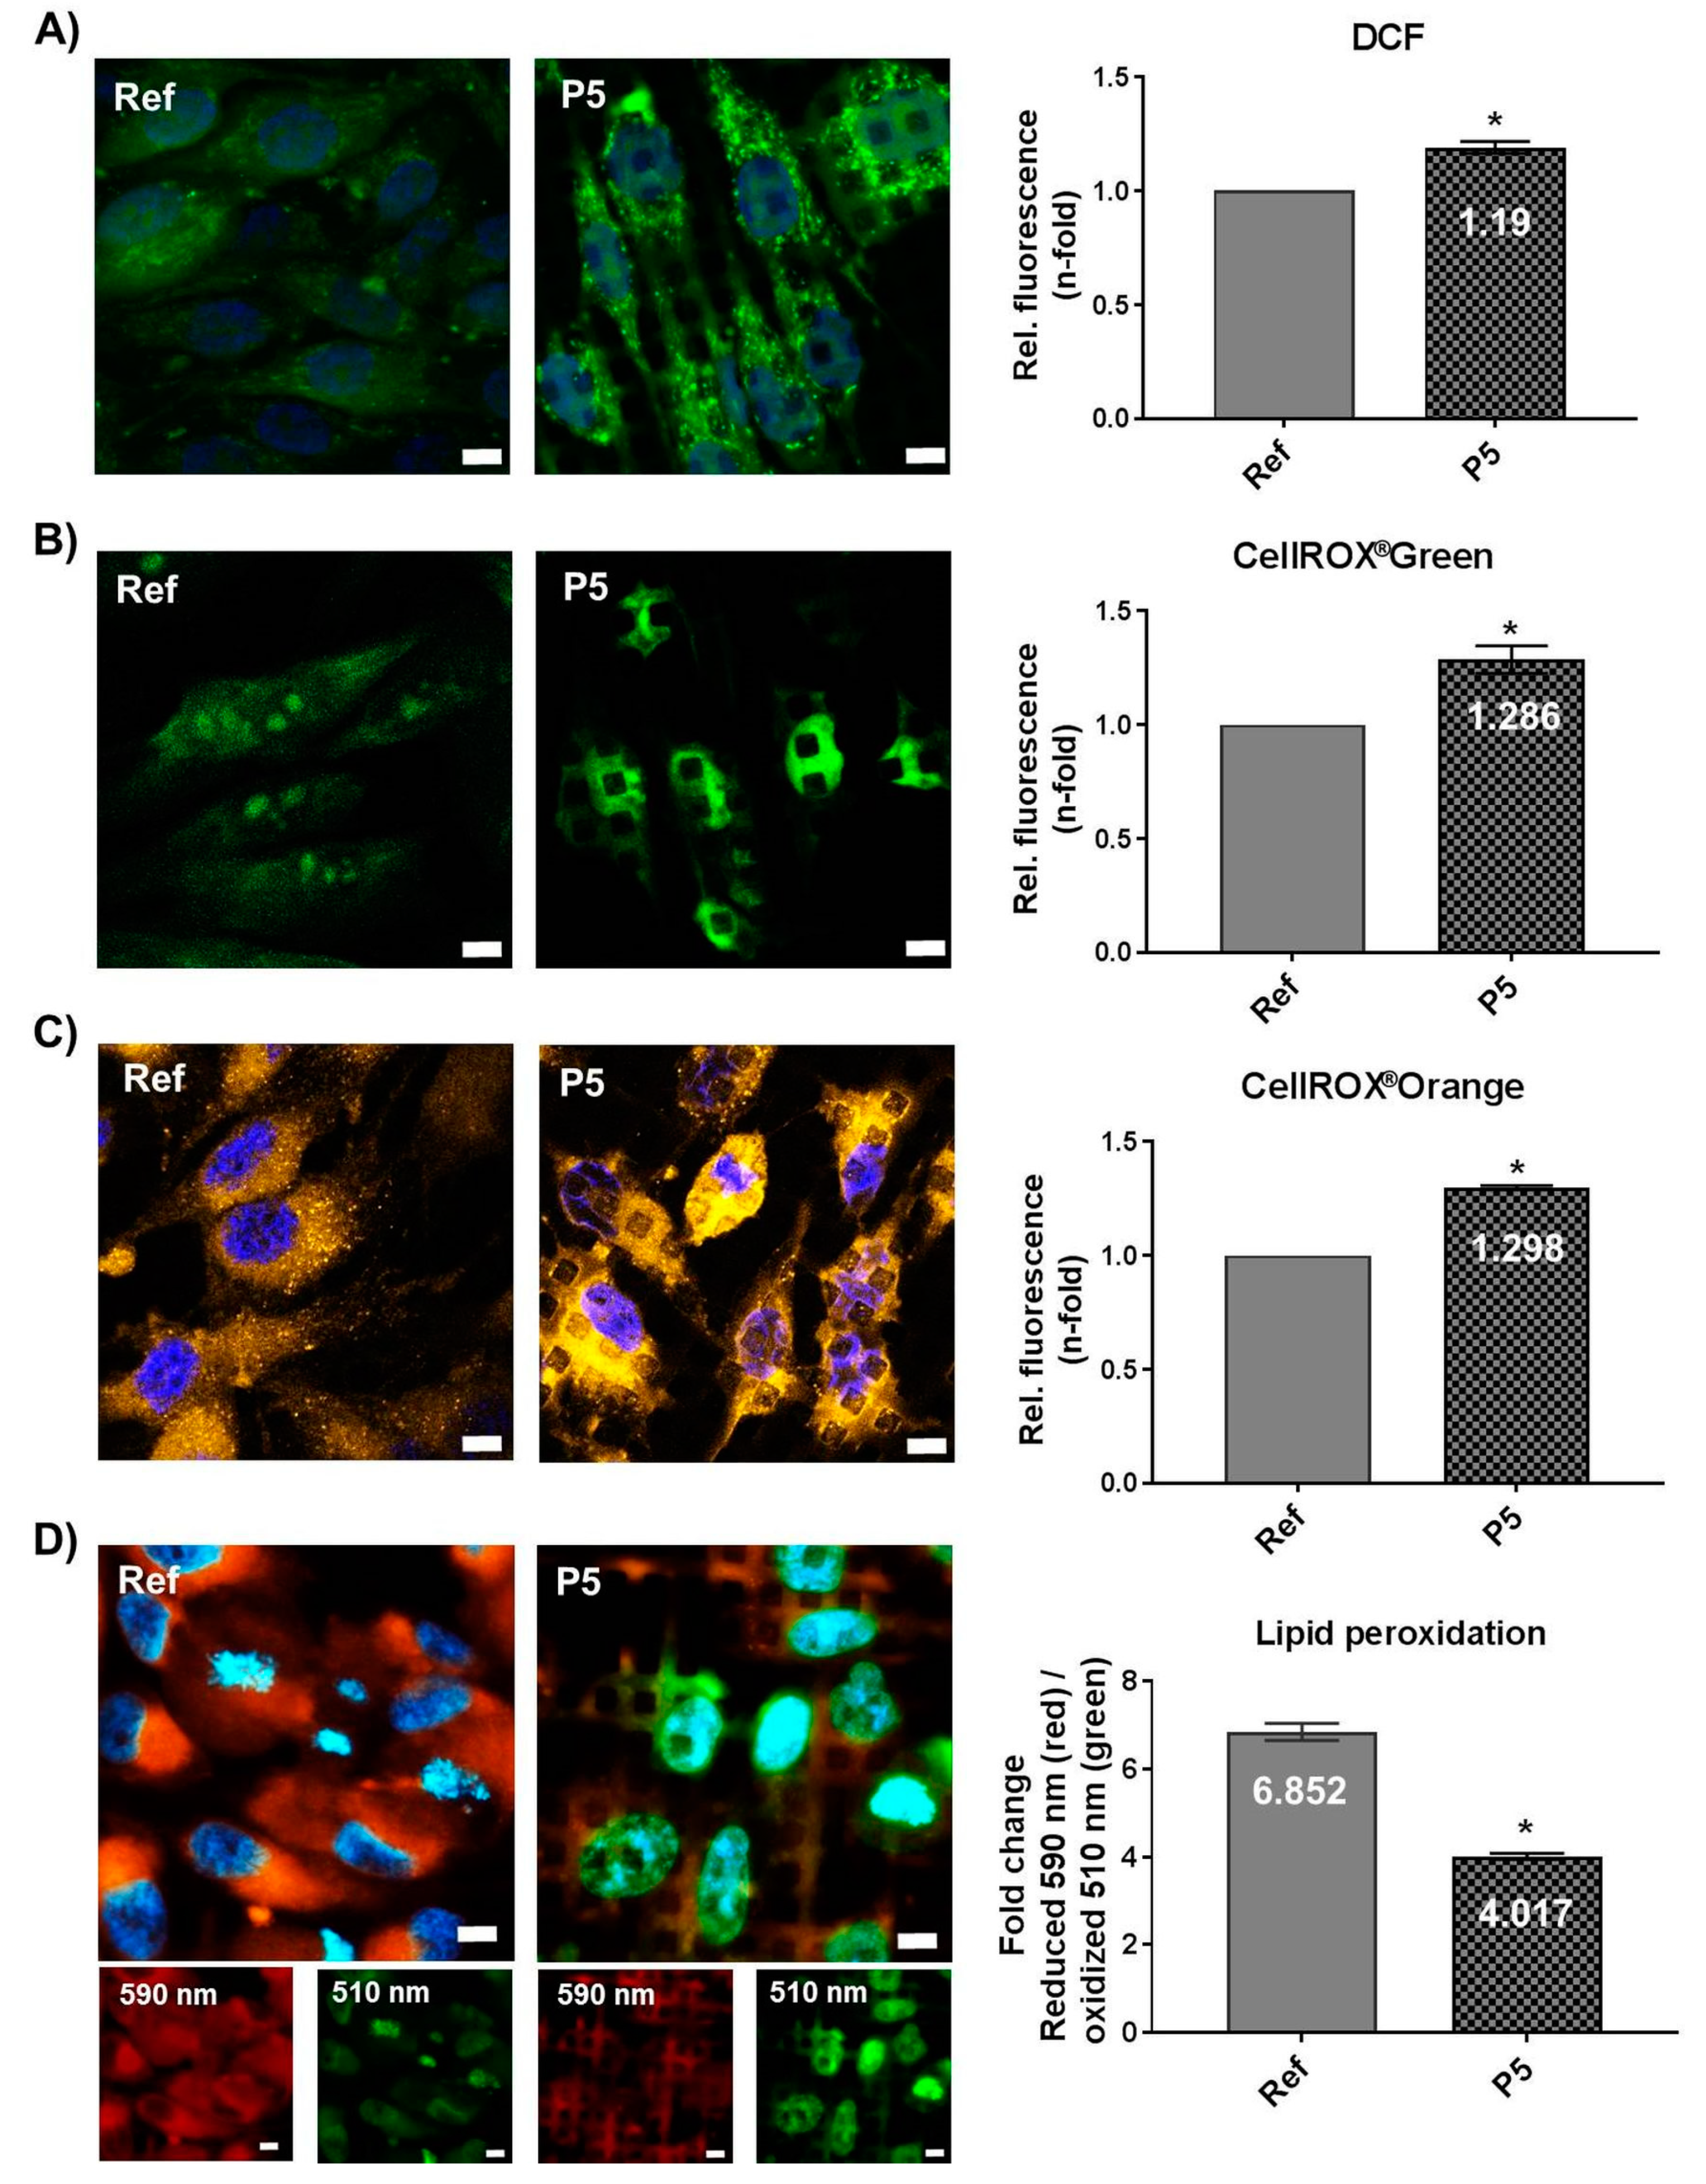
3.5. Micro-Pillars Induce Oxidative Stress
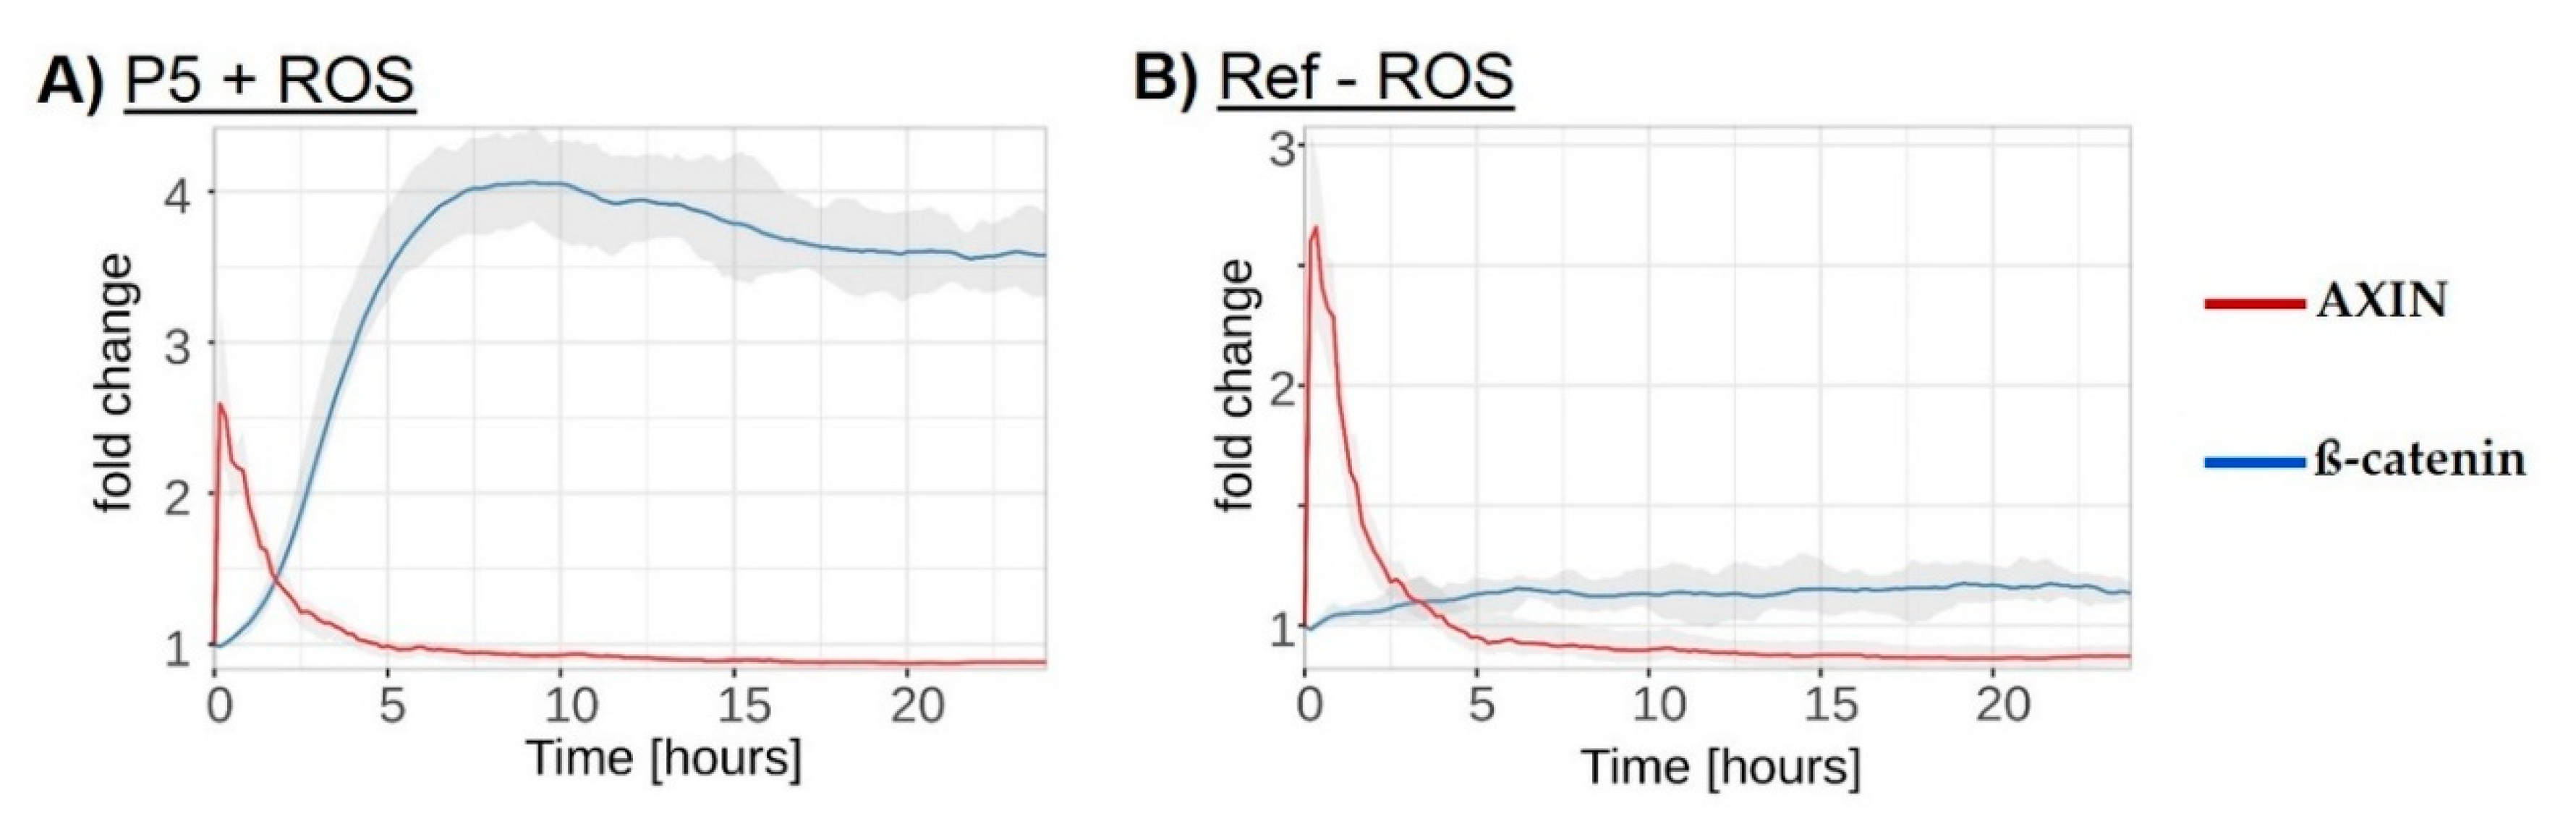
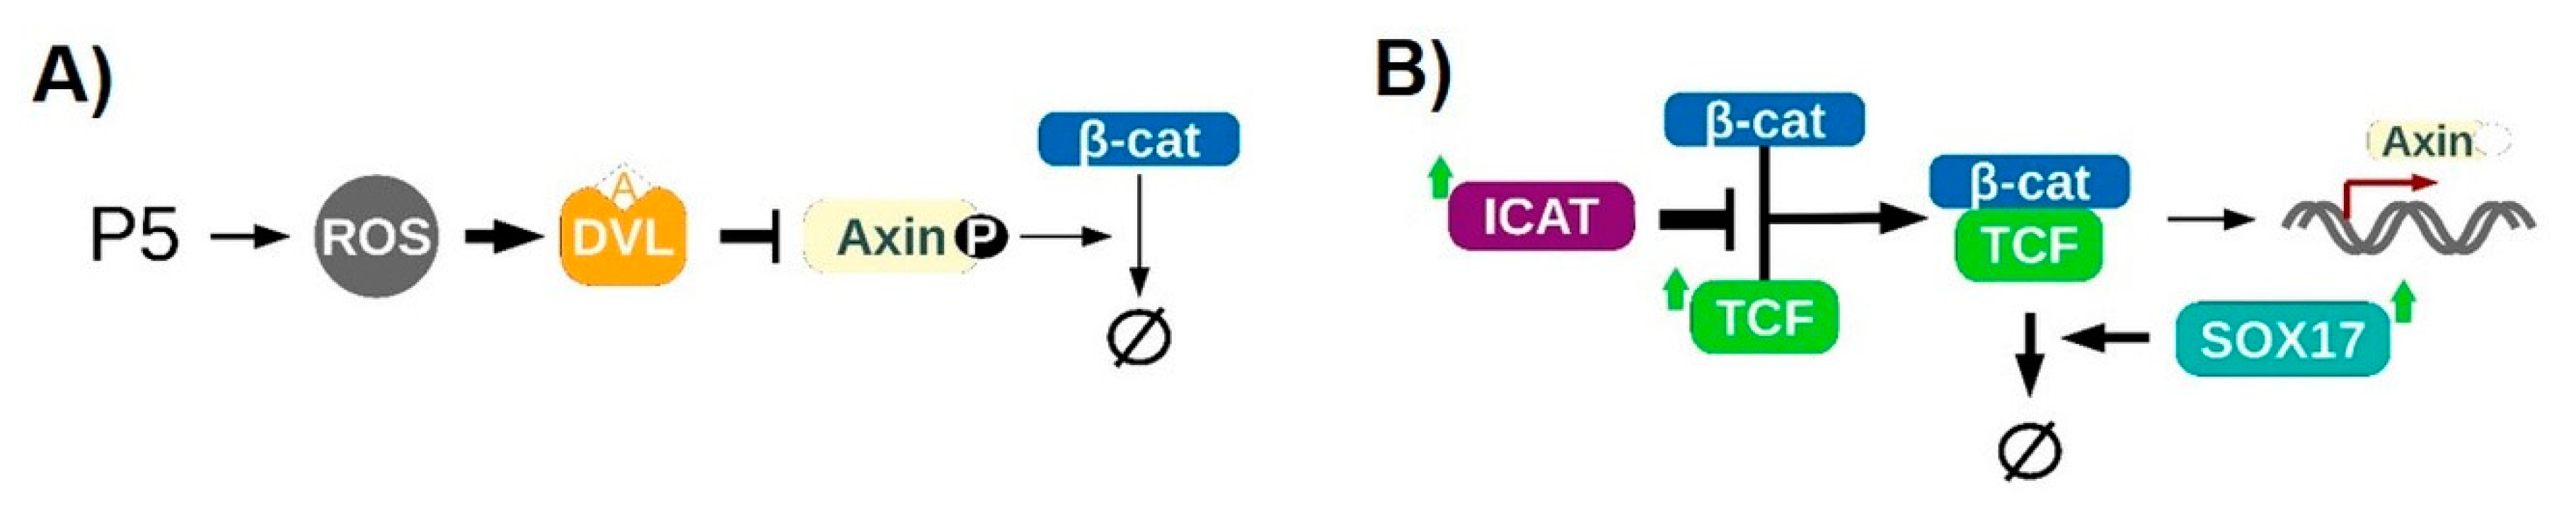
3.6. In Silico
4. Discussion
4.1. Redox-Dependent β-Catenin Accumulation
4.2. Regulation of the Transcriptional Activity of β-Catenin
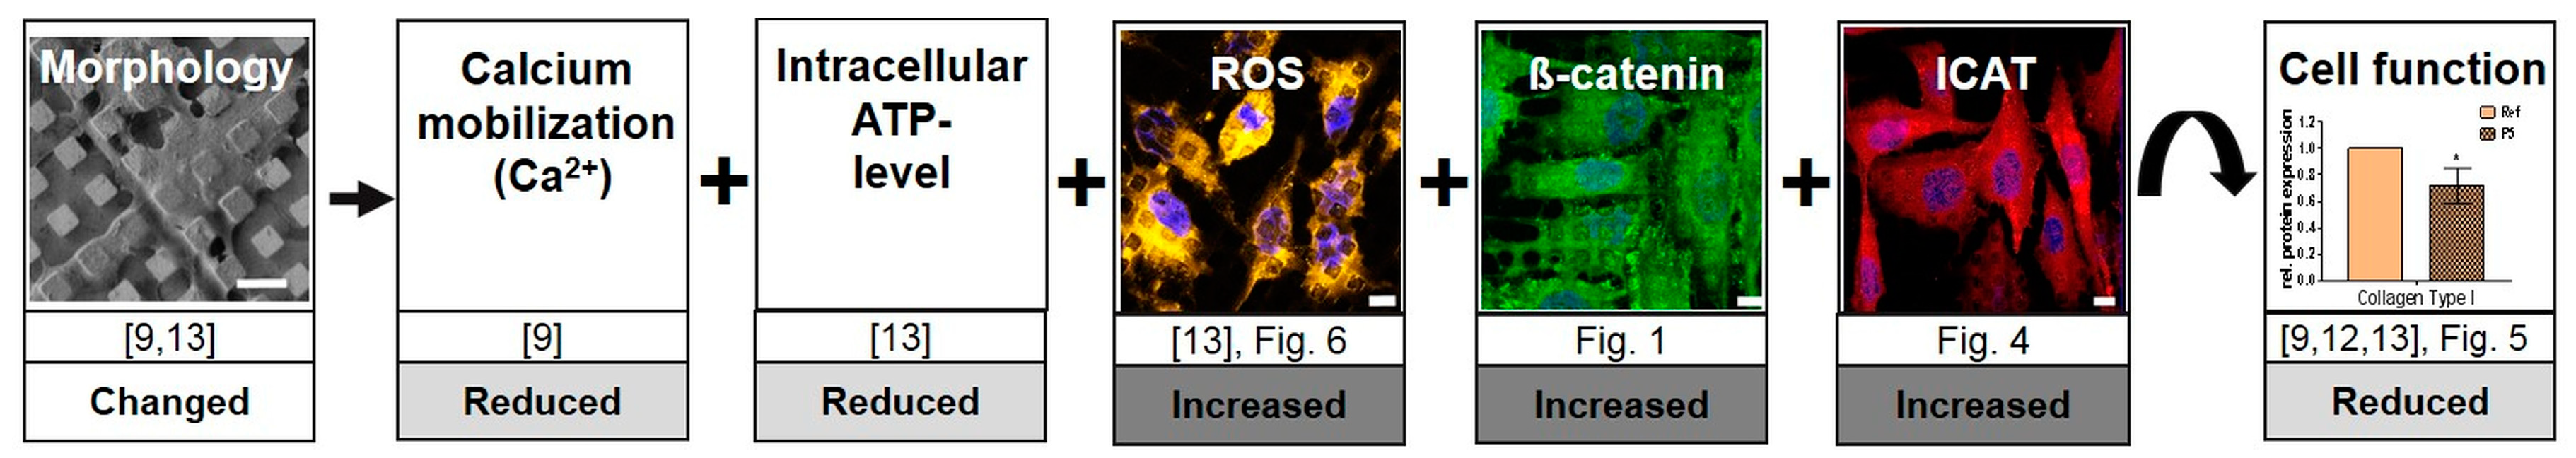
4.3. Assembling the Entire View
4.4. In Summary
Supplementary Materials
Author Contributions
Funding
Acknowledgments
Conflicts of Interest
References
- Markhoff, J.; Krogull, M.; Schulze, C.; Rotsch, C.; Hunger, S.; Bader, R. Biocompatibility and Inflammatory Potential of Titanium Alloys Cultivated with Human Osteoblasts, Fibroblasts and Macrophages. Materials 2017, 10, 52. [Google Scholar] [CrossRef] [Green Version]
- Oshida, Y.; Tuna, E.B.; Aktoren, O.; Gencay, K. Dental Implant Systems. Int. J. Mol. Sci. 2010, 11, 1580–1678. [Google Scholar] [CrossRef] [PubMed] [Green Version]
- Tejero, R.; Anitua, E.; Orive, G. Toward the biomimetic implant surface: Biopolymers on titanium-based implants for bone regeneration. Prog. Polym. Sci. 2014, 39, 1406–1447. [Google Scholar] [CrossRef]
- Wennerberg, A.; Albrektsson, T. Effects of titanium surface topography on bone integration: A systematic review. Clin. Oral Implant. Res. 2009, 20, 172–184. [Google Scholar] [CrossRef] [PubMed]
- Bacakova, L.; Filová, E.; Parizek, M.; Ruml, T.; Švorčík, V. Modulation of cell adhesion, proliferation and differentiation on materials designed for body implants. Biotechnol. Adv. 2011, 29, 739–767. [Google Scholar] [CrossRef] [PubMed]
- Thin Film Coatings for Biomaterials and Biomedical Applications; Elsevier: Amsterdam, The Netherlands, 2016; Volume 110, pp. 143–164.
- Seetharaman, S.; Etienne-Manneville, S. Integrin diversity brings specificity in mechanotransduction. Biol. Cell 2018, 110, 49–64. [Google Scholar] [CrossRef] [PubMed]
- Anselme, K.; Bigerelle, M. On the relation between surface roughness of metallic substrates and adhesion of human primary bone cells. Scanning 2012, 36, 11–20. [Google Scholar] [CrossRef]
- Staehlke, S.; Koertge, A.; Nebe, J.B. Intracellular calcium dynamics dependent on defined microtopographical features of titanium. Biomaterials 2015, 46, 48–57. [Google Scholar] [CrossRef]
- Chen, S.; Guo, Y.; Liu, R.; Wu, S.; Fang, J.; Huang, B.; Li, Z.; Chen, Z.; Chen, Z. Tuning surface properties of bone biomaterials to manipulate osteoblastic cell adhesion and the signaling pathways for the enhancement of early osseointegration. Colloids Surfaces B Biointerfaces 2018, 164, 58–69. [Google Scholar] [CrossRef]
- McMurray, R.J.; Wann, A.K.T.; Thompson, C.L.; Connelly, J.T.; Knight, M.M. Surface topography regulates wnt signaling through control of primary cilia structure in mesenchymal stem cells. Sci. Rep. 2013, 3, 3545. [Google Scholar] [CrossRef] [Green Version]
- Matschegewski, C.; Staehlke, S.; Loeffler, R.; Lange, R.; Chai, F.; Kern, D.P.; Beck, U.; Nebe, J.B. Cell architecture–cell function dependencies on titanium arrays with regular geometry. Biomaterials 2010, 31, 5729–5740. [Google Scholar] [CrossRef] [PubMed]
- Moerke, C.; Mueller, P.; Nebe, J.B. Attempted caveolae-mediated phagocytosis of surface-fixed micro-pillars by human osteoblasts. Biomaterials 2016, 76, 102–114. [Google Scholar] [CrossRef] [PubMed] [Green Version]
- Steinhart, Z.; Angers, S. Wnt signaling in development and tissue homeostasis. Developmental 2018, 145, dev146589. [Google Scholar] [CrossRef] [Green Version]
- Clevers, H.; Nusse, R. WNT/β-catenin signaling and disease. Cell 2012, 149, 1192–1205. [Google Scholar] [CrossRef] [PubMed] [Green Version]
- MacDonald, B.T.; Tamai, K.; He, X. Wnt/β-catenin signaling: Components, mechanisms, and diseases. Dev. Cell 2009, 17, 9–26. [Google Scholar] [CrossRef] [Green Version]
- Olivares-Navarrete, R.; Hyzy, S.; Wieland, M.; Boyan, B.D.; Schwartz, Z. The roles of Wnt signaling modulators Dickkopf-1 (Dkk1) and Dickkopf-2 (Dkk2) and cell maturation state in osteogenesis on microstructured titanium surfaces. Biomaterials 2010, 31, 2015–2024. [Google Scholar] [CrossRef] [Green Version]
- Galli, C.; Piemontese, M.; Lumetti, S.; Manfredi, E.; Macaluso, G.M.; Passeri, G. The importance of WNT pathways for bone metabolism and their regulation by implant topography. Eur. Cell Mater. 2012, 24, 46–59. [Google Scholar] [CrossRef]
- Komiya, Y.; Habas, R. Wnt signal transduction pathways. Organogold 2008, 4, 68–75. [Google Scholar] [CrossRef] [Green Version]
- Park, H.W.; Kim, Y.C.; Yu, B.; Moroishi, T.; Mo, J.-S.; Plouffe, S.W.; Meng, Z.; Lin, K.C.; Yu, F.-X.; Alexander, C.M.; et al. Alternative Wnt Signaling Activates YAP/TAZ. Cell 2015, 162, 780–794. [Google Scholar] [CrossRef] [Green Version]
- Nusse, R. Wnt signaling in disease and in development. Cell Res. 2005, 15, 28–32. [Google Scholar] [CrossRef] [Green Version]
- Kikuchi, A.; Yamamoto, H.; Sato, A.; Matsumoto, S. New Insights into the Mechanism of Wnt Signaling Pathway Activation. Int. Rev. Cell Mol. Biol. 2011, 291, 21–71. [Google Scholar] [CrossRef] [PubMed]
- Maeda, K.; Kobayashi, Y.; Koide, M.; Uehara, S.; Okamoto, M.; Ishihara, A.; Kayama, T.; Saito, M.; Marumo, K. The Regulation of Bone Metabolism and Disorders by Wnt Signaling. Int. J. Mol. Sci. 2019, 20, 5525. [Google Scholar] [CrossRef] [Green Version]
- Niehrs, C. The complex world of WNT receptor signalling. Nat. Rev. Mol. Cell Biol. 2012, 13, 767–779. [Google Scholar] [CrossRef] [PubMed]
- Tago, K.; Nakamura, T.; Nishita, M.; Hyodo, J.; Nagai, S.; Murata, Y.; Adachi, S.; Ohwada, S.; Morishita, Y.; Shibuya, H.; et al. Inhibition of Wnt signaling by ICAT, a novel beta-catenin-interacting protein. Genes Dev. 2000, 14, 1741–1749. [Google Scholar]
- Sinner, D.; Kordich, J.J.; Spence, J.R.; Opoka, R.; Rankin, S.; Lin, S.-C.J.; Jonatan, D.; Zorn, A.; Wells, J. Sox17 and Sox4 Differentially Regulate β-Catenin/T-Cell Factor Activity and Proliferation of Colon Carcinoma Cells. Mol. Cell. Biol. 2007, 27, 7802–7815. [Google Scholar] [CrossRef] [PubMed] [Green Version]
- Manolagas, S.C.; Almeida, M. Gone with the Wnts: Beta-Catenin, T-Cell Factor, Forkhead Box O, and Oxidative Stress in Age-Dependent Diseases of Bone, Lipid, and Glucose Metabolism. Mol. Endocrinol. 2007, 21, 2605–2614. [Google Scholar] [CrossRef] [PubMed] [Green Version]
- Haack, F.; Lemcke, H.; Ewald, R.; Rharass, T.; Uhrmacher, A.M. Spatio-temporal Model of Endogenous ROS and Raft-Dependent WNT/Beta-Catenin Signaling Driving Cell Fate Commitment in Human Neural Progenitor Cells. PLoS Comput. Biol. 2015, 11, e1004106. [Google Scholar] [CrossRef] [Green Version]
- Peng, D.; Warnke, T.; Haack, F.; Uhrmacher, A.M. Reusing simulation experiment specifications in developing models by successive composition—A case study of the Wnt/β-catenin signaling pathway. Simulation 2017, 93, 659–677. [Google Scholar] [CrossRef] [Green Version]
- Matschegewski, C.; Staehlke, S.; Birkholz, H.; Lange, R.; Beck, U.; Engel, K.; Nebe, J.B. Automatic Actin Filament Quantification of Osteoblasts and Their Morphometric Analysis on Microtextured Silicon-Titanium Arrays. Materials 2012, 5, 1176–1195. [Google Scholar] [CrossRef] [Green Version]
- Staehlke, S.; Rebl, H.; Nebe, B. Phenotypic stability of the human MG-63 osteoblastic cell line at different passages. Cell Biol. Int. 2018, 43, 22–32. [Google Scholar] [CrossRef] [Green Version]
- Koczan, D.; Fitzner, B.; Zettl, U.K.; Hecker, M. Microarray data of transcriptome shifts in blood cell subsets during S1P receptor modulator therapy. Sci. Data 2018, 5, 180145. [Google Scholar] [CrossRef] [PubMed] [Green Version]
- Maus, C.; Rybacki, S.; Uhrmacher, A.M. Rule-based multi-level modeling of cell biological systems. BMC Syst. Biol. 2011, 5, 166. [Google Scholar] [CrossRef] [PubMed] [Green Version]
- Helms, T.; Warnke, T.; Maus, C.; Uhrmacher, A.M. Semantics and Efficient Simulation Algorithms of an Expressive Multilevel Modeling Language. ACM Trans. Model. Comput. Simul. 2017, 27, 1–25. [Google Scholar] [CrossRef]
- Ewald, R.; Uhrmacher, A.M. SESSL. ACM Trans. Model. Comput. Simul. 2014, 24, 1–25. [Google Scholar] [CrossRef]
- Warnke, T.; Helms, T.; Uhrmacher, A.M. Reproducible and flexible simulation experiments with ML-Rules and SESSL. Bioinformatics 2017, 34, 1424–1427. [Google Scholar] [CrossRef]
- Rharass, T.; Lemcke, H.; Lantow, M.; Kuznetsov, S.A.; Weiss, D.G.; Panáková, D. Ca2+-mediated mitochondrial reactive oxygen species metabolism augments Wnt/β-catenin pathway activation to facilitate cell differentiation. J. Biol. Chem. 2014, 289, 27937–27951. [Google Scholar] [CrossRef] [Green Version]
- Funato, Y.; Michiue, T.; Asashima, M.; Miki, H. The thioredoxin-related redox-regulating protein nucleoredoxin inhibits Wnt–β-catenin signalling through Dishevelled. Nature 2006, 8, 501–508. [Google Scholar] [CrossRef] [PubMed]
- Love, N.R.; Chen, Y.; Ishibashi, S.; Kritsiligkou, P.; Lea, R.; Koh, Y.; Gallop, J.L.; Dorey, K.; Amaya, E. Amputation-induced reactive oxygen species are required for successful Xenopus tadpole tail regeneration. Nature 2013, 15, 222–228. [Google Scholar] [CrossRef] [Green Version]
- Sandieson, L.; Hwang, J.T.; Kelly, G.M. Redox Regulation of Canonical Wnt Signaling Affects Extraembryonic Endoderm Formation. Stem Cells Dev. 2014, 23, 1037–1049. [Google Scholar] [CrossRef]
- Lee, E.; Salic, A.; Krüger, R.; Heinrich, R.; Kirschner, M.W. The Roles of APC and Axin Derived from Experimental and Theoretical Analysis of the Wnt Pathway. PLoS Biol. 2003, 1, e10. [Google Scholar] [CrossRef] [Green Version]
- Rychly, J.; Nebe, B.J. Cell-material interaction. BioNanoMaterials 2013, 14, 153–160. [Google Scholar] [CrossRef]
- Nebe, J.G.B.; Luethen, F.; Lange, R.; Beck, U. Interface Interactions of Osteoblasts with Structured Titanium and the Correlation between Physicochemical Characteristics and Cell Biological Parameters. Macromol. Biosci. 2007, 7, 567–578. [Google Scholar] [CrossRef] [PubMed]
- McNamara, L.E.; McMurray, R.J.; Biggs, M.; Kantawong, F.; Oreffo, R.O.; Dalby, M.J. Nanotopographical Control of Stem Cell Differentiation. J. Tissue Eng. 2010, 2010, 120623. [Google Scholar] [CrossRef] [PubMed]
- Chen, J.C.; Jacobs, C.R. Mechanically induced osteogenic lineage commitment of stem cells. Stem Cell Res. Ther. 2013, 4, 107. [Google Scholar] [CrossRef] [PubMed] [Green Version]
- Galli, C.; Passeri, G.; Ravanetti, F.; Elezi, E.; Pedrazzoni, M.; Macaluso, G.M. Rough surface topography enhances the activation of Wnt/β-catenin signaling in mesenchymal cells. J. Biomed. Mater. Res. Part A 2010, 95, 682–690. [Google Scholar] [CrossRef] [PubMed]
- Sanz-Herrera, J.A.; Reina-Romo, E. Cell-Biomaterial Mechanical Interaction in the Framework of Tissue Engineering: Insights, Computational Modeling and Perspectives. Int. J. Mol. Sci. 2011, 12, 8217–8244. [Google Scholar] [CrossRef]
- Anselme, K.; Wakhloo, N.T.; Rougerie, P.; Pieuchot, L. Role of the Nucleus as a Sensor of Cell Environment Topography. Adv. Healthc. Mater. 2017, 7, 1701154. [Google Scholar] [CrossRef] [PubMed]
- Lange, R.; Elter, P.; Biala, K.; Matschegewski, C.; Stählke, S.; Löffler, R.; Fleischer, M.; Nebe, J.B.; Kern, D.; Beck, U. Titanium surfaces structured with regular geometry-material investigations and cell morphology. Surf. Interface Anal. 2010, 42, 497–501. [Google Scholar] [CrossRef]
- Badique, F.; Stamov, D.R.; Davidson, P.; Veuillet, M.; Reiter, G.; Freund, J.-N.; Franz, C.M.; Anselme, K. Directing nuclear deformation on micropillared surfaces by substrate geometry and cytoskeleton organization. Biomaterials 2013, 34, 2991–3001. [Google Scholar] [CrossRef]
- Anselme, K. Osteoblast adhesion on biomaterials. Biomaterials 2000, 21, 667–681. [Google Scholar] [CrossRef]
- Anselme, K.; Ponche, A.; Bigerelle, M. Relative influence of surface topography and surface chemistry on cell response to bone implant materials. Part 2: Biological aspects. Proc. Inst. Mech. Eng. Part H J. Eng. Med. 2010, 224, 1487–1507. [Google Scholar] [CrossRef]
- Keselowsky, B.; Wang, L.; Schwartz, Z.; García, A.; Boyan, B.D. Integrin α5 controls osteoblastic proliferation and differentiation responses to titanium substrates presenting different roughness characteristics in a roughness independent manner. J. Biomed. Mater. Res. Part. A 2007, 80, 700–710. [Google Scholar] [CrossRef]
- Sun, Y.; Chen, C.S.; Fu, J. Forcing stem cells to behave: A biophysical perspective of the cellular microenvironment. Annu. Rev. Biophys. 2012, 41, 519–542. [Google Scholar] [CrossRef] [PubMed] [Green Version]
- Boyan, B.D.; Olivares-Navarrete, R.; Berger, M.B.; Hyzy, S.L.; Schwartz, Z. Role of Wnt11 during Osteogenic Differentiation of Human Mesenchymal Stem Cells on Microstructured Titanium Surfaces. Sci. Rep. 2018, 8, 8588. [Google Scholar] [CrossRef] [PubMed] [Green Version]
- Logan, C.Y.; Nusse, R. THE WNT SIGNALING PATHWAY IN DEVELOPMENT AND DISEASE. Annu. Rev. Cell Dev. Biol. 2004, 20, 781–810. [Google Scholar] [CrossRef] [Green Version]
- Krishnan, V.; Bryant, H.U.; MacDougald, O.A. Regulation of bone mass by Wnt signaling. J. Clin. Investig. 2006, 116, 1202–1209. [Google Scholar] [CrossRef] [PubMed]
- Hoogeboom, D.; Burgering, B.M.T. Should I stay or should I go: β-catenin decides under stress. Biochim. Biophys. Acta (BBA)—Bioenerg. 2009, 1796, 63–74. [Google Scholar] [CrossRef] [PubMed]
- Tamura, M. Role of the Wnt signaling pathway in bone and tooth. Front. Biosci. 2010, 2, 1405–1413. [Google Scholar] [CrossRef] [PubMed] [Green Version]
- Karner, C.M.; Long, F. Wnt signaling and cellular metabolism in osteoblasts. Cell. Mol. Life Sci. 2016, 74, 1649–1657. [Google Scholar] [CrossRef]
- Olivares-Navarrete, R.; Hyzy, S.L.; Hutton, D.L.; Dunn, G.R.; Appert, C.; Boyan, B.D.; Schwartz, Z. Role of non-canonical Wnt signaling in osteoblast maturation on microstructured titanium surfaces. Acta Biomater. 2011, 7, 2740–2750. [Google Scholar] [CrossRef] [Green Version]
- Gao, C.; Chen, Y.-G. Dishevelled: The hub of Wnt signaling. Cell. Signal. 2010, 22, 717–727. [Google Scholar] [CrossRef] [PubMed]
- Galli, C.; Piemontese, M.; Lumetti, S.; Ravanetti, F.; Macaluso, G.M.; Passeri, G. Actin cytoskeleton controls activation of Wnt/β-catenin signaling in mesenchymal cells on implant surfaces with different topographies. Acta Biomater. 2012, 8, 2963–2968. [Google Scholar] [CrossRef] [PubMed]
- Sato, A.; Yamamoto, H.; Sakane, H.; Koyama, H.; Kikuchi, A. Wnt5a regulates distinct signalling pathways by binding to Frizzled2. EMBO J. 2009, 29, 41–54. [Google Scholar] [CrossRef] [PubMed] [Green Version]
- Liu, Q.; Wang, W.; Zhang, L.; Zhao, L.; Song, W.; Duan, X.; Zhang, Y. Involvement of N-cadherin/β-catenin interaction in the micro/nanotopography induced indirect mechanotransduction. Biomaterials 2014, 35, 6206–6218. [Google Scholar] [CrossRef]
- Hay, E.; Buczkowski, T.; Marty, C.; Da Nascimento, S.; Sonnet, P.; Marie, P.J. Peptide-based mediated disruption of N-cadherin-LRP5/6 interaction promotes Wnt signaling and bone formation. J. Bone Miner. Res. 2012, 27, 1852–1863. [Google Scholar] [CrossRef]
- Galli, C.; Macaluso, G.M.; Piemontese, M.; Passeri, G. Titanium Topography Controls FoxO/β-catenin Signaling. J. Dent. Res. 2011, 90, 360–364. [Google Scholar] [CrossRef]
- Wang, W.; Zhao, L.; Wu, K.; Ma, Q.; Mei, S.; Chu, P.K.; Wang, Q.; Zhang, Y. The role of integrin-linked kinase/β-catenin pathway in the enhanced MG63 differentiation by micro/nano-textured topography. Biomaterials 2013, 34, 631–640. [Google Scholar] [CrossRef] [PubMed]
- Wang, W.; Zhao, L.; Ma, Q.; Wang, Q.; Chu, P.K.; Zhang, Y. The role of the Wnt/β-catenin pathway in the effect of implant topography on MG63 differentiation. Biomaterials 2012, 33, 7993–8002. [Google Scholar] [CrossRef]
- Fu, J.; Liu, X.; Tan, L.; Cui, Z.; Liang, Y.; Li, Z.; Zhu, S.; Zheng, Y.; Yeung, K.W.K.; Chu, P.K.; et al. Modulation of the mechanosensing of mesenchymal stem cells by laser-induced patterning for the acceleration of tissue reconstruction through the Wnt/β-catenin signaling pathway activation. Acta Biomater. 2019, 101, 152–167. [Google Scholar] [CrossRef]
- Schernthaner, M.; Reisinger, B.; Wolinski, H.; Kohlwein, S.D.; Trantina-Yates, A.; Fahrner, M.; Romanin, C.; Itani, H.; Stifter, D.; Leitinger, G.; et al. Nanopatterned polymer substrates promote endothelial proliferation by initiation of β-catenin transcriptional signaling. Acta Biomater. 2012, 8, 2953–2962. [Google Scholar] [CrossRef]
- Zhong, Z.; Zylstra-Diegel, C.R.; Schumacher, C.A.; Baker, J.J.; Carpenter, A.C.; Rao, S.; Yao, W.; Guan, M.; Helms, J.A.; Lane, N.E.; et al. Wntless functions in mature osteoblasts to regulate bone mass. Proc. Natl. Acad. Sci. USA 2012, 109, E2197–E2204. [Google Scholar] [CrossRef] [PubMed] [Green Version]
- Li, X.; Zhang, Y.; Kang, H.; Liu, W.; Liu, P.; Zhang, J.; Harris, S.E.; Wu, D.; Beullens, M.; Vancauwenbergh, S.; et al. Sclerostin Binds to LRP5/6 and Antagonizes Canonical Wnt Signaling. J. Biol. Chem. 2005, 280, 19883–19887. [Google Scholar] [CrossRef] [PubMed] [Green Version]
- Xu, W.; Kimelman, D. Mechanistic insights from structural studies of beta-catenin and its binding partners. J. Cell Sci. 2007, 120, 3337–3344. [Google Scholar] [CrossRef] [PubMed] [Green Version]
- Graham, T.A.; Clements, W.K.; Kimelman, D.; Xu, W. The Crystal Structure of the β-Catenin/ICAT Complex Reveals the Inhibitory Mechanism of ICAT. Mol. Cell 2002, 10, 563–571. [Google Scholar] [CrossRef]
- Sekiya, T.; Nakamura, T.; Kazuki, Y.; Oshimura, M.; Kohu, K.; Tago, K.-I.; Ohwada, S.; Akiyama, T. Overexpression of Icat induces G(2) arrest and cell death in tumor cell mutants for adenomatous polyposis coli, beta-catenin, or Axin. Cancer Res. 2002, 62, 3322–3326. [Google Scholar]
- Chen, M.; Zhu, M.; Awad, H.A.; Li, T.-F.; Sheu, T.-J.; Boyce, B.F.; Chen, D.; O’Keefe, R.J. Inhibition of beta-catenin signaling causes defects in postnatal cartilage development. J. Cell Sci. 2008, 121, 1455–1465. [Google Scholar] [CrossRef] [Green Version]
- Stow, J. ICAT is a multipotent inhibitor of beta-catenin. Focus on “role for ICAT in beta-catenin-dependent nuclear signaling and cadherin functions”. Am. J. Physiol. Physiol. 2004, 286, C745–C746. [Google Scholar] [CrossRef] [Green Version]
- Liu, X.; Luo, M.; Xie, W.; Wells, J.M.; Goodheart, M.J.; Engelhardt, J.F. Sox17 modulates Wnt3A/beta-catenin-mediated transcriptional activation of the Lef-1 promoter. Am. J. Physiol. Lung Cell. Mol. Physiol. 2010, 299, L694–L710. [Google Scholar] [CrossRef] [Green Version]
- Jing, D.; Tong, S.; Zhai, M.; Li, X.; Cai, J.; Wu, Y.; Shen, G.; Zhang, X.; Xu, Q.; Guo, Z.; et al. Effect of low-level mechanical vibration on osteogenesis and osseointegration of porous titanium implants in the repair of long bone defects. Sci. Rep. 2015, 5, 17134. [Google Scholar] [CrossRef] [Green Version]
- Zhang, R.; Oyajobi, B.O.; Harris, S.E.; Chen, D.; Tsao, C.; Deng, H.; Zhao, M. Wnt/β-catenin signaling activates bone morphogenetic protein 2 expression in osteoblasts. Bone 2012, 52, 145–156. [Google Scholar] [CrossRef] [Green Version]
- Schwarz-Romond, T.; Metcalfe, C.; Bienz, M. Dynamic recruitment of axin by Dishevelled protein assemblies. J. Cell Sci. 2007, 120, 2402–2412. [Google Scholar] [CrossRef] [PubMed] [Green Version]
- Scholten, D.J.; Timmer, C.M.; Peacock, J.D.; Pelle, D.W.; Williams, B.O.; Steensma, M.R. Down Regulation of Wnt Signaling Mitigates Hypoxia-Induced Chemoresistance in Human Osteosarcoma Cells. PLoS ONE 2014, 9, e111431. [Google Scholar] [CrossRef] [PubMed] [Green Version]
- Fang, F.; VanCleave, A.; Helmuth, R.; Torres, H.; Rickel, K.; Wollenzien, H.; Sun, H.; Zeng, E.; Zhao, J.; Tao, J. Targeting the Wnt/β-catenin pathway in human osteosarcoma cells. Oncotarget 2018, 9, 36780–36792. [Google Scholar] [CrossRef] [PubMed] [Green Version]
- Zou, Y.; Yang, J.; Jiang, D. Resveratrol inhibits canonical Wnt signaling in human MG-63 osteosarcoma cells. Mol. Med. Rep. 2015, 12, 7221–7226. [Google Scholar] [CrossRef] [PubMed] [Green Version]


| Gene Symbol | Description | P5 Avg (log2) | Ref Avg (log2) | Fold Change (P5 versus Ref) | p-Value |
|---|---|---|---|---|---|
| WLS | Wntless, Wnt ligand secretion mediator | 12.8 | 11.89 | 1.87 | 0.0299 |
| CTNNBIP1 | ICAT, catenin beta interacting protein 1 | 8.17 | 7.45 | 1.65 | 0.0006 |
| SOX17 | SRY-box transcription factor 17 | 4.02 | 3.36 | 1.58 | 0.0066 |
| SOST | sclerostin | 3.74 | 3.08 | 1.57 | 0.0164 |
| TCF4 | transcription factor 4 | 11.56 | 10.93 | 1.55 | 0.0397 |
| SFRP4 | secreted frizzled-related protein 4 | 4.26 | 5.23 | −1.95 | 0.0062 |
© 2020 by the authors. Licensee MDPI, Basel, Switzerland. This article is an open access article distributed under the terms and conditions of the Creative Commons Attribution (CC BY) license (http://creativecommons.org/licenses/by/4.0/).
Share and Cite
Staehlke, S.; Haack, F.; Waldner, A.-C.; Koczan, D.; Moerke, C.; Mueller, P.; Uhrmacher, A.M.; Nebe, J.B. ROS Dependent Wnt/β-Catenin Pathway and Its Regulation on Defined Micro-Pillars—A Combined In Vitro and In Silico Study. Cells 2020, 9, 1784. https://0-doi-org.brum.beds.ac.uk/10.3390/cells9081784
Staehlke S, Haack F, Waldner A-C, Koczan D, Moerke C, Mueller P, Uhrmacher AM, Nebe JB. ROS Dependent Wnt/β-Catenin Pathway and Its Regulation on Defined Micro-Pillars—A Combined In Vitro and In Silico Study. Cells. 2020; 9(8):1784. https://0-doi-org.brum.beds.ac.uk/10.3390/cells9081784
Chicago/Turabian StyleStaehlke, Susanne, Fiete Haack, Anna-Christin Waldner, Dirk Koczan, Caroline Moerke, Petra Mueller, Adelinde M. Uhrmacher, and J. Barbara Nebe. 2020. "ROS Dependent Wnt/β-Catenin Pathway and Its Regulation on Defined Micro-Pillars—A Combined In Vitro and In Silico Study" Cells 9, no. 8: 1784. https://0-doi-org.brum.beds.ac.uk/10.3390/cells9081784