Article

Spatiotemporal Variation of Snowfall to Precipitation Ratio and Its Implication on Water Resources by a Regional Climate Model over Xinjiang, China

1
State Key Laboratory of Desert and Oasis Ecology, Xinjiang Institute of Ecology and Geography, CAS, Urumqi 830011, China
2
University of Chinese Academy of Sciences, Beijing 100049, China
3
Ili Station for Watershed Ecosystem Research, Urumqi 830011, China
4
Xinjiang Regional Center of Resources and Environmental Science Instrument, Chinese Academy of Sciences, Urumqi 830011, China
5
CAS Research Center for Ecology and Environment in Central Asia, 818 South Beijing Road, Urumqi 830011, China
*
Author to whom correspondence should be addressed.
Submission received: 13 September 2018 / Revised: 4 October 2018 / Accepted: 15 October 2018 / Published: 17 October 2018

Abstract

:
Snow contributes one of the main water sources to runoff in the arid region of China. A clear understanding of the spatiotemporal variation of snowfall is not only required for climate change assessment, but also plays a critical role in water resources management. However, in-situ observations or gridded datasets hardly meet the requirement and cannot provide precise spatiotemporal details on snowfall across the region. This study attempted to apply the Weather Research and Forecasting (WRF) model to clarify the spatiotemporal variation of snowfall and the ratio of snowfall to total precipitation over Xinjiang in China during the 1979–2015 period. The results showed that the snowfall increased in the southern edge of the Tarim Basin, the Ili Valley, and the Altay Mountains, but decreased in the Tianshan Mountains and the Kunlun Mountains. The snowfall/precipitation (S/P) ratio revealed the opposite trends in low-elevation regions and mountains in the study area. The S/P ratio rose in the Tarim Basin and the Junggar Basin, but declined in the Altay Mountains, the Tianshan Mountains, and the west edge of the Junggar Basin. The study area comprises two major rivers in the middle of the Tianshan Mountains. Both the runoff magnitude increase and earlier occurrence of snowmelt recharge in runoff identified for the 1980s were compared with the 2000s level in decreasing S/P ratio regions.

1. Introduction

Snow plays an important role in balancing radiation and generating streamflow in arid and semi-arid regions. It regulates the energy balance and hydrological cycle, which exerts a large influence on atmospheric circulation and the climatic system [1]. An increase in temperature will reduce the fraction of precipitation that falls as snowfall, shorten snow cover duration in the cold season, bring early timing of snowmelt in spring, and increase snowmelt intensity [2,3]. Recent model simulations, satellite-derived records, and in-situ observations demonstrated that the snow cover extent experienced a strong negative trend in North America and Eurasia, particularly in spring time [4,5,6,7], which is consistent with an increase in the mean winter temperature in the Northern Hemisphere. In addition, the changes in the fraction of snowfall to precipitation alter snow dynamics and runoff amount [8,9], leading to more rain-on-snow floods [10,11]. Thus, a combined indicator, defined as the ratio of snowfall to total precipitation (S/P), has been developed to represent the simultaneous change of snowfall and precipitation for the sake of clarifying dynamics of snow with distinct characteristics on a regional scale [9,12,13].
Many efforts have focused on the variability of the S/P ratio along with the rising temperature. For instance, Huntington et al. [14] found a significant reduced trend of the S/P ratio in New England from 1949 to 2000. Similar trends of the winter total snowfall-water-equivalent (SWE) and S/P ratio in the United States were also confirmed during the period from 1949 to 2004 [15], but there was no significant change in the S/P ratio for the Canadian Arctic, except for the summer [16]. Serquet et al. [17] analyzed the S/P ratio at 76 meteorological stations in Switzerland for up to 100 years and discovered a clear decreasing trend, especially at lower elevations. The same trend was found in the middle altitude of 1500 to 2500 m in the Tianshan Mountains [13]. Yang et al. [18] and Littell et al. [19] found that the S/P ratio significantly decreased at the end of 21st century in the Tianshan Mountains and Alaska. Long term change in the S/P ratio over time is of importance to the extent that it influences the magnitude and timing of spring runoff and recession to summer baseflow. As a consequence, it is important to expound the distinct regional variation of snowfall and S/P ratio in pursuit of realizing the change of snowfall and precipitation under climate change. However, studies on long-term and large-scale variations of snowfall and S/P ratio are insufficient, such as in the arid region of China, where snowfall is an important water source and observations are scarce.
Situated far from oceans, the arid region in western China has a typical continental climate marked by generally low precipitation, high evaporation potential, wide temperature fluctuations, and strong winds [20,21]. Mountainous precipitation, water from snowmelt, and glacier-melt are the main water sources in this region, which are highly sensitive to climate change [22]. During the last five decades, the rise in annual temperature in this region was greater than that of China’s national average, and has been in a state of high variability since 1997 [23]. A higher warming rate was also observed in the Tianshan Mountains [24,25]. Such variation would greatly influence the snowfall regimes and change the supplying patterns of runoff in both spring and summer in the arid region [26]. As a good indicator of climate change, the S/P ratio also has a significant influence on annual runoff [8]. Thus, effectively monitoring the snowfall and S/P ratio would make clear sense for local climate change and water resources management.
The distribution of precipitation has been mainly statistically assessed on the basis of observed data. However, due to the scarcity of meteorological stations in spatial distribution and the complex topography in Xinjiang, China, the dataset from observations (including the gridded dataset from the extrapolation by in-situ observation) does not represent the local climate feature well, nor provide spatiotemporal details of precipitation over the region, especially in the high altitude where stations are not installed. Furthermore, quality problems in time series data resulting from observation metric and systematic errors of the equipment during conventional meteorological observation are serious, particularly in the cold season. The under-catch errors in precipitation gauge records can be as large as 50–100% at a high latitude [27,28,29]. Dynamical downscaling is therefore an inevitable alternative in order to characterize the spatiotemporal variation of snowfall and S/P ratio, especially in the region with a large vertical gradient from basin to mountain and a lack of observations. Some studies have reported that precipitation patterns simulated by the Weather Research and Forecasting (WRF) model were highly accurate at different spatial scales, including high-elevation and complex topography regions [30,31,32,33,34,35]. Consequently, the WRF model could provide the most accurate available estimation of the mesoscale precipitation distribution [33], enabling research on long-term variation of snowfall and the S/P ratio over complex terrain. This study attempted to employ the outputs of the WRF model to: (1) investigate the ability of the WRF model to reproduce the temporal and spatial distribution of the S/P ratio over the region, (2) characterize the regional variation pattern of both snowfall and the S/P ratio over complex topography and a large vertical gradient region, and (3) reveal the changes in hydrological processes in the study area and discuss the implications on water resources based on (1) and (2). The results could help to assess the impact of regional climate change on snowfall and provide information for water resources management in arid regions.

2. Data and Methodology
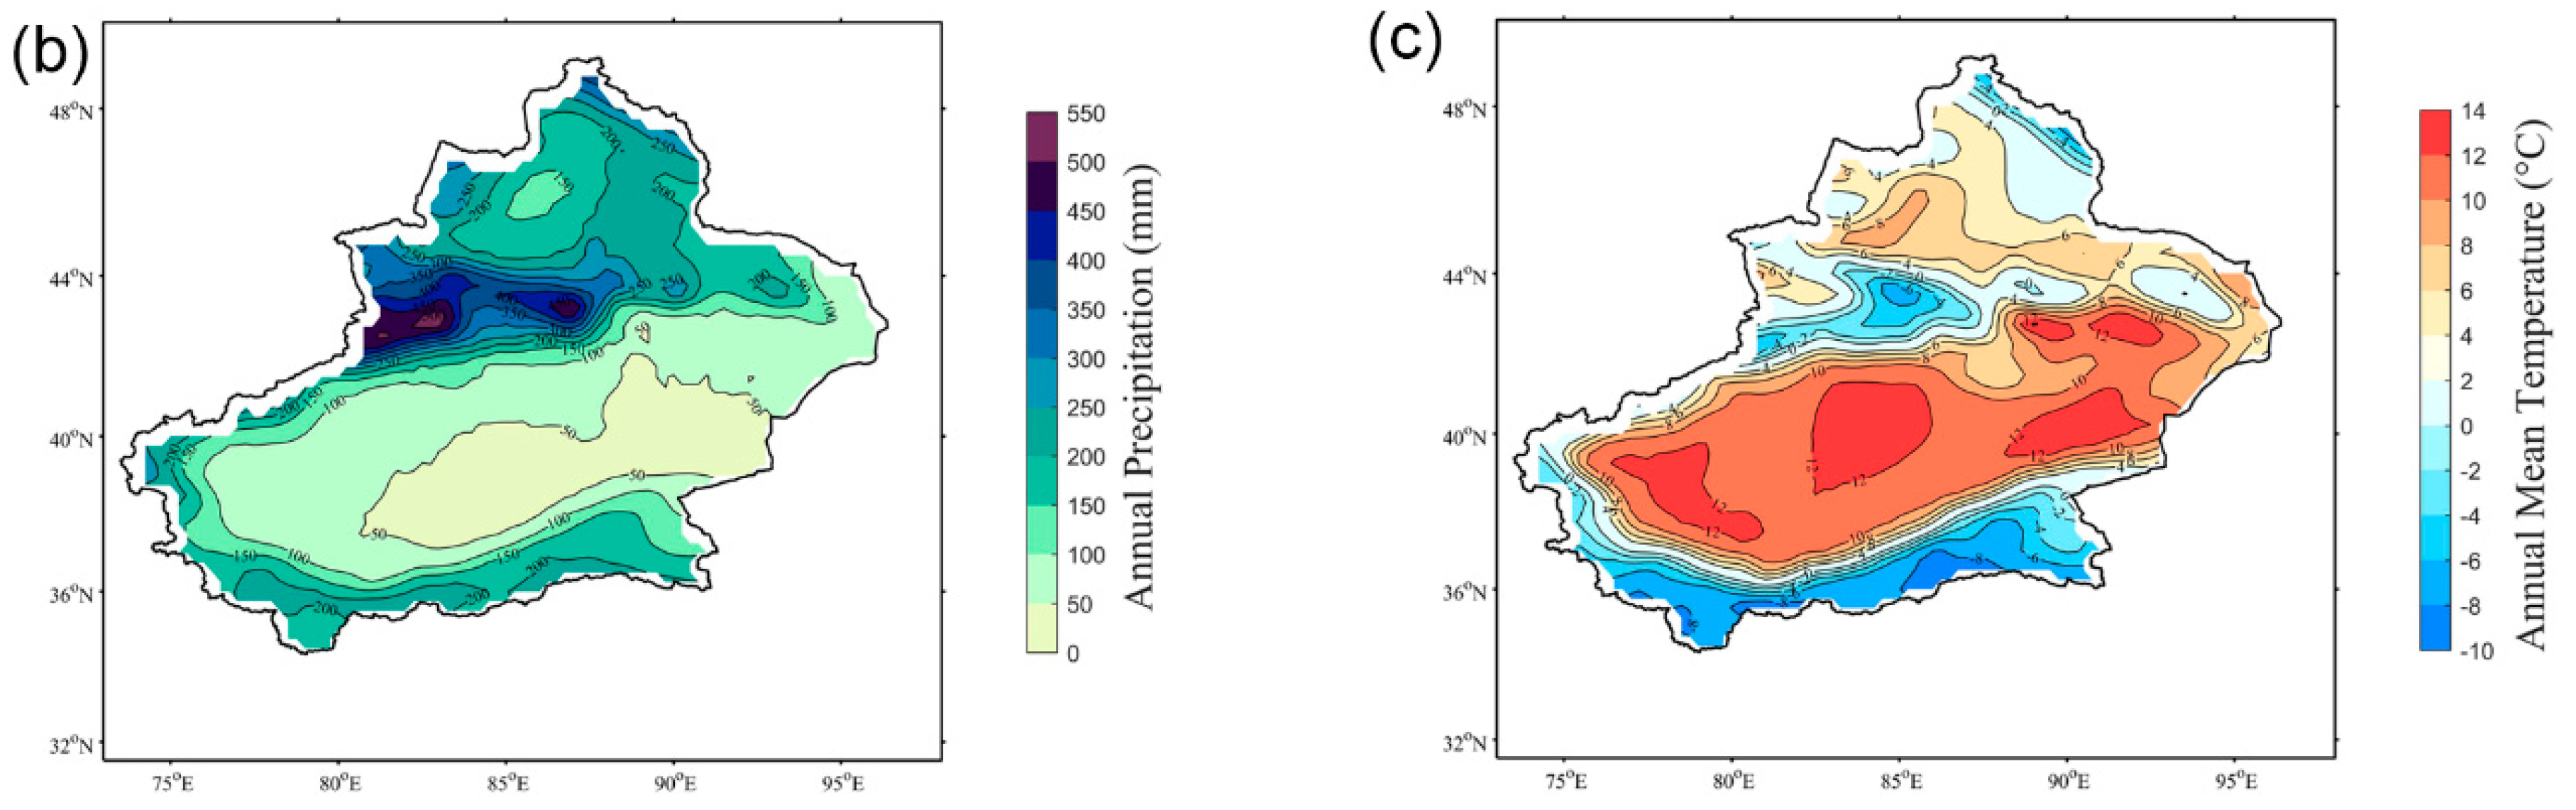
2.1. Study Area

This study focuses on Xinjiang, a typical arid region in northwestern China. The region is located within the range of 34°25′–48°10′ N and 73°40′–96°18′ E, with an area of about 1.66 × 10⁶ km2, and is characterized by its highly vulnerable water resources and fragile environment. Complex topographic and geomorphologic features build mountains, plains, and basins in this region. The elevation of this region ranges from below sea level with 161 m a.s.l. to as high as 7906 m a.s.l. (Figure 1). The annual mean precipitation is less than 200 mm. Due to diverse and extreme terrains in the region, the spatial and temporal distributions of precipitation are rather heterogeneous. The river runoff in Xinjiang is generated in the mountainous region and mainly depends on glacier-melt, snowmelt, and precipitation. The study area comprises two major rivers in the middle of the Tianshan Mountains: the Manas River in the north slope and the Kaidu River in the south slope. The Kaidu River Basin is gauged at Bayanbulak (2458 m a.s.l.) for monitoring runoff, where the area above Bayanbulak is 18,725 km2 [36]. The Manas River Basin is gauged at Kensiwate (940 m a.s.l.) for monitoring runoff, where the area above Kensiwate is 4637 km2, which consists of 608 km2 with glacier [37]. The area above both gauges is little influenced by human activities. The summer precipitation accounts for about 60–80% of total annual precipitation in both rivers [22]. Annual runoffs over the period 1958–2007 were 9.18 × 10⁸ m3 and 12.37 × 10⁸ m3 for the Kaidu River Basin and Manas River Basin, respectively [22,38]. Snowmelt water is the main recharge source in both rivers in spring. Maximum monthly discharge occurs in July at Bayanbulak gauge and in August at Kensiwate gauge, when runoff is generated by snowmelt, glacier-melt, and rainfall.

2.2. WRF Model Set Up

The WRF model used in this study runs at a resolution of 12 km across western China. The simulation domain covers 73.447°–127.017° E, 26.855°–53.585° N. The model contains a large number of physical processes, and their parameterizations are as follows: the top of atmosphere has been set to 50 hpa, with 31 layers along the vertical direction. The base period of the climatic simulation started from 06:00:00 BJT 1 January 1979 (8 h earlier than the UTC) and ended at 23:00:00 BJT 31 December 2015, with a 3-h interval for outputs. The initial lateral boundary condition was forced using the NCEP/DOE dataset, and the sea surface temperature was obtained from the ERA-Interim dataset. Other parameterization included the Kain-Fritsch Cumulus Scheme [39], the Rapid Radiation Transfer Model (RRTM) for longwave radiation [40], the Dudhia shortwave radiation model [41], the WRF Single-Moment 3-Class microphysics model, the Noah Land Surface Model (Noah LSM) [42], and the Yonsei University model for the planetary boundary layer (YSU) [43].

2.3. Meteorological and Streamflow Datasets

Before further analysis was carried out for the S/P ratio in this study, bias analysis between simulated results and in-situ observations, as well as the distribution of CN05.1, a dataset extrapolated with 2480 meteorological stations across the whole of China in terms of the Thin Plate Spline (TPS) method, was implemented. Fifty-one stations of in-situ observations in Xinjiang, China, selected from a total of 793 stations in the China Meteorological dataset version 3.0 (http://www.escience.gov.cn), were collected to evaluate the performance of the WRF model. In addition, the CN05.1 dataset was applied for spatial validation of the model outputs. The dataset contains daily precipitation and daily temperature at the resolution of 0.25 degree from 1961 to 2015. The accuracy analysis on WRF outputs showed small differences over eastern China with dense observation stations, but larger differences over western China, where there were less stations [44,45].
Daily discharge data for the Bayanbulak and Kensiwate gauges are available for the period of 1979 to 2011. The daily data were checked for homogeneity and continuity, and then monthly sums of daily data were used for analyzing the changes in water resources in the study area.

2.4. Snowfall Calculation

In this study, snowfall was calculated from precipitation. Based on the study from Dai [46], the conditional frequencies of snowfall (F) can be calculated using a hyperbolic tangent function. Snowfall occurs when the temperature-dependence exceeds 50%. Therefore, a sigmoidal hyperbolic tangent curve was used to fit the observations of snow conditional frequency per 0.3 °C Ta bin from −10 °C to 10 °C in this study.
F = a [ t a n h ( b ( T a c ) ) d ]
where Ta is the temperature, and parameters a, b, c, and d are calculated by least squares fitting observations. This method was estimated in the North Hemisphere for rain-snow partition [47]. The parameters were fitted best as −49.7648, 0.3146, 1.6540, and 0.9786 in the study area during the cold season (from October to April, respectively).

2.5. Assessment of Performance of the WRF Model

Bias (BIAS) and root mean square error (RMSE) were used to evaluate the performance of the WRF model before further analysis. BIAS measures the average tendency of the simulated data with observations [48], while RMSE measures the deviation between the simulated data and observations. For the BIAS, positive values indicate model overestimation bias, and negative values indicate model underestimation bias.
B I A S = i = 1 n ( Y i o b s Y i s i m )
R M S E = 1 n i = 1 n ( Y i o b s Y i s i m ) 2
where Yobs and Ysim are the in-situ observations and simulated data, respectively. The optimal value of BIAS and RMSE is 0.0, with low values indicating accurate model simulation.

2.6. Trend Analysis

The Mann-Kendall (MK) test was employed to detect the trends of snowfall and its ratio to total precipitation in this study. This test has been widely used in hydro-meteorological time series analysis as a non-parametric statistical test [49,50]. Compared with parametric statistical tests, non-parametric tests are more suitable to analyze the monotonic trends for non-normally distributed data [49]. To reduce the effect of autocorrelation, all data went through pre-whitening before the MK test [49].

3. Results

3.1. Performance of the WRF Model

Table 1 reveals the mean BIAS and RMSE of monthly total precipitation and mean temperature between WRF outputs and observations of the selected 51 stations in Xinjiang. The simulated temperature agreed well with observations. The model displayed a cold bias in summer, but warm bias in spring, winter, and annual mean. Overestimation in precipitation was more frequently noted in all seasons, and especially occurred in high elevation areas such as the Altay Mountains and the Tianshan Mountains. The distribution of RMSE was similar to that of bias, with the largest value in high altitude regions.
Figure 2 shows the spatial distribution patterns of two datasets for climatology snowfall during the cold season. Both the outputs of WRF and the gridded dataset (CN05.1) shared similar distributions. High snowfall mainly occurred in the mountainous areas, such as the Tianshan Mountains, the Kunlun Mountains, and the Altay Mountains, while low values took place in the Tarim Basin and the Junggar Basin. Although the snowfall in both datasets had very similar distributions in the context of amount, the WRF output was higher than that of CN05.1. The result of WRF was overestimated in the alpine area, especially in the Tianshan Mountains, the Kunlun Mountains, and the Altay Mountains.

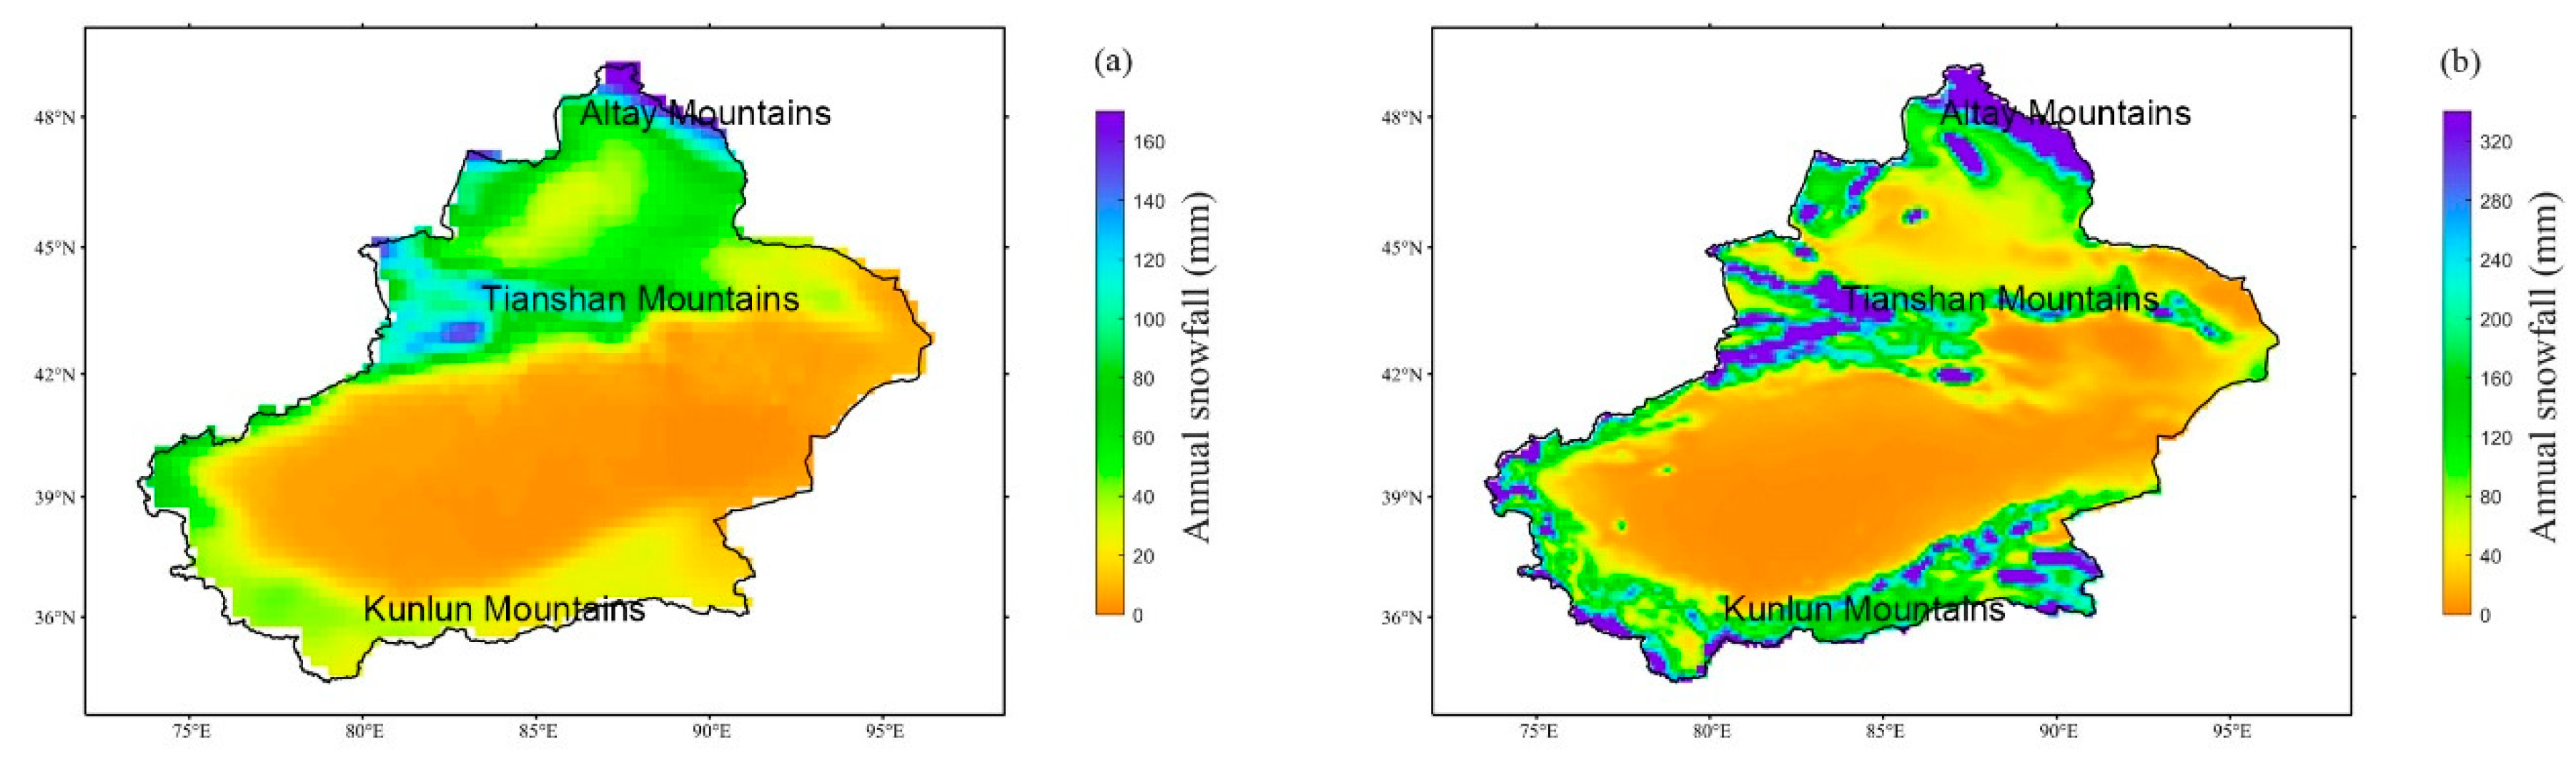
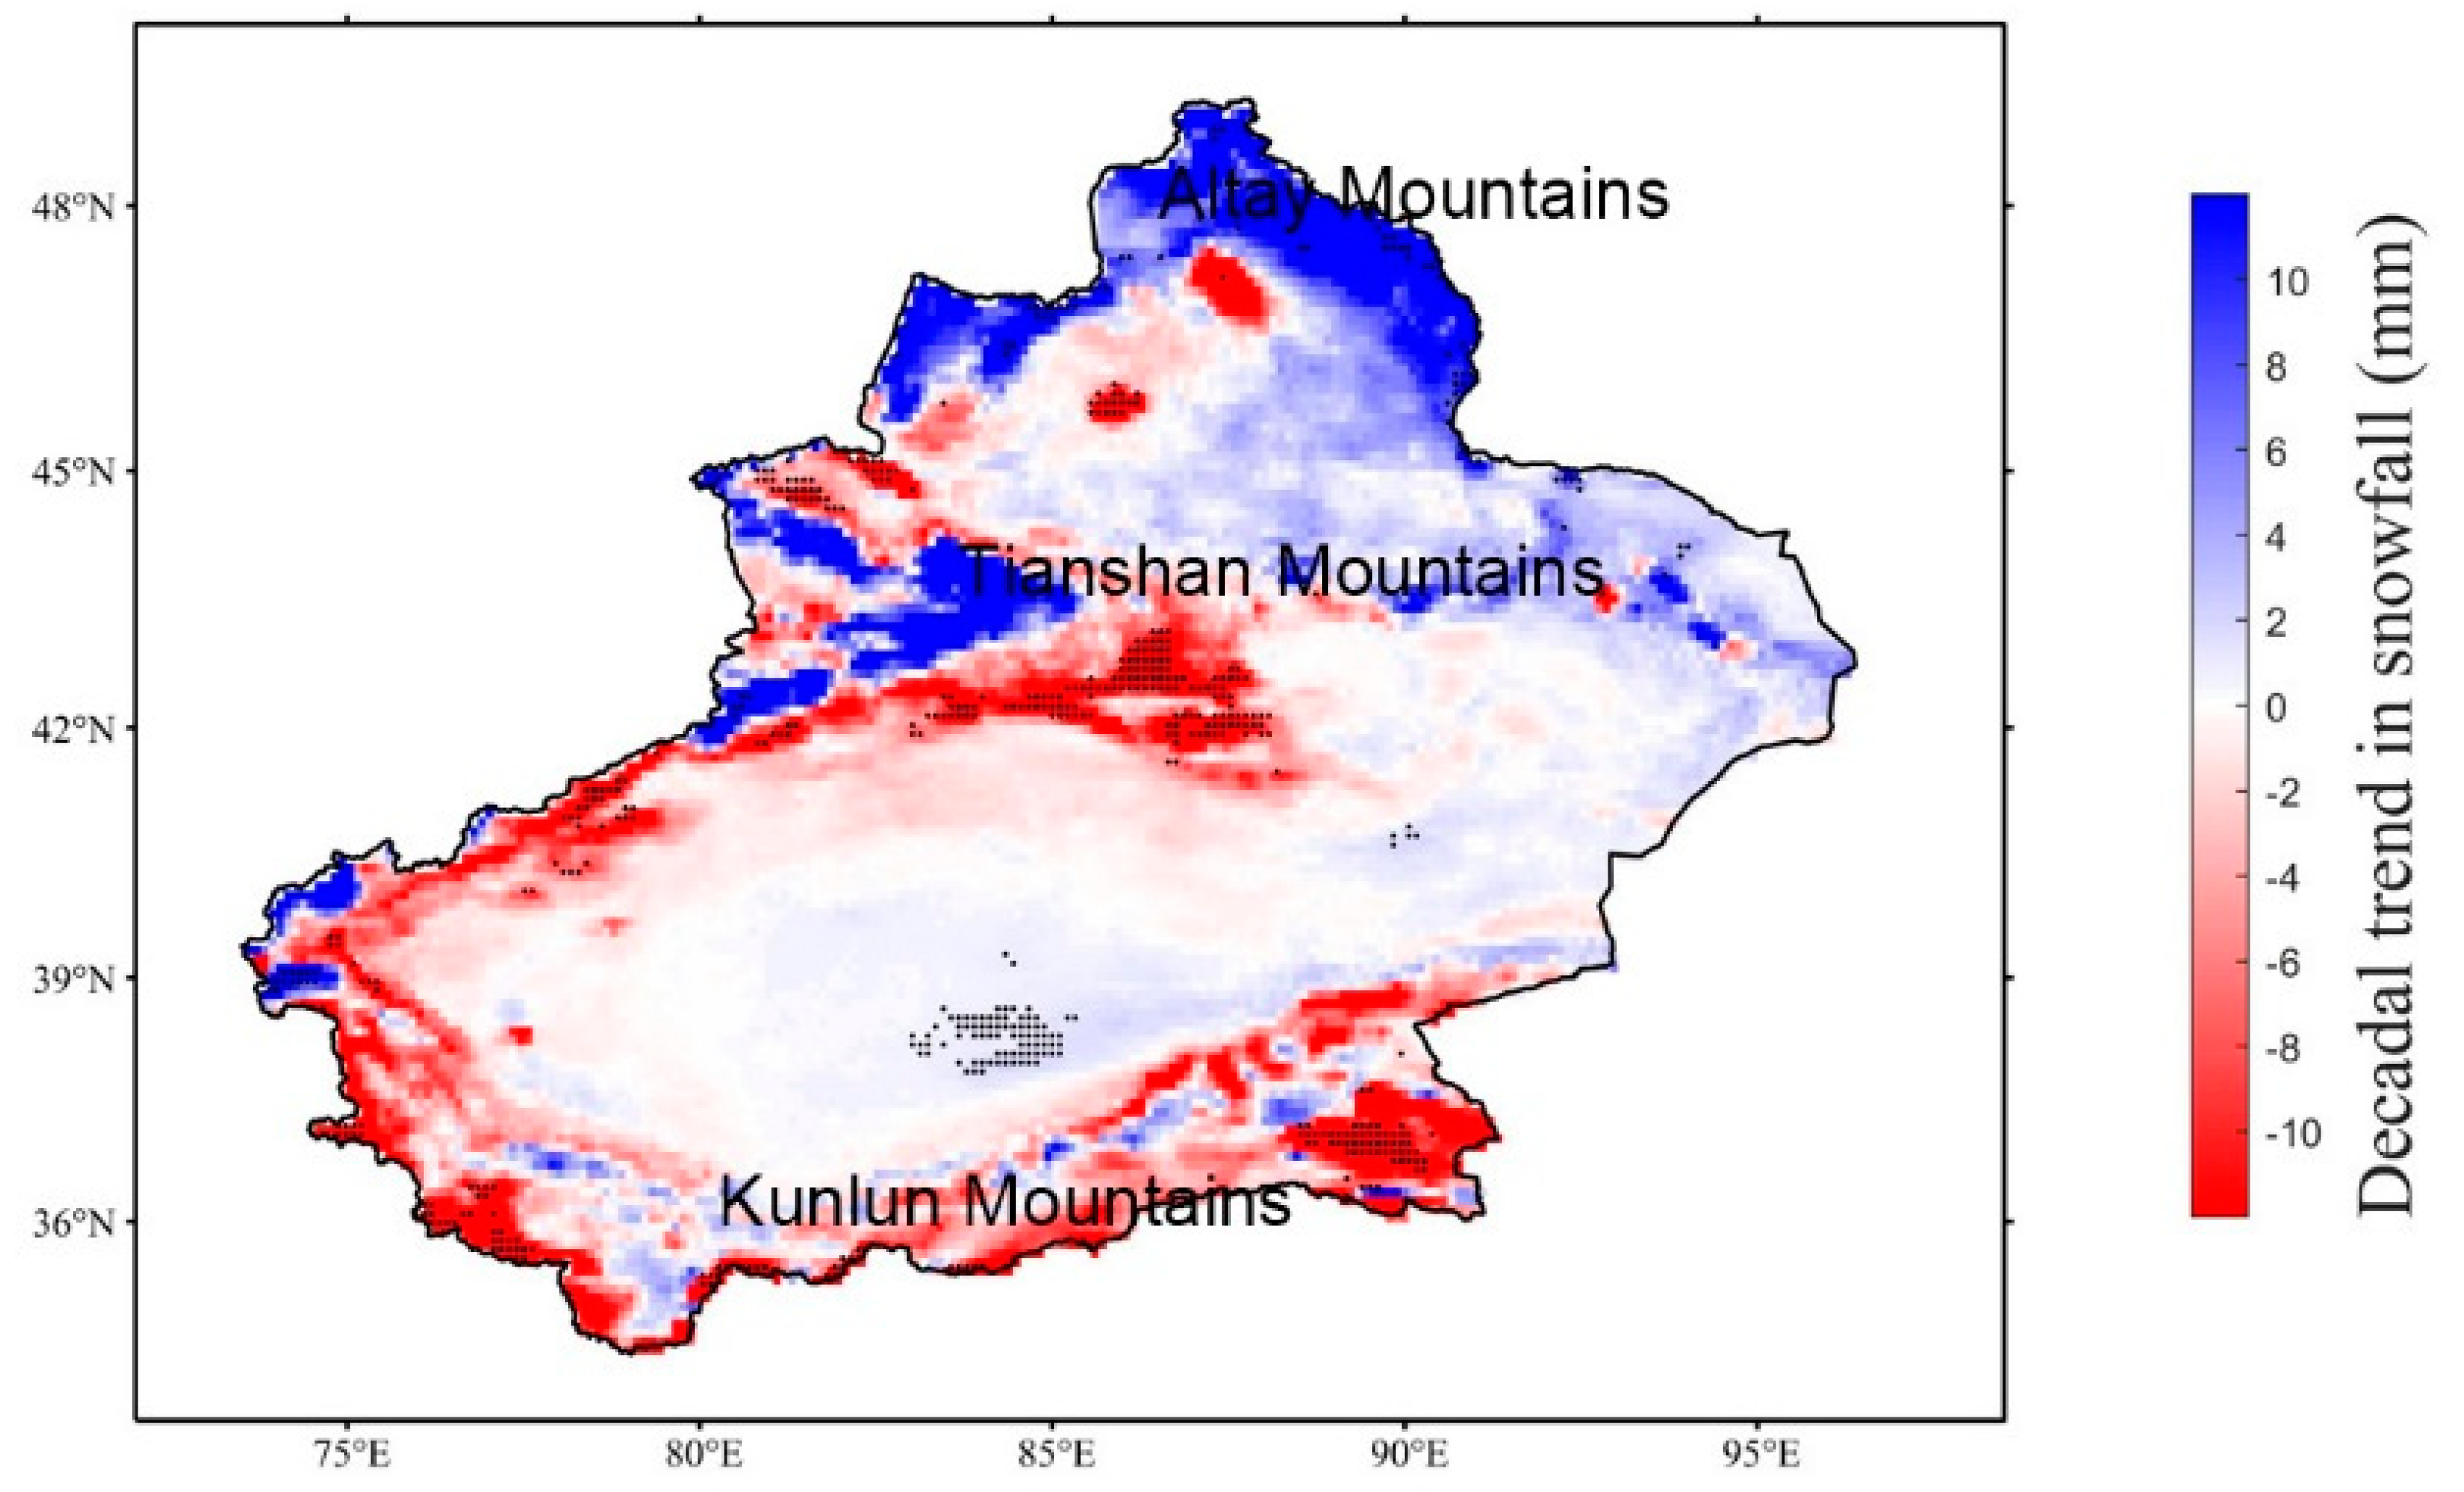
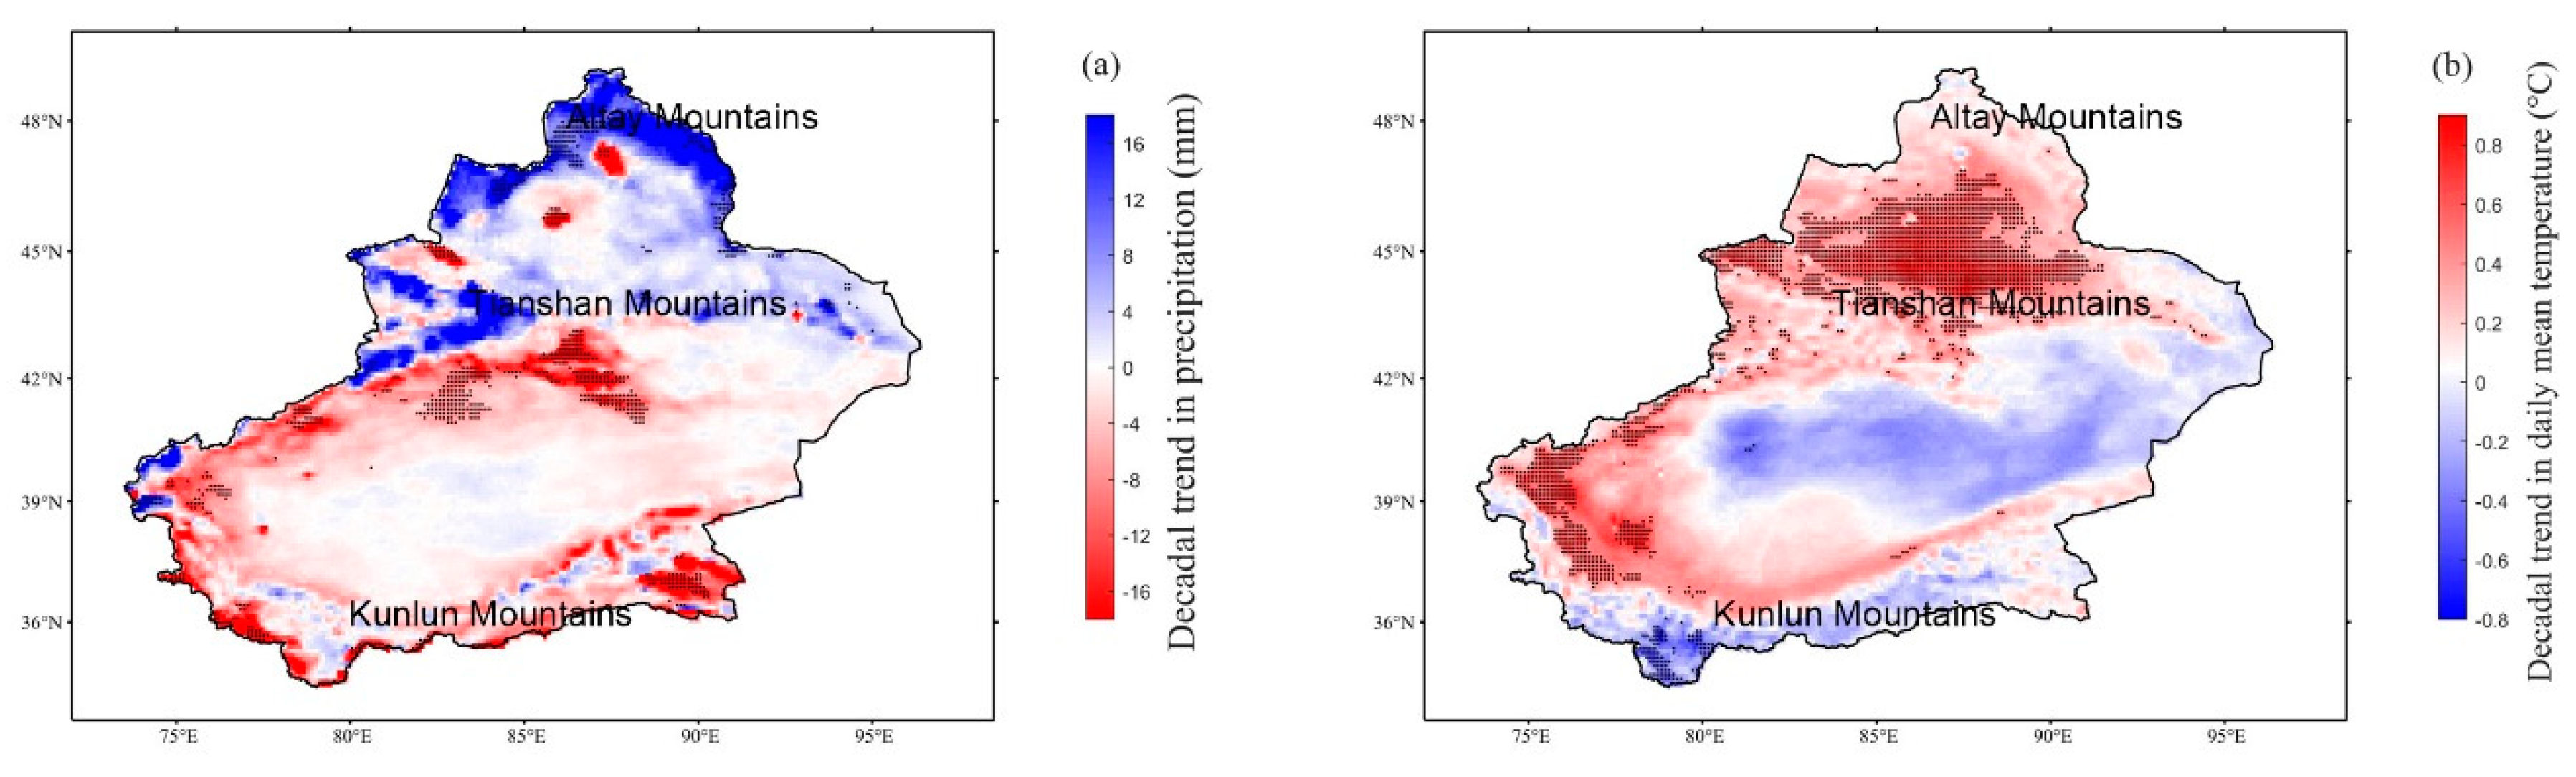
3.2. Climatology and Changes of Snowfall over Xinjiang

Figure 2b shows the spatial distribution of climatology snowfall during the cold season over Xinjiang from 1979 to 2015. High snowfall mainly occurred in the mountainous areas, such as the Tianshan Mountains, the Kunlun Mountains, and the Altay Mountains, while low values were exhibited in the Tarim Basin and the Junggar Basin. The spatial distribution of changes in snowfall during 1979–2015 is shown in Figure 3. Changes were defined as the linear regression slope. The snowfall varied in different regions, although the snowfall revealed no significant decreasing trend in Xinjiang during last decades. Significantly decreasing trends were found in the high-elevation regions of the Kunlun Mountains, and the middle and south slope of the Tianshan Mountains. However, dramatic increases occurred in the Altay Mountains, as well as in the Ili Valley and low-elevation regions of the Kunlun Mountains. There also existed a slightly increasing trend in the Junggar Basin.

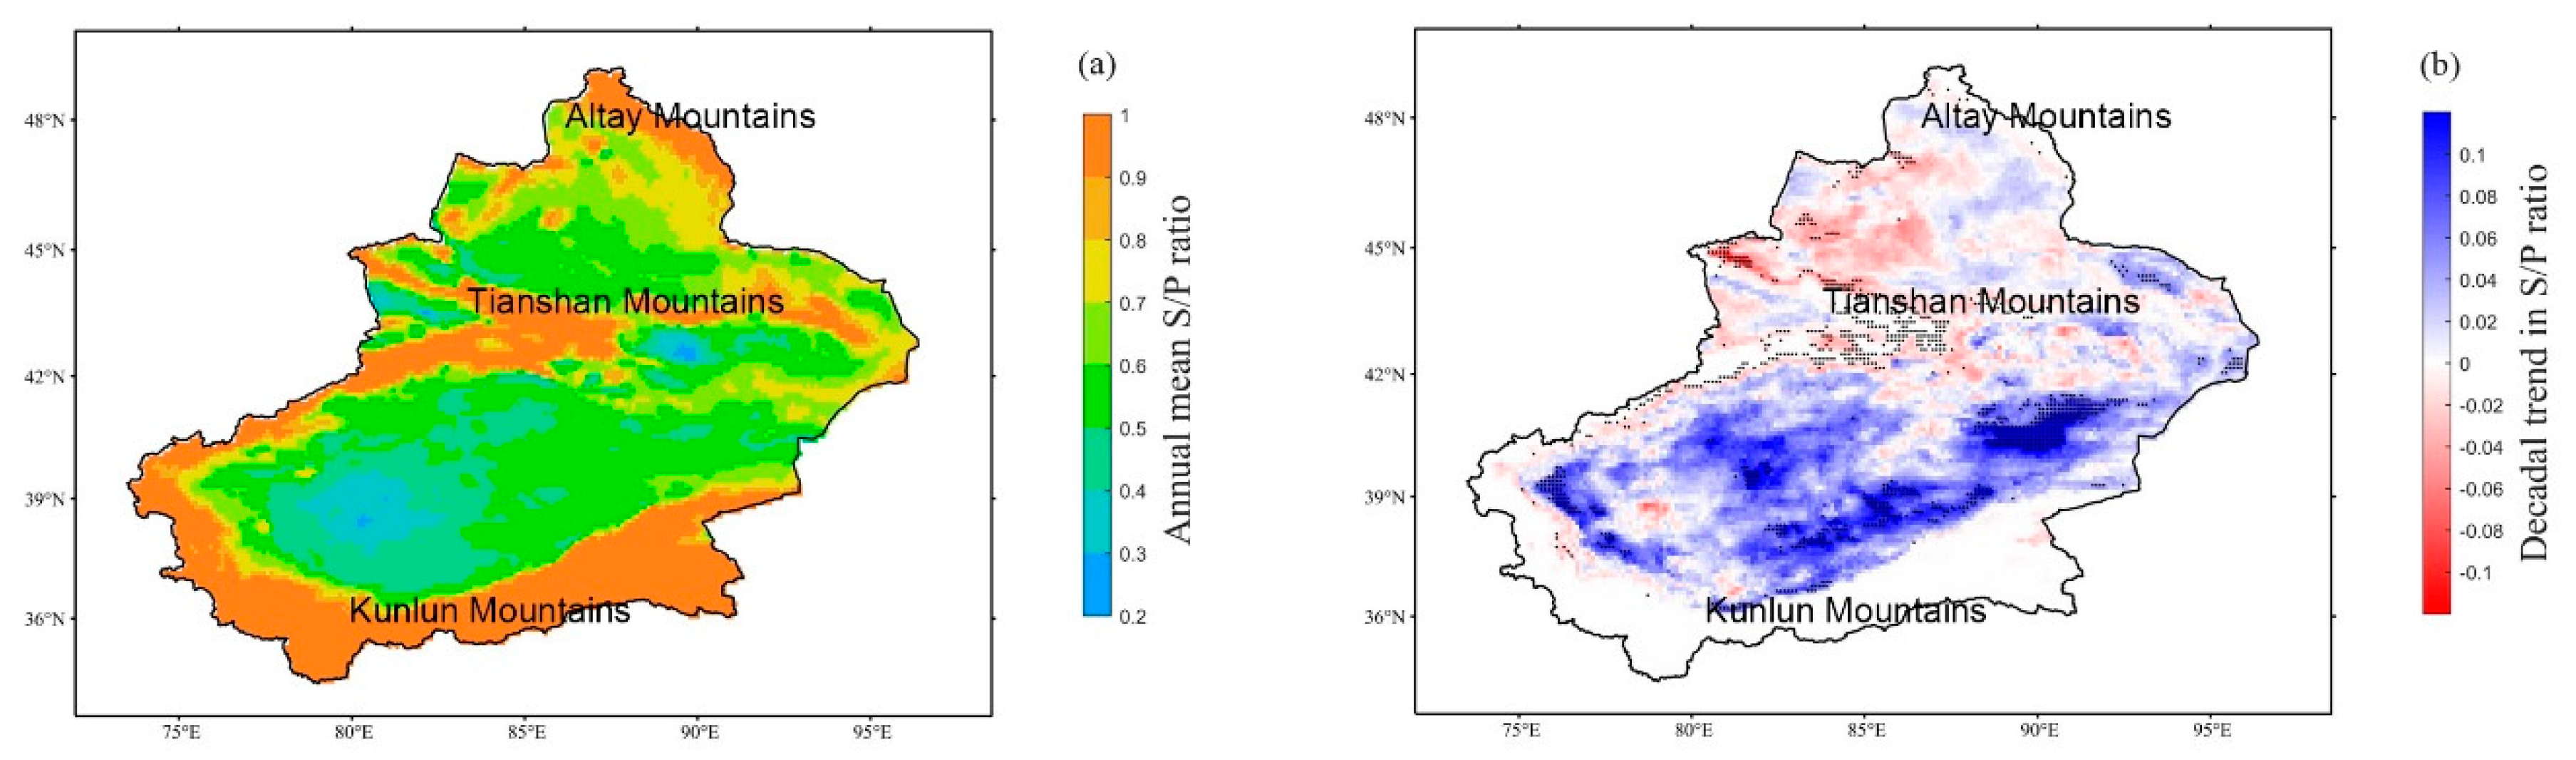
3.3. Climatology and Changes of S/P Ratio over Xinjiang

Figure 4 displays the spatial distribution of climatology and changes in the S/P ratio during the cold season from 1979 to 2015 over Xinjiang. The distribution of S/P ratio is similar to that of snowfall, with high values occurring in the Mountains and high-elevation regions, but low values observed in basins and valleys. The value of the S/P ratio was near 1 at an elevation above 3500 m, where the temperature is often below 0 °C. The S/P ratio slightly increased during the past decades in Xinjiang. Based on the results of the Mann-Kendall test, the S/P ratios estimated by the WRF model did not show a significant change at a level of 0.10 in the study area. As illustrated in Figure 4b, the changes of S/P ratio also varied in different regions, which was similar to the distribution of the changes of snowfall. The ratio had a rising trend in low-elevation regions, such as the Tarim Basin and the Junggar Basin, but a decreasing trend in relative high-elevation regions, such as the Tianshan Mountains, the Altay Mountains, and the western edge of the Junggar Basin.

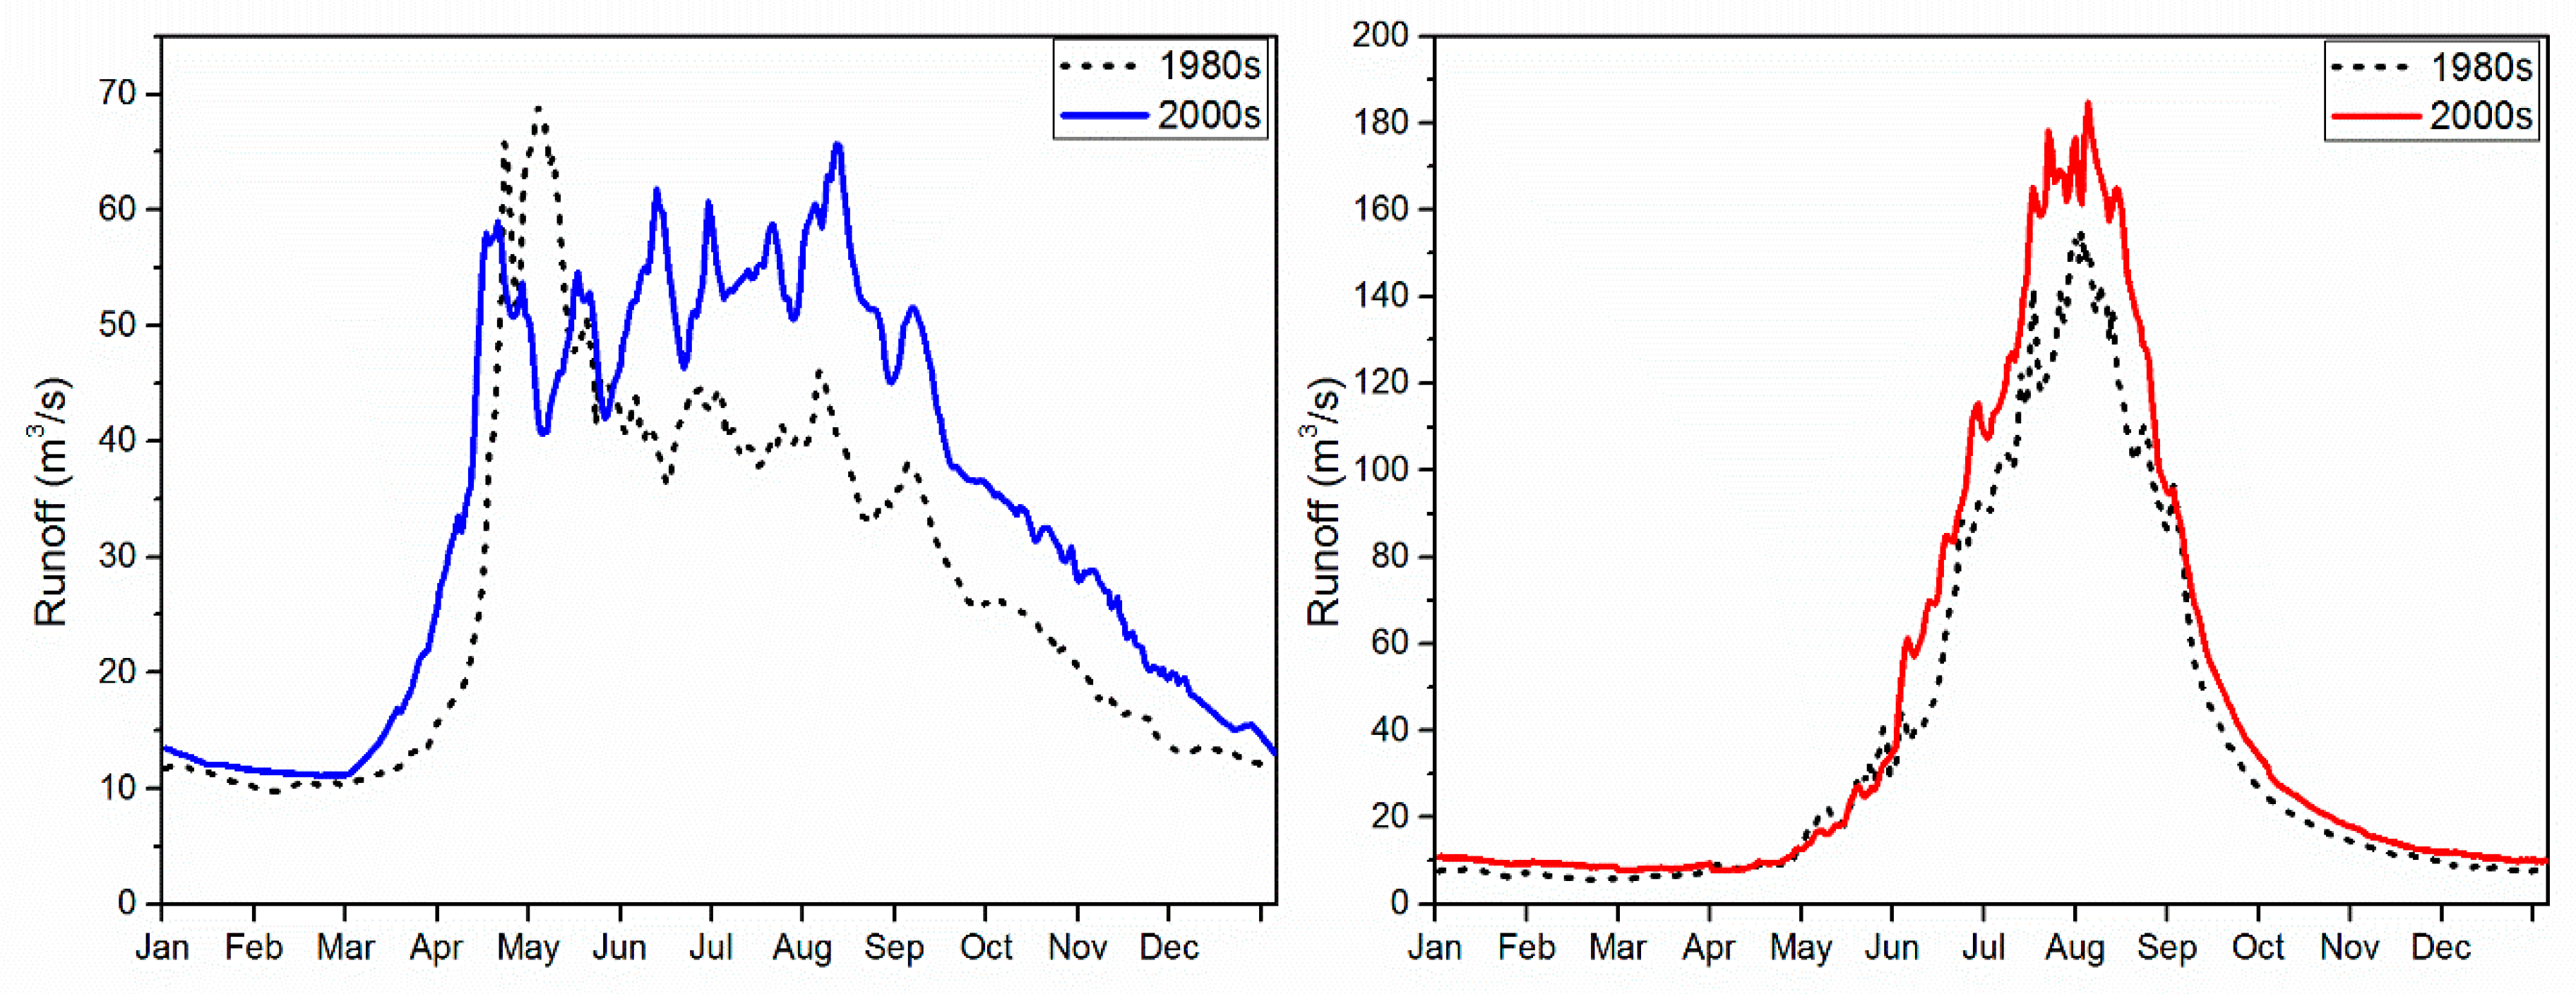
3.4. Changes in Hydrological Processes in the Tianshan Mountains

The runoff time series between the 1980s and 2000s from two hydrological stations at the two river basins in the Tianshan Mountains are shown in Figure 5. The annual runoff significantly increased from 1979 to 2011 by 17.4% and 20.4% in Manas River Basin and Kaidu River Basin, respectively. The runoffs in the two river basins all exhibited decreasing trends in spring, but increasing trends in summer and autumn. For both river basins, insignificant trends were found in the runoff during winter. In addition, an earlier melt was found in the Bayanbulak station at Kaidu River Basin. Compared with the 1980s, about five days in advance were observed in Bayanbulak stations in the 2000s.

4. Discussion

4.1. Performance of WRF

The WRF outputs were evaluated with in-situ observation and the CN05.1 dataset on point-scale and spatial distribution, respectively. The bias values of temperature ranged from −2.02 °C to 1.16 °C in the WRF simulations, which was more consistent with the observations from −0.5 °C to 4 °C of Tang et al. [32]. It is noted that WRF generally overestimated precipitation compared with in-situ observations, especially in the alpine region and lake area. It indicated that the simulated precipitation in this study was very reliable in the basins and low-elevation regions, while the overestimation leading to more uncertainty occurred in high-elevation regions. This uncertainty may result from various sources, not only by overestimation of the model, but also possibly from the underestimation of in-situ observations that were caused by the snowdrift and sublimation in the alpine area. The underestimation of rain gauges caused by measurement errors for solid precipitation has frequently exceeded 50% in alpine areas [51,52]. On the other hand, some studies reported that the WRF model produced strong wet biases in precipitation over China, with overestimation exceeding 150% against in-situ observations in some regions [30,32,53,54]. However, the simulation from WRF was close to the snowfall records which were required for the maintenance of glaciers in the Karakoram Mountains (above 4 km a.s.l.) [33].
The distribution of in-situ observations is uneven over the study area, especially in alpine regions. Therefore, the observation datasets might increase the uncertainty and representativeness of data in the study area. The same problem existed in observation-based gridded rainfall data (CN05.1). Although more than 2400 stations were used to extrapolate the data across China in the CN05.1 dataset, stations were still not enough in the western China for efficient extrapolation. The gridded rainfall data is also too coarse to capture the orographic precipitation patterns, due to the complex topography of Xinjiang. Previous studies documented that the WRF model performed reasonably at rainfall predicting of a single precipitation event [30], as well as the climatological precipitation pattern and interannual precipitation variability with a fine resolution [33,55]. In this study, the results of WRF and CN05.1 have similar distributions in snowfall amount, and the WRF model could achieve higher-resolution grids data (12 km in this study) than the CN05.1 dataset, and capture more details of spatial snowfall features. Additionally, based on dynamic processes, the WRF model can exhibit precipitation events in areas that lack in-situ observations. As a result, WRF output prevailed over in-situ observations and CN05.1 in characterizing the long-term spatiotemporal distribution of snowfall and the S/P ratio, and offered a convincing basis for analysis of the long-term and large-scale variation of snowfall, particularly over large vertical gradient and complex topography regions.

4.2. Spatiotemporal Variations of Snowfall and S/P Ratio

A decreased S/P ratio could be explained by snowfall decreases that were proportionally larger than decreases in rainfall, constant snowfall, and increasing rainfall, or increases in both, but larger increases in rainfall than snowfall. However, an increasing S/P ratio may be caused by increasing snowfall or decreasing rainfall. Although changes in snowfall more closely paralleled the pattern of S/P ratio trends, the total precipitation had a weak correlation with the S/P ratio [15]. In addition, the relative changes in snowfall and precipitation contributed together to the variation of the S/P ratio [13]. According to Figure 3b and Figure 6a, the variations of snowfall and precipitation were similar, but had different magnitudes, in the study area. The precipitation mainly occurred as snowfall at an elevation above 3500 m.
In this study, the trends of the S/P ratio were the opposite for the low-elevation regions and mountains. The decreasing variability of the S/P ratio was because of the decline in precipitation more than that of snowfall in the relative high-elevation Tianshan Mountains. Additionally, although both snowfall and precipitation increased at the western edge of the Junggar Basin, the S/P ratio exhibited a downward trend. This could be because increasing snowfall would offset a portion of decreased snowfall that was caused by the warming temperature in this region (see Figure 6b). The fall of the S/P ratio in the Tianshan Mountains was also reported in a previous study by Guo and Li [13]. The rise in S/P ratio was caused by the increase in both the snowfall and precipitation, but was larger for snowfall than precipitation in the Tarim Basin. However, the S/P ratios have also changed a little at elevations above 3500 m, where the temperature is often far below 0 °C, such as the Kunlun Mountains.

4.3. Water Resources Management in Different Regions Based on Current Findings

The Manas River Basin and Kaidu River Basin are located in the decreasing S/P ratio regions. The correlation coefficients between the S/P ratio and runoff were −0.52 (p < 0.05) and −0.65 (p < 0.05) in the Manas River Basin and Kaidu River Basin, respectively. This negative correlation indicated that the larger runoff was associated with the lower S/P ratio during the cold season, with a larger impact on the runoff of the Kaidu River Basin. Under climate change, the change in snowfall and S/P ratio has implications for the water resources, which poses a serious challenge to the water resources management authorities.
In the decreasing S/P ratio regions, by the 2000s, both the changes in runoff magnitude and shift of intra-annual patterns in runoff were found in the river basins in the Tianshan Mountains with respect to the 1980s level. More rainfall than snowfall in late winter and spring implies an increase in temperature, which may influence the peak river runoff and promote the risks of early snowmelt in spring in the decreasing S/P ratio regions [10,11,56]. For the snowmelt-recharged river, the runoff of the Kaidu River showed an earlier occurrence of maximum snow melt and glacial recharge. However, for the glacial melt-recharged river, the runoff of the Manas River showed an increasing trend when comparing the 1980s with the 2000s level. Both the changes in runoff magnitude and shift of intra-annual patterns in runoff were in line with the decreasing S/P ratio. On the other hand, in the increasing S/P ratio regions, the runoffs of headwaters of the Tarim River significantly increased over the past decades in winter, spring, and summer [57]. In addition, strong fluctuation in river runoffs from the three main water systems of the Tarim River were observed during the past decades [58]. However, the runoff from Tarim River is expected to increase in the period 2010–2039, but reduce in 2070–2099 with the shrinking of glaciers [59].
As a result, it is important to allocate the annual water resources in the decreasing S/P ratio regions, including the Tianshan Mountains, which can reduce the influence on farm land and grass land. By contrary, more snowfall in winter would trigger more floods in spring and summer in the increasing S/P ratio regions, which occurred in the Tarim Basin and the region to its east. Although flooding could cause damage to agricultural development and the rural residential area, it would also provide water resources for these regions where precipitation hardly contributed throughout the year, and play an important role in maintaining ecosystem stability in these regions.

5. Conclusions

In this study, the WRF model outputs were used to dynamically downscale and evaluate the long-term variation of snowfall and S/P ratio in Xinjiang, China. The results showed that the snowfall displayed complex spatial patterns concerning its long-term variation, with an increase in the southern edge of the Tarim Basin, the Ili Valley, and the Altay Mountains, but a decrease in the Tianshan Mountains and the Kunlun Mountains. The S/P ratio experienced an increasing trend in low-elevation regions, such as the Tarim Basin and the Junggar Basin, but the opposite trends were identified in relatively high-elevation regions, such as the Altay Mountains, the Tianshan Mountains, and the western edge of the Junggar Basin. However, the S/P ratios have also changed a little at elevations above 3500 m, where the temperature is often far below 0 °C, such as the Kunlun Mountains. The increasing runoff was in line with the decreasing S/P ratio in Kaidu River Basin and Manas River Basin, due to the negative correlation between the S/P ratio and the runoff during the cold season. It is important to allocate the annual water resources in the decreasing S/P ratio regions, because both the runoff magnitude and intra-annual patterns in runoff were changed in this region. Validation of WRF outputs proved that the outputs agreed fairly well with in-situ observations and the CN05.1 dataset. The model captured most details of the precipitation distribution and the results can be used for assessing the impacts of climate change on snowfall and water resources. However, since the uncertainty exists in the evaluation of simulating precipitation at high altitude and a complex topography area, more parameterization schemes and boundary conditions are also needed for investigating the regional climate change in complex topography areas. A series of sensitivity studies are also needed to improve the accuracy of the simulations. In addition, it is necessary to couple a physically-based hydrological model with the WRF model for the estimation of runoff changes.

Author Contributions

L.L. and Q.L. conceived the original design of the work. Q.L. and L.L. wrote the paper. Q.L. and T.Y. analyzed all of the data and created all the tables and figures. Z.Q. provided comments on the paper.

Funding

This research was funded by the projects jointly-funded by Xinjiang and National Natural Science Foundation of China (Grant No: U1703241), the National Natural Science Foundation of China (Grant No. 41501050), and the National Project of Investigation of Basic Resources for Science and Technology (Grant No. 2017FY100501). We are grateful to the support from the Tianshan Station for Snow cover and Avalanche Research, Chinese Academy of Sciences, for data collection and analysis.

Conflicts of Interest

The authors declare no conflict of interest.

References

  1. Groisman, P.Y.; Karl, T.R.; Knight, R.W.; Stenchikov, G.L. Changes of snow cover, temperature, and radiative heat balance over the Northern Hemisphere. J. Clim. 1994, 7, 1633–1656. [Google Scholar] [CrossRef]
  2. Simonovic, S.P.; Li, L.H. Sensitivity of the Red River basin flood protection system to climate variability and change. Water Resour. Manag. 2004, 18, 89–110. [Google Scholar] [CrossRef]
  3. Brown, R.D.; Mote, P.W. The response of Northern Hemisphere snow cover to a changing climate. J. Clim. 2009, 22, 2124–2145. [Google Scholar] [CrossRef]
  4. Brown, R.D. Northern Hemisphere Snow Cover Variability and Change, 1915–1997. J. Clim. 2000, 13, 2339–2355. [Google Scholar] [CrossRef]
  5. Derksen, C.; Brown, R. Spring snow cover extent reductions in the 2008–2012 period exceeding climate model projections. Geophys. Res. Lett. 2012, 39, 1–6. [Google Scholar] [CrossRef]
  6. Mudryk, L.R.; Kushner, P.J.; Derksen, C. Interpreting observed northern hemisphere snow trends with large ensembles of climate simulations. Clim. Dyn. 2014, 43, 345–359. [Google Scholar] [CrossRef]
  7. McCabe, G.J.; Wolock, D.M. Long-term variability in Northern Hemisphere snow cover and associations with warmer winters. Clim. Chang. 2010, 99, 141–153. [Google Scholar] [CrossRef]
  8. Berghuijs, W.R.; Woods, R.A.; Hrachowitz, M. A precipitation shift from snow towards rain leads to a decrease in streamflow-supplement. Nat. Clim. Chang. 2014, 4, 583–586. [Google Scholar] [CrossRef]
  9. Hatchett, B.J.; Daudert, B.; Garner, C.B.; Oakley, N.S.; Putnam, A.E.; White, A.B. Winter snow level rise in the Northern Sierra Nevada from 2008 to 2017. Water (Switzerland) 2017, 9, 899. [Google Scholar] [CrossRef]
  10. Beniston, M.; Stoffel, M. Rain-on-snow events, floods and climate change in the Alps: Events may increase with warming up to 4 °C and decrease thereafter. Sci. Total Environ. 2016, 571, 228–236. [Google Scholar] [CrossRef] [PubMed]
  11. McCabe, G.J.; Clark, M.P.; Hay, L.E. Rain-on-Snow Events in The Western United States. Bull. Am. Meteorol. Soc. 2007, 88, 319–328. [Google Scholar] [CrossRef]
  12. Harpold, A.A.; Kaplan, M.L.; Zion Klos, P.; Link, T.; McNamara, J.P.; Rajagopal, S.; Schumer, R.; Steele, C.M. Rain or snow: Hydrologic processes, observations, prediction, and research needs. Hydrol. Earth Syst. Sci. 2017, 21, 1–22. [Google Scholar] [CrossRef]
  13. Guo, L.; Li, L. Variation of the proportion of precipitation occurring as snow in the Tian Shan Mountains, China. Int. J. Climatol. 2015, 35, 1379–1393. [Google Scholar] [CrossRef]
  14. Huntington, T.G.; Hodgkins, G.A.; Keim, B.D.; Dudley, R.W. Changes in the proportion of precipitation occurring as snow in New England (1949–2000). J. Clim. 2004, 17, 2626–2636. [Google Scholar] [CrossRef]
  15. Knowles, N.; Dettinger, M.D.; Cayan, D.R. Trends in snowfall versus rainfall in the western United States. J. Clim. 2006, 19, 4545–4559. [Google Scholar] [CrossRef]
  16. Przybylak, R. Variability of total and solid precipitation in the Canadian Arctic from 1950 to 1995. Int. J. Climatol. 2002, 22, 395–420. [Google Scholar] [CrossRef] [Green Version]
  17. Serquet, G.; Marty, C.; Dulex, J.-P.; Rebetez, M. Seasonal trends and temperature dependence of the snowfall/precipitation-day ratio in Switzerland. Geophys. Res. Lett. 2011, 38, 14–18. [Google Scholar] [CrossRef]
  18. Yang, J.; Fang, G.; Chen, Y.; De-Maeyer, P. Climate change in the Tianshan and northern Kunlun Mountains based on GCM simulation ensemble with Bayesian model averaging. J. Arid Land 2017, 9, 622–634. [Google Scholar] [CrossRef]
  19. Littell, J.S.; McAfee, S.A.; Hayward, G.D. Alaska snowpack response to climate change: Statewide snowfall equivalent and snowpack water scenarios. Water (Switzerland) 2018, 10. [Google Scholar] [CrossRef]
  20. Li, Z.; Chen, Y.; Li, W.; Deng, H.; Fang, G. Potential impacts of climate change on vegetation dynamics in Central Asia. J. Geophys. Res. Atmos. 2015, 120, 345–356. [Google Scholar] [CrossRef]
  21. Li, X.; Jiang, F.; Li, L.; Wang, G. Spatial and temporal variability of precipitation concentration index, concentration degree and concentration period Xinjiang, China. Int. J. Climatol. 2011, 31, 1679–1693. [Google Scholar] [CrossRef]
  22. Zhang, F.; Bai, L.; Li, L.; Wang, Q. Sensitivity of runoff to climatic variability in the northern and southern slopes of the Middle Tianshan Mountains, China. J. Arid Land 2016, 8, 681–693. [Google Scholar] [CrossRef]
  23. Chen, Y.; Li, Z.; Fan, Y.; Wang, H.; Deng, H. Progress and prospects of climate change impacts on hydrology in the arid region of northwest China. Environ. Res. 2015, 139, 11–19. [Google Scholar] [CrossRef] [PubMed]
  24. Xu, M.; Kang, S.; Wu, H.; Yuan, X. Detection of spatio-temporal variability of air temperature and precipitation based on long-term meteorological station observations over Tianshan Mountains, Central Asia. Atmos. Res. 2018, 203, 141–163. [Google Scholar] [CrossRef]
  25. Chen, Y.; Li, W.; Deng, H.; Fang, G.; Li, Z. Changes in Central Asia’s Water Tower: Past, Present and Future. Sci. Rep. 2016, 6, 1–12. [Google Scholar] [CrossRef] [PubMed]
  26. Chen, Y.; Li, Z.; Fang, G.; Li, W. Large Hydrological Processes Changes in the Transboundary Rivers of Central Asia. J. Geophys. Res. Atmos. 2018, 5059–5069. [Google Scholar] [CrossRef]
  27. Groisman, P.Y.; Koknaeva, V.V.; Belokrylova, T.A.; Karl, T.R. Overcoming Biases of Precipitation Measurement: A History of the USSR Experience. Bull. Am. Meteorol. Soc. 1991, 72, 1725–1733. [Google Scholar] [CrossRef] [Green Version]
  28. Adam, J.C. Adjustment of global gridded precipitation for systematic bias. J. Geophys. Res. 2003, 108, 1–15. [Google Scholar] [CrossRef]
  29. Adam, J.C.; Clark, E.A.; Lettenmaier, D.P.; Wood, E.F. Correction of global precipitation products for orographic effects. J. Clim. 2006, 19, 15–38. [Google Scholar] [CrossRef]
  30. Maussion, F.; Scherer, D.; Finkelnburg, R.; Richters, J.; Yang, W.; Yao, T. Sciences WRF simulation of a precipitation event over the Tibetan Plateau, China—An assessment using remote sensing and ground observations. Hydrol. Earth Syst. Sci. 2011, 15, 1795–1817. [Google Scholar] [CrossRef]
  31. Gao, Y.; Xu, J.; Chen, D. Evaluation of WRF mesoscale climate simulations over the Tibetan Plateau during 1979–2011. J. Clim. 2015, 28, 2823–2841. [Google Scholar] [CrossRef]
  32. Tang, J.; Niu, X.; Wang, S.; Gao, H.; Wang, X.; Wu, J. Statistical downscaling and dynamical downscaling of regional climate in China: Present climate evaluations and future climate projections. J. Geophys. Res. Atmos. 2016, 121, 2110–2129. [Google Scholar] [CrossRef]
  33. Norris, J.; Carvalho, L.M.V.; Jones, C.; Cannon, F.; Bookhagen, B.; Palazzi, E.; Tahir, A.A. The spatiotemporal variability of precipitation over the Himalaya: Evaluation of one-year WRF model simulation. Clim. Dyn. 2016, 1–26. [Google Scholar] [CrossRef]
  34. Lee, J.; Choi, J.; Lee, O.; Yoon, J.; Kim, S. Estimation of probable maximum precipitation in Korea using a regional climate model. Water (Switzerland) 2017, 9, 240. [Google Scholar] [CrossRef]
  35. Rasmussen, R.; Liu, C.; Ikeda, K.; Gochis, D.; Yates, D.; Chen, F.; Tewari, M.; Barlage, M.; Dudhia, J.; Yu, W.; et al. High-resolution coupled climate runoff simulations of seasonal snowfall over Colorado: A process study of current and warmer climate. J. Clim. 2011, 24, 3015–3048. [Google Scholar] [CrossRef]
  36. Zhang, F.; Ahmad, S.; Zhang, H.; Zhao, X.; Feng, X.; Li, L. Simulating low and high streamflow driven by snowmelt in an insufficiently gauged alpine basin. Stoch. Environ. Res. Risk Assess. 2016, 30, 59–75. [Google Scholar] [CrossRef]
  37. Yu, M.; Chen, X.; Li, L.; Bao, A.; De, M.J. Incorporating accumulated temperature and algorithm of snow cover calculation into the snowmelt runoff model. Hydrol. Process. 2013, 3595, 3589–3595. [Google Scholar] [CrossRef]
  38. Li, X.; Li, L.; Guo, L.; Zhang, F.; Adsavakulchai, S.; Shang, M. Impact of climate factors on runoff in the Kaidu River watershed: Path analysis of 50-year data. J. Arid Land 2011, 3, 132–140. [Google Scholar] [CrossRef]
  39. Kain, J.S. The Kain–Fritsch Convective Parameterization: An Update. J. Appl. Meteorol. 2004, 43, 170–181. [Google Scholar] [CrossRef]
  40. Mlawer, E.J.; Taubman, S.J.; Brown, P.D.; Iacono, M.J.; Clough, S.A. Radiative transfer for inhomogeneous atmospheres: RRTM, a validated correlated-k model for the longwave. J. Geophys. Res. 1997, 102, 16663. [Google Scholar] [CrossRef]
  41. Dudhia, J. Numerical Study of Convection Observed during the Winter Monsoon Experiment Using a Mesoscale Two-Dimensional Model. J. Atmos. Sci. 1989, 46, 3077–3107. [Google Scholar] [CrossRef] [Green Version]
  42. Chen, F.; Dudhia, J. Coupling an Advanced Land Surface–Hydrology Model with the Penn State–NCAR MM5 Modeling System. Part I: Model Implementation and Sensitivity. Mon. Weather Rev. 2001, 129, 569–585. [Google Scholar] [CrossRef]
  43. Hong, S.; Lim, J. The WRF single-moment 6-class microphysics scheme (WSM6). J. Korean Meteorol. Soc. 2006, 42, 129–151. [Google Scholar]
  44. Xie, P.; Chen, M.; Fukushima, Y.; Yang, S.; Liu, C.; Yatagai, A.; Hayasaka, T. A Gauge-Based Analysis of Daily Precipitation over East Asia. J. Hydrometeorol. 2007, 8, 607–626. [Google Scholar] [CrossRef] [Green Version]
  45. Xu, Y.; Gao, J.; Shen, Y.; Xu, C.; Shi, Y.; Giorgi, F. A Daily Temperature Dataset over China and Its Application in Validating a RCM Simulation. Adv. Atmos. Sci. 2009, 26, 763–772. [Google Scholar] [CrossRef]
  46. Dai, A. Temperature and pressure dependence of the rain-snow phase transition over land and ocean. Geophys. Res. Lett. 2008, 35, 1–7. [Google Scholar] [CrossRef]
  47. Jennings, K.S.; Winchell, T.S.; Livneh, B.; Molotch, N.P. Spatial variation of the rain-snow temperature threshold across the Northern Hemisphere. Nat. Commun. 2018, 9, 1–9. [Google Scholar] [CrossRef] [PubMed]
  48. Gupta, H.V. Status of automatic calibration for hydrologic models: Comparison with multilevel expert calibration. J. Hydrol. Eng. 1999, 135–143. [Google Scholar] [CrossRef]
  49. Yue, S.; Pilon, P.; Cavadias, G. Power of the Mann-Kendall and Spearman’s rho tests for detecting monotonic trends in hydrological series. J. Hydrol. 2002, 259, 254–271. [Google Scholar] [CrossRef]
  50. Hamed, K.H. Trend detection in hydrologic data: The Mann-Kendall trend test under the scaling hypothesis. J. Hydrol. 2008, 349, 350–363. [Google Scholar] [CrossRef]
  51. Rasmussen, R.; Baker, B.; Kochendorfer, J.; Meyers, T.; Landolt, S.; Fischer, A.P.; Black, J.; Thériault, J.M.; Kucera, P.; Gochis, D.; et al. How well are we measuring snow: The NOAA/FAA/NCAR winter precipitation test bed. Bull. Am. Meteorol. Soc. 2012, 93, 811–829. [Google Scholar] [CrossRef]
  52. Grossi, G.; Lendvai, A.; Peretti, G.; Ranzi, R. Snow precipitation measured by gauges: Systematic error estimation and data series correction in the central Italian Alps. Water (Switzerland) 2017, 9, 461. [Google Scholar] [CrossRef]
  53. Yu, E.; Sun, J.; Chen, H.; Xiang, W. Evaluation of a high-resolution historical simulation over China: Climatology and extremes. Clim. Dyn. 2015, 45, 2013–2031. [Google Scholar] [CrossRef]
  54. Ma, J.; Wang, H.; Fan, K. Dynamic downscaling of summer precipitation prediction over China in 1998 using WRF and CCSM4. Adv. Atmos. Sci. 2015, 32, 577–584. [Google Scholar] [CrossRef]
  55. Marteau, R.; Richard, Y.; Pohl, B.; Smith, C.C.; Castel, T. High-resolution rainfall variability simulated by the WRF RCM: Application to eastern France. Clim. Dyn. 2014, 44, 1093–1107. [Google Scholar] [CrossRef]
  56. Barnett, T.P.; Adam, J.C.; Lettenmaier, D.P. Potential impacts of a warming climate on water availability in snow-dominated regions. Nature 2005, 438, 303–309. [Google Scholar] [CrossRef] [PubMed]
  57. Duethmann, D.; Bolch, T.; Farinotti, D.; Kriegel, D.; Vorogushyn, S.; Merz, B.; Pieczonka, T.; Jiang, T.; Su, B.; Güntner, A. Attribution of streamflow trends in snow-and glacier melt dominated catchments of the Tarim River, Central Asia. Water Resour. Res. 2015, 51, 4727–4750. [Google Scholar] [CrossRef]
  58. Wang, H.; Chen, Y.; Li, W. Characteristics in streamflow and extremes in the Tarim River, China: Trends, distribution and climate linkage. Int. J. Climatol. 2015, 35, 761–776. [Google Scholar] [CrossRef]
  59. Duethmann, D.; Menz, C.; Jiang, T.; Vorogushyn, S. Projections for headwater catchments of the Tarim River reveal glacier retreat and decreasing surface water availability but uncertainties are large. Environ. Res. Lett. 2016, 11. [Google Scholar] [CrossRef]
Figure 1. Study area. (a) Distribution of meteorological stations, (b) annual precipitation (mm), (c) annual temperature (°C).
Water 10 01463 g001aWater 10 01463 g001b
Figure 2. Spatial distributions of climatology snowfall during the cold season (mm). (a) is CN05.1, (b) is WRF.
Water 10 01463 g002
Figure 3. Spatial distribution variation of snowfall time series of WRF during the cold season from 1979 to 2015. Black dots represent significance at the 0.05 level.
Water 10 01463 g003
Figure 4. Spatial distribution of climatology (a) and variation (b) of the S/P ratio in Xinjiang revealed by WRF from 1979 to 2015. Black dots represent significance at the 0.05 level.
Water 10 01463 g004
Figure 5. Runoff time series between the 1980s and 2000s. Left: the Kaidu River Basin, right: the Manas River Basin.
Water 10 01463 g005
Figure 6. Decadal trends of precipitation (a) and temperature (b) time series of WRF during the cold season from 1979 to 2015. Black dots represent significance at the 0.05 level.
Water 10 01463 g006
Table 1. Bias and RMSE over Xinjiang for annual and seasonal mean temperature and precipitation between WRF simulation and observation. A stands for annual, MAM for March-April-May, SON for September-October-November, and DJF for December-January-February.
Temperature Bias (°C month−1)RMSE (°C month−1)Precipitation Bias (mm month−1)RMSE (mm month−1)
A0.332.447.5415.56
MAM−2.023.5111.1216.85
SON0.812.515.6513.01
DJF1.164.0011.4517.22

