Article

PFASs in Finnish Rivers and Fish and the Loading of PFASs to the Baltic Sea

Finnish Environment Institute, Latokartanonkaari 11, 00790 Helsinki, Finland
*
Author to whom correspondence should be addressed.
Submission received: 14 March 2019 / Revised: 17 April 2019 / Accepted: 18 April 2019 / Published: 25 April 2019
(This article belongs to the Special Issue Emerging Organic Contaminants in Water Ecosystems)

Abstract

:
The concentrations of per- and polyfluoroalkyl substances (PFASs) in the Finnish aquatic environment were measured in riverine waters and in inland, coastal and open sea fish. In addition, the PFAS load to the Baltic Sea from 11 rivers was calculated. Measurements show that PFASs, including restricted perfluorooctane sulfonic acid (PFOS), are widely present in the Finnish aquatic environment. At three out of 45 sampling sites, the concentration of PFOS in fish exceeded the environmental quality standard (EQS) of the Water Framework Directive (WFD). The annual average (AA) ∑23PFAS concentration in surface waters ranged from 1.8 to 42 ng L−1 and the concentration of PFOS exceeded the AA-EQS in three out of 13 water bodies. In European perch (Perca fluviatilis) and Baltic herring (Clupea harengus membras), the ∑PFAS concentration ranged from 0.98 to 1 µg kg−1 f.w. (fresh weight) and from 0.2 to 2.4 µg kg−1 f.w., respectively. The highest concentrations in both surface water and fish were found in waters of southern Finland. The riverine export of ∑10PFAS to the Baltic Sea from individual rivers ranged from 0.4 kg yr−1 to 18 kg yr−1. PFAS concentrations in fish of point-source-polluted sites and coastal sites were higher compared to fish of open sea or diffusely polluted sites. The PFAS profiles in surface waters of background sites were different from other sites. This study shows that PFASs are widely found in the Finnish aquatic environment. Different PFAS profiles in samples from background areas and densely populated areas indicate diverse sources of PFASs. Although atmospheric deposition has a substantial influence on PFAS occurrence in remote areas, it is not the dominant source of all PFASs to the aquatic environment of Finland. Rather, wastewaters and presumably contaminated land areas are major sources of PFASs to this aquatic environment.

1. Introduction

PFASs are used as surfactants in various branches of manufacturing, such as in the metal, textile, paper and electrical industries. In addition, firefighting foams are a major application of PFASs. PFASs end up in the environment from point sources (e.g., wastewater treatment plants (WWTPs)), contaminated land areas (e.g., firefighting training sites, sites where WWTP sludge has been used) or from diffuse sources (e.g., atmospheric deposition, scattered dwellings). However, there are no measurements on atmospheric deposition or a database on the locations of firefighting training areas in Finland.
PFASs are highly persistent in the environment. The estimated photochemical half-life of perfluorooctanoic acid (PFOA) is 256–25,000 years [1]. Perfluorooctane sulfonic acid (PFOS) is extremely recalcitrant against photolysis, hydrolysis and biodegradation [2]. PFASs travel long distances in the atmosphere and some are ubiquitous in the aquatic environment [3], even in remote Arctic areas [4,5,6]. Some PFASs bioaccumulate in aquatic food webs [4], and some PFASs are both acutely and chronically toxic to aquatic organisms [7].
Perfluoroalkyl carboxylic acids (PFCAs) and perfluoroalkyl sulfonic acids (PFSAs) with a carbon length shorter than 7 or 6 carbons, respectively, have relatively low bioconcentration factors (BCFs) [8] and do not accumulate easily in fish tissue. Longer-chained PFASs are more bioaccumulative and tend to bind to particles [7]. Abbreviations of individual compounds are explained in Table 1.
The European Union’s Water Framework Directive (WFD) sets environmental quality standards (EQSs) for PFOS in fish (9.1 µg kg−1 fresh weight (f.w.).) and in fresh waters (annual average (AA) 0.65 ng L−1). The World Health Organization (WHO) recommends a limit of 4 µg L−1 for PFOS and 40 µg L−1 for PFOA in drinking water.
PFOS is already strongly abated in manufacturing industries since it was added to the Stockholm Convention’s list of persistent organic pollutants (POPs) in 2009. In the EU, the use of PFOS is regulated by POPs regulation (EC) No. 850/2004. PFOA and perfluorohexane sulfonic acid (PFHxS) have been nominated to be added to the Stockholm Convention POPs list, and a decision on listing PFOA, its salts and PFOA-related compounds is expected in May 2019. PFOA, PFHxS and PFDA are listed as substances of very high concern (SVHC candidate list) in the EU under REACH (Registration, Evaluation, Authorisation and Restriction of Chemicals) (1907/2006/EC). Restrictions on PFOA use in the EU (Annex XVII to REACH) will enter into force from 2020.
In industry, long-chained PFASs have increasingly been replaced by shorter-chained PFASs, especially by PFBS, PFBA and PFHxA and their derivatives [9,10,11,12,13,14]. Myriad PFASs are still used in industry, but the ecotoxicity and behaviour in environment of most of them are poorly known.
Previously, the presence of PFASs in the Finnish environment has been mainly studied in commercial fish stocks in marine areas [15]. To present a comprehensive view of the occurrence of both long- and short-chained PFASs in the aquatic environment, we report data for 23 PFAS compounds in limnic and marine fish and in surface waters in Finland in 2014–2016 and 2016–2017, respectively. Using results of surface water sampling, we calculate riverine loads from the Finnish mainland to the Baltic Sea. Additionally, by exploiting the limit values set for fish and water, we perform an initial assessment to suggest monitoring actions and subjects for future research.

2. Methods

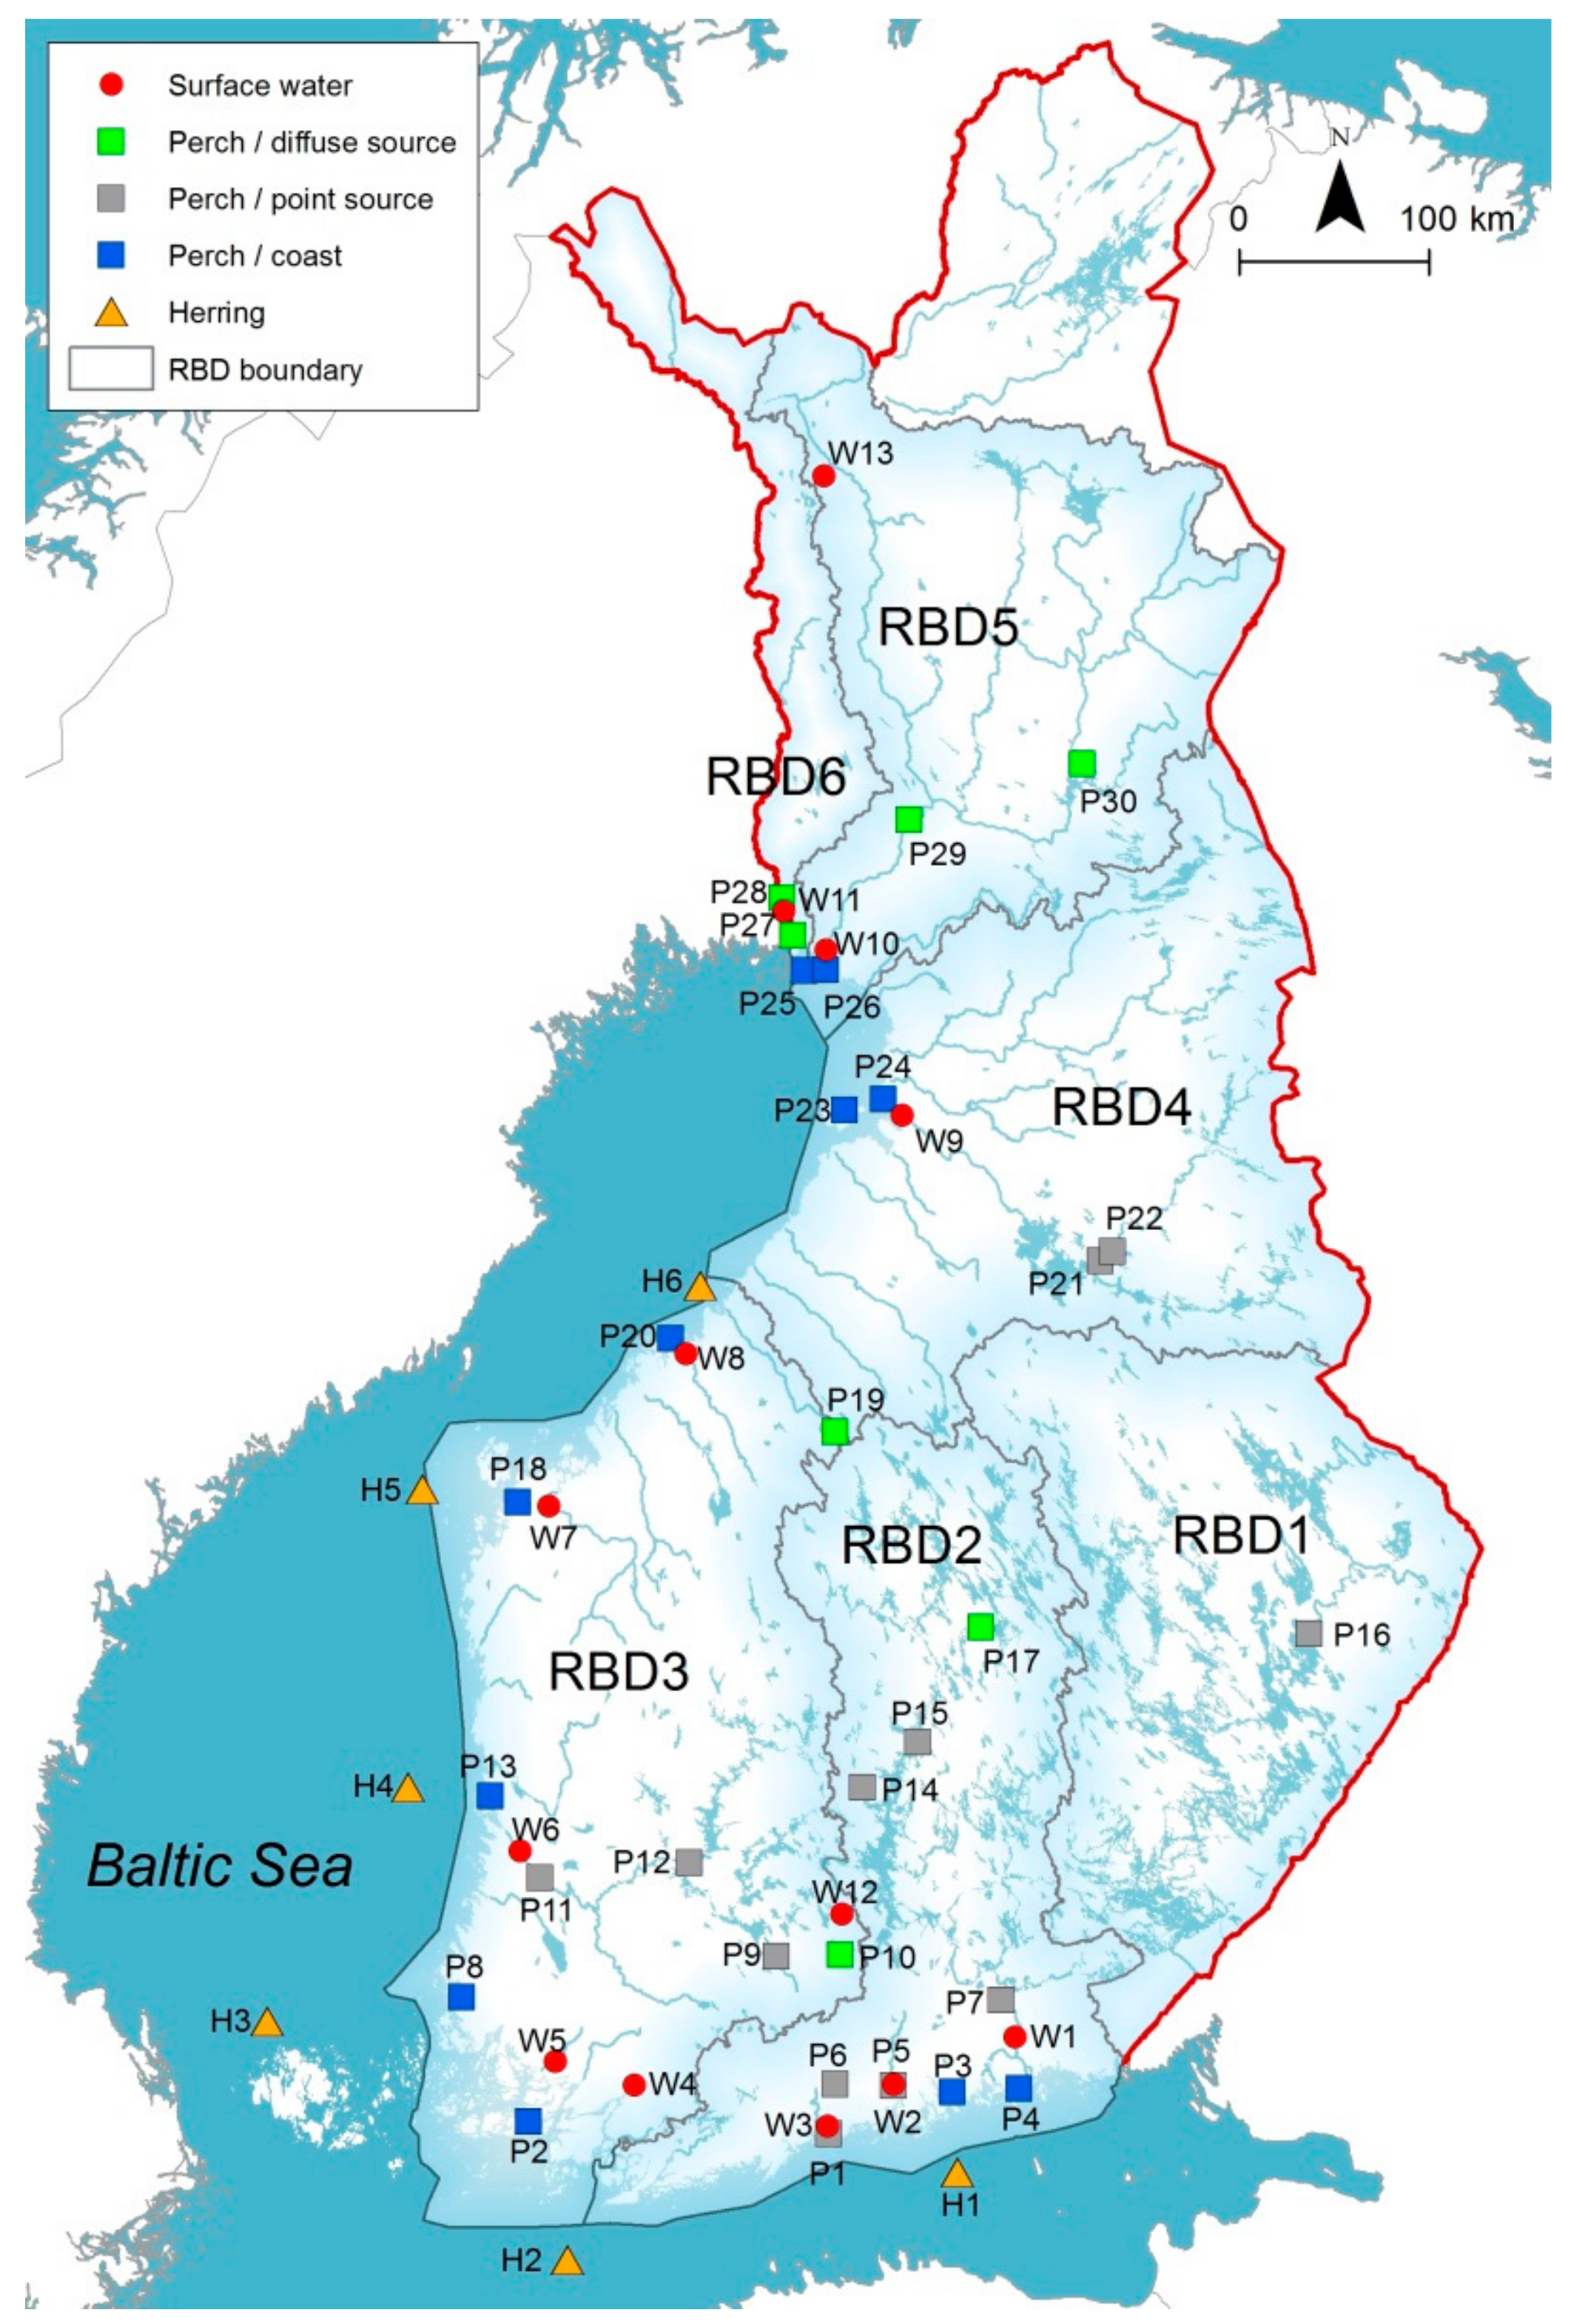
2.1. Selection and Classification of Sampling Sites

Sampling sites of fish (Figure 1) were classified based on the anticipated dominant PFAS source of each site. Classification considered present and historical industrial activities, locations of WWTPs in relation to sampling sites and other relevant anthropogenic activities. All sampling sites for herring were classified as open sea regions, where the main PFAS source is mainly atmospheric deposition and to some extent riverine loading. In coastal sampling sites for perch, PFASs were expected to originate from both the riverine load and from wastewaters of industrial facilities and WWTPs of coastal towns. Sampling sites of limnic perch were divided into two classes: diffuse (atmospheric deposition, scattered dwellings) and point-source-polluted sites (industrial facilities, WWTPs). The surface water sampling sites were selected to cover all river basin districts (RBDs) of Finland, except for RBD 1 (bordering Russia and draining to Lake Ladoga) and RBD 7 (bordering Norway and Russia and draining to the Arctic Ocean). Thus, 11 rivers with moderate to high anthropogenic pressure in terms of expected PFAS load were selected for the study (Figure 1).
The catchments of the Kymijoki (W1), Porvoonjoki (W2) and Vantaanjoki (W3) rivers in southern Finland belong to RBD 2, which has more than 2 million residents. The catchment of the W3 in particular, which includes the Helsinki metropolitan area, is densely populated. The rivers on the west coast draining to the Archipelago Sea (Uskelanjoki (W4) and Aurajoki (W5)) and to the Bothnian Sea (Kokemäenjoki (W6) and Kyrönjoki (W7)) belong to RBD 3, which has almost 1.8 million residents. By contrast, the Tornionjoki (W11) river in Lapland has a large catchment, with only 39,000 residents on the Finnish side of the river.
Two sites, the outlet of Lake Valkea–Kotinen (W12) and the Pallasjoki (W13) river, were selected as background sites, in which anthropogenic pressures are low. These sites are characterised by remote location, and their PFAS load represents atmospheric load. The catchment of W12 consists of pristine forest and the only anthropogenic disturbance is atmospheric deposition. The catchment of the W13 in Lapland consists mainly of forest, bare fell region and swamps, with only a few residential buildings. All the studied water bodies, excluding background sites, receive effluents from WWTPs.

2.2. Surface Water Sampling and Sample Preparation

Riverine waters were sampled 8–10 times (Table 2) between October 2016 and August 2017 without taking into account changes in flow (e.g., not flow-proportionally). The samples were taken with a Limnos sampler from the middle of the stream at 1 m depth where possible. The samples were stored in 0.5 L high-density polyethylene bottles. At every sampling site, at least one duplicate sample was obtained, and at four sites (W1, W2, W10 and W12), a field blank was also prepared for analysis. Unfiltered samples were kept cool during transport and frozen in the laboratory until analysis.

2.3. Fish Sampling and Sample Preparation

Perch and herrings were caught during 2014–2016. The lengths of coastal and limnic perch and herrings selected for analysis were 18–23 cm, 15–20 cm and >15 cm, respectively. Sampling information on the perch is presented in the Table S1. Females were preferred and fish were mainly caught outside the spawning period (in summer or autumn). All sampled herrings were female. Sampled perch were approximately 3–5 years old.
The fish were gutted and filleted. The skin was removed from herrings, whereas for perch samples, only the scales were removed. The samples were pooled and homogenised. Samples were stored frozen (−20 °C) until the analysis. One pooled sample contained 9–30 perch or 2–5 herrings.

2.4. Analytical Methods

Sample analysis was performed at the Finnish Environment Institute, which is accredited by the Finnish Accreditation Service (FINAS) as an environmental testing laboratory (T003) following the standard SFS-EN ISO/IEC 17025. Altogether, 23 different PFASs were analysed from the samples, except for PFPeA, which was not analysed from the herrings owing to matrix interference. Furthermore, FOSA, N-EtFOSA, 4:2 FTSA, 6:2 FTSA and 8:2 FTSA were not analysed from fish samples taken prior to 2016. All 23 PFASs were analysed from water samples (total number of samples: 104).
The water samples were kept in ultrasonic infusion for 10 min and after that shaken vigorously. An aliquot of 100 mL was taken and spiked with mass-labelled internal standards (PFCA 13C4, 13C6, 13C8-13C12, 13C14 and 13C16, PFSA 18O-C6 and 13C8, 13C8-FOSA, d5-N-EtFOSA, 13C2-4:2 FTSA, 13C2-6:2 FTSA and 13C2-8:2 FTSA). Sample pH was adjusted to 3 with formic acid. The samples were extracted with solid phase extraction using Oasis WAX cartridges (Waters, Milford, MA, USA).
The fish samples were homogenised and a subsample of 5.0 g was weighed into a polypropylene (PP) tube and spiked with the abovementioned internal standards. Samples were extracted with acetonitrile in a shaker. The extract was collected to another PP tube, dried with magnesium sulphate and cleaned with C18 material.
All extracts were evaporated with a centrifugal evaporator (Genevac EZ-Envi). Water extracts were dissolved in 0.5 mL and fish extracts in 1.0 mL of methanol–water mixture. The dissolved extracts were analysed with ultrahigh-performance liquid chromatography coupled with a triple-quadrupole mass spectrometer (UHPLC-MS/MS; Acquity UPLC and Xevo TQ, manufactured by Waters). The methods are accredited for PFCAs and PFSAs. A control sample and a procedural blank were analysed in each sample series. The results were corrected with recoveries of the mass-labelled internal standards and the results of procedural blanks. The expanded measurement uncertainties were 22–39% for surface water and 23–35% for fish samples.

2.5. Calculation of Riverine PFAS Load to the Baltic Sea

The 11 study rivers (sampling sites at the river mouths) covered 62% of the total discharge from Finland to the Baltic Sea. The PFAS load from these rivers was calculated for the 10 substances that were detected in at least five samples in the rivers during the sampling period. If the samples for a given month were missing, estimated concentrations based on the mean concentrations of the season were generated. Similarly, if the seasonal mean concentrations could not be calculated, annual mean concentrations were used for the missing months.
The flow of the sampled rivers was measured continuously in the proximity of the sampling sites by automatic measurement devices. In addition, the calculated PFAS loads were divided by the total catchment areas of the sampling sites to calculate the load per km2 from the catchment areas. The loading of the background sites was not calculated, owing to the small number of samples. The PFAS loads were calculated using the Finnish HELCOM) pollution load assessment (PLC) method: the monthly mean concentrations were multiplied by monthly sums of daily river discharges, and the annual loads were summed from monthly loads [16].

2.6. Statistical Analysis

The results were analysed with SPSS 23 software using one-way variance analysis (ANOVA; p < 0.05) to reveal whether there were significant differences in PFAS concentrations between the sampling sites. For the statistical analysis, the PFASs were grouped according to their structure: long-chained (C7–C18) and short-chained (C4–C6) PFCAs, long-chained (C6–C10) and short-chained (C4–C6) PFSAs, fluorotelomer sulfonic acids (FTSA) and PFOS derivatives (PreFOS) (see Table 1). Since PreFOS and FTSAs were detected in only a few samples (Table 3), they were excluded from the variance analysis. In addition, the ANOVA was run using the ∑PFAS concentrations (sum concentration of all the detected substances in the samples) of the sampling sites. Concentrations below the limit of quantification were counted as zeros.

3. Results

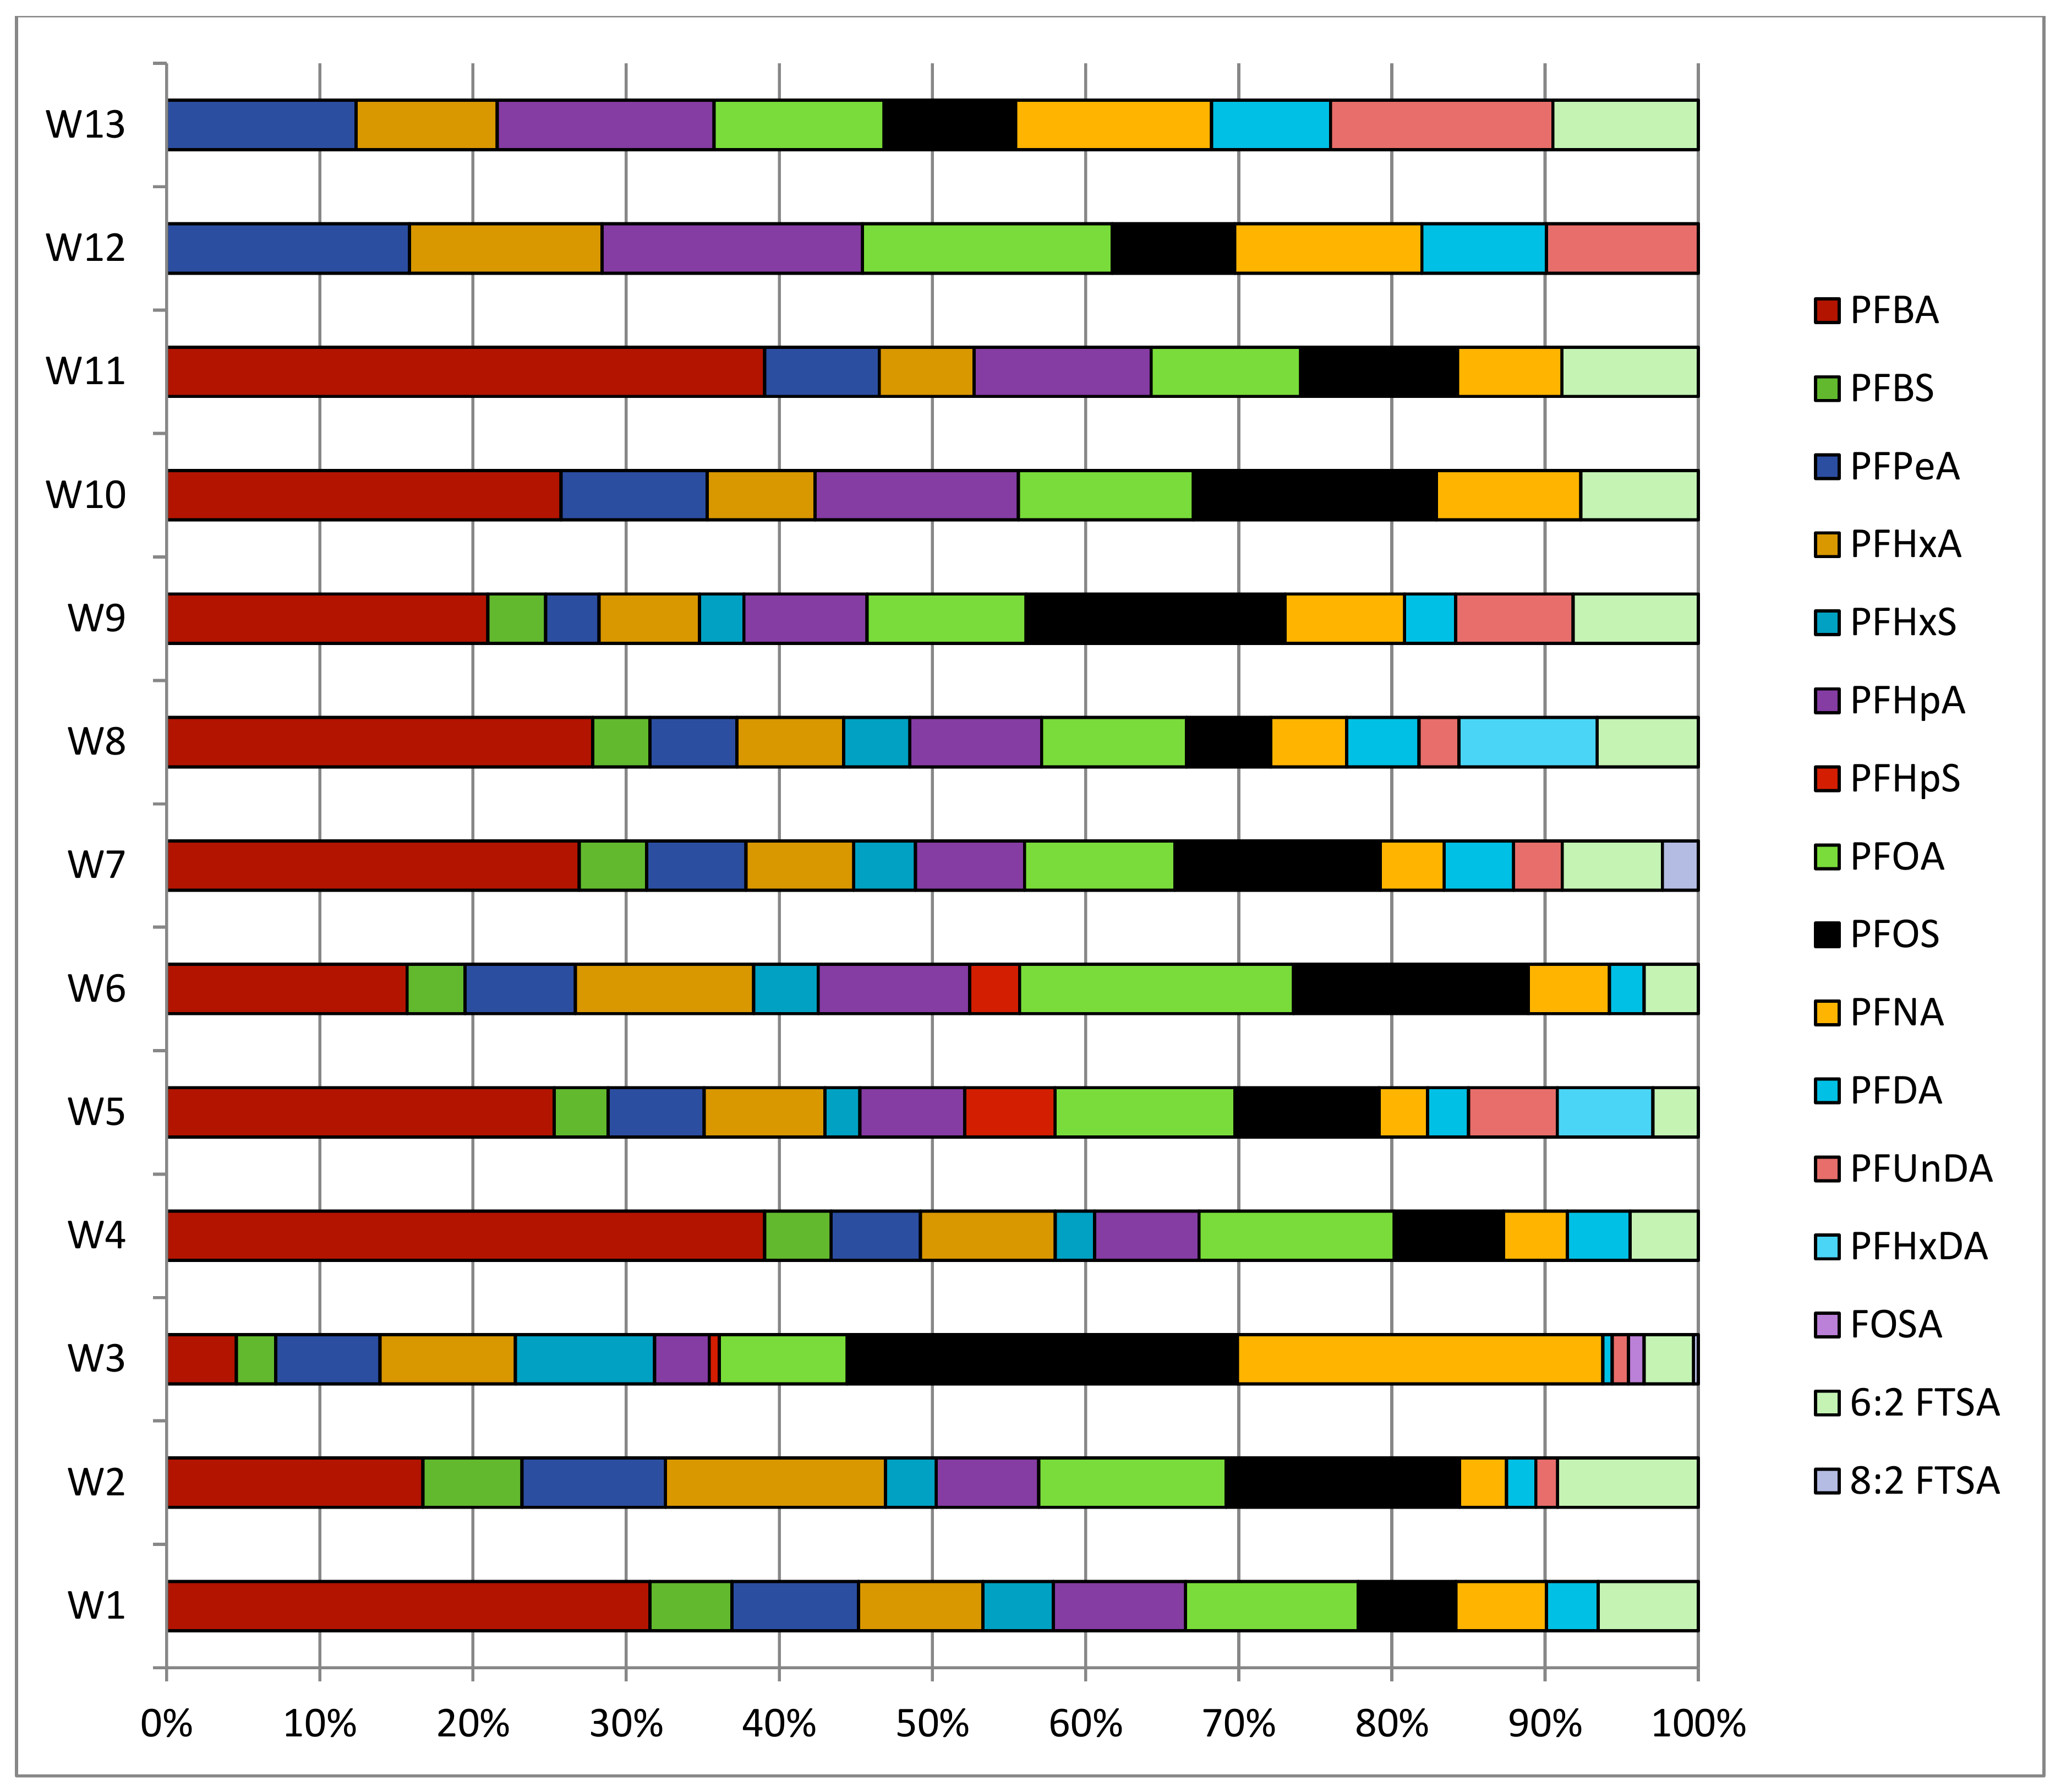
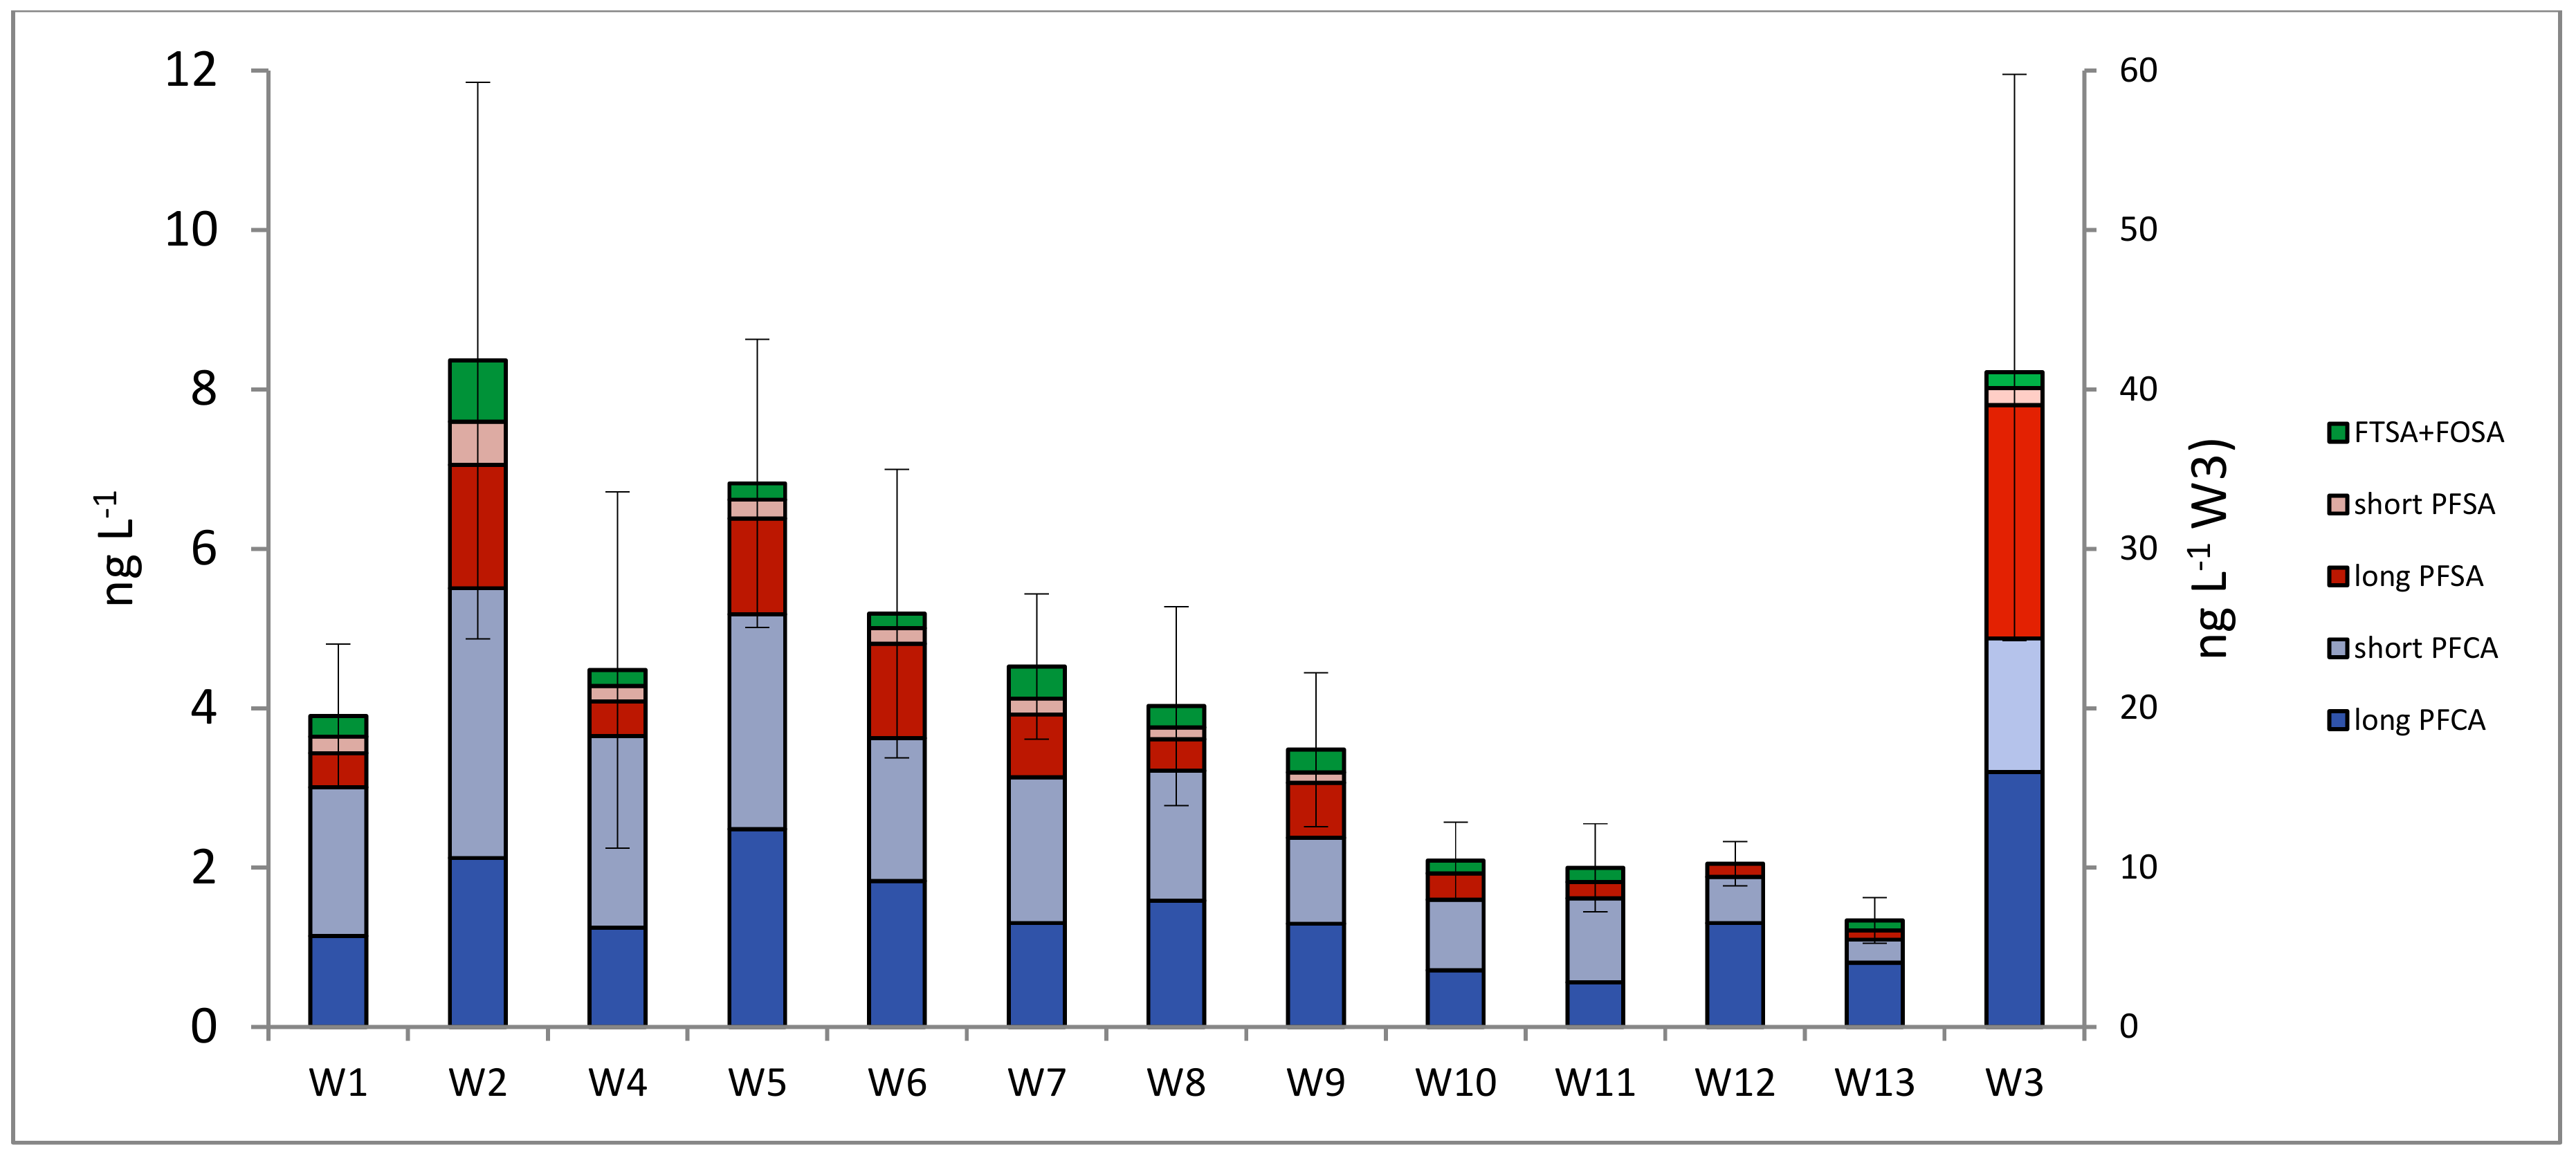
3.1. PFASs in Surface Waters

Of the 23 analysed compounds, 16 were detected in surface water samples. The most frequently found compound was PFOA, followed by PFHpA, PFHxA and PFOS (Table 3). The highest number of individual compounds was detected in the W3 (in total 15 compounds). In W11, Kemijoki (W10), W12 and the outlet of W13, eight compounds were present in detectable concentrations. In other rivers, the number of such compounds varied between 11 and 13. The PFAS profiles of both of the background sites were similar, but differed from the profiles for the other sites (Figure 2). W3 exhibited a unique PFAS profile, owing to the large quantity of substances detected.
The AA ∑23PFAS concentration in individual rivers ranged from 1.8 to 42 ng L−1. Of the individual compounds, PFOS had the highest AA concentrations, followed by PFNA, PFBA and PFOA (Figure 2). The highest concentrations were measured inW3, except for PFBA, for which the highest measured concentration was found in W4. PFDoDA, PFTrDA, PFTeDA, PFODA, PFDS, 4:2 FTSA and N-EtFOSA were not detected in any of the samples.
The significantly highest ∑23PFAS concentrations were found in surface water of W3 (15–75 ng L−1, p < 0.05) and the lowest in W13 (0.53–0.80 ng L−1, p < 0.05) (Figure 3). In the other rivers, the AA ∑23PFAS concentration was 4.3 ± 1.9 ng L−1. Peak PFAS concentrations were measured in W2 and W3 in June and July 2017, when the river flows were low (presented in the Table S2).
W3 had significantly highest long- and short-chained PFAS concentrations, and the PFAS profile of this river was different from that of other non-background sites: the proportion of PFBA was smaller, but proportions of PFOS and PFNA were bigger in this river than in the other rivers (Figure 2). Of the mean sum concentration of long-chained PFSAs, the proportion of PFOS was 100% in W10, W11, W12 and W13; 72% in W3; and 54–85% in the other rivers.
W10 and W11 had significantly lower concentrations of short-chained PFCAs compared to W3, W2, W4 and W5 and also had lower concentrations of short-chained PFSAs compared to the rivers in southern Finland, excluding W4 and Perhonjoki (W8) (p < 0.05). The background sites had significantly lower concentrations of short-chained PFASs than W3, W2 and W5 (p < 0.05).
PFOS, PFPeA, PFBA and 6:2 FTSA were detected in three field blank samples. PFPeA and PFBA were detected in the highest concentrations, which were 2.7-fold and 2.9-fold, respectively, greater than those of concentrations in corresponding surface water samples. These results show that the surface water sampling process is prone to contamination by PFASs, and specific attention should be directed to the handling of samples in the field.

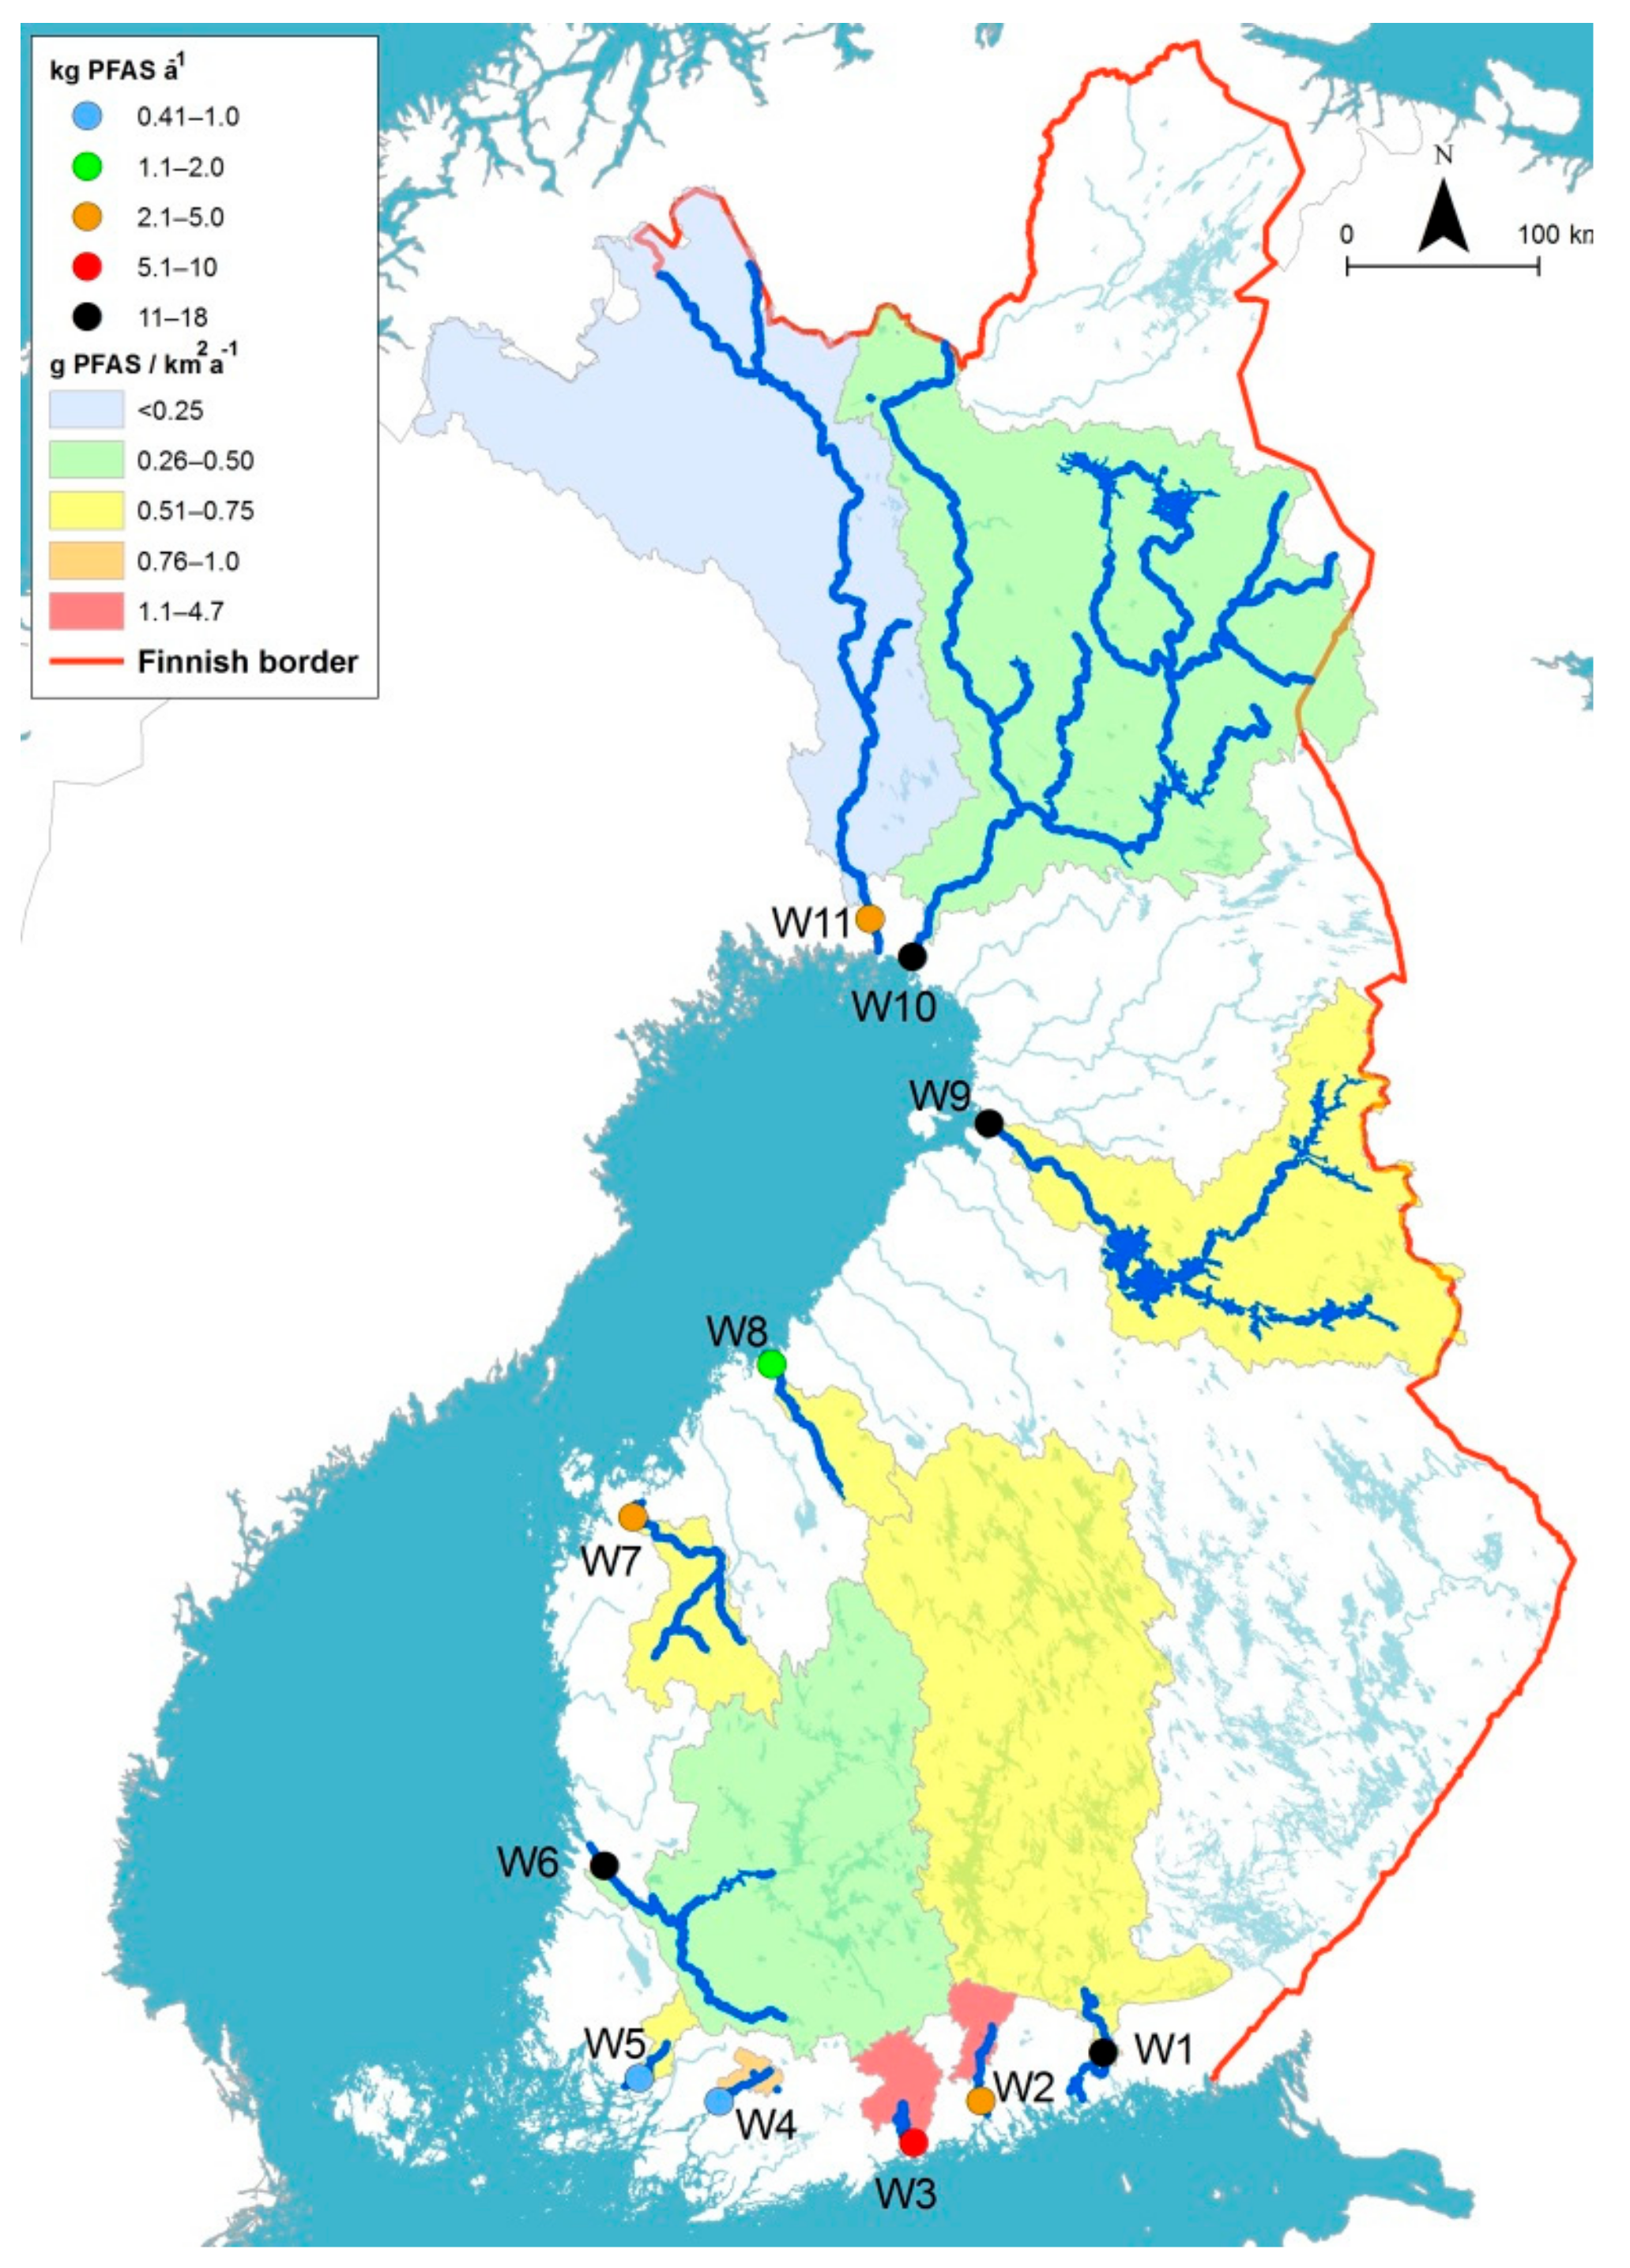
3.2. PFAS Load of the Studied Rivers to the Baltic Sea
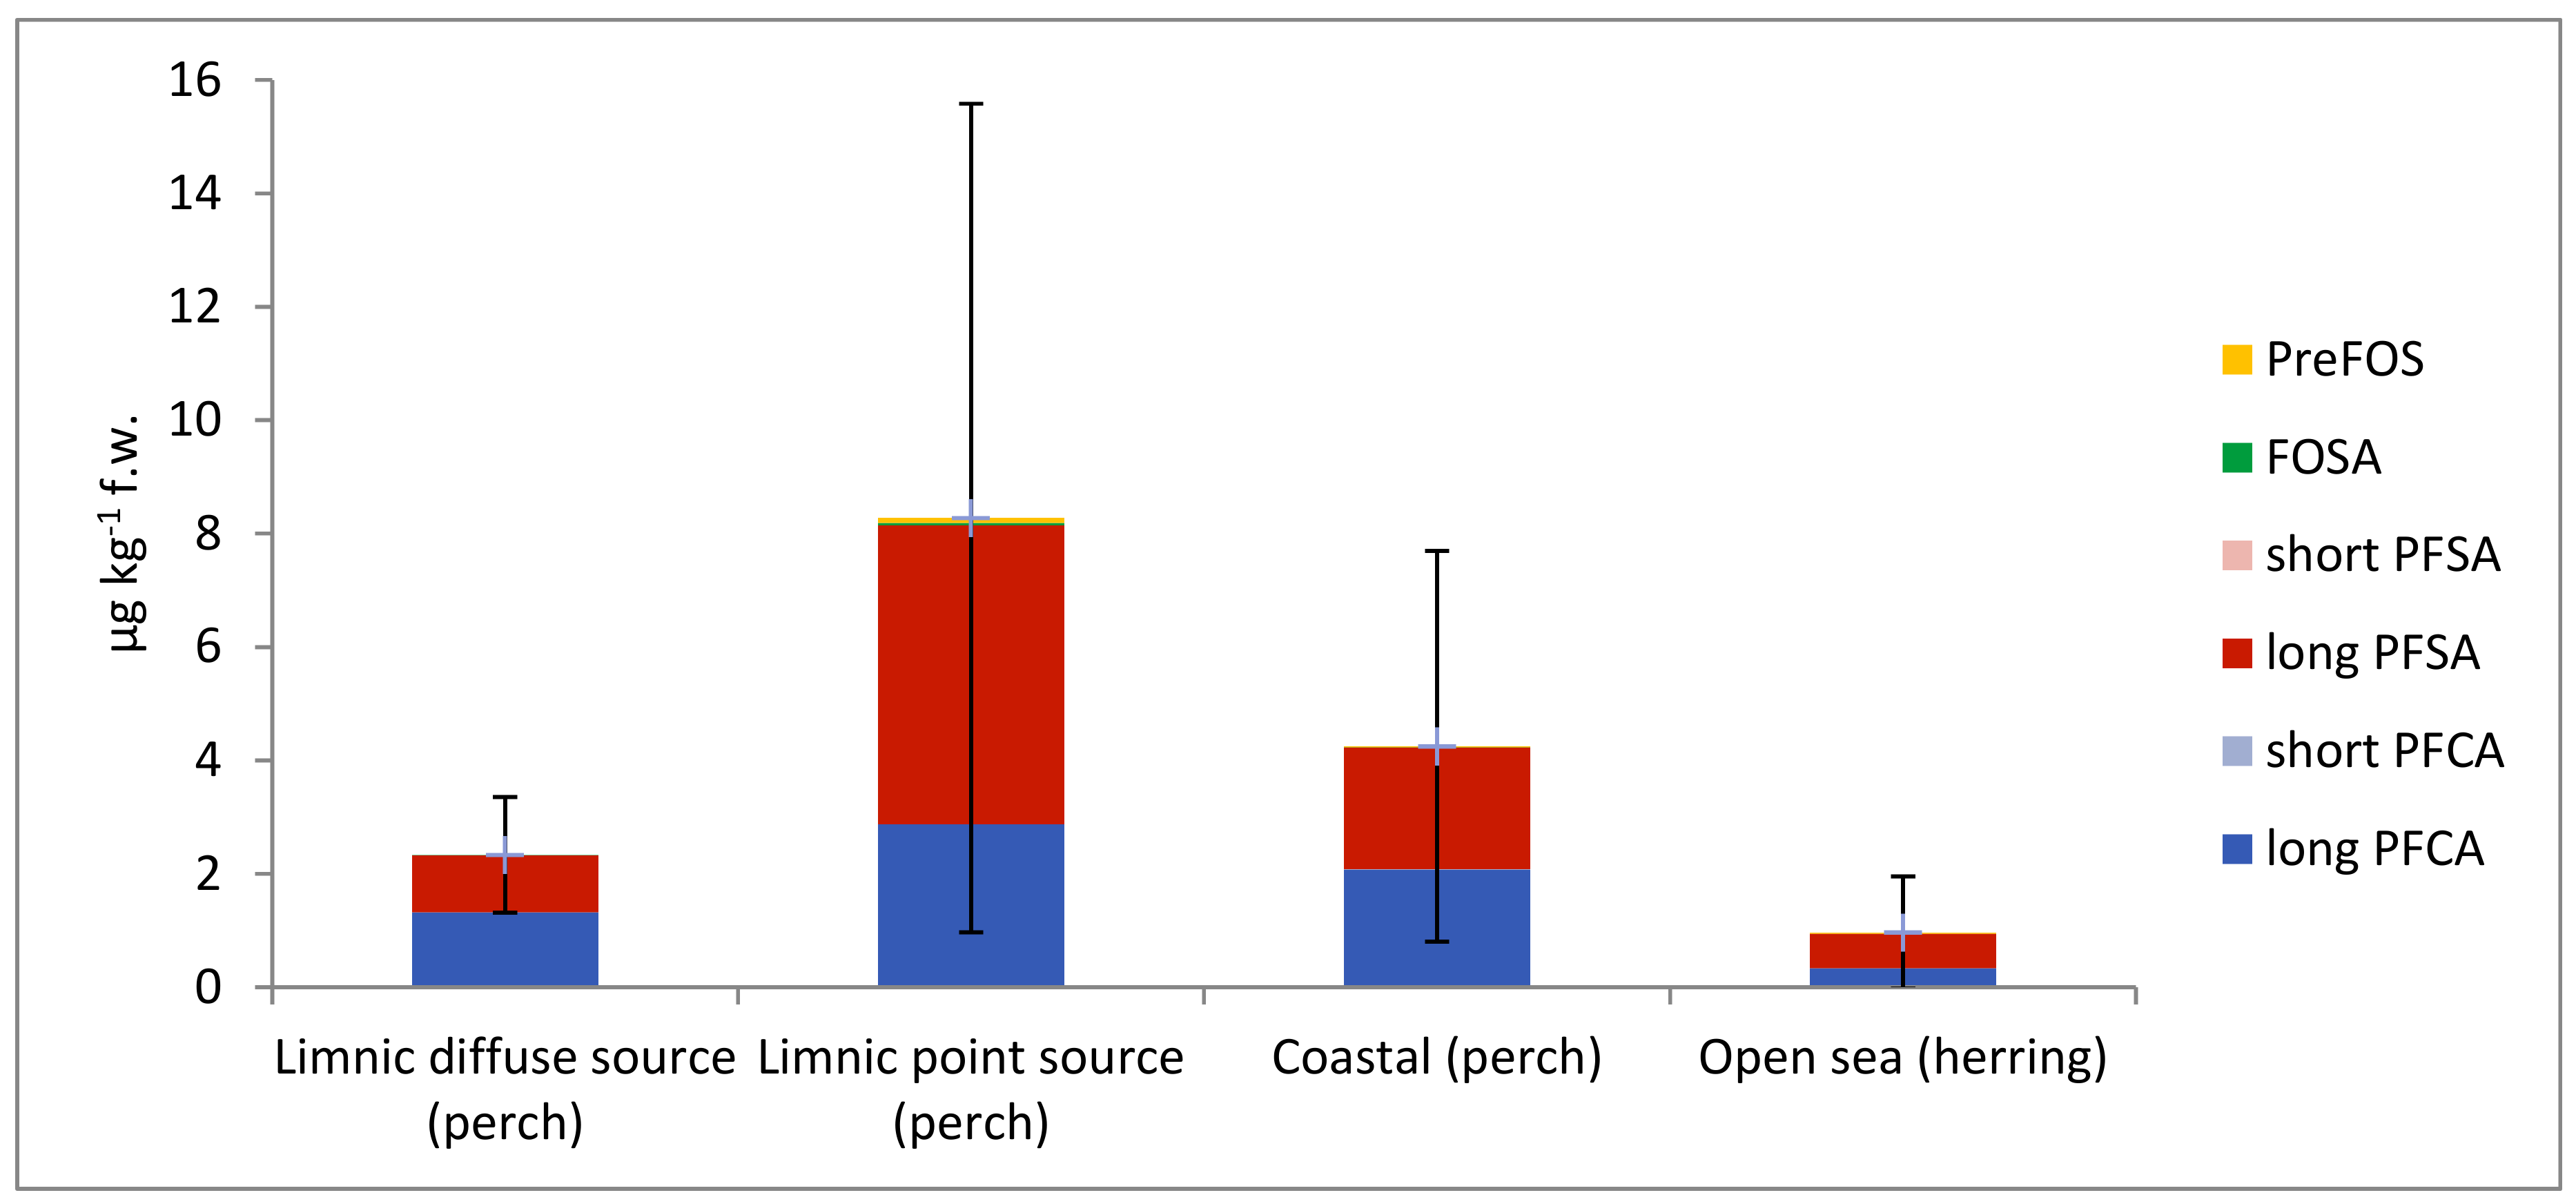
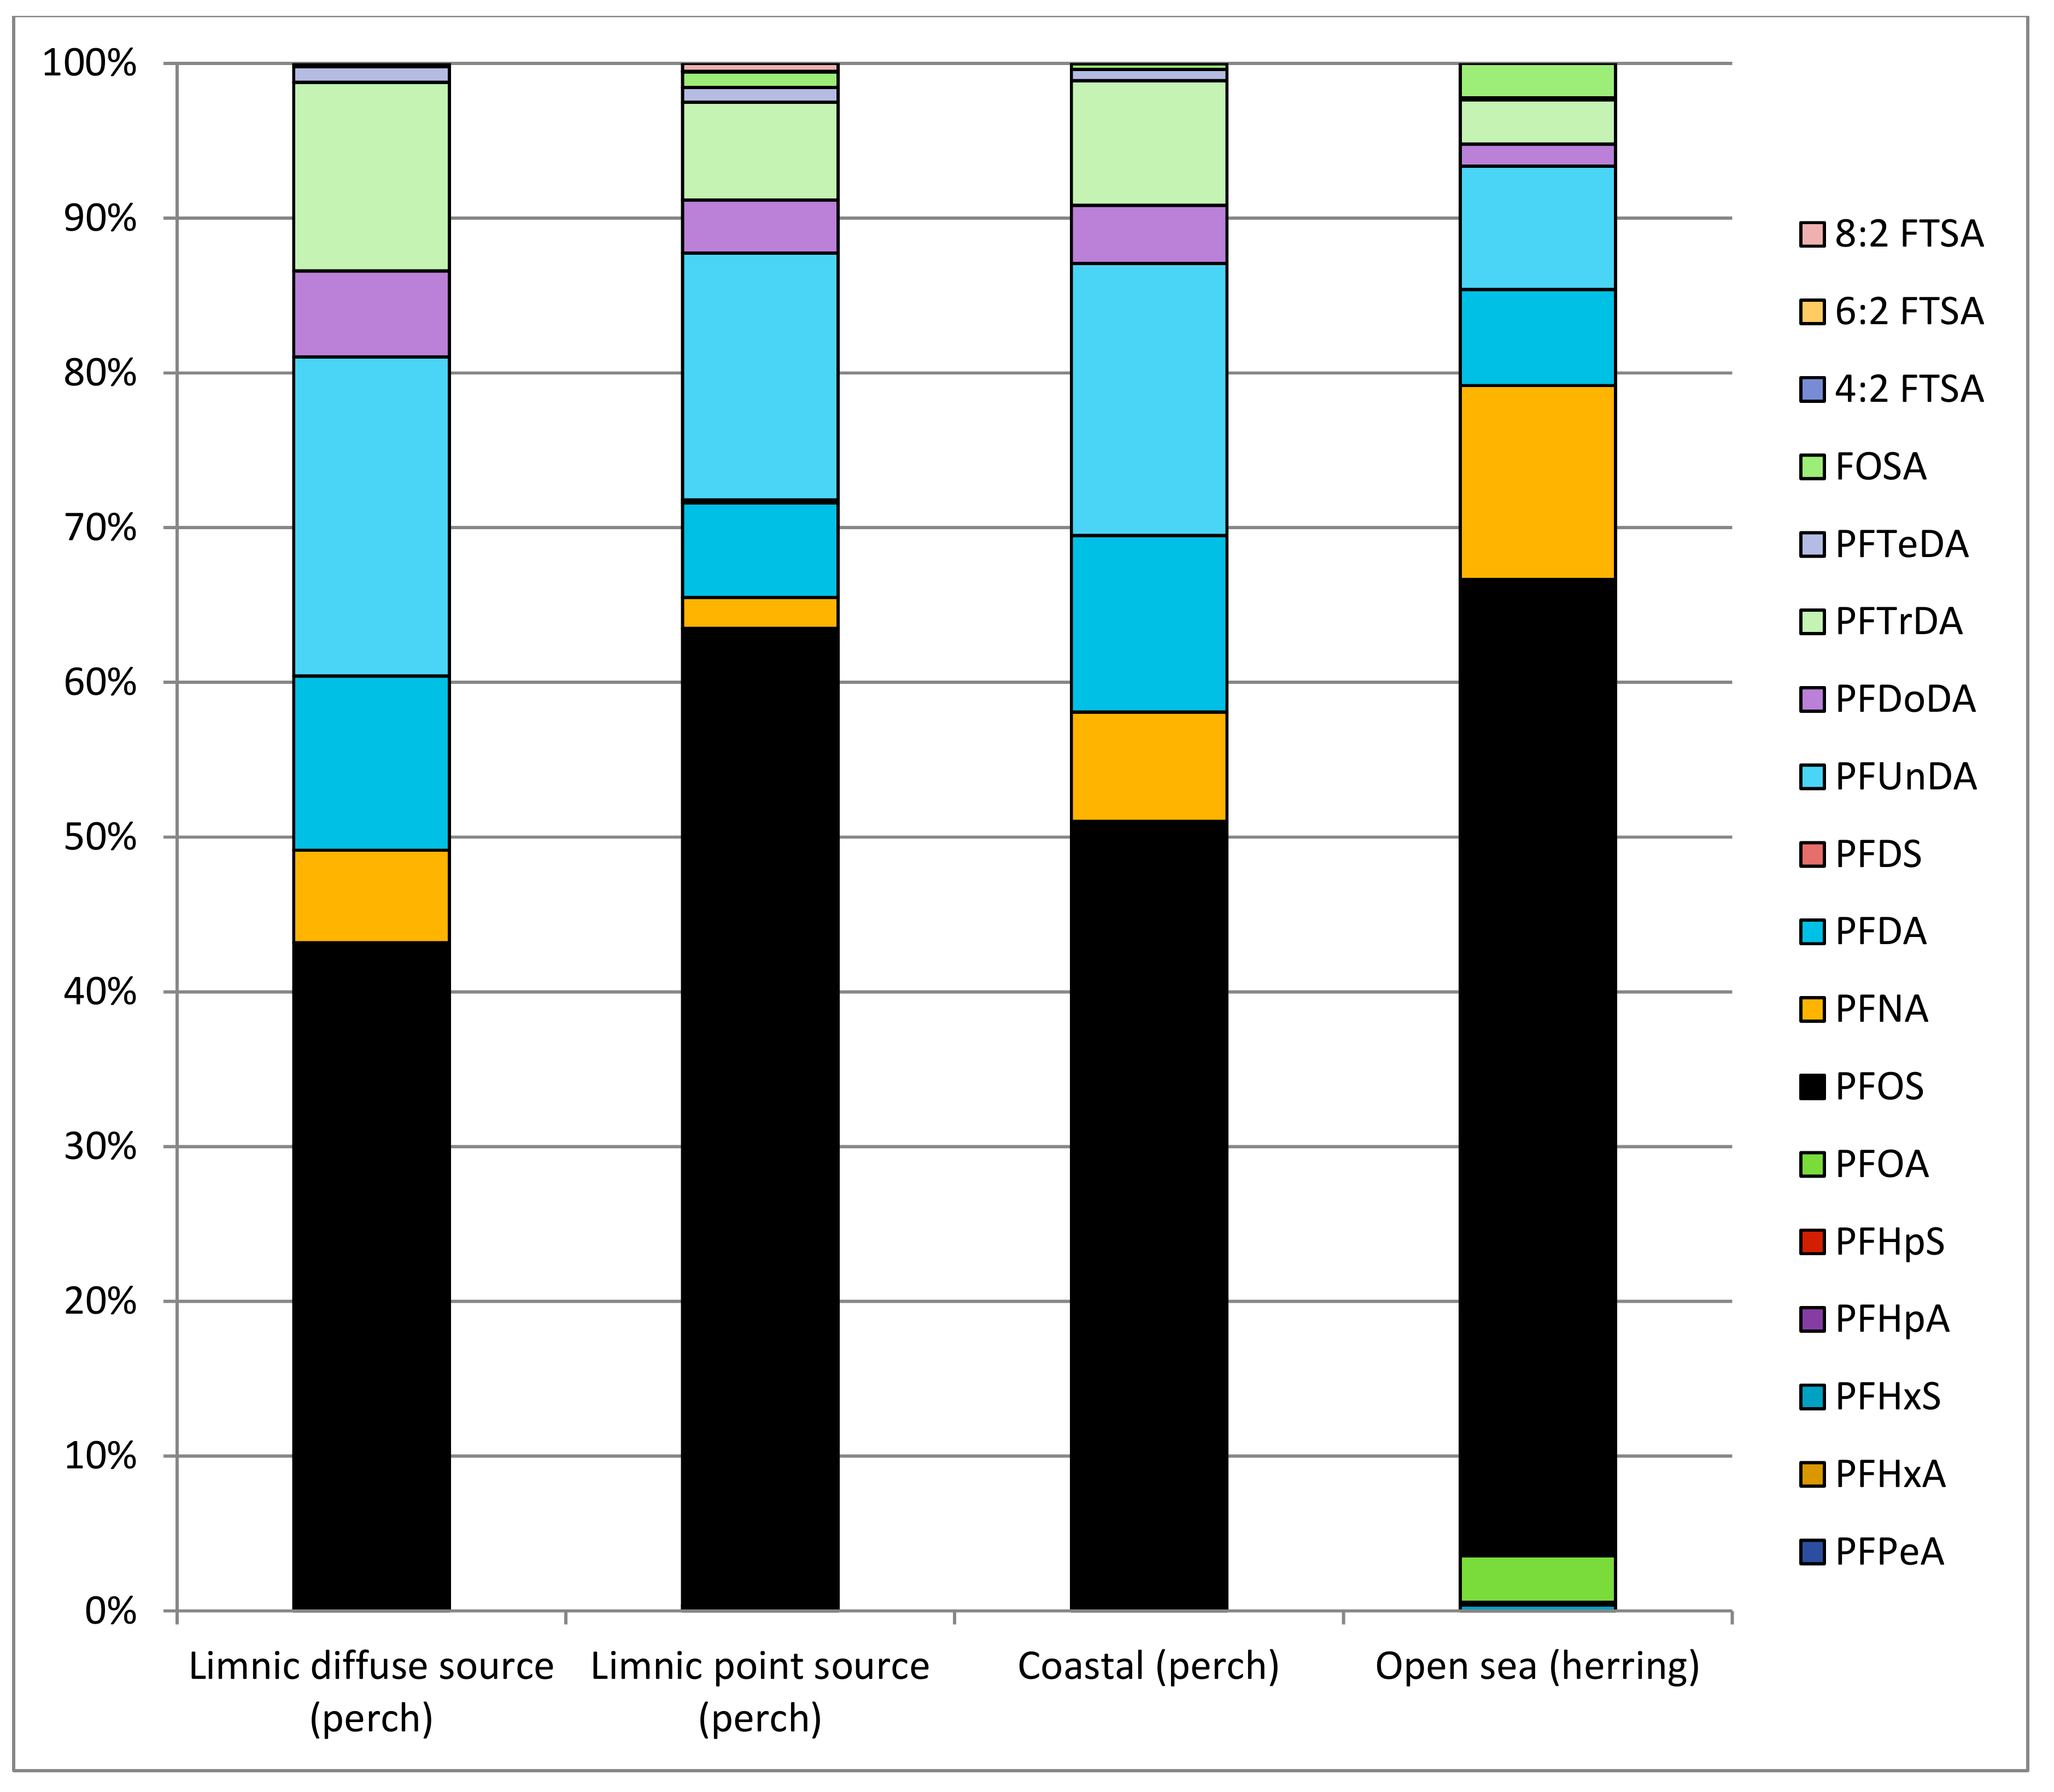
The ∑10PFAS load from the studied rivers to the Baltic Sea varied from 0.41 (W4) to 18 kg yr−1 (W1) (Table 4). The regionally normalised ∑10PFAS load was the highest for the catchment of W3 (4.7 g/km2 yr−1) and lowest in the catchment of W11 (0.09 g/km2 yr−1) (Figure 4). The studied rivers contributed 37–100% of the total discharges from their RBDs to the Baltic Sea.
Even though the PFAS concentrations and the regionally normalised load were the highest for W3, its PFAS loading to the Baltic Sea was lower than that from four of the other studied rivers, which had lower PFAS concentrations but higher water flow volumes (Figure 4).
The load of PFBA was relatively high in most of the rivers, contributing 6–48% (on average, 26%) to the total PFAS loading. Loads of PFOA and PFHpA were the second highest, with respective 9–18% and 3–34% shares of the total PFAS load. In W3, the contribution of PFOS to the total load (26%) was noticeably higher than elsewhere (up to 17%).

3.3. PFASs in Fish

Of the 23 analysed PFASs, 17 and 10 were detected in perch and herring samples, respectively (Table 5). The short-chained PFCAs and PFSAs (PFBA, PFPeA, PFHxA and PFBS) were almost undetectable in fish samples (Figure 5). The presence of the precursors was limited to perch: 6:2 FTSA and 8:2 FTSA was found in perch caught from point-source-polluted sites, and 4:2 FTSA was also measured in perch caught from coastal and diffuse polluted sites. FOSA was detected in herrings and in perch from coastal and point-source-polluted sites.
PFOS, PFUnDA, PFTrA, PFDA, PFNA and PFDoDA were detected in every perch sample. In herrings, only PFOS was detected in all samples. The concentration of PFOS was significantly higher in perch sampled from the point source-polluted sites compared to herrings or to perch from diffuse source-polluted sites. Similarly, PFOS concentrations in coastal perch were significantly higher compared to concentrations in herrings. ∑23PFAS concentration ranged from 0.22 to 2.4 µg kg−1 f.w. in herrings and from 0.98 to 31 µg kg−1 f.w. in perch. The highest ∑23PFAS concentrations were recorded in perch caught near the outlet of the W3 in Vanhankaupunginlahti Bay (P1) in Helsinki (16–31 µg kg−1 f.w.).
The highest number of individual PFAS compounds was detected in perch from coastal sites (Figure 6). Concentrations of the long-chained PFCAs and PFSAs were significantly higher in perch from the point source-polluted sites (Figure 5) as well as the coastal sites than in herrings (open sea sites; p < 0.05). The concentrations of long-chained PFSAs in perch from the point source-polluted sites were also significantly higher than the concentrations in herrings or perch from the diffuse source-polluted sites (p < 0.05).
The contribution of long-chained PFCAs to the ∑23PFAS was higher in the perch from diffuse source-polluted and coastal sites than in the perch from point source-polluted sites, where the long-chained PFSAs dominated. Consequently, the contribution of PFOS to ∑23PFAS was remarkably lower in perch from inland diffuse source-polluted sites than in fish from other sites (Figure 6).

4. Discussion

4.1. PFASs in Surface Waters

In this work, we studied the concentrations of 23 PFASs in 11 riverine waters during four seasons. The average concentration of ∑PFAS (7.9 ± 11 ng L−1) was on the same level as concentrations in Swedish rivers (9.9 ± 15 ng L1) presented by Nguyen et al. [17]. However, the mean concentrations of PFBS, PFHxS and PFDA were 42, 23 and 15 times higher in Sweden than in Finland, respectively. Also, PFASs with carbon chains longer than 9 carbons were detected in higher frequencies in Swedish rivers. One reason for this may be Sweden’s higher population and thus higher loading of PFASs. Similarly, higher concentrations of short-chained PFSAs and PFCAs in the rivers of southern Finland compared to the rivers of northern Finland are most likely a consequence of denser population and industrial activities, which leads to larger usage of products containing PFASs.
In a previous study, PFASs were detected in the effluents of Finnish WWTPs [18]. In W2 and W3, the concentrations of PFASs were remarkably high in June and July during the low flow period. The proportion of municipal wastewater, which is not dependent on weather conditions—in contrast to, for example, PFAS load via surface runoff from contaminated land areas—is at its highest in river water during low flow conditions. These results give preliminary indications that WWTPs are major sources of PFASs to these rivers.
The AA concentrations of PFOS exceeded the AA-EQS (0.65 ng L−1) in W3 (11 ng L−1), W2 (1.3 ng L−1) and W6 (0.80 ng L−1). The AA concentrations were close to AA-EQS in W5 (0.64 ng L−1) and W7 (0.61 ng L−1).
A few cities use the studied rivers as a source for drinking water production. For example, the city of Turku and its nearby municipalities use the water of W6 to make artificial ground water. Water utilities of the cities of Oulu and Vaasa use the Oulujoki (W9) and W7, respectively, as their raw water sources. However, the concentrations of PFOS (0.10–0.49 ng L−1) or PFOA (0.26–1.3 ng L−1) in these rivers did not exceed the WHO’s proposed limit values (4.0 µg L−1 and 40 µg L−1, respectively) for drinking water. Even so, since PFASs are present in the rivers, the quality of raw water supply should be monitored.
Absolute and relative concentrations of several PFASs were almost identical in the background sites, W13 and the outlet of W12 (Figure 2), although these sites are 750 km apart. PFASs detected in the background sites were also present in relatively similar concentrations in the other rivers, excluding W3 and W2. This implies that atmospheric deposition is an important route for these compounds (e.g., PFPeA, PFHxA, PFOS, PFOA) or their precursors to the environment. On the other hand, W3 and W2 appear to also have specific sources for PFPeA, PFHxA, PFOA, PFOS and 6:2 FTSA based on their distinguishable concentrations in these rivers.
PFPeA and PFHxA, which are degradation products of 6:2 FTSA and of other fluorotelomer-based precursors [19,20,21], were the only short-chained PFASs detected in background sites. According to Ahrens et al. [5], 6:2 FTSA, along with PFOS and PFHxS, dominates in a biotic environment near firefighting sites. PFHxS is also one substituent for long-chained PFASs in firefighting foams [22,23]. Increasing use of 6:2 FTSA may thus be reflected in higher environmental concentrations of its degradation products.
The PFAS precursors are typically volatile [7], unlike their degradation products. Woldegiorgis et al. [24] documented the presence of 6:2 FTSA in air particles and deposition samples collected from a monitoring site near W13. Further, Filipovic et al. [25] showed that PFHxA was the dominant PFCA compound in wet deposition samples collected from a pristine Nordic study area. Along with these studies, this work provides evidence that the increased use of 6:2 FTSA may result in higher PFHxA concentrations in the environment in the future, even in very remote areas.
Some of the most commonly found PFASs were not detected in our background sites. PFHxS, which has been noted to exhibit positive correlation in concentrations with PFOS [26,27], was undetectable in background sites and in sites in northern RBDs 5 and 6, but was detected in all of the rivers in RBDs 2–4. Similarly, PFBA and PFBS, whose elevated concentrations in the environment are assumed to be the outcome of their uses as substitutes of PFOS and PFOA [13,28], were detected in all of the rivers, but not in the background sites. These findings strongly suggest that the occurrence of these compounds in surface water is predominantly linked to industrial wastewaters and to the usage of firefighting foams, rather than to long-range atmospheric transport.
There was no significant difference in concentrations of long-chained PFCAs between the river water samples. An exception to this rule was W3, which exhibited high concentrations of long-chained PFCAs, in particular PFOA and PFNA. The similar concentrations of long-chained PFCAs between the sites indicate that atmospheric deposition is an important route for long-chained PFCAs to the aquatic environment of Finland. However, despite being below LOQ in the river waters, the concentrations of poorly water-soluble PFUnDA, PFDA and PFTrDA in perch caught from point source-polluted sites imply that these long-chained PFCAs or their precursors end up or have ended up in the environment also from point sources.
PFASs are known to be predominant compounds in contaminated land areas such as firefighting training areas and airports [5,29]. High concentrations of PFASs have also been detected in landfill leachates [18,30]. However, significance of contaminated soils as sources for PFASs to Finnish waterbodies is unknown, and it is recommended that this be studied in the future.

4.2. PFASs in Fish

Higher concentrations of PFOS in perch sampled from point source-polluted sites compared to perch from diffuse source-polluted sites indicate that PFOS originates from point rather than diffuse sources. The high PFOS concentration in perch in P1 (18 µg kg−1) is most likely a consequence of the high PFOS loading from W3, which discharges into the bay.
Geometric mean PFOS concentrations exceeded the EQSbiota in three sampling sites of perch: P1, Porvoonjoki (P5) and Tuusulanjärvi (P6), but in none of the herrings. Overall, fewer compounds were detected in herrings than in perch. It is recommended in the WFD guidance document [31] that the trophic level of the sampled biota is determined for the adjustment of monitoring data for comparison with the relevant EQSbiota. Trophic level was not determined in our study, but fish size was selected in terms of WFD recommendations. Based on the size of the fish (see the Table S1), we assume that they represent trophic levels 3–4, which, according to the WFD guidance document, is considered to be sufficient for estimations of both chemical status of water bodies and safety for human fish consumption.
PFOS concentrations in herrings were generally lower than the concentrations reported earlier from the Estonian coast of the Gulf of Finland [32]. The concentration of PFOS in limnic perch in Sweden was between 0.1 and 4 µg kg−1 f.w., and in marine perch, was between 1.2 and 30 µg kg−1 f.w. [33], which is quite well in line with the results presented here. Markedly higher PFOS concentrations in various fish species have been measured in Central Europe, e.g., in Germany (39 µg kg−1 f.w.) [34] and in the Czech Republic (61 µg kg−1 f.w.) [35].
PFOS has adverse effects on human health, and the tolerable weekly intake of PFOS is estimated to be 13 ng kg−1 body weight, which is exceeded in a considerable proportion of the population [36]. The high PFOS concentrations in perch from the most severely polluted sites, e.g., P1, should be taken into account when making recommendations on eating fish.
PFOA seemed to be assimilated more easily into the tissue of herrings compared to perch, although herrings tend to live in open sea, where there are no direct sources of PFOA. These results are in accordance with previous studies [15,33], in which PFOA was analysed from several Baltic fish species and the highest concentrations were detected in herrings. This indicates that species-specific mechanisms are responsible for a higher accumulation of PFOA in herrings. PFOA is harmful to humans [36], but, according to the results of this study, the concentrations of PFOA in fish in Finland are low and therefore pose no risk to humans from eating fish.

4.3. PFAS Load to the Baltic Sea

For the first time in Finland, the annual riverine PFAS load to the Baltic Sea was calculated using actual measured AA concentrations of PFASs. As a result of more accurate data, the load proved to be lower than in previous estimations [37]. This study also covered a wider geographical area than the previous study. One reason for the lower load of PFASs could also be the substitution of PFOS with other unknown substances not analysed in our study.
The load of PFBA, which is a substituent of longer-chained PFASs [11,13], from the studied rivers leading to the Baltic Sea was remarkably high: 17 kg yr−1 in total. Since PFBA and other short-chained PFASs have replaced longer-chained PFASs in applications, and while PFOS load is expected to decrease owing to the restrictions, the load of short-chained PFASs is likely to increase in the future. Concerning the PFASs that are still used, wastewaters remain a significant source of PFASs to the receiving water bodies.
Despite the regulations, PFOS loading from Finnish rivers to the Baltic Sea remains to be 10 kg yr−1. The load of PFOS from WWTPs to surface waters in Finland was estimated to be 12 kg yr−1 in 2013 [38]. Since the use of PFOS in industry has for the most part ceased, we assume that products in use are currently the main source of PFOS to WWTPs and from them to receiving water bodies. Moreover, as PFOS is no longer industrially used in Finland, the emissions from WWTPs will decrease in the future when products containing PFOS are replaced.
Contaminated land areas, such as areas where firefighting foams have been used or WWTP sludge has been used as a soil amendment, are possibly major contributors to riverine PFAS loading. Unfortunately, the extent and locations of these activities are not well known in Finland, and thus the role of storm waters and utilisation of WWTP sludge in PFAS loading should be investigated.

5. Conclusions

The results of this study demonstrate that PFASs have dispersed widely into the Finnish aquatic environment. The highest concentrations and number of compounds were found from densely populated areas. The concentrations of PFASs in fish were low in most of the sampling sites, but in some coastal waters and severely polluted areas, PFOS concentrations in fish exceeded the EQSbiota. Also, remarkably high concentrations of PFOS in surface waters were detected in the Vantaanjoki river. Despite restrictions, at least 10 kg of PFOS a−1 still ends up in the Baltic Sea via river discharge. In total, the load of PFASs from the Finnish mainland to the Baltic Sea is estimated at almost 80 kg per annum.
Besides PFOS, several other PFASs were found in fish and surface water, and therefore, there is an increasing risk of harmful effects on biota in river outlets and in the most polluted water bodies. In addition, owing to the accumulation of PFASs in the fish tissues, there is also a threat of harmful effects to fish-eating predators.
PFASs end up in aquatic waters from various sources. Contaminated soils are suspected to be an important source of PFOS and other PFASs, and more knowledge is needed of these sites. Additionally, data on WWTPs and industrial emissions and atmospheric deposition are needed.

Supplementary Materials

The following are available online at https://0-www-mdpi-com.brum.beds.ac.uk/2073-4441/11/4/870/s1, Table S1: Summary of sampled fish, Table S2: Flow rates of the studied rivers during study period.

Author Contributions

Conceptualization, E.V., K.S., J.M. (Jukka Mehtonen), H.K. and J.M. (Jaakko Mannio); Data curation, V.J., E.V., A.R., K.S. and J.M. (Jaakko Mannio); Formal analysis, V.J., E.V. and A.R.; Funding acquisition, K.S., J.M. (Jukka Mehtonen) and J.M. (Jaakko Mannio); Investigation, V.J., E.V., N.P., A.R., K.S., J.M. (Jukka Mehtonen), H.K. and J.M. (Jaakko Mannio); Methodology, N.P.; Project administration, K.S. and J.M. (Jaakko Mannio); Supervision, J.M. (Jaakko Mannio); Validation, N.P.; Visualization, V.J. and E.V.; Writing—original draft, V.J., E.V., N.P. and A.R.; Writing—review & editing, K.S., J.M. (Jukka Mehtonen) and J.M. (Jaakko Mannio).

Funding

This research was part-financed by the Finnish Ministry of the Environment.

Acknowledgments

The authors wish to thank staff at Ahma Ympäristö Oy, Eurofins Environment Testing, University of Helsinki, and Kymijoen Vesi ja Ympäristö Oy for surface water sampling and staff from the Natural Resources Institute of Finland and Finnish Environment Institute for fish sampling. We also thank Jani Salminen and Timo Seppälä for revising and commenting on the article. This study was part of project UuPri, funded by the Finnish Ministry of Environment.

Conflicts of Interest

The authors declare no conflict of interest.

References

  1. Vaalgamaa, S.; Vähätalo, A.V.; Perkola, N.; Huhtala, S. Photochemical reactivity of perfluorooctanoic acid (PFOA) in conditions representing surface water. Sci. Total Environ. 2011, 409, 3043–3048. [Google Scholar] [CrossRef]
  2. OECD. Co-Operation on Existing Chemicals—Hazard Assessment of Perfluorooctane Sulfonate and Its Salts, Environment Directorate Joint Meeting of the Chemicals Committee and the Working Party on Chemicals, Pesticides and Biothechnology; Organisation for Economic Co-Operation and Development: Paris, France, 2002. [Google Scholar]
  3. Ahrens, L. Polyfluoroalkyl compounds in the aquatic environment: A review of their occurrence and fate. J. Environ. Monit. 2011, 13, 20–31. [Google Scholar] [CrossRef] [PubMed]
  4. Haukås, M.; Berger, U.; Hop, H.; Gulliksen, B.; Gabrielsen, G.W. Bioaccumulation of per- and polyfluorinated alkyl substances (PFAS) in selected species from the Barents Sea food web. Environ. Pollut. 2007, 148, 360–371. [Google Scholar] [CrossRef]
  5. Ahrens, L.; Rakovic, J.; Axelson, S.; Kallenborn, R. Source Tracking and Impact of Per- and Polyfluoroalkyl Substances at Svalbard–FluorosImpact–Svalbards Miljøvernfond; Swedish University of Agricultural Sciences: Uppsala, Sweden, 2016; p. 17. [Google Scholar]
  6. AMAP. AMAP Assessment 2016: Chemicals of Emerging Arctic Concern; Arctic Monitoring and Assessment Programme (AMAP): Oslo, Norway, 2017. [Google Scholar]
  7. Ahrens, L.; Bundschuh, M. Fate and effects of poly- and perfluoroalkyl substances in the aquatic environment: A Review. Environ. Toxicol. Chem. 2014, 33, 1921–1929. [Google Scholar] [CrossRef] [PubMed]
  8. Martin, J.; Mabury, S.; Solomon, K.; Muir, D. Bioconcentration and tissue distribution of perfluorinated acids in rainbow trout (Oncorhynchus mykiss). Environ. Toxicol. Chem. 2003, 22, 196–204. [Google Scholar] [CrossRef] [PubMed]
  9. Scheringer, M.; Trier, X.; Cousins, I.T.; de Voogt, P.; Fletcher, T.; Wang, Z.; Webster, T.F. Helsingør statement on poly- and perfluorinated alkyl substances (PFASs). Chemosphere 2014, 114, 337–339. [Google Scholar] [CrossRef]
  10. Blum, A.; Balan, S.A.; Scheringer, M.; Trier, X.; Goldenman, G.; Cousins, I.T.; Diamond, M.; Fletcher, T.; Higgins, C.; Lindeman, A.E.; et al. The Madrid statement on poly- and perfluoroalkyl substances (PFASs). Environ. Health Perspect. 2015, 123, 107–111. [Google Scholar] [CrossRef] [PubMed]
  11. Danish EPA. Short Chain Polyfluoralkyl Substances (PFAS); Environmental Project No. 1707; Danish EPA: København, Denmark, 2015; p. 106. [Google Scholar]
  12. Jensen, A.A.; Brunn Poulsen, P.; Bossi, R. Survey and Environmental/Health Assessment of Fluorinated Substances in Impregnated Consumer Products and Impregnating Agents; Survey of Chemical Substances in Consumer Products, No. 99; Danish EPA: København, Denmark, 2008; 160p. [Google Scholar]
  13. Möller, A.; Ahrens, L.; Surm, R.; Westerveld, J.; van der Wielen, F.; Ebinghaus, R.; de Voogt, P. Distribution and sources of polyfluoroalkyl substances (PFAS) in the River Rhine watershed. Environ. Pollut. 2010, 158, 3243–3250. [Google Scholar] [CrossRef] [PubMed]
  14. Hu, X.C.; Andrews, D.Q.; Lindstrom, A.B.; Bruton, T.A.; Schaider, L.A.; Grandjean, P.; Lohmann, R.; Carignan, C.C.; Blum, A.; Balan, S.A.; et al. Detection of poly- and perfluoroalkyl substances (PFASs) in US drinking water linked to industrial sites, military fire training areas, and wastewater treatment plants. Environ. Sci. Technol. Lett. 2016, 3, 344–350. [Google Scholar] [CrossRef] [PubMed]
  15. Koponen, J.; Airaksinen, R.; Hallikainen, A.; Vuorinen, P.J.; Mannio, J.; Kiviranta, H. Perfluoroalkyl acids in various edible Baltic, freshwater, and farmed fish in Finland. Chemosphere 2015, 129, 186–191. [Google Scholar] [CrossRef]
  16. HELCOM. Guidelines for the Annual and Periodical Compilation and Reporting of Waterborne Pollution Inputs to the Baltic Sea (PLC-Water); HELCOM: Helsinki, Finland, 2015. [Google Scholar]
  17. Nguyen, M.A.; Wiberg, K.; Ribeli, E.; Josefsson, S.; Futter, M.; Gustavsson, J.; Ahrens, L. Spatial distribution and source tracing of per- and polyfluoroalkyl substances (PFASs) in surface water in Northern Europe. Environ. Pollut. 2017, 220, 1438–1446. [Google Scholar] [CrossRef] [PubMed]
  18. Perkola, N.; Sainio, P. Survey of perfluorinated alkyl acids in Finnish effluents, storm water, landfill leachate and sludge. Environ. Sci. Pollut. Res. 2013, 20, 7979–7987. [Google Scholar] [CrossRef] [PubMed]
  19. Young, C.J.; Mabury, S.A. Atmospheric Perfluorinated Acid Precursors: Chemistry, Occurrence, and Impacts. In Reviews of Environmental Contamination and Toxicology, Vol 208: Perfluorinated Alkylated Substances; Springer: New York, NY, USA, 2010; Volume 208, pp. 1–109. [Google Scholar]
  20. Wang, N.; Liu, J.; Buck, R.C.; Korzeniowski, S.H.; Wolstenholme, B.W.; Folsom, P.W.; Sulecki, L.M. 6:2 Fluorotelomer sulfonate aerobic biotransformation in activated sludge of waste water treatment plants. Chemosphere 2011, 8, 853–858. [Google Scholar] [CrossRef] [PubMed]
  21. Yang, X.; Huang, J.; Zhang, K.; Yu, G.; Deng, S.; Wang, B. Stability of 6:2 fluorotelomer sulfonate in advanced oxidation processes: Degradation kinetics and pathway. Environ. Sci. Pollut. Res. 2013, 21, 4634–4642. [Google Scholar] [CrossRef]
  22. KEMI. Chemical Analysis of Selected Fire-Fighting foams on the Swedish Market 2014; Swedish Chemicals Agency: Stockholm, Sweden, 2015; 22p. [Google Scholar]
  23. Favreau, P.; Poncioni-Rothlisberger, C.; Place, B.J.; Bouchex-Bellomie, H.; Weber, A.; Tremp, J.; Field, J.A.; Kohler, M. Multianalyte profiling of per- and polyfluoroalkyl substances (PFASs) in liquid commercial products. Chemosphere 2017, 171, 491–501. [Google Scholar] [CrossRef]
  24. Woldegiorgis, A.; Andersson, J.; Remberger, M.; Kaj, L.; Ekheden, Y.; Blom, L.; Brorsrtöm-Lundén, E. Results from the Swedish National Screening Programme 2005: Subreport 3: Perfluorinated Alkylated Substances (PFAS); IVL Report B1698; Swedish Environmental Research Institute: Stockholm, Sweden, 2006; 4p. [Google Scholar]
  25. Filipovic, M.; Laudon, H.; McLachlan, M.S.; Berger, U. Mass balance of perfluorinated alkyl acids in a pristine boreal catchment. Environ. Sci. Technol. 2015, 49, 12127–12135. [Google Scholar] [CrossRef] [PubMed]
  26. Bignert, A.; Danielsson, S.; Faxneld, S.; Nyberg, E. Comments Concerning the National Swedish Contaminant Monitoring Programme in Marine Biota, 2016; Swedish Museum of Natural History: Stockholm, Sweden, 2016. [Google Scholar]
  27. Guelfo, J.L.; Adamson, D.T. Evaluation of a national data set for insights into sources, composition, and concentrations of per- and polyfluoroalkyl substances (PFASs) in US drinking water. Environ. Pollut. 2018, 236, 505–513. [Google Scholar] [CrossRef] [PubMed]
  28. Codling, G.; Halsall, C.; Ahrens, L.; Del Vento, S.; Wiberg, K.; Bergknut, M.; Laudon, H.; Ebinghaus, R. The fate of per- and polyfluoroalkyl substances within a melting snowpack of a boreal forest. Environ. Pollut. 2014, 191, 190–198. [Google Scholar] [CrossRef] [PubMed]
  29. Ahrens, L.; Hedlund, J.; Dürig, W.; Tröger, R.; Wiberg, K. Screening of PFASs in Groundwater and Surface Water; Rapport 2016:2; Sveriges Lantbruksuniversitet, Institutionen för Vatten Och Miljö: Uppsala, Sweden, 2016; 82p. [Google Scholar]
  30. Hamid, H.; Loretta, Y.L.; Grace, J.R. Review of the fate and transformation of per- and polyfluoroalkyl substances (PFASs) in landfills. Environ. Pollut. 2018, 235, 74–85. [Google Scholar] [CrossRef]
  31. European Union. Guidance Document No. 32 on Biota Monitoring (the Implementation of EQSbiota) under the Water Framework Directive; European Union: Luxembourg, Luxembourg, 2014. [Google Scholar]
  32. Järv, L.; Kiviranta, H.; Koponen, J.; Rantakokko, P.; Ruokojärvi, P.; Radin, M.; Raid, T.; Roots, O.; Simm, M. Persistent organic pollutants in selected fishes of the Gulf of Finland. J. Mar. Syst. 2017, 171, 129–133. [Google Scholar] [CrossRef]
  33. Faxneld, S.; Danielsson, S.; Nyberg, E. Distribution of PFAS in Liver and Muscle of Herring, Perch, Cod, Eelpout, Arctic Char, and Pike from Limnic and Marine Environments in Sweden; Swedish Museum of Natural History: Stockholm, Sweden, 2014. [Google Scholar]
  34. Fliedner, A.; Lohmann, N.; Ruedel, H.; Teubner, D.; Wellmitz, J.; Koschorreck, J. Current levels and trends of selected EU Water Framework Directive priority substances in freshwater fish from the German environmental specimen bank. Environ. Pollut. 2016, 216, 866–876. [Google Scholar] [CrossRef] [PubMed]
  35. Svihlikova, V.; Lankova, D.; Poustka, J.; Tomaniova, M.; Hajslova, J.; Pulkrabova, J. Perfluoroalkyl substances (PFASs) and other halogenated compounds in fish from the upper Labe River basin. Chemosphere 2015, 129, 170–178. [Google Scholar] [CrossRef] [PubMed]
  36. EFSA CONTAM Panel (EFSA Panel on Contaminants in the Food Chain). Scientific opinion on the risk to human health related to the presence of perfluorooctane sulfonic acid and perfluorooctanoic acid in food. EFSA J. 2018, 16, 5194. [Google Scholar] [CrossRef]
  37. Filipovic, M.; Berger, U.; McLachlan, M.S. Mass balance of perfluoroalkyl acids in the Baltic Sea. Environ. Sci. Technol. 2013, 47, 4088–4095. [Google Scholar] [CrossRef] [PubMed]
  38. Vieno, N. Hazardous Substances at Wastewater Treatment Project Report (In Finnish); Vesilaitosyhdistyksen monistesarja nro 34; Finnish Water Utilities Association: Helsinki, Finland, 2014. [Google Scholar]
Figure 1. Sampling sites of surface waters and fish in river basin districts (RBDs) of Finland. Names of water bodies are presented in Table 2 (surface waters) and in the Table S1 (fish). (Background map by HELCOM) and Finnish Environment Institute.)
Water 11 00870 g001
Figure 2. PFAS profiles based on mean concentrations of individual PFASs in surface water samples. Sampling sites are arranged in geographical order (from south to north), with the exception of background sites, which are presented at the top. PFASs are arranged according to ascending carbon chain length (shortest first).
Water 11 00870 g002
Figure 3. Mean concentrations of PFASs in surface waters and standard deviation of mean total sum of PFASs. Note that for W3, the y-axis is on the right.
Water 11 00870 g003
Figure 4. Drainage basins, load of ∑10PFASs per area and annual load of ∑10PFASs of the studied rivers. (Background map by HELCOM and Finnish Environment Institute.)
Water 11 00870 g004
Figure 5. Mean concentrations of PFASs in fish from different types of sampling sites and standard deviation of average ∑22PFAS. PFPeA is excluded because it was not analysed for herrings.
Water 11 00870 g005
Figure 6. PFAS profiles based on mean concentrations of individual PFASs in fish from different types of sampling sites.
Water 11 00870 g006
Table 1. Sudied compounds, their abbreviations and grouping.
CompoundAbbreviationCategory
Perfluorooctanoic acidPFOALong PFCA
Perfluoroheptanoic acidPFHpALong PFCA
Perfluorohexanoic acidPFHxAShort PFCA
Perfluorooctane sulfonic acidPFOSLong PFSA
Perfluorononaoic acidPFNALong PFCA
Perfluoropentanoic acidPFPeAShort PFCA
Perfluorobutanoic acidPFBAShort PFCA
Perfluorobutane sulfonic acidPFBSShort PFSA
Perfluorohexane sulfonic acidPFHxSLong PFSA
6:2 Fluorotelomer sulfonic acid6:2 FTSAFTSA
Perfluorodecanoic acidPFDALong PFCA
Perfluoroundecanoic acidPFUnDALong PFCA
Perfluoroheptane sulfonic acidPFHpSLong PFSA
Perfluorohexadecanoic acidPFHxDALong PFCA
8:2 Fluorotelomer sulfonic acid8:2 FTSAFTSA
Perfluorododecanoic acidPFDoDALong PFCA
Perfluorotridecanoic acidPFTrDALong PFCA
Perfluorotetradecanoic acidPFTeDALong PFCA
Perfluorooctadecanoic acidPFODALong PFCA
Perfluorodecane sulfonic acidPFDSLong PFSA
4:2 Fluorotelomer sulfonic acid4:2 FTSAFTSA
N-ethyl perfluorooctane sulfonamideN-EtFOSAPreFOS
Perfluorooctane sulfonamideFOSAPreFOS
PFCA = perfluoroalkyl carboxylic acids, PFSA = perfluoroalkyl sulfonic acid, PreFOS = PFOS derivatives
Table 2. Surface water sampling sites, their catchment areas, average flows during October 2016 and August 2017 and number of samples per site.
Sampling Site IDName of Water BodyRBDCatchment Area (km2)Population in Catchment AreaAverage Flow during Sampling Period (m3 s−1)Number of Samples
W1Kymijoki236,300551,0002288
W2Porvoonjoki2114096,7007.908
W3Vantaanjoki21670496,94810.510
W4Uskelanjoki351420,6002.509
W5Aurajoki373537,2002.509
W6Kokemäenjoki326,400749,0001289
W7Kyrönjoki34810112,00032.19
W8Perhonjoki3241014,3002.908
W9Oulujoki422,700136,0002578
W10Kemijoki550,60098,1006188
W11Tornionjoki639,400 (the Finnish side of the river)15 3004929
W13Pallasjoki (background)51070n.a.4
W12Outlet of Lake Valkea–Kotinen (background)20.220n.a.5
n.a. = not assessed.
Table 3. Summary of PFAS detection frequencies and concentrations in sampled surface waters.
SubstanceGroupDetection Frequency (%)LoQ (ng L−1)U (%)Max. Concentration (Mean) (ng L−1)
PFOALong PFCA960.10255.4 (0.73)
PFHpALong PFCA910.10252.7 (0.44)
PFHxAShort PFCA840.10235.7 (0.64)
PFOSLong PFSA780.102526 (1.2)
PFNALong PFCA760.102923 (0.97)
PFPeAShort PFCA730.10274.2 (0.51)
PFBAShort PFCA650.50305.3 (1.0)
PFBSShort PFSA630.10291.5 (0.23)
PFHxSLong PFSA560.10256.4 (0.40)
6:2 FTSAFTSA490.10252.7 (0.33)
PFDALong PFCA290.10240.52 (0.14)
PFUnDALong PFCA160.10321.9 (0.14)
PFHpSLong PFSA110.10220.40 (0.065)
FOSAPreFOS30.20250.70 (0.032)
PFHxDALong PFCA20.25340.43 (0.061)
8:2 FTSAFTSA20.10250.13 (0.018)
PFDoDALong PFCAn.d.0.5032<LoQ
PFTrDALong PFCAn.d.0.2527<LoQ
PFTeDALong PFCAn.d.0.2530<LoQ
PFODALong PFCAn.d.0.5039<LoQ
PFDSLong PFSAn.d.0.2039<LoQ
4:2 FTSAFTSAn.d.0.1025<LoQ
N-EtFOSAPreFOSn.d.0.5035<LoQ
n.d. = not detected, LoQ = limit of quantification, U = expanded uncertainty of the measurement (U = 2 × combined standard uncertainty).
Table 4. The load of selected compounds (kg yr−1) from the studied rivers to the Baltic Sea in 2017.
RiverPFBAPFBSPFPeAPFHxAPFHxSPFHpAPFOAPFOSPFNA6:2 FTSATotal
W15.50.971.61.60.681.52.21.21.11.918
W20.260.100.120.170.040.710.190.180.030.252.0
W30.480.220.570.720.710.270.762.11.40.617.8
W40.200.010.020.04-0.030.060.020.020.010.41
W50.170.020.040.050.010.040.070.030.020.010.44
W61.90.490.971.50.561.02.22.10.680.6612
W71.20.150.230.230.120.230.350.390.110.113.1
W80.560.070.070.130.060.140.220.080.060.031.4
W92.20.170.361.20.101.42.01.81.31.812
W104.4-0.840.82-2.42.01.81.21.115
W110.44-0.320.23-0.610.610.330.250.563.4
Total172.25.16.72.38.111106.27.0
Table 5. Summary of analysed PFASs in perch and herrings. Concentrations are presented per fresh weight (f.w.).
PerchHerring
PFASGroupLoQ
(µg kg−1)
U (%)nDetection FrequencyMean (µg kg−1)Max (µg kg−1)nDetection FrequencyMean (µg kg−1)Max. (µg kg−1)
PFOSlong PFSA0.012548100%3.41848100%0.491.6
PFUnDAlong PFCA0.022448100%1.08.84825%0.110.29
PFTrDAlong PFCA0.032548100%0.451.84810%0.060.09
PFDAlong PFCA0.013548100%0.50 1.64838%0.080.25
PFNAlong PFCA0.012448100%0.231.14860%0.180.56
PFDoDAlong PFCA0.032448100%0.230.52482%0.060.06
PFTeDAlong PFCA0.04254858%0.090.1548n.d. --
FOSAPreFOS0.02251850%0.110.381644%0.040.09
PFHpSlong PFSA0.01294829%0.020.0648n.d.--
8:2 FTSAFTSA0.01251828%0.090.2116n.d.--
PFHxSlong PFSA0.01224823%0.030.104823%0.020.03
4:2 FTSAFTSA0.01251822%0.010.0116n.d.--
PFDSlong PFSA0.02274810%0.070.1748n.d.--
PFOAlong PFCA0.0124486%0.030.064840%0.070.28
6:2 FTSAFTSA0.0125186%0.010.0116n.d.--
PFHxAshort PFCA0.0224482%0.110.1148n.d.--
PFPeAshort PFCA0.0325482%0.050.050n.a.--
N-EtFOSAPreFOS0.153018n.d.--16n.d.--
PFBAshort PFCA0.043548n.d.--16n.d.--
PFBSshort PFSA0.032348n.d.--16n.d.--
PFHxDAlong PFCA0.152648n.d.--16n.d.--
PFHpAlong PFCA0.013348n.d.--488%0.020.02
PFODAlong PFCA0.113148n.d.--16n.d.--
n.d. = not detected, n.a. = not analysed, LoQ = limit of quantification, U = expanded uncertainty of the measurement.

