Article

A Perception Study of an Integrated Water System Project in a Water Scarce Community in the Philippines

by
Jonathan Jared Ignacio
1,
Roy Alvin Malenab
1,
Carla Mae Pausta
1,
Arnel Beltran
1,
Lawrence Belo
1,
Renan Ma. Tanhueco
2,
Michael Angelo Promentilla
1 and
Aileen Orbecido
1,*
1
Chemical Engineering Department, Gokongwei College of Engineering, De La Salle University, 2401 Taft Avenue, Manila 1004, Philippines
2
Civil Engineering Department, Gokongwei College of Engineering, De La Salle University, 2401 Taft Avenue, Manila 1004, Philippines
*
Author to whom correspondence should be addressed.
Submission received: 3 July 2019 / Revised: 27 July 2019 / Accepted: 30 July 2019 / Published: 31 July 2019
(This article belongs to the Special Issue Insights on the Water–Energy–Food Nexus)

Abstract

:
The Integrated Water System (IWS) offers alternative water and sanitation services that can potentially benefit rural communities experiencing water scarcity. The IWS described in this study comprises three systems: The Rainwater Harvesting System (RWHS), Water Treatment System (WTS), and Eco-Toilet System (ETS). RWHS and WTS make use of rainwater, which can be utilized for several domestic uses, especially during wet season. ETS has several benefits to users including promotion of environmental and public health, as well as food security. Despite the potential benefits of the IWS components, the perceived acceptance of its users threatens the success of its implementation. This study focuses on determining the significant factors that can influence the social acceptance of IWS in the Municipality of Mulanay, Quezon Province, Philippines. This study considers behavioral intention as an indicator of social acceptance of the IWS components. The framework of this study is based on the combined technology acceptance model and theory of planned behavior (C-TAM-TPB) concept. C-TAM-TPB was analyzed using Partial Least Square–Structural Equation Modeling (PLS–SEM). The result of the C-TAM-TPB evaluation reveals that the user’s attitude towards use (ATU), including its significant predictors, can promote behavioral intention towards use of the IWS components. This study can further improve the development of IWS projects.

1. Introduction

Water security remains a critical global issue due to the combined adverse environmental impacts of anthropogenic activities and natural phenomena on water resources [1]. The United Nations recently reported that nearly 2.1 billion people are deprived of adequate and safe water services and around 2.3 billion are still in need of proper toilet facilities [2].
In the Philippines, out of 1489 municipalities, 331 are included in the list of waterless communities [3]. The Philippine Department of Interior and Local Government [3] defines communities as waterless when at least 50% of the total poor population have no access to safe water supply and are susceptible to waterborne diseases with high morbidity and mortality rates. Without proper treatment of wastewater and feces-contaminated run-off, consumption of contaminated water can cause severe malnutrition, and the presence of pathogens in wastewater can put populations at risk of infections, such as gastro-intestinal illnesses and can result in death [4]. Pathogens in collected rainwater can also result in infections. A solution to the challenges of clean water and sanitation is the primary objective of the sixth Sustainable Development Goal (SDG 6) of the United Nations 2030 Agenda for Sustainable Development [2].
Alternative water resource management strategies that relate to water supply and sanitation are now being sought to strengthen resilience and reduce the vulnerability of communities to water-related issues. Omarova et al. [5] suggest that the decentralization of water management, monitoring of both water supply and water use, and a tailor-made approach to each village are necessary to achieve the SGD 6 objective of providing rural people with safely managed drinking water. Han et al. [6] presented an integrated water and sanitation system that includes an innovative approach including a rainwater harvesting system (RWHS), an eco-toilet, and a waterless portable private toilet (WPPT). This novel integrated system was assessed and used in the control and prevention of mosquito-borne diseases caused by poor sanitation and improper water management. A portable RWHS with a storage tank and transportation system was built with a storage tank and transportation system. An eco-toilet adopted the design presented by Hashemi et al. [7], while the WPPT has a human separation device that is shaped like a box and can be folded for easy transport and assembly. This portable toilet includes a coagulant in the urine storage region of the bag so that the bag can be reused several times.
Other papers also introduced a similar concept, which is referred to in this paper as the Integrated Water System (IWS), an alternative water resource management concept, such as that proposed Han et al. [6], which is based on a circular economy perspective [8,9]. Several studies have explored different configurations of IWS to improve water resources [10,11]. In this paper, an IWS comprising three systems—the Rainwater Harvesting System (RWHS), Water Treatment System (WTS), and Eco-Toilet System (ETS)—is pilot-tested in a barangay in Mulanay, Quezon to determine the perceptions and use of the IWS facility.
The IWS could be a sustainable solution as an alternative rural water resource management system in Mulanay. Based on the initial findings of this study, the rainwater collected from RWHS and WTS in Mulanay is suitable for certain domestic uses that do not involve direct human consumption of rainwater (e.g., cleaning, washing, etc.) (See Appendix A: Table A1). On the other hand, studies suggested that similar ETS schemes could help eliminate flushwater consumption, improve human excreta management, provide alternative fertilizer and soil conditioners for agriculture, and alleviate poverty [12,13]. Therefore, IWS could promote food, water, and energy security in the community.
Despite the potential societal benefits of IWS and its components, problems in its implementation could arise from the perceived acceptance by its users. Previous studies [5,6,7] focused mainly on the technical aspects of the IWS and presented the promising benefits of the technology. Although being able to satisfy the technological needs of users is important, IWS should be socially accepted and willing to be used by users to be adopted by a community.
According to Andersson [14] and Rahman et al. [15], local perceptions and attitudes toward ecological sanitation and rainwater collection schemes, i.e., IWS components, are crucial in order to design or improve such infrastructures into a more socially appropriate and sustainable water and sanitation management solution in a target community. It is important to note that there is a risk that people may not intend to use such technology because it is socially inappropriate for them. Thus, this study aims to examine the social acceptance of potential IWS users by explicating their behavioral intentions in using IWS components.
Studies have suggested that the social acceptability of a technology can be measured by determining the users’ behavioral intentions [16,17]. One of the most effective methods for estimating a user’s behavioral intention is utilizing the Technology Acceptance Model (TAM) [18]. This theoretical model determines factors that can possibly influence the behavioral use of a technology, such as how users perceived the functionality of the technology (i.e., its perceived usefulness and perceived ease of use) and their attitude towards use of the technology. In the previous study of Ignacio et al. [19], the TAM model was protracted by external variables (i.e., political climate, anxiety, and user demand). TAM was widely used to study the potential adoption of various types of technologies: smart watches [20], digital education technologies [21], and citizen centric technology [22]. Although TAM could potentially gauge the behavioral intentions of users of IWS, this model has some limitations, including the inability to explain the influence of subjective norms and perceived behavioral control on a user’s’ behavioral intention [23]. This gap could be addressed by the Theory of Planned Behavior.
Therefore, the main objective of this study is to determine, through an integrated TAM and TPB framework, the factors that could influence the behavioral intention of the users of IWS components. To our knowledge, such a perception study, in the context of IWS, has not been reported in the literature. This perception study could elucidate factors that are important or appropriate to the social acceptance of IWS in water scarce communities, such as in Mulanay. This research also proposes an analytical tool that can be used for the social acceptance of IWS and other water and sanitation related technologies. Hence, this study demonstrates the usefulness of PLS–SEM for the analysis of C-TAM-TPB data. Finally, the empirical findings of this study could be used for the promotion of a water–energy–food nexus in rural communities through IWS.
This paper is organized as follows. The following section provides details about the IWS project implemented in Mulanay. Section 3 describes the methodology utilized in this study. Section 4 presents the results and discussions. Finally, conclusions and recommendations are provided in the final section.

2. IWS Project in Mulanay
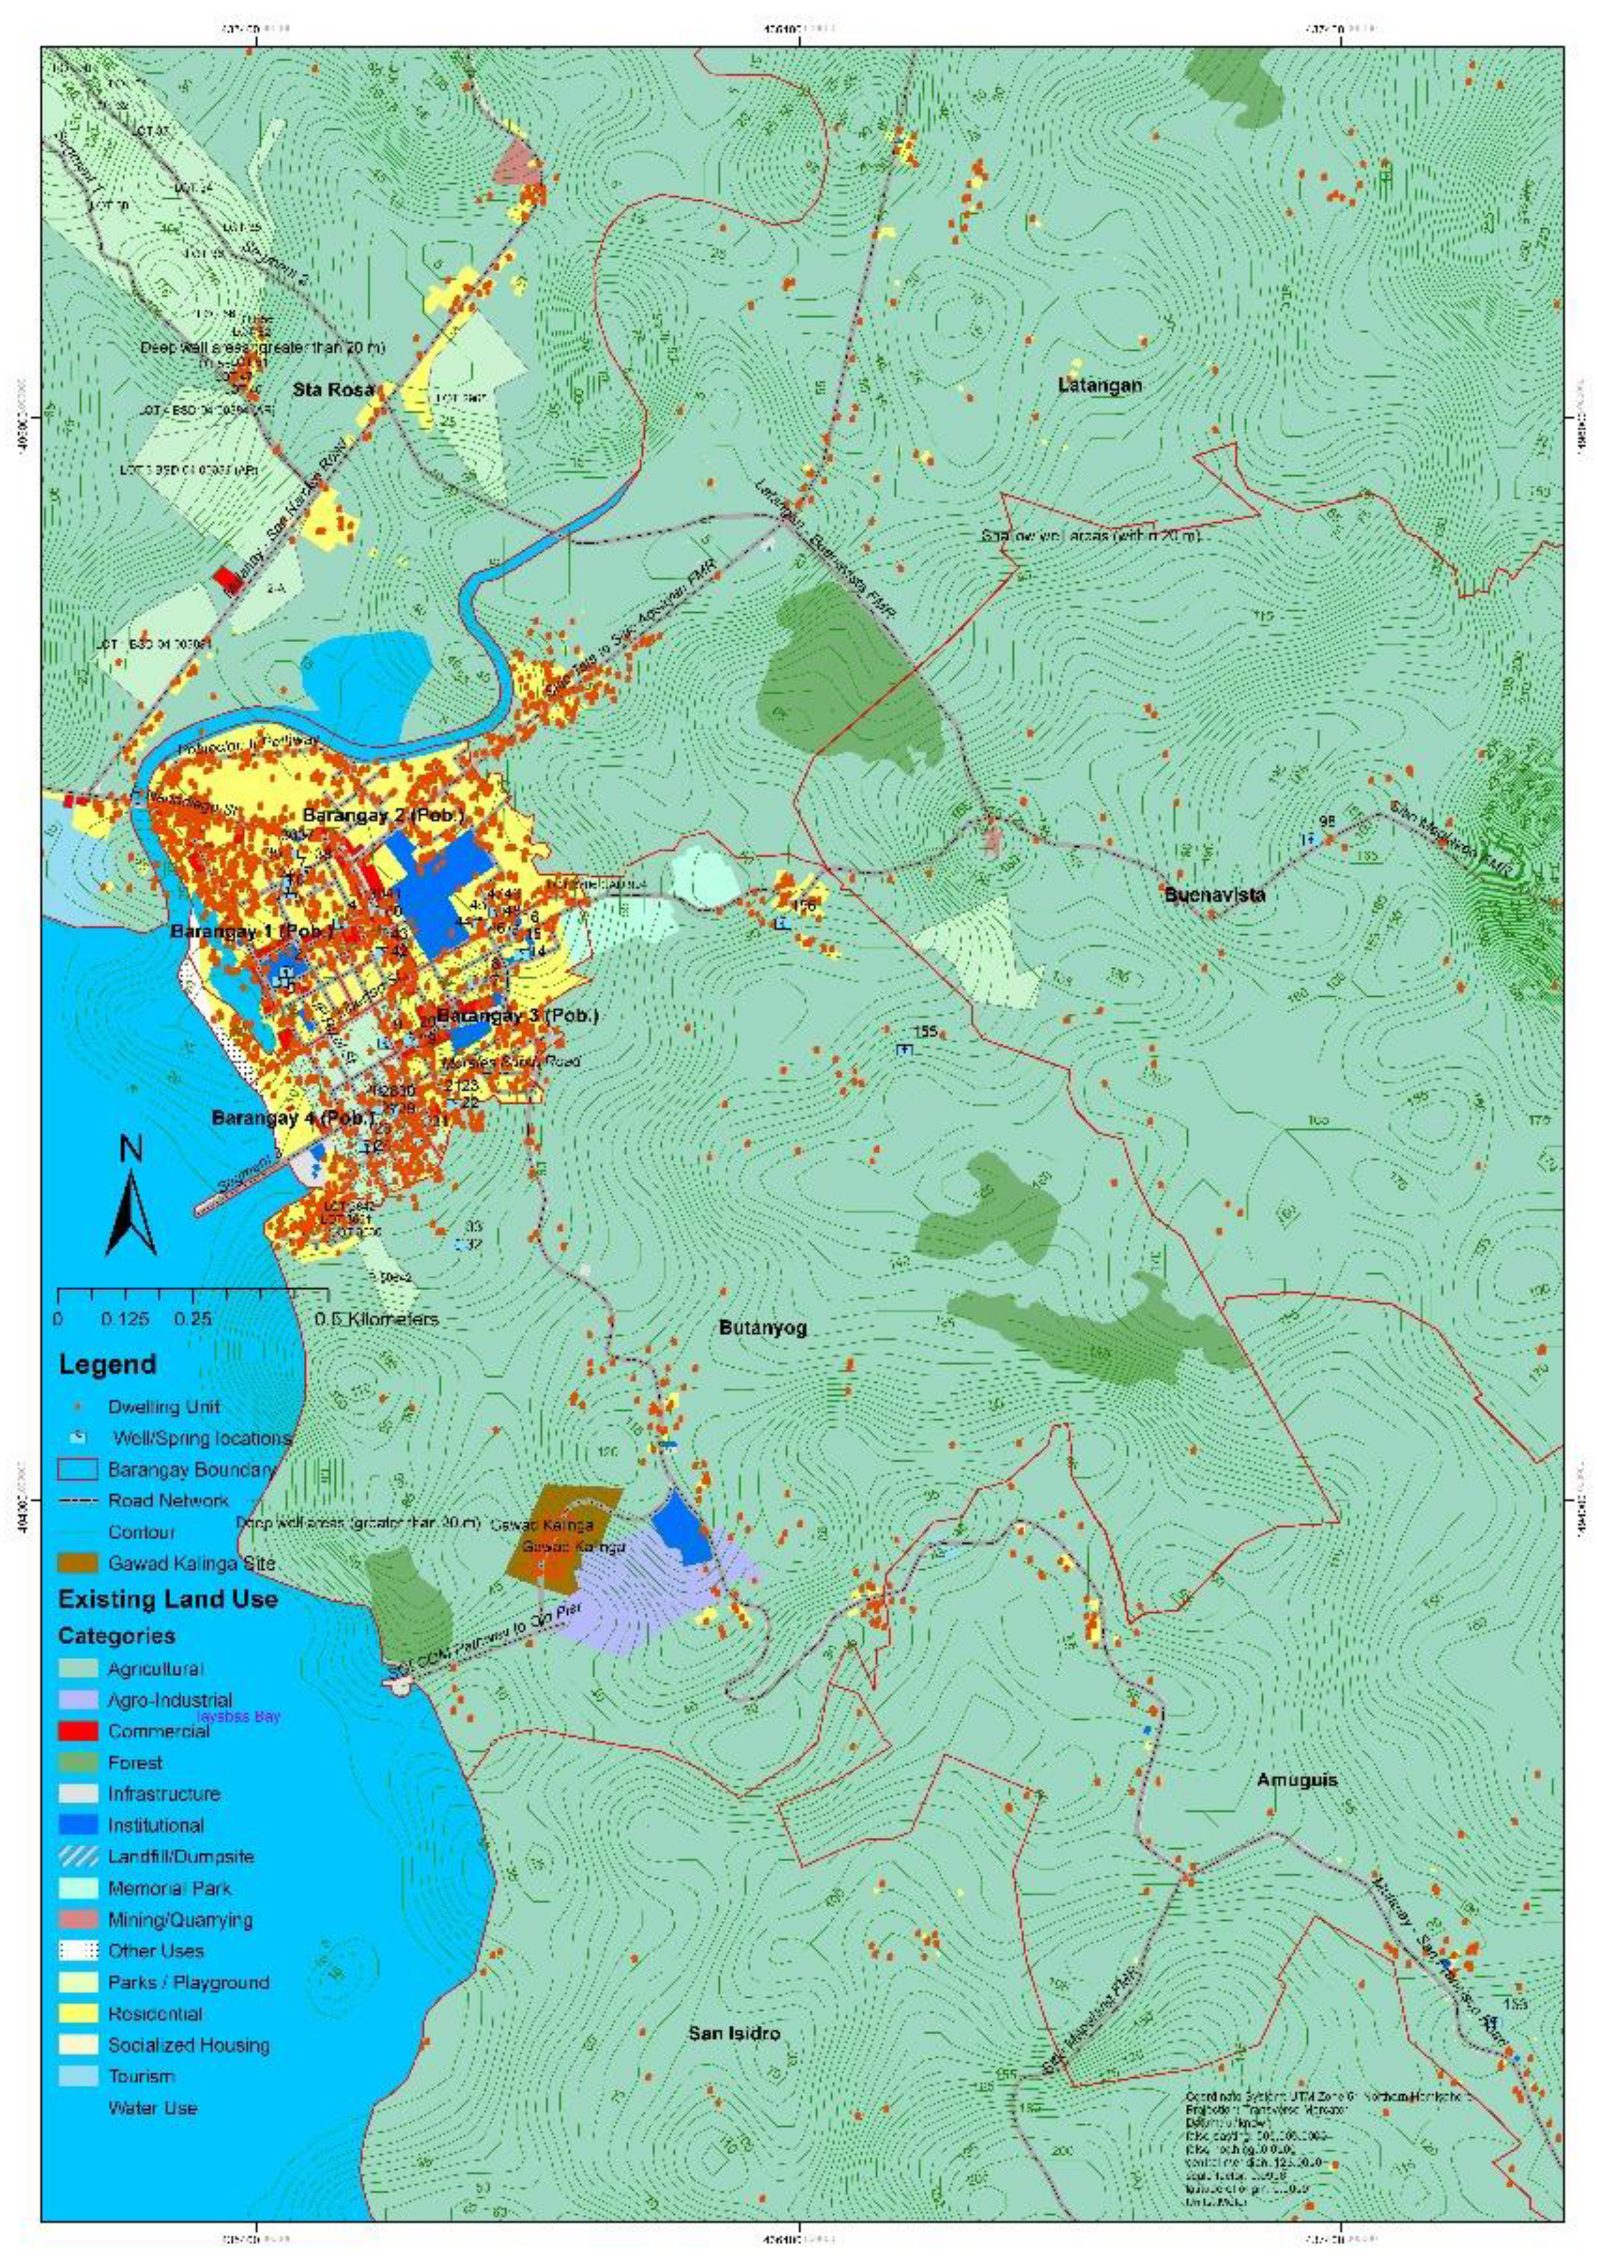
2.1. Study Area

The study was conducted in the municipality of Mulanay in Quezon Province, Philippines (13°31′20″ N and 122°24′50″ E). Mulanay is 279 km away from the southeast of Manila and 142 km away from Lucena City, the capital of Quezon Province. As of 2015, there about 53,123 people living in the 420 km2 area of Mulanay, with a population density of 130 people/km2. Mulanay is one of the identified 331 waterless municipalities in the Philippines. Based on the 2014 community-based monitoring system data of Mulanay (CBMS 2014, Municipality of Mulanay, Quezon Province), more than 80% of the local inhabitants have a limited water supply and nearly 50% lack access to at least basic sanitation.
Shallow wells (<6 m) and springs are the main sources of water in communities farther from the municipality’s town center—the ‘Poblacion’. More compact built up areas are found in the Poblacion and follow a ribbon-type development along main roads. Interior areas bounded by these roads cover mostly agricultural lands and dispersed dwelling units. Figure A1 in the Appendix B provides an image (map) of this arrangement.
As seen in Table 1, the rainfall potential based on four (4) years of record (PAGASA, 2014–2017) shows the latter half of the year with a higher monthly rainfall average, with September having the highest volume and the month of April having the lowest.

2.2. Focus Group Discussion and Social Preparation

A total of three (3) major meetings with the communities were carried out in Mulanay before the Integrated Water System models were implemented in the pilot sites. This activity was conducted to meet the potential participants (e.g., household beneficiaries and university administrators) and to discuss to the stakeholders of the project the project’s benefits and components. The project plan was transparently presented to the stakeholders to elucidate the concepts and objectives of the IWS. The focus group discussions (FGD) and social preparation meetings were facilitated in an interactive manner to give the community insight into the objectives of the study.
The first FGD was an initial consultation meeting with the Local Government Unit of Mulanay. This was undertaken on 30 November 2016 with about 14 participants. The main objective of this activity was to identify the potential demonstration sites for the IWS project. In this first FGD, the concept, project duration, and potential involvement of the local academic institution, as well as the Local Government Unity of Mulanay on the IWS project, were discussed. The focus group nominated the sites that are located near the municipal center so that the recipients could be well monitored. The result of the FGD is discussed in Section 2.3.
The second FGD was held together with the community leaders (i.e., officials from the local government unit, a local agricultural university, and the community village) on 11 February 2017 with approximately 15 participants. This FGD focused on the criteria and process of improving the visibility of the IWS project in the target study areas. This activity also involved discussion of the project and its components. During the discussion, the focus group was able to contribute in determining the criteria for the identification of potential household participants. Consequently, potential household beneficiaries from the community village were identified. Hence, in order to ensure the full commitment of the beneficiaries, a transparent presentation of the project in the target site was planned by the focus group.
Lastly, the third activity was a social preparation meeting with the community village. This activity was held on 20 April 2017. There were 42 household representatives who attended this activity. This social preparation was formulated as a result of the second FGD and focused on meeting the families in the community village while sharing the details about the pilot project and its implementation. Further, the community meeting also involved the discussion of the roles of the research team and the community in the IWS project.

2.3. Site Selection

A stakeholders’ consultation meeting was attended by local community leaders (from the local government, academe, and household sectors) for the site selection process. The 2 sites selected for the case study are: (a) a community village in Barangay Butanyog, where 81.4% of the local inhabitants do not have adequate access to clean water supplies, and 22.6% have limited access to sanitation facilities; and (b) a local agricultural university in Barangay Sta. Rosa, where nearly 50% do not have a safe water supply and nearly 30% do not have sanitary toilets.

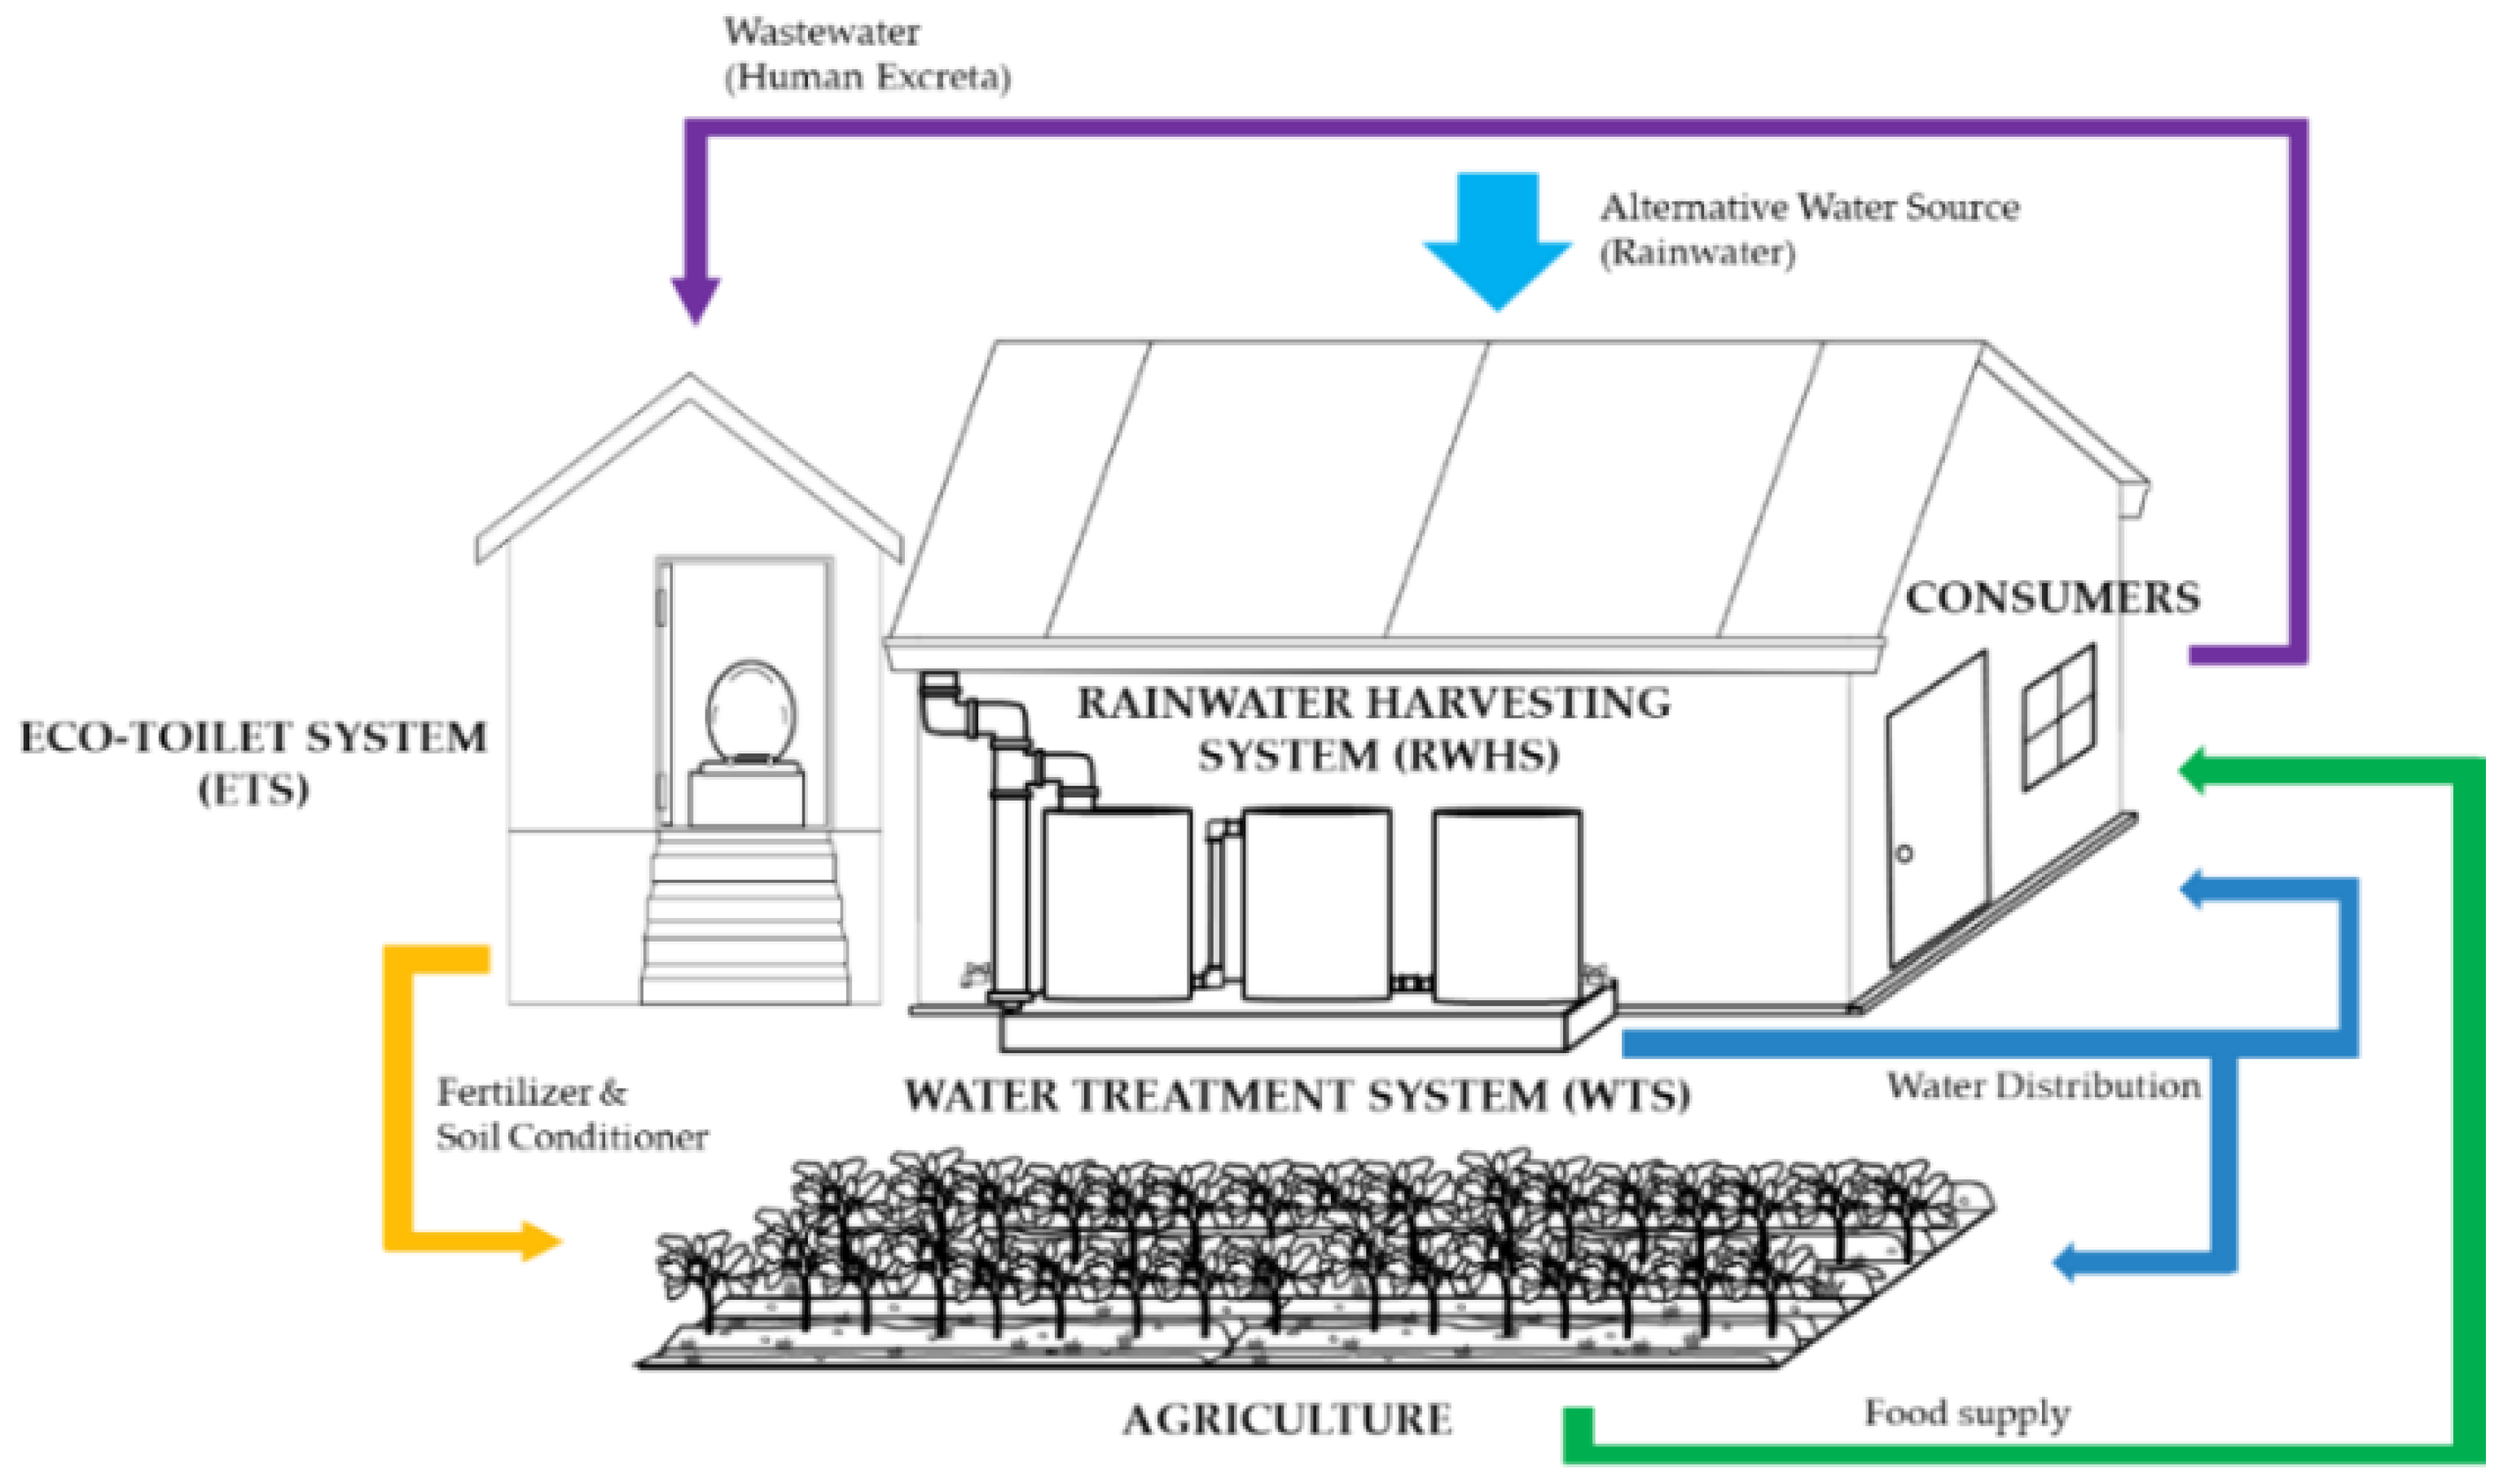
2.4. Components of the Integrated Water System

The proposed Integrated Water System (IWS) is an alternative approach that aims to augment the availability of domestic water supply during wet seasons (approximately from June to November), as well as to reduce the water consumption of toilets. The IWS operates three different major components: (a) a rainwater harvesting system (RWHS) with storage, (b) a low-cost water treatment system (WTS), and (c) a waterless Eco-Toilet System (ETS). The design of the IWS utilized in this study is presented in Figure 1.
This configuration of IWS introduced the following purpose and benefits: improved access to water supply and proper sanitary toilets, water conservation and pollution prevention, proper human excreta management, nutrient recovery, food security, and poverty alleviation.
A total of three (3) IWS units were introduced and installed in the 2 selected sites: one (1) model unit for public use and one (1) unit for private use in a volunteering household in the community village; and one (1) larger unit for public use in the local agricultural university.

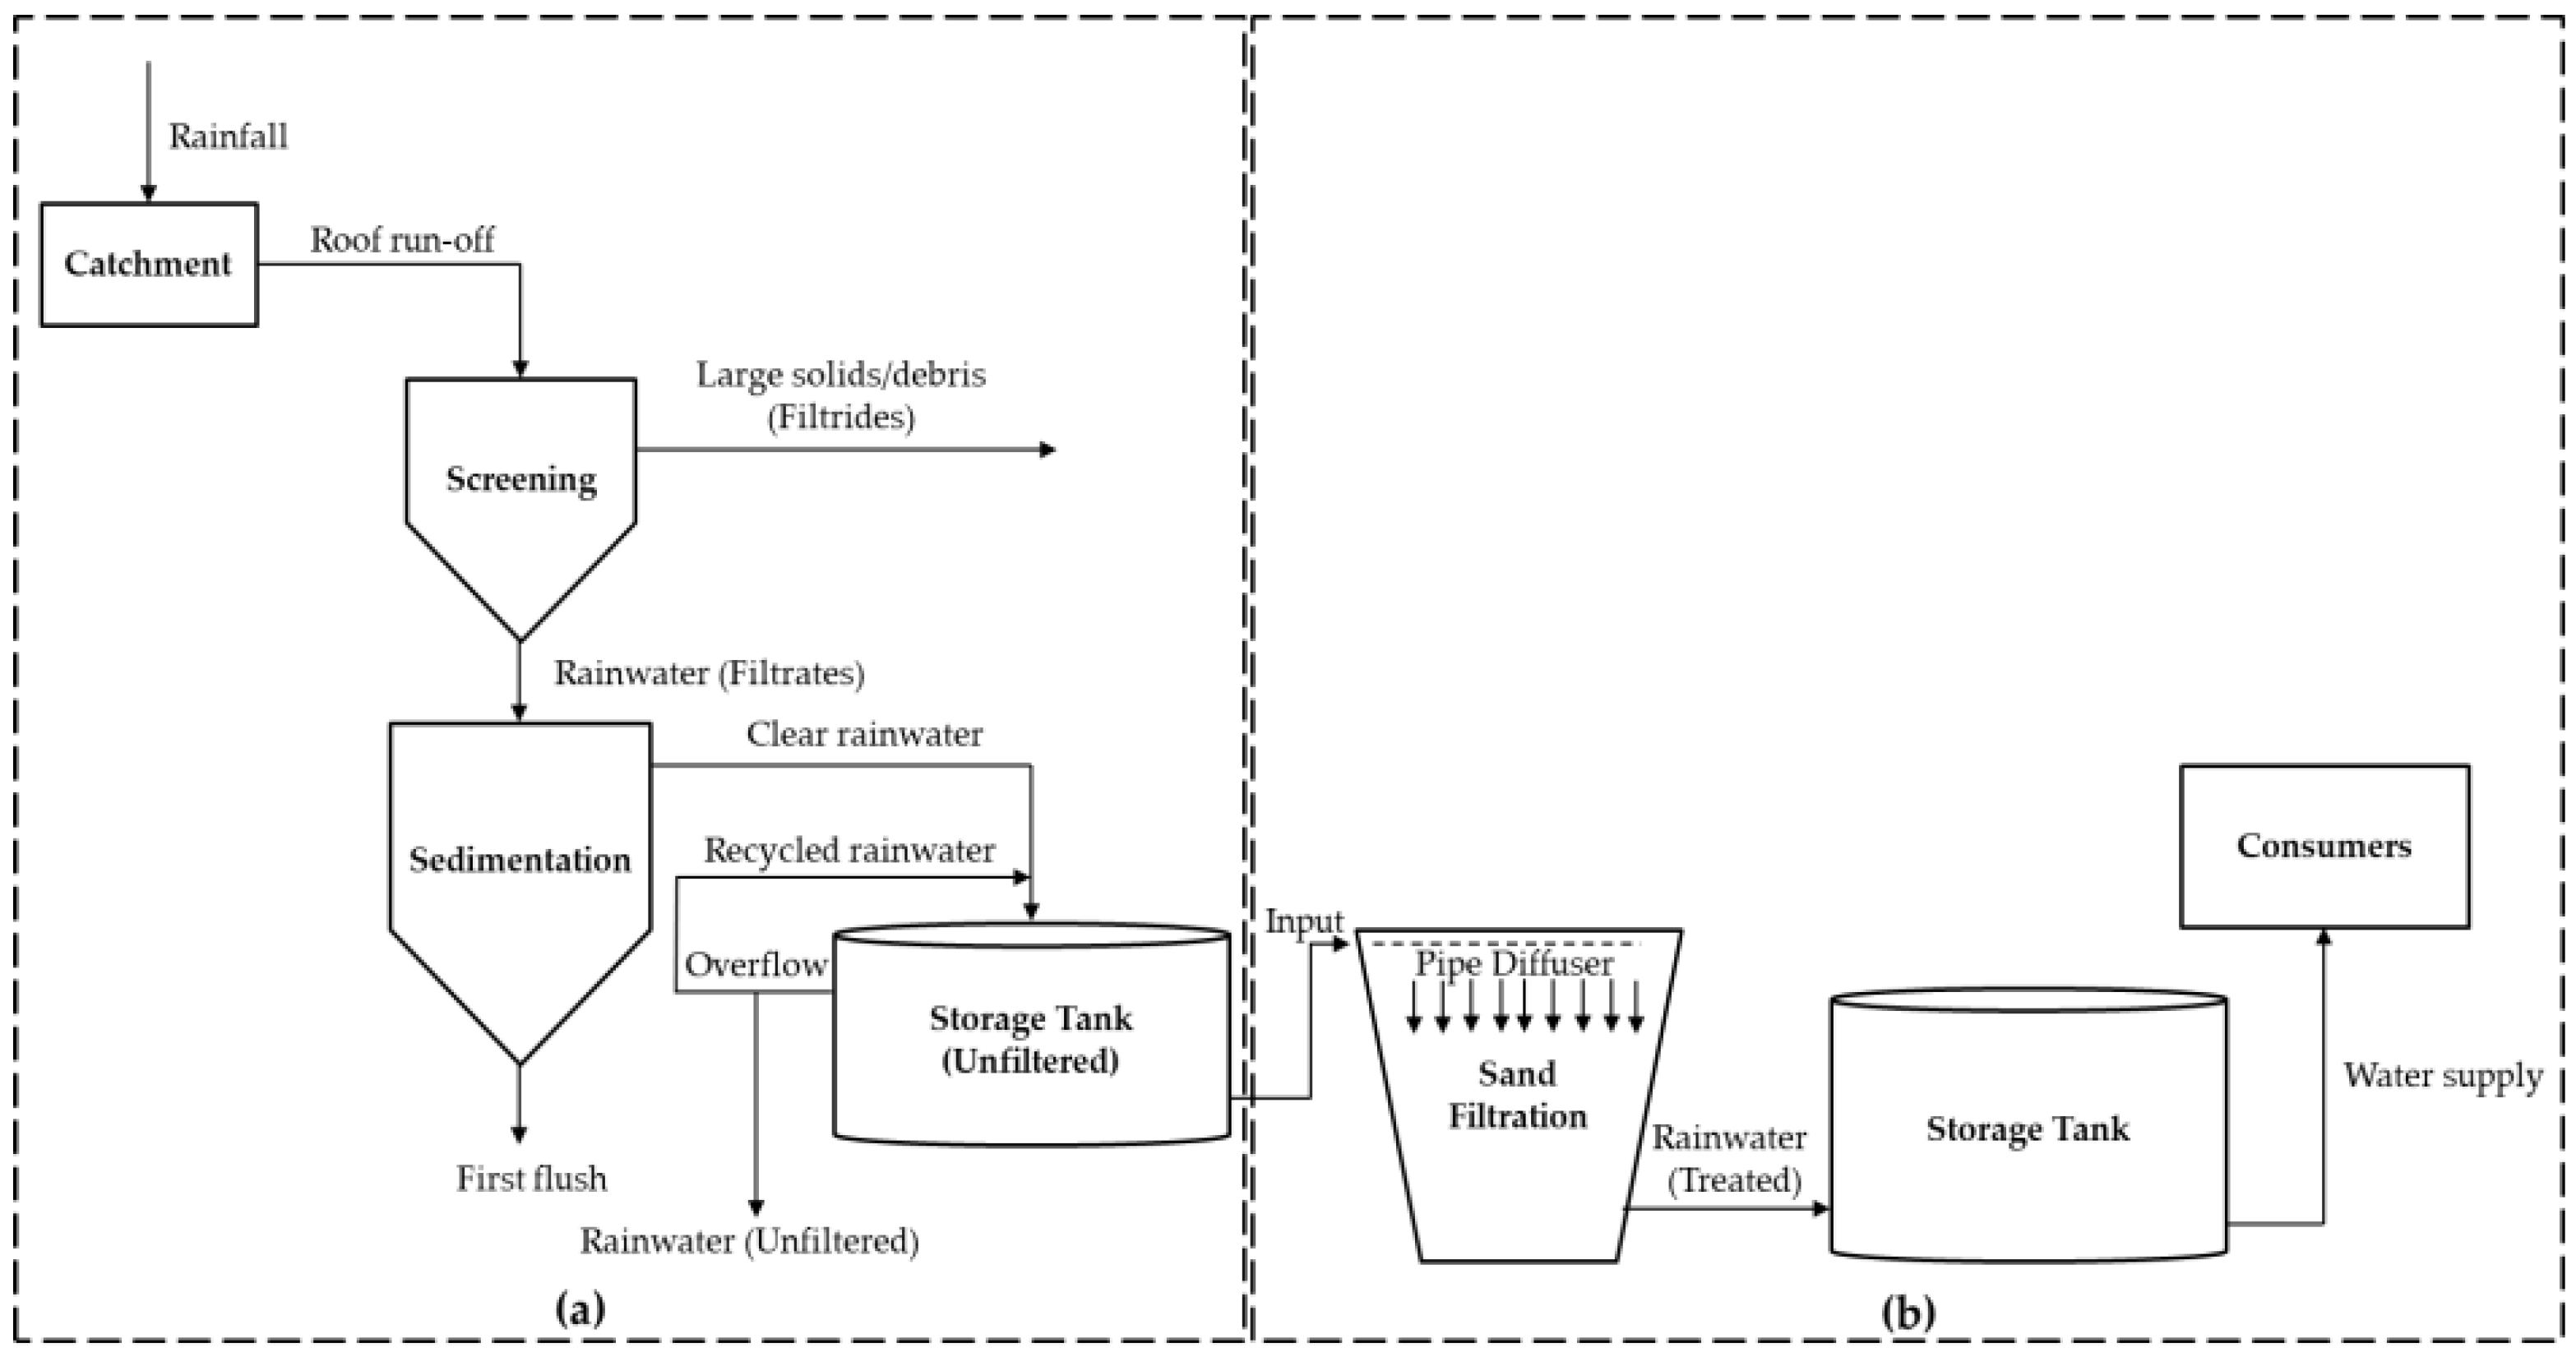
2.4.1. Rainwater Harvesting System (RWHS)

The RWHS included three (3) fundamental processes—catchment, diversion, and storage. A process flow diagram describing the unit operations used for rainwater harvesting is illustrated in Figure 2a.
The catchment process was simply done by collecting rainwater from the rooftop. The rainwater from the gutter passed down through an assembly rain collector for the initial diversion. The net mesh screen filtered possible contaminants, such as leaves, twigs, and other large solids. The initially filtered rainwater entered a standpipe called first-flush diverter. At the beginning of the rainfall, the first flush from the rooftop contained most of the higher concentration of contaminants. The first-flush diverter allowed the removal of particulates, such as dust, small fecal matter, and other smaller debris, through gravity settling (or sedimentation). The first flush can be drained away from the standpipe during the event of rainfall. The contaminants at the bottom of the standpipe could also be diverted from the outflow pipe. The outflow pipe would draw the diverted rainwater into the storage tank. An overflow pipe was also installed on the storage tank in case an excessive amount of water enters the storage. Overflow rainwater was either recycled to the storage or withdrawn from the system.

2.4.2. Water Treatment System (WTS)

Rainwater may still contain suspended solids after the first flush diversion process. This could pose risks to public health when used for general cleaning and, especially, when consumed without prior adequate treatment. Hence, sand filtration was utilized as the water treatment system approach. The harvested pre-treated rainwater was trickled down to the sand filtration unit through a pipe diffuser unit. The configuration of the filter consists of a top (fine sand (<0.7 mm)), a middle (fine gravel (0.7–6 mm)), and a bottom (coarse gravel (6–12 mm)). The summary of this process is illustrated in Figure 2b. It should be noted, however, that the WTS for this study is intended for general use in the household and not for consumption as potable water.

2.4.3. Eco-Toilet System (ETS)

The ETS was designed to collect, treat, and reuse human excreta without using water in the processes. With appropriate treatment, the ETS could convert human urine and feces into liquid fertilizer and soil conditioner. Human urine and feces contain valuable materials, such as nutrients, which can be recovered and reused for agricultural production. The ETS has four main components: the superstructure, urine-diverting toilet, composting chamber, and urine storage.
In this study, ETS involved three (3) basic processes in the sanitation cycle. These processes included urine diversion, storage and treatment, and application to agriculture. Urine and feces directly entered two separate containers for storage and treatment. The urine was piped down to a closed high-density polyethylene (HDPE) container for hygienization [24] while feces fell down to a chamber for aerobic composting. During the collection and storage of urine, the containers were tightly sealed to avoid the release of phosphorus precipitates and ammonia vapor. The relationship between the materials’ flow and ETS is presented in Figure 1.

3. Methodology

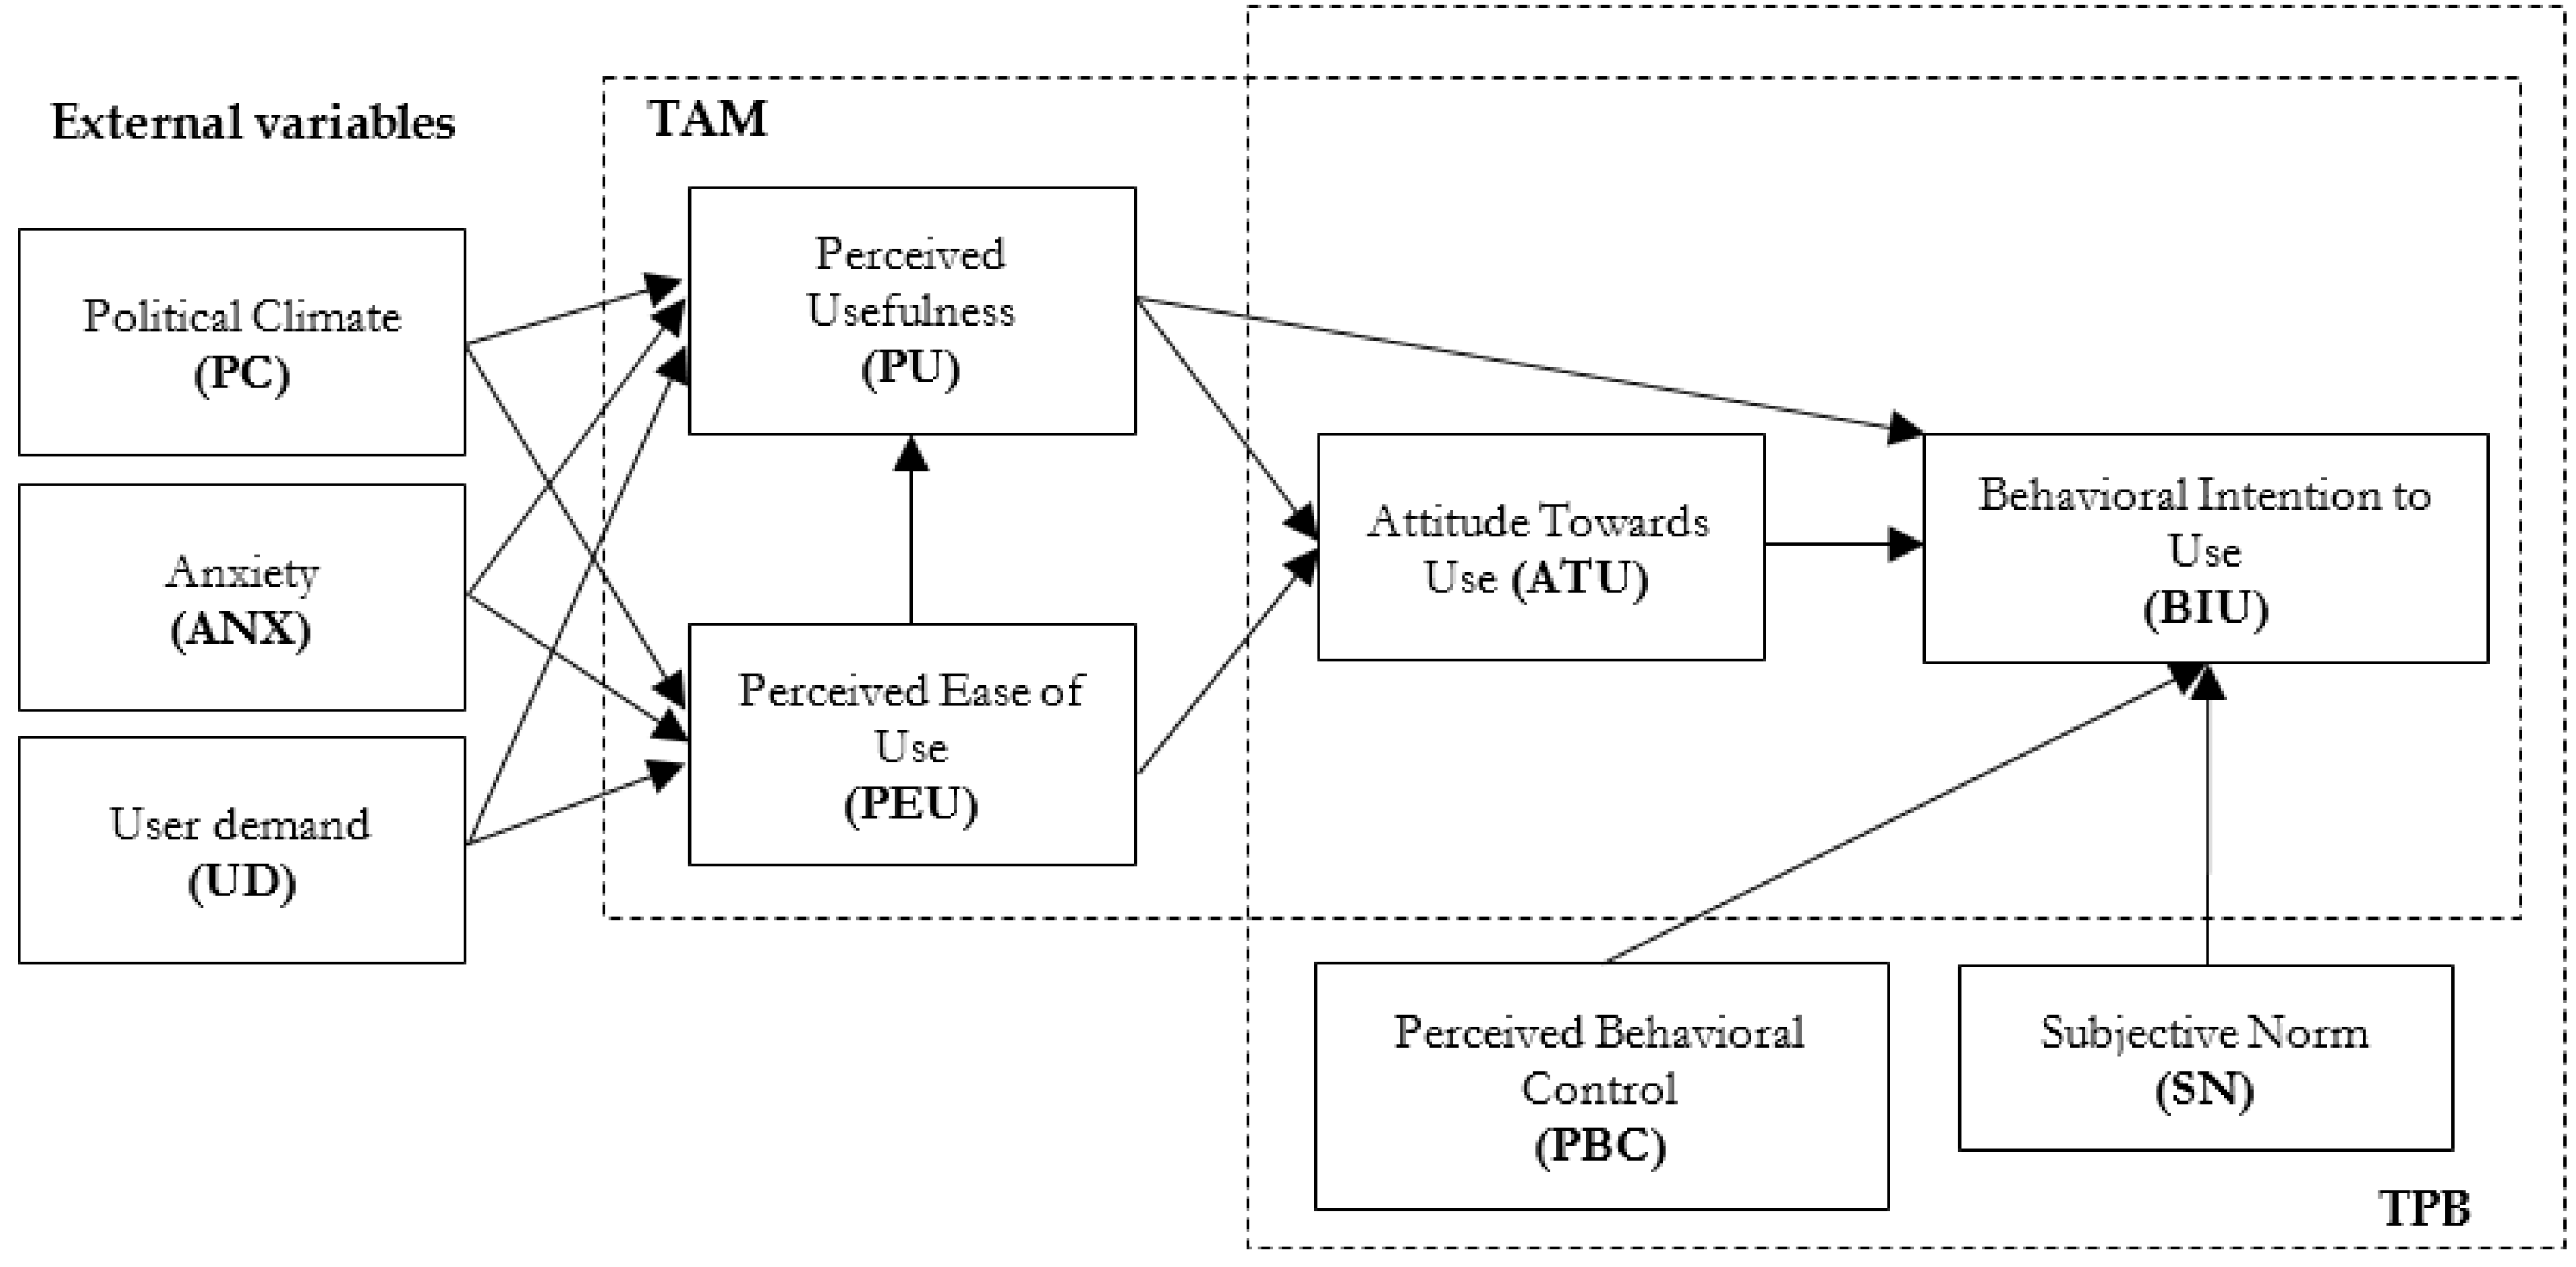
3.1. Research Framework, Variables, and Hypotheses

This study focused on behavioral intention as a measurement of the social acceptability of the Integrated Water System in Mulanay using the Combined Technology Acceptance Model and Theory of Planned Behavior (C-TAM-TPB) framework.
C-TAM-TPB is an integrated model of two decision-making theories—information systems theory (technology acceptance model) and the theory of planned behavior. C-TAM-TPB was established by Taylor and Todd to interrelate TAM and TPB, thereby forming a more powerful technique for predicting consumers’ behavioral intentions [25,26,27]. Both TAM and TPB are used to assess the behavioral intentions of consumers (or users) of new technology. The assumption of TAM is that the behavioral intentions of consumers towards use of a new technology depends on the perception of how the new technology works for them. In TPB, the assumption is that behavioral intention is based on the influence of the beliefs and norms of consumers. Hence, C-TAM-TPB considers both assumptions. Each variable was described by their respective measurement items presented in Table A3 and Table A4 in the Appendix A.
The research framework, variables, and hypotheses adopted in this study were based on previous research [19] that focused on ETS only. These elements are presented in Figure 3 and Table 2. However, aside from ETS, the current study holistically included and explicated the social perception of the other components of IWS, i.e., RWHS and WTS. Moreover, the results of the current study utilized Partial Least Squared-Structural Equation Modeling (PLS–SEM) instead of multiple linear regression for the analysis.
PLS–SEM is a second-generation multivariate technique for evaluating structural models [28], such as those of the C-TAM-TPB. Although similar to the multiple linear regression method, PLS–SEM has several advantages. These advantages include convenience, flexibility, and the ability to explain more information, such as the predictive relevance and indirect effects of the variables.
Multiple linear regression is a powerful technique for estimating the variance in an interval independent variable based on the linear combination of interval independent variables [29]. This method can also predict the coefficients and standard errors—the relationship between at least one independent variable and a dependent variable. PLS–SEM mostly likely functions the same. However, the multiple linear regression method has to be performed in sequential steps of ordinary least squares regressions. In PLS–SEM, the analysis of all variables can be performed simultaneously, thus, relatively, consumes less time on the analysis. Therefore, the practicality of the procedure was considered as a strong factor for utilizing PLS–SEM instead of multiple linear regression.
PLS–SEM assumes that the data are not normally distributed [20]. Hence, this technique utilizes a non-parametric bootstrapping procedure to test the hypotheses. In bootstrapping, the original samples are replaced by random repeated multiple subsamples to generate bootstrap samples. These bootstrap samples are used to estimate the level of significance of the path coefficients.
Further, aside from the assessment of each path coefficient through bootstrapping, in PLS–SEM, the significance of the indirect effects of each variable on endogenous variables can also be verified [30]. Moreover, the behavior of exogenous variables on endogenous variables can also be predicted in PLS–SEM using a blindfolding process [31]. This can serve as a guide to improve the model. In conclusion, these are some of the limitations of multiple linear regression that PLS–SEM can address.
In this study, analysis of C-TAM-TPB using the PLS–SEM method is applied in three major steps (Figure 4).

3.2. Survey Instrument

A survey instrument was developed to investigate the social acceptability (based on the behavioral intention) of the users of IWS. The questionnaire was divided into five (5) sections: (1) a consent form and declaration if illiterate (approved by the Research Ethics Office of De La Salle University, Manila), (2) a demographic profile of the respondents, (3) a general questionnaire, (4) a C-TAM-TPB questionnaire for RWHS with WTS, and (5) a C-TAM-TPB questionnaire for ETS. All questionnaires were translated into the Filipino vernacular used in the study area.

3.3. Measurement Scale and Measurement Items

All C-TAM-TPB questionnaire items were scored using a 5-point Likert scale (1 = strongly disagree; 2 = moderately disagree; 3 = neutral/undecided; 4 = moderately agree; 5 = strongly agree). The measurement items for each construct were depicted in Appendix A: Table A2 and Table A3. For RWHS with WTS, 3 measurement items for political climate, 3 for user demand, 4 for anxiety, 2 for perceived usefulness, 2 for perceived ease of use, 2 for attitude towards use, 3 for perceived behavioral control, 2 for social norms, and 3 for behavioral intention towards use of the technology were used to evaluate each construct. For ETS, 3 measurement items for political climate, 5 for user demand, 5 for anxiety, 2 for perceived ease of use, 3 for perceived usefulness, 3 for attitude towards use of the technology, 3 for perceived behavioral control, 3 for subjective norms, and 2 for behavioral intention to use the technology were considered for the evaluation of each construct.

3.4. Data Collection
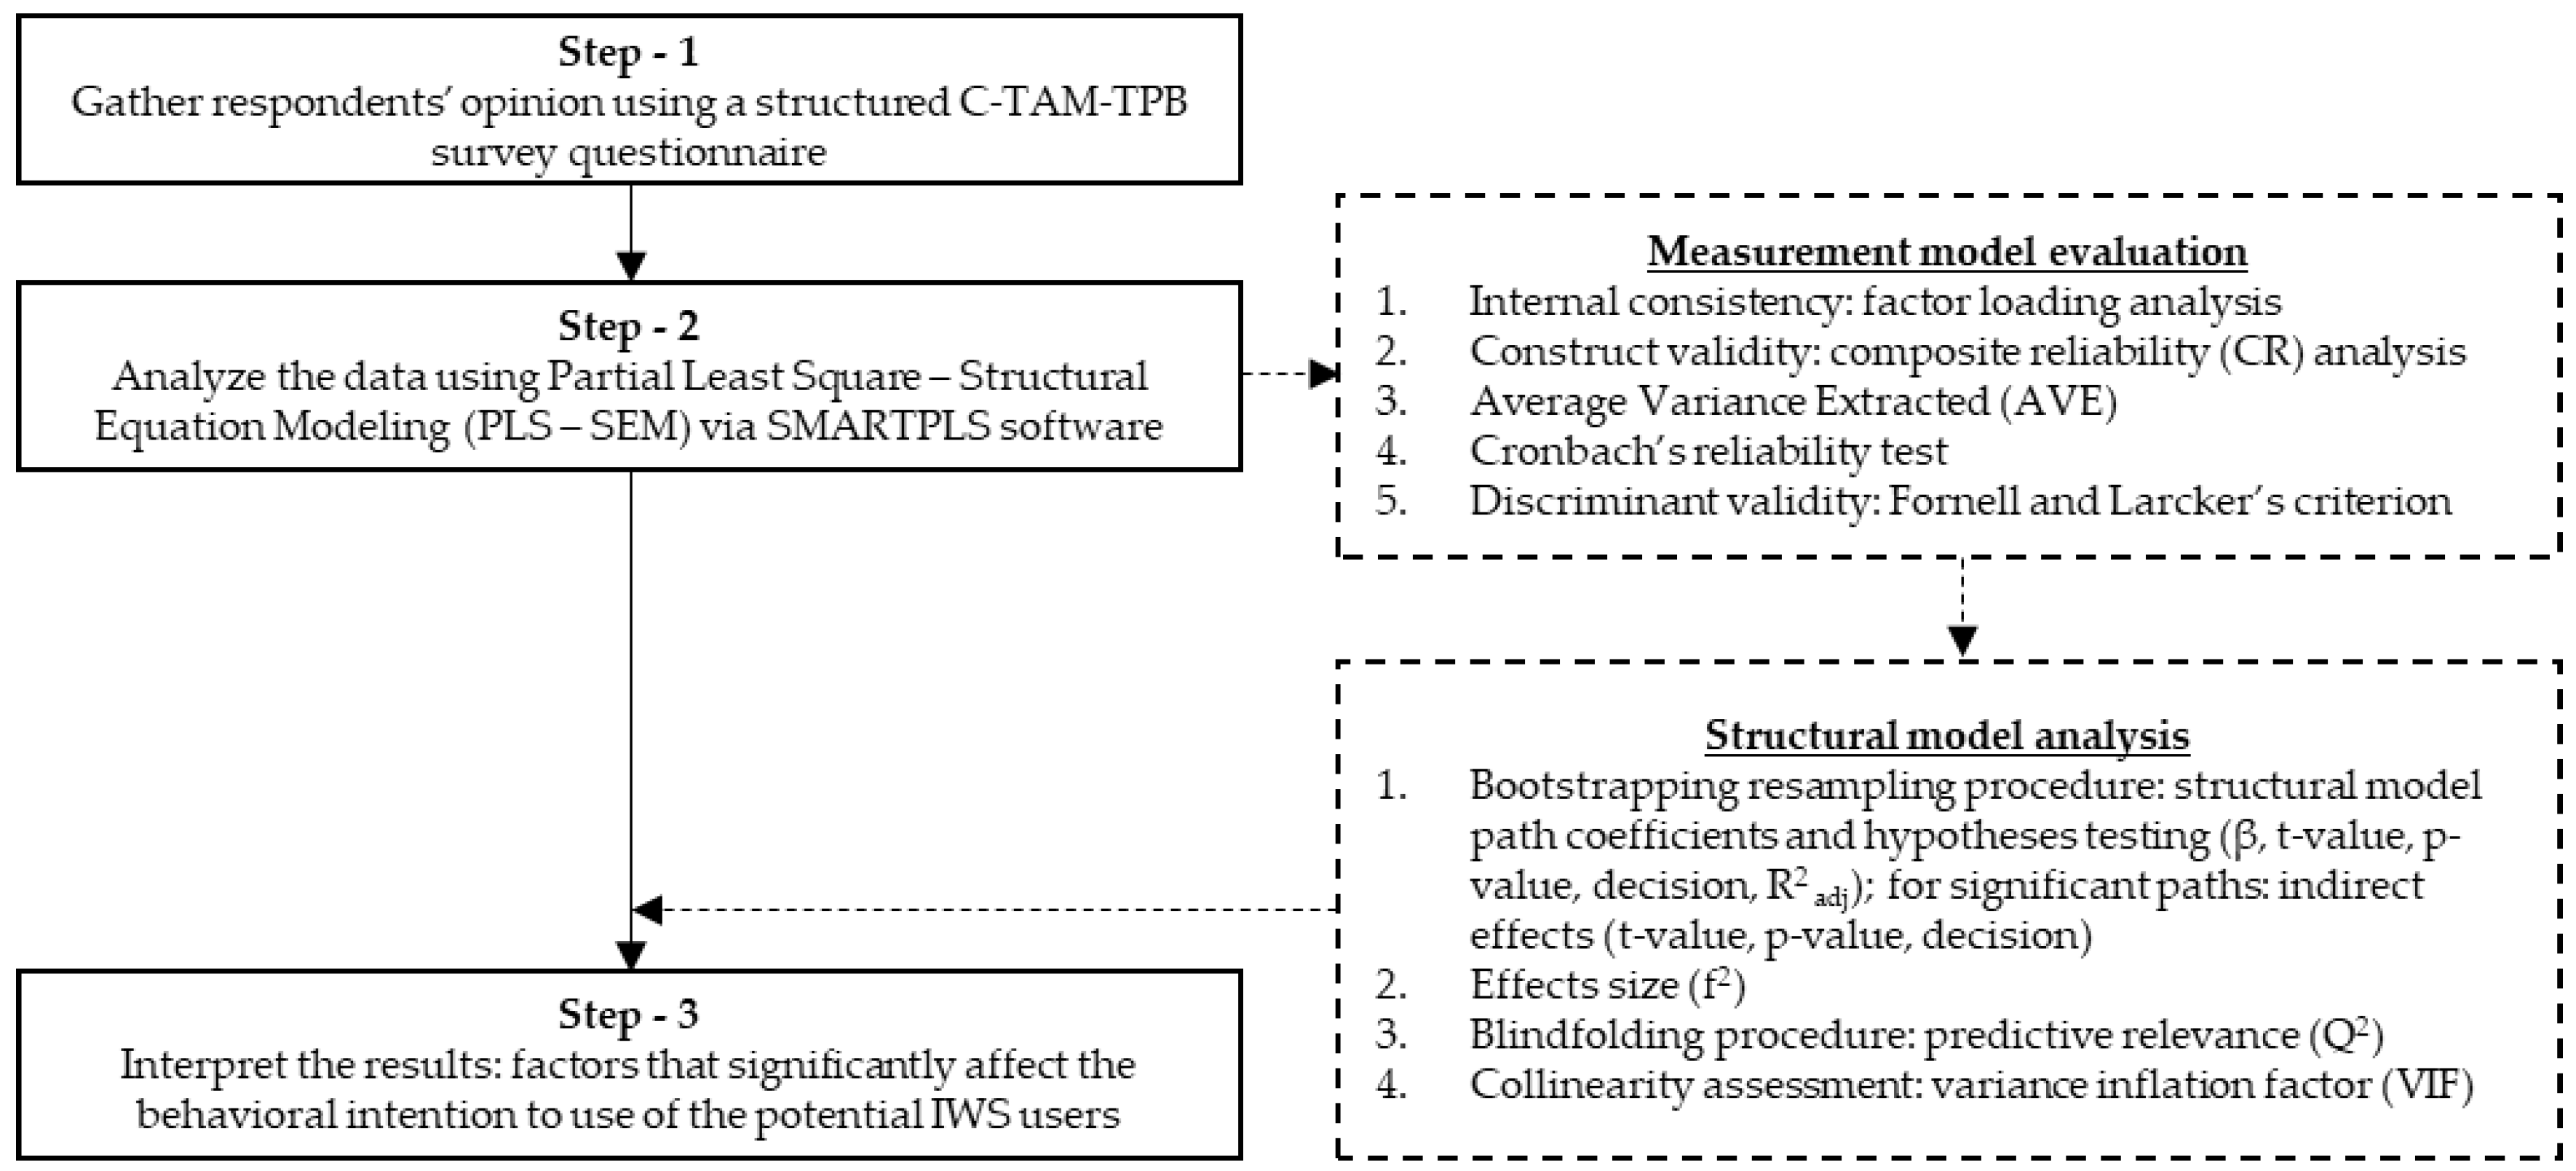
For this study, a non-probability convenience sampling approach was utilized for collecting data in the study areas. Survey activity was conducted in two sites: a settlement village with 2 IWS units and an agricultural university with 1 IWS unit. Questionnaires were distributed to the target respondents. A total of 196 questionnaires were distributed, with 59 participants from the settlement village and 137 from the local agricultural university.

3.5. Data Analysis

The data were analyzed using 2 different software packages: Statistical Package for the Social Sciences (SPSS) ver. 16 (SPSS Inc., Chicago, IL, USA) and SmartPLS 3 [32] for C-TAM-TPB data. Using SPSS ver. 16, the responses on demographic and general questionnaires were examined by a descriptive statistics analysis and a non-parametric test (Mann–Whitney U-test). The descriptive statistics analysis was used to present frequency and ratio. On the other hand, the Mann–Whitney U-test was used to compare the responses of the two groups. In addition, SmartPLS 3 was utilized to run the Partial Least Square-Structural Equation Modeling (PLS–SEM) for the analysis of the C-TAM-TPB framework. SmartPLS 3 can generate all data needed to assess the measurement model and structural model.
Measurement model assessment was used to test the convergent validity of the measurement items and the discriminant validity of the constructs. Construct validity examines the factor loading, Cronbach’s alpha, average variance extracted (AVE), and composite reliability (CR) of the measurement items, and constructs, while the discriminant validity tests the unidimensionality of the constructs. On the other hand, structural model evaluation (i.e., Partial Least Square—Structural Equation Modeling) based on bootstrapping was used to test the research hypotheses. The effect size and predictive relevance of the model were also measured.

4. Results and Discussion

4.1. Demographic Profile of Valid Respondents

The demographic profile of the valid respondents is presented in the previous study [19]. However, only 27 returned questionnaires from the university community were incomplete and were taken out from the data analysis. Hence, the combined numbers of the valid questionnaires from the two community groups formed a total of 169 sets of valid questionnaires for the analysis. Therefore, the succeeding discussions reflect the aggregated responses of the household and university communities.

4.2. Community Water Sources

A set of questions, with the objective of learning the current status of the water resources in Mulanay, was given to the respondents (N = 169). Most respondents reported that the main source of their water for their daily consumption is from a piped water household connection by water concessionaires (n = 151). Other sources include piped water from a communal point (n = 141), stand-alone water (n = 140), a water refilling station (n = 100), a private well (n = 71), neighbors (n = 71), and bottled water (n = 2). A summary of this information is presented in Table 3.

4.3. Socio-Economic Considerations

According to the Rapid Community Based Monitoring System (RCBMS) of Mulanay in 2014, 83.13% of the municipality’s population do not have access to safe water supplies. From this data, 81.42% of residents of Butanyog and 46.68% of Sta. Rosa do not enjoy this human right.
In Table 4, the median scores show that both respondents from household and university communities agree that there is a possibility that Mulanay will face a water shortage in the near future. Another survey question was carried out, and the results revealed that 57% of the respondents think that they do not have enough of a water supply. Hence, both community groups strongly agree that water should be conserved.
The results of the previous study support this information [19]. Findings show that the Mulanay community is seeking green technology that can provide opportunities to save water, e.g., eco-toilet system. Such an approach can benefit the Mulanay community, especially during dry seasons when water becomes scarcer. Although the median scores were identical, the Mann–Whitney U-test showed that there was a significant difference between the responses of the two community groups. The test revealed that the university group expressed stronger agreement about water conservation.
Moreover, 46.03% of Mulanay’s population does not have proper sanitary toilets based on the RCBMS (2014). The survey says that majority of the respondents (83.4%) in Mulanay think that their primary water supply is not fit for drinking (Table 5). For this reason, many of the respondents (about 60%) rely on drinking water from water refilling stations for regular consumption (Table 3), despite the associated costs.
Besides the availability of clean water, the affordability of water poses another issue. Water consumption and its opportunity costs depend on the consumption patterns of the consumers. Table 3 shows that majority of the respondents (n = 151) spend money on a private piped water connection provided by a water concessionaire. Based from the survey, the mean cost of the water bills in Mulanay can roughly reach Php 236.09 per month. However, the charges to from these water services are deemed ‘expensive’ by more than 50% of the respondents. With approximately 25% of the residents with income below the poverty threshold, water opportunity costs may be challenging to the marginalized population in Mulanay. The median scores presented in Table 4 show that the respondents strongly agree with the idea that water bills should be kept low so that more people can afford water and benefit from improved water services.

4.4. Empirical Findings on C-TAM-TPB as PLS–SEM Model

The Combined Technology Acceptance Model and Theory of Planned Behavior (C-TAM-TPB) is used as the theoretical foundation for the evaluation of the perceived acceptance of the potential users of IWS in Mulanay. The model was analyzed using Partial Least Square—Structural Equation Modeling (PLS–SEM). The results were presented in two cases: Case 1 for RWHS with WTS and Case 2 for ETS.
Case 1: RWHS with WTS
First, the measurement models were analyzed. Each construct has its own respective indicators (measurement items). Factor loading, composite reliability (CR), average variance extracted (AVE), Cronbach’s alpha (α), and Fornell and Larcker criteria are used to estimate the composite and discriminant validity, as well as the reliability of the measurement models.
According to Hair et al. [33], the recommended threshold value for factor loading, composite reliability, and Cronbach’s alpha is 0.70. For average variance extracted (AVE), which is used to assess the convergent validity of the construct, the threshold value recommended by Fornell and Larcker [34] is 0.50. All items with measurements below the threshold values will be deleted and not included in the further analyses.
In Table 6, all items satisfied the recommended ranges for all parameters except the following: in factor loading, ANX1, ANX5, PBC1, PBC3, and PBC4; in AVE, perceived behavioral control; in Cronbach’s alpha, perceived behavioral control and behavioral intention towards use. Ideally, as a rule of thumb, all items should be equivalent to or above the recommended values. Otherwise, these items should be deleted prior to the next part of the analysis. However, it is important to examine the problematic variables prior to the elimination of items.
For example, it can be observed that ‘perceived behavioral control’ and ‘behavioral intention towards use’ suffer from low Cronbach’s alpha measures, which could be an indication of the non-unidimensionality of the measurement items used in the questionnaire of each construct. Thus, these measurement items possibly do not represent the constructs appropriately. Therefore, indicators with low factor loading coefficients (<0.70) must be removed. However, according to some studies, there are some exemptions to this standard range. Some values nearly below the ideal acceptable range can be accepted for analysis in certain conditions. In 2010, a study by Hair et al. [33] suggested that the factor loading threshold can be adjusted down to a cut-off value of 0.50. The authors argued that this tolerable minimum value is reasonable for exploring behavioral studies.
In the case of the construct Perceived Behavioral Control, some parameters are below the recommended acceptable ranges. If the tolerable minimum factor loading value (0.500) is utilized, PBC1 (0.636) and PBC3 (0.542) can still be used for the next part of the analysis. Moreover, it can also be observed that the AVE (0.411) and Cronbach’s alpha (0.629) of the construct are low. A solution for such a situation was also addressed by Hair et al. [33]. The study of Hair et al. [33] suggests that a Cronbach’s alpha within a range of 0.60 to 0.70 can still be accepted for analysis. Thus, when used in this study, the construct will not be eliminated. Although this standard is not ideal for some researchers, many publications still consider these values for analysis. However, to be acceptable, certain limitations of these measurements must be addressed, and the results of other parameters must also be observed.
Certain deviation from the standards could be applied to some conditions. In reference to the recommendations of Fornell and Larcker [34], although the AVE reading is below the 0.50 threshold, this value can still be acceptable, provided that the composite reliability (CR) is above 0.60. However, an AVE below the lowest tolerable (0.40) will no longer be accepted. Based on the results, the CR (0.716) value for the Perceived Behavioral Control satisfies the conditions of Fornell and Larcker.
The minimum tolerable Cronbach’s alpha value (0.60) was utilized for the Behavioral Intention to Use. It is reasonable to accept the Cronbach’s alpha reading for Behavioral Intention (0.600), since other parameters (factor loading, CR, and AVE) are within highly acceptable ranges.
Table 7 confirms the discriminant validity of all remaining constructs. The cross-loadings of each construct can be computed by calculating the square root of AVE per construct. According to Fornell and Larcker [34], the cross-loadings of each construct (presented by the underlined numbers) must be higher than their respective AVEs to confirm discriminant validity. This means that all questionnaires used to evaluate the constructs are suitable for representing each of their corresponding constructs.
The estimation of the inner measurement model or structural model is used to predict the relationships among the constructs. Structural model assessment is also used to test the hypotheses of this study (Table 2). Several parameters were examined for the assessment of the structural model. Hair et al. [33] suggest the following parameters: β, t-values, p-values, effect size f2, R2, VIF, and predictive relevance Q2. Bootstrapping with resampling of 500 repeated subsamples was also conducted in the analysis.
Table 8 shows that out of thirteen hypotheses, only five were accepted. In summary, the Perceived Ease of Use (H4) was found to be a significant predictor of Perceived Usefulness, Political Climate (H5) for Perceived Ease of Use, both Perceived Usefulness (H8) and Perceived Ease of Use (H9) for Attitude Towards Use, and Attitude Towards Use (H11) for Behavioral Intention. The significant path of H4 means that the target users should feel the convenience, ease of use, and learnability of the RWHS and WTS for them to feel that the technology is suitable for their needs. Their perception of ease of use, on the other hand, could be significantly influenced by how their local leaders act towards the technology and the problems that it aims to solve (Path H5). In other words, potential users may deem this technology easy and convenient if the government recommends such an approach to the community. Further, potential users could gain more positive attitudes if they find the RWHS and WTS uncomplicated and can increase their performance in terms of improving their water supply (Path H8). Lastly, the findings confirmed that behavioral intention is determined by the attitudes of the target users toward the RWHS and WTS (Path H11).
Based on the regression analysis, 51.9% of the variance in Perceived Usefulness can be explained by the variable Perceived Ease of Use, 8.88% of the variance in Perceived Ease of Use can be explained by the Political Climate, 26.3% of the variance in Attitude Towards Use can be explained by the variables Perceived Usefulness and Perceived Ease of Use, and, lastly, 13.4% of the variance in the Behavioral Intention to Use can be explained by the Attitude Towards Use. However, the adjusted R2 values for Perceived Ease of Use and Behavioral Intention are low, indicating a weak relationship between constructs. These values are usually anticipated in such a study, since human behavior is fairly unpredictable. Meanwhile, regardless of the low adjusted R2 readings, significant predictors such as Political Climate (β = 0.271, t = 3.466, p < 0.050) and Attitude Towards Use (β = 0.317, t = 3.562, p < 0.050) can still draw a significant trend for Perceived Ease of Use and Behavioral Intention to Use, respectively.
In Table 9, the indirect effects of the significant constructs were presented. For Political Climate, although it was a significant predictor of Perceived Ease of Use, it showed no significant indirect effects on paths heading to Attitude Towards Use and Behavioral Intention to Use. On the other hand, all other remaining variables on their respective paths, indicated on the same table, had significant indirect effects, accordingly. This means that some variables mediate the relationship of an exogenous variable and an endogenous variable. For Perceived Ease of Use, Perceived Usefulness mediated its indirect relationship to Attitude Towards Use. In addition, both Perceived Usefulness and Attitude Towards Use mediated its relationship to Behavioral Intention to Use. In another path, Attitude Towards Use mediated Perceived Usefulness and Behavioral Intention. Lastly, Attitude Towards Use acted as mediator of Perceived Usefulness and Behavioral Intention to Use.
Additionally, the f2 values estimate the relative effect sizes of each predictor. Cohen (1988) considers f2 ≥ 0.35 to describe predictors with a large effect, 0.35 > f2 ≥ 0.15 for medium effect, and 0.15 > f2 ≥ 0.02 for a small effect. As significant predictors, Perceived Ease of Use has a large effect on Perceived Usefulness with an f2 reading of 0.896; Political Climate has a small effect on Perceived Ease of Use (f2 = 0.081); Perceived Usefulness and Perceived Ease of Use have a small effect on Attitude Towards Use with f2 = 0.074 and f2 = 0.035, respectively; lastly, Attitude Towards Use also has a small effect on Behavioral Intention (f2 = 0.079).
A blindfolding process was also added in the analysis. This is done to predict the validity of the model. Cross-validated redundancy was utilized for the measurement of Q2, where Q2 < 0 is acceptable. Q2 values revealed that all endogenous constructs are within the acceptable limit.
An assessment of collinearity statistics was to be carried out to check for multicollinearity and the collinearity of the measurement items. This is represented by the variance inflation factor (VIF). According to Hair et al. [33], the acceptable VIF values are within the range of 0.2–5.0. This shows that multicollinearity does not exist in the observed variables. However, 5.0 < VIF < 0.2 values are not acceptable. These values indicate problematic items.
Case 2: ETS
For ETS, the same model and analytical tools were applied. Moreover, the same respondents were utilized to generate the data. Based on the results shown in Table 10, there are two problematic constructs: Anxiety and Perceived Behavioral Control. For anxiety, four out of five measurement items did not pass the required tolerable acceptable values. Moreover, CR (0.391) and AVE (0.179) values for the Anxiety construct are very low. Therefore, this construct must be removed from the analysis. On the other hand, the construct Perceived Behavioral Control was eliminated because it was not able to secure the minimum tolerable acceptable value for Cronbach’s alpha.
Further, Table 11 confirms that all remaining constructs are validated by the Fornell and Larcker criteria. After the reliability and validity assessment, the construct Perceived Behavioral Control was removed and was no longer assessed in the structural model assessment. The results of the hypothesis testing in Table 12 show that six out of twelve remaining hypotheses were supported by the model.
The path coefficient evaluation reveals the significant predictors for each endogenous construct. Attitude Towards Use (β = 0.425, t = 3.925, p < 0.050) is the only significant exogenous construct of Behavioral Intention. Perceived Usefulness (β = 0.424, t = 5.447, p < 0.050) and Perceived Ease of Use (β = 0.330, t = 4.411, p < 0.050) are significant predictors of Attitude Towards Use. User Demand (β = 0.590, t = 7.646, p < 0.050) is significant predictor of Perceived Ease of Use. User Demand (β = 0.455, t = 5.409, p < 0.050) and Perceived Ease of Use (β = 0.436, t = 5.362, p < 0.050) are significant predictors of Perceived Usefulness. Further, the regression analysis presents the explanatory power of the structural model. The R2 values show that 59.5% of the variation in the Perceived Usefulness is explained by User Demand and Perceived Ease of Use, with total effect sizes (f2) of 0.246 and 0.302, respectively. For Perceived Ease of Use, the predictor User Demand explains the 36.2% of the variance in the construct with a 35.2% effect size. Both predictors of Attitude Towards Use explain the 46.4% variance within the construct, with total effect sizes of 0.182 for Perceived Usefulness and 0.110 for Perceived Ease of Use. The final regression analysis for Behavioral Intention to Use reveals that Attitude Towards Use is the only significant predictor, with a 22.9% explanatory power and a 0.107 effect size. Further, the indirect effects of each exogenous construct on its respective endogenous construct are presented in Table 13, showing that all indicated indirect effects were significant.
Moreover, the results of the blindfolding show that all structural models discussed are within the acceptable limit of predictive relevance (Q2). Further, the results also revealed that all VIF values of the significant predictors are within the acceptable limit. The largest VIF value is 2.232 (Attitude Towards Use > Behavioral Intention to Use), and the lowest reading is 1.579 (Perceived Ease of Use > Perceived Usefulness). The results indicate that there is no multicollinearity within the significant predictors of each construct.

4.5. Discussion and Research Implications

The main objective of this study was to determine the important factors that can possibly influence the behavioral intention of the users of IWS components in Mulanay. In previous studies [16,35], behavioral intention was considered as an indicator of social acceptance of a new developing technology. The C-TAM-TPB models the perceptions of potential users of an IWS in Mulanay. This study is important in the implementation process of IWS projects, since such technology requires behavioral changes prior to its adoption or technology transfer. The results showed that attitude towards use (ATU) is an important construct that could possibly affect the behavioral intentions (BIU) of the users of RWHS with WTS and ETS. The findings of this study are consistent with those of other C-TAM-TPB studies, such as those by Hua and Wang [36] and Afiana and Priyanto [37].
It is also important to note that improving the ease of use, learnability (PEU), and usability (PU) of the rainwater harvesting technology can help promote more positive perceptions and attitudes for its users. In addition, the results also confirmed that if the RWHS with WTS is not easy to use, operate, and learn, there is a huge possibility that this technology will not be considered useful by the people. The respondents also confirm that government support and prioritization of the implementation of such technology can have a small impact on user perceptions on ease of use for the rainwater harvesting technology. Some people may think that, although this technology is basic, the ‘ease of use’ may be a reason why the government shown little support for the implementation of RWHS with WTS, especially in water-scarce communities. Consequently, users might have negative perceptions of ease of use, which could negatively affect their perceptions of the technology’s usefulness and their attitude towards the technology, thereby affecting their behavioral intention for usage. Such findings are supported by various studies [18,19,38].
Similarly, promoting the ease of use (PEU) and usefulness (PU) of the ETS could generate positive usage attitude among its users. The results also demonstrated that the perceived usefulness of ETS can also be enhanced by improving the ease of use of environmental technology, as well as by creating demand for sanitation in the pilot community. By comparing the results, the outcomes generated by the PLS–SEM model in this study and the multiple linear regression in the previous study [19] were similar. Therefore, this study confirmed that PLS–SEM could be an alternative approach for predicting behavioral intention in C-TAM-TPB models. However, it should be noted that, relatively, PLS–SEM has a great advantage over multiple linear regression in terms of convenience [29], flexibility [20], and other functions [30,31].
This is an initial study for the development of an Integrated Water System in the municipality of Mulanay. The successful implementation of this environmental technology requires the integration of a circular economy and the promotion of a water–energy–food nexus in the study community. Furthermore, this study makes several contributions to the extension of knowledge. First, this study contributes to the emerging research on water and sanitation systems, such as IWS. This study explores IWS approaches that households and learning institutions can use. Second, the findings of this study could provide decision makers with ideas of how to promote the development and implementation of such an IWS configuration. This study also extends the application of the C-TAM-TPB model to non-IT products. Most research on C-TAM-TPB has focused on the development of IT products [36,37]. Hence, this study posited a framework that non-IT products can use for understanding behavioral intentions. Third, this study explores the applicability of Partial Least Square–Structural Equation Modeling to the analysis of C-TAM-TPB models. The present study utilized PLS–SEM instead of the convention method of linear regression, which is commonly used in the literature [39,40]. PLS–SEM was also used in other C-TAM-TPB studies [37]. Lastly, the methodology utilized in this study could be used for the development of environmental technologies, such as those that promote a circular economy, including a water–energy–food nexus in vulnerable communities.

5. Conclusions and Recommendations

This study introduced a model for an Integrated Water System, which is composed of a Rainwater Harvesting System, Water Treatment System, and Eco-Toilet System. Recently, in connection with the SDG 6, the United Nations General Assembly has bolstered the development of integrated approaches in managing water resources through the International Decade for Action “Water for Sustainable Development, 2018–2028”. To support this cause, IWS infrastructures were installed in the select pilot communities in Mulanay, with the primary objective of improving the water supply and sanitation management thereof.
The study was further extended to the evaluation of perceptions and attitudes of potential users of IWS. This study utilized C-TAM-TPB as an evaluation model to investigate various factors that can affect the acceptance of an IWS by potential users in Mulanay. Based on the C-TAM-TPB framework, social perception was formed by behavioral intention, attitude, subjective norms, behavioral control, usefulness, ease of use, as well as demand, anxiety, and political climate. In this sense, the behavioral intention of the users toward the IWS components was used to measure the social acceptance of the newly introduced technology. However, to completely determine the social acceptance of the IWS in the community, future research should focus on the actual usage behaviors of IWS users. The findings in this study could be used as a benchmark for improving the system.
In this study, two C-TAM-TPB analyses were performed. The first one was used for the evaluation of the social acceptance of rainwater harvesting, which was operated by RWHS and WTS. With a similar goal, the second analysis was intended to evaluate the ETS.
The results of this test reveal that the communities’ attitudes have a significant impact on promoting their behavioral intention to use the components of IWS. To improve the attitudes of potential users, the results suggest that the development of these components should be primarily focused on making the potential users feel and think that the RWHS, WTS, and ETS are very useful and easy to use. Further, the data also suggest that gaining political support for RHWS and WTS can possibly convince potential users that these systems are easy to use and learn. Additionally, creating demand can also improve the social perception of the usefulness and ease of use of the ETS.
Moreover, this study demonstrated the strength of partial least squared-structural equation modeling method in the evaluation of a C-TAM-TPB model. PLS–SEM was able to filter out the data that did not pass the validity and reliability tests. More importantly, the PLS–SEM was able to explain the level of significance, strength, and collinearity of each predictor of each endogenous construct. Such data were able to prove the hypotheses that are being tested in this study. Further, the PLS–SEM was able to test the validity of the model through a blindfolding process.
However, some empirical observations during the analysis suggested that there is still a need for improvement of the survey questionnaires (e.g., increasing of number of measurement items). If similar questionnaires are used for future research, this study recommended to further improve the measurement items to prevent low reliability and increase the validity of the indicators.
The results of this study could provide essential information regarding the acceptability of the potential users of an IWS in Mulanay. This could serve as a hypothetical basis for implementers to use in the further development of IWS projects. The successful implementation of such a project could generate an environmental management option, particularly for water and sanitation systems, for the people of Mulanay, especially considering that access to clean water supply and sanitation facilities is a crucial problem therein.
Local community leaders, such as the local government units and academic institution administrators, should focus on developing not only technologies that can provide clean water supply and proper sanitation but also those technologies that could promote a circular economy, including strengthening the linkages of the water–energy–food nexus in communities.

Author Contributions

Conceptualization, J.J.I., A.B., L.B., R.M.T., M.A.P., and A.O.; methodology, J.J.I., R.A.M., C.M.P., A.B., L.B., R.M.T., M.A.P., and A.O.; investigation, J.J.I., C.M.P., A.B., L.B., and A.O.; formal analysis, J.J.I., R.A.M.; writing—original draft, J.J.I., C.M.P., R.M.T., M.A.P., and A.O.; supervision, M.A.P., A.O.

Funding

This study was made possible with the generous support of the American people through the U.S. Agency for International Development (USAID) in partnership with RTI International through its Science, Technology, Research, and Innovation for Development (STRIDE) Program.

Acknowledgments

The authors would also like to extend their gratitude to De La Salle University through the CHED-Philippine Higher Education Research Network (PHERNet) Program on Sustainability Studies, the Local Government of Mulanay, and the Polytechnic University of the Philippines (PUP) Mulanay Campus for taking part on this study. This study is made possible with the generous support of the American people through the U.S. Agency for International Development (USAID) in partnership with RTI International through its Science, Technology, Research, and Innovation for Development (STRIDE) Program.

Conflicts of Interest

The authors declare no conflict of interest.

Appendix A

Table A1. Summary of results of RWHS and WTS rainwater quality monitoring.
Parameters:pHConductivityTDSTurbidityNitratesZincTotal IronLeadE. coli
PNSDW Limits:6.5–8.5-500 ppm5 NTU50 mg/L5.0 mg/L1.0 mg/L0.010 mg/L<1.1 MPN/100 mL
08/25/2017GK1 IN7.121-0.360.23----
GK1 OUT7.77214.350.23----
GK2 IN6.67212.150.23----
GK2 OUT---0-----
PUP IN7.88210.290.23----
PUP OUT7.8763630.23----
09/27/2017GK1 IN8.15310.10.260.23-0.0049-
GK1 OUT8.93114.390.320.18-0.0049-
GK2 IN7.910000.230.05-0.0049-
GK2 OUT8.859445.40.440.01-0.0049-
PUP IN8.05320.250.230.1-0.0049-
PUP OUT8.32327.190.240.01-0.0049-
12/10/2017GK1 IN6.366.3620.140.340.230.050.0051.1
GK1 OUT6.896.8921.670.520.180.10.0051.1
GK2 IN6.436.4310.320.270.050.050.005-
GK2 OUT7.497.4941.20.750.010.60.005-
PUP IN7.37.321.150.230.10.050.0052.6
PUP OUT6.436.4332.750.230.010.050.0111.1
12/17/2017GK1 IN7.45100.030.290.1270.050.0054.6
GK1 OUT6.8100.040.250.1120.050.0058
GK2 IN6.99000.040.230.010.050.0058
GK2 OUT-000-----
PUP IN7.82110.060.260.0250.050.0054.6
PUP OUT6.661268.620.530.010.050.0052.6
01/30/2018GK1 IN---0-0.580.0490.00491.09
GK1 OUT---0-0.250.0490.00491.09
GK2 IN---0-0.190.0490.00491.09
GK2 OUT---0-0.0090.0490.00491.09
PUP IN---0-0.20.0490.00491.09
PUP OUT---0-0.0090.0490.00491.09
02/14/2018GK1 IN7.22831.430.34----
GK1 OUT7.62844.380.51----
GK2 IN-0-0-----
GK2 OUT-0-0-----
PUP IN7.561112.570.41----
PUP OUT7.012830.181.29----
Table A2. General Questionnaire.
QuestionsResponses
1. Where do you obtain your water for daily consumption?□ Stand-alone water
□ Piped water with communal water point
□ Piped water household connection
□ Bottled water
□ Water refilling station
□ Private well
□ Neighbors
2. Opinions about water resources in the community: For each statement below, please choose on answer that best describes your level of agreement.
a. There is a possibility of a water shortage in Mulanay in the near future□ Strongly agree (5)
□ Agree (4)
□ Neutral/undecided (3)
□ Disagree (2)
□ Strongly disagree (1)
b. Conserving water is important.□ Strongly agree (5)
□ Agree (4)
□ Neutral/undecided (3)
□ Disagree (2)
□ Strongly disagree (1)
c. Water bills should be kept low.□ Strongly agree (5)
□ Agree (4)
□ Neutral/undecided (3)
□ Disagree (2)
□ Strongly disagree (1)
d. Primary water supply is adequate.□ Yes□ No
e. Primary water supply is fit for drinking.□ Yes□ No
Table A3. C-TAM-TPB Questionnaire for RWHS and WTS.
ConstructMeasurement Items
Political ClimatePC1The community leaders will support the implementation, operation, and maintenance of the ETS.
PC2The local government will support the implementation, operation, and maintenance of the ETS.
PC3Solution to water quality problems is a priority of our community leaders or local government.
AnxietyANX1I hesitate to use the ETS for fear of making mistakes I cannot correct.
ANX2I am afraid I cannot operate and maintain the ETS.
ANX3I am afraid that the ETS might be unsanitary.
ANX4I feel apprehensive and discomfort about using the ETS.
ANX5The ETS is somewhat intimidating to me.
User DemandUD1Using the system is necessary in my lifestyle.
UD2I understand that the ETS has economic benefits.
UD3The ETS will help solve the water-borne disease problems in my community.
UD4The ETS will help solve the water-borne disease problems in my community.
UD5We need more toilets in the community.
Perceived UsefulnessPU1I would find the ETS useful and efficient in improving the sanitation for my community.
PU2Using the ETS will enable me to improve the sanitation in my community faster.
PU3Using the ETS would motivate me to improve the sanitation in my community.
Perceived Ease of UsePEU1My interaction with the ETS would be clear and understandable.
PEU2It is easy for me to learn and become skillful at using the ETS.
Attitude Towards useATU1Using the ETS is a good idea.
ATU2The ETS makes my lifestyle more interesting.
ATU3I like to use the ETS.
Perceived Behavioral ControlPBC1I have the resources necessary to use the ETS. (money, space, etc.)
PBC2I have the knowledge necessary to use the ETS.
PBC3A specific person (or group) is available for assistance if there will be difficulties in using the ETS.
Subjective NormsSN1People who are important to me would think that using the ETS is good for me.
SN2People who influence my behavior would think that I should use the ETS.
SN3In general, my community has supported the use of the ETS.
Behavioral Intention To UseBIU1I plan to use the system in the next 12 months.
BIU2I have no plan to use the system in the next 12 months.
Table A4. C-TAM-TPB Questionnaire for ETS.
ConstructMeasurement Items
Political ClimatePC1The community leaders will support the implementation, operation, and maintenance of the RWHS and WTS.
PC2The local government will support the implementation, operation, and maintenance of the RWHS and WTS.
PC3Solution to water quality problems is a priority of our community leaders or local government.
AnxietyANX1I hesitate to use the RWHS and WTS for fear of making mistakes I cannot correct.
ANX2I am afraid I cannot operate and maintain the RWHS and WTS well.
ANX3I am afraid that the RWHS and WTS might be unsanitary.
ANX4I feel apprehensive and discomfort about using the RWHS and WTS.
ANX5The RWHS and WTS is somewhat intimidating to me.
User DemandUD1RWHS and WTS will motivate us to improve the health in the household/community/institution.
UD2I understand that the RWHS and WTS have economic benefits.
UD3RWHS and WTS will help solve the water-borne disease problems in my household/community/institution.
UD4We need more alternative sources of water supply in the household/community/institution.
Perceived UsefulnessPU1I would find the RHWS and WTS useful and efficient in treating the rainwater.
PU2Using the RHWS and WTS enables us to improve water quality and to have clean and safe water in our household/community/institution.
Perceived Ease of UsePEU1My interaction with the RWHS and WTS would be clear and understandable.
PEU2It is easy for me to learn and become skillful at using the RWHS and WTS.
Attitude Towards useATU1Using the RWHS and WTS is a good idea.
ATU2The RWHS and WTS make my lifestyle more interesting.
ATU3I like to use the RWHS and WTS.
Perceived Behavioral ControlPBC1I have the resources necessary to use the RWHS and WTS. (money, space, etc.)
PBC2I have the knowledge necessary to use the RWHS and WTS.
PBC3A specific person (or group) is available for assistance if there will be difficulties in using the RWHS and WTS.
PBC4Using the system fits into my lifestyle.
Subjective NormsSN1People who are important to me would think that using the RWHS and WTS is good for me.
SN2People who influence my behavior would think that I should use the RWHS and WTS.
SN3Generally, my household/community/institution support has supported the use of RWHS and WTS.
Behavioral Intention to UseBIU1I plant to use the system in the next 12 months.
BIU2I have no plan to use the system in the next 12 months.

Appendix B

Figure A1. Topographic map of Mulanay.
Water 11 01593 g0a1

References

  1. ADB. Asian Water Development Outlook 2016; Strengthening Water Security in Asia and the Pacific; Asian Development Bank: Mandaluyong, Philipines, 2016; ISBN 9789290929888. [Google Scholar]
  2. United Nations. Sustainable Development Goal 6 Synthesis Report 2018 on Water and Sanitation; UN Water: New York, NY, USA, 2018. [Google Scholar]
  3. Department of Interior and Local Government. Guidelines for the Implementation of the Provision of Potble Water Supply Local Government Support Fund-Sagana At Ligtas na Tubig sa Lahat (LGSF-SALINTUBIG); Memorandum Circular No. 2018-47; Department of Interior and Local Government: Quezon City, Philippines, 2018. Available online: http://www.dilg.gov.ph/issuances/mc/Guidelines-for-the-Implementation-of-the-provision-of-Potable_water-supply-Local-Government-Support-Fund-Sagana-at-Ligtas-na-Tubig-sa-Lahat-LGSF-SALINTUBIG-Program-for-FY-2018/2686 (accessed on 31 July 2019).
  4. Asian Development Bank. Water Supply and Sanitation Sector Assessment, Strategy, Roadmap; Asian Development Bank: Mandaluyong City, Philippines, 2013. [Google Scholar]
  5. Omarova, A.; Tussupova, K.; Hjorth, P.; Kalishev, M.; Dosmagambetova, R. Water supply challenges in rural areas: A case study from central Kazakhstan. Int. J. Environ. Res. Public Health 2019, 16, 688. [Google Scholar] [CrossRef] [PubMed]
  6. Han, M.; Hashemi, S.; Joo, S.H.; Kim, T. Novel integrated systems for controlling and prevention of mosquito-borne diseases caused by poor sanitation and improper water management. J. Environ. Chem. Eng. 2016, 4, 3718–3723. [Google Scholar] [CrossRef]
  7. Hashemi, S.; Han, M.; Kim, T.; Kim, Y. Innovative toilet technologies for smart and green cities. In Proceedings of the 8th Conference International Forum on Urbanism (IFoU), Incheon, Korea, 22–24 June 2015; pp. 873–879. [Google Scholar]
  8. Andersson, J.C.; Zehnder, A.J.; Wehrli, B.; Jewitt, G.P.; Abbaspour, K. C.; Yang, H. Improving crop yield and water productivity by ecological sanitation and water harvesting in South Africa. Environ. Sci. Technol. 2013, 47, 4341–4348. [Google Scholar] [CrossRef] [PubMed]
  9. Badjana, H.M.; Helmschrot, J. Integrated water management tools supporting future water security and food production in West Africa. Proc. Int. Assoc. Hydrol. Sci. 2015, 366, 181–182. [Google Scholar] [CrossRef]
  10. Meyer, C. Integrated Water Resources Management—The Orange-Senqu River Basin in South Africa. Ph.D. Thesis, Department of Earth Sciences Institute of Geography, University of Hamburg, Hamburg, Germany, 30 August 2013. [Google Scholar]
  11. Gao, H.; Wei, T.; Lou, I.; Yang, Z.; Shen, Z.; Li, Y. Water saving effect on integrated water resource management. Resources Conserv. Recycl. 2014, 93, 50–58. [Google Scholar] [CrossRef]
  12. Anand, C.K.; Apul, D.S. Composting toilets as a sustainable alternative to urban sanitation—A review. Waste Manag. 2014, 34, 329–343. [Google Scholar] [CrossRef] [PubMed]
  13. Simha, P. Nutrient recovery systems for human urine—Ways to realize closed loop sanitation and future sustainable. Int. J. Sci. Res. Publ. 2013, 3, 1–6. [Google Scholar]
  14. Andersson, M. Assessing the Cultural Potential of Ecological Sanitation in Improving Waste Management and Food Security in the Taita Hills, Kenya. Master’s Thesis, University of Helsinki, Helsinki, Finland, 2014. [Google Scholar]
  15. Rahman, S.; Khan, M.T.R.; Akib, S.; Din, N.B.C.; Biswas, S.K.; Shirazi, S.M. Sustainability of rainwater harvesting system in terms of water quality. Sci. World J. 2014, 2014. [Google Scholar] [CrossRef]
  16. Yaghoubi, N.M.; Bahmani, E. An integration of technology acceptance model and theory of planned behavior. Int. J. Bus. Manag. 2010, 5, 159–165. [Google Scholar] [CrossRef]
  17. Khan, F.; Ahmed, W.; Najmi, A. Understanding consumers’ behavior intentions towards dealing with the plastic waste: Perspective of a developing country. Resour. Conserv. Recycl. 2019, 142, 49–58. [Google Scholar] [CrossRef]
  18. Dharmarajan, B.; Gangadharan, K. Applying technology acceptance (TAM) model to determine the acceptance of nursing information system (NIS) for computer generated nursing care plan among nurses. Int. J. Comput. Trends Technol. 2013, 4, 2625–2629. [Google Scholar]
  19. Ignacio, J.; Alvin Malenab, R.; Pausta, C.; Beltran, A.; Belo, L.; Tanhueco, R.; Era, M.; Eusebio, R.; Promentilla, M.; Orbecido, A. Perceptions and attitudes toward eco-toilet systems in rural areas: A case study in the Philippines. Sustainability 2018, 10, 521. [Google Scholar] [CrossRef]
  20. Dutot, V.; Bhatiasevi, V.; Bellallahom, N. Applying the technology acceptance model in a three-countries study of smartwatch adoption. J. High. Technol. Manag. Res. 2019, 30, 1–14. [Google Scholar] [CrossRef]
  21. Scherer, R.; Siddiq, F.; Tondeur, J. The technology acceptance model (TAM): A meta-analytic structural equation modeling approach to explaining teachers’ adoption of digital technology in education. Comput. Educ. 2019, 128, 13–35. [Google Scholar] [CrossRef]
  22. Sepasgozar, S.M.E.; Hawken, S.; Sargolzaei, S.; Foroozanfa, M. Implementing citizen centric technology in developing smart cities: A model for predicting the acceptance of urban technologies. Technol. Forecast. Soc. Chang. 2019, 142, 105–116. [Google Scholar] [CrossRef]
  23. Mathieson, K. Predicting user intentions: Comparing the technology acceptance model with the theory of planned behavior. Inf. Syst. Res. 1991, 2, 173–191. [Google Scholar] [CrossRef]
  24. Maurer, M.Ã.; Pronk, W.; Larsen, T.A. Treatment processes for source-separated urine. Water Res. 2006, 40, 3151–3166. [Google Scholar] [CrossRef]
  25. Shroff, R.H.; Deneen, C.C.; Ng, E.M.W. Analysis of the technology acceptance model in examining students’ behavioural intention to use an e-portfolio system. Australas. J. Educ. Technol. 2011, 27, 600–618. [Google Scholar] [CrossRef]
  26. Nasri, W.; Charfeddine, L. Factors affecting the adoption of internet banking in Tunisia: An integration theory of acceptance model and theory of planned behavior. J. High. Technol. Manag. Res. 2012, 23, 1–14. [Google Scholar] [CrossRef]
  27. Chen, C.; Xu, X.; Arpan, L. Energy research & social science between the technology acceptance model and sustainable energy technology acceptance model: Investigating smart meter acceptance in the United States. Chem. Phys. Lett. 2017, 25, 93–104. [Google Scholar] [CrossRef]
  28. Venturini, S.; Mehmetoglu, N. plssem: A stata package for structural equation modeling with partial least squares. J. Stat. Softw. 2019, 88. [Google Scholar] [CrossRef]
  29. Monge, C.; Alvarez, J.C.; Lopez, J.F. Manufacturing and continuous improvement areas using partial least square path modeling with multiple regression comparison. In Proceedings of the CBU International Conference on Innovation, Technology Transfer and Education, Prague, Czech Republic, 3–5 February 2014; pp. 15–26. [Google Scholar]
  30. Shukla, A.; Sharma, S.K. Evaluating consumers’ adoption of mobile technology for grocery shopping: An application of technology acceptance model. Vision 2018, 22, 185–198. [Google Scholar] [CrossRef]
  31. Hussain, S.; Fangwei, Z.; Siddiqi, A.F.; Ali, Z.; Shabbir, M.S. Structural equation model for evaluating factors affecting quality of social infrastructure projects. Sustainability 2018, 10, 1415. [Google Scholar] [CrossRef]
  32. Ringle, C.M.; Wende, S.; Becker, J.M. SmartPLS 3; SmartPLS GmbH: Bönningstedt, Germany, 2015; Available online: http://www.smartpls.com (accessed on 31 July 2019).
  33. Hair, J.F.; Black, W.C.; Babin, B.J.; Anderson, R.E. Multivariate Data Analysis, 7th ed.; Pearson Prentice Hall: Upper Saddle River, NJ, USA, 2010; ISBN 9781292021904. [Google Scholar]
  34. Fornell, C.; Larcker, D.F. Evaluating structural equation models with unobservable variables and measurement error. J. Mark. Res. 1981, 18, 39–50. [Google Scholar] [CrossRef]
  35. Lemay, D.J.; Morin, M.M.; Bazelais, P.; Doleck, T. Modeling students’ perceptions of simulation-based learning using the technology acceptance model. Clin. Simul. Nurs. 2018, 20, 28–37. [Google Scholar] [CrossRef]
  36. Li, H.; Shanyong, W. Antecedents of consumers’ intention to purchase energy-efficient appliances: An empirical study based on the technology acceptance model and theory of planned behavior. Sustainability 2019, 11, 2994. [Google Scholar] [CrossRef]
  37. Afiana, R. Priyanto an analysis of the acceptance of Cbt Vhs application using technology acceptance model (Tam) and theory of planned behavior (Tpb) integration. J. Phys. Conf. Ser. 2018, 1140. [Google Scholar] [CrossRef]
  38. Chen, H.; Chen, S.C. The empirical study of automotive telematics acceptance in Taiwan: Comparing three technology acceptance models shih-chih chen. Int. J. Mob. Commun. 2009, 7, 50–65. [Google Scholar] [CrossRef]
  39. Ghalandari, K. The effect of performance expectancy, effort expectancy, social influence and facilitating conditions on acceptance of E-banking services in Iran: The moderating role of age and gender. Middle East. J. Sci. Res. 2012, 12, 801–807. [Google Scholar] [CrossRef]
  40. Abd, A.; Zaidi, F.; Razak, A.; Abu, A.; Salihin, W. The effects of perceived usefulness and perceived ease of use on continuance intention to use E-government. Procedia Econ. Financ. 2016, 35, 644–649. [Google Scholar] [CrossRef]
Figure 1. Design of the Integrated Water System (IWS).
Water 11 01593 g001
Figure 2. Process flow diagram for the (a) rainwater harvesting system (RWHS) and (b) water treatment system (WTS).
Water 11 01593 g002
Figure 3. The combined technology acceptance model and theory of planned behavior (C-TAM-TPB) research framework adopted from the study of Ignacio et al. [19].
Water 11 01593 g003
Figure 4. Flowchart of the C-TAM-TPB model data analysis.
Water 11 01593 g004
Table 1. Average monthly rainfall from 2014–2017 in Mulanay, Quezon.
MonthMonthly Average Rainfall (mm)MonthMonthly Average Rainfall (mm)
January70.975July131.85
February28.7August87.1
March35.25September201.25
April21.05October70.45
May21.2November80.43
June76December142.17
(Source: PAGASA-Mulanay).
Table 2. Research variables and hypotheses.
Dependent VariableIndependent Variables Hypotheses
Perceived usefulnessPolitical climateH1PC has a direct effect on PU
AnxietyH2ANX has a direct effect on PU
User demandH3UD has a direct effect on PU
Perceived ease of useH4PEU has a direct effect on PU
Perceived ease of usePolitical climateH5PC has a direct effect on PEU
AnxietyH6ANX has a direct effect on PEU
User demandH7UD has a direct effect on PEU
Attitude towards usePerceived usefulnessH8PU has a direct effect on ATU
Perceived ease of useH9PEU has a direct effect on ATU
Behavioral intention to usePerceived usefulnessH10PU has a direct effect on BIU
Attitude towards useH11ATU has a direct effect on BIU
Perceived behavioral controlH12PBC has a direct effect on BIU
Subjective normsH13SN has a direct effect on BIU
Table 3. Water sources for daily consumption in Mulanay.
Water SourcesActual Count
Piped water household connection151
Stand-alone water140
Piped water with a communal water point141
Water refilling station100
Private well71
Neighbors71
Bottled water 2
Table 4. Comparisons of opinions on water-related issues in Mulanay by group type.
Questionnaire ItemCommunity Type (Respondents)p-Value of Mann–Whitney U-Test
HouseholdsUniversity
Mean RankMedianMean RankMedian
1. There is a possibility of a water shortage in Mulanay in the near future.85.264.0084.864.000.957
2. Conserving water is important.76.685.0089.465.000.005
3. Water bills should be kept low.82.235.0086.495.000.534
* p-value < 0.05 (significant).
Table 5. Community’s perception of water supply by group type.
% Frequency
Primary Water Supply Is AdequatePrimary Water Supply Is Fit for Drinking
YesNoYesNo
Households45.854.230.569.5
University41.858.29.190.9
Total41.256.816.683.4
p-value (Chi-Square)0.6220.000 *
* p-value < 0.05 (significant).
Table 6. Reliability and convergent validity analysis (for RWHS with WTS).
ConstructIndicatorMeanStandard DeviationFactor LoadingComposite Reliability (CR)Average Variance Extracted (AVE)Cronbach’s Alpha (α)
Political ClimatePC14.0830.9190.8700.8890.7280.814
PC24.3430.8140.857
PC34.2190.8320.832
AnxietyANX12.841.1110.6770.8820.6030.831
ANX22.9641.0080.821
ANX32.8220.9930.904
ANX42.6800.9320.839
ANX52.8580.9630.603
User DemandUD13.8460.7920.7080.8890.6690.844
UD24.2010.7810.935
UD34.2310.8570.811
UD44.3140.8580.803
Perceived UsefulnessPU14.6860.5980.9440.9460.8980.886
PU24.6450.5990.951
Perceived Ease of UsePEU14.4560.6610.8990.8970.8140.771
PEU24.4140.6570.905
Attitude Towards useATU14.5560.6690.8120.8800.7100.796
ATU24.3080.7460.868
ATU34.2430.7810.848
Perceived Behavioral ControlPBC13.3020.9720.6360.7160.4110.629
PBC23.4380.9410.904
PBC33.9530.7910.542
PBC44.0240.7610.354
Subjective NormsSN14.3730.6770.8980.9310.8190.890
SN24.3550.6740.939
SN34.4910.6540.876
Behavioral Intention to UseBIU13.7221.0710.8110.8290.7080.600
BIU24.4910.6540.871
Table 7. Fornell–Larcker Criterion (for RWHS with WTS).
AVEPCANXUDPUPEUATUPBCSNBIU
PC0.7280.853
ANX0.603−0.0750.777
UD0.669−0.0370.0590.818
PU0.8980.325−0.084−0.0320.948
PEU0.8140.283−0.173−0.0470.4670.902
ATU0.710.561−0.108−0.140.4960.4670.843
PBC0.4110.038−0.0140.4270.1020.016−0.0750.641
SN0.8190.338−0.231−0.0330.5650.7040.51−0.0040.905
BIU0.7080.158−0.1640.0160.1360.180.3290.1240.2670.841
Table 8. Path Coefficients and model quality assessment (for RWHS with WTS).
ConstructPredictorHΒt-Valuep-ValueDecisionf2R2adjVIFQ2
Perceived usefulnessPolitical climateH10.1351.6440.101Reject0.0350.5191.0890.060
AnxietyH20.0450.8780.380Reject0.0041.034
User demandH30.0030.0360.971Reject0.0001.116
Perceived ease of useH40.68512.1830.000Accept0.8961.005
Perceived ease of usePolitical climateH50.2713.4660.001Accept0.0810.0881.0070.441
AnxietyH60.0450.8780.020Reject0.0251.009
User demandH7−0.0280.2840.776Reject0.0011.005
Attitude towards usePerceived usefulnessH80.3332.7470.006Accept0.0740.2632.0500.179
Perceived ease of useH90.2292.2780.023Accept0.0352.050
Behavioral intention to usePerceived usefulnessH10−0.1441.8520.065Reject0.0150.1341.6490.083
Attitude towards useH110.3173.5620.000Accept0.0791.503
Perceived behavioral controlH120.1641.4910.081Reject0.1341.033
Subjective normsH130.1871.7460.137Reject0.0251.639
Table 9. Indirect effects of the mediating variables (for RWHS with WTS).
Patht-Statisticsp-ValueDecision
Political climate → Perceived ease of use → Attitude towards use → Behavioral intention to use 0.8990.369Reject
Political climate → Perceived ease of use → Attitude towards use1.0040.316Reject
Perceived ease of use → Perceived usefulness → Attitude towards use → Behavioral intention to use2.2260.026Accept
Perceived ease of use → Perceived usefulness → Attitude towards use 3.2400.001Accept
Perceived ease of use → Attitude towards use → Behavioral intention to use1.9740.049Accept
Perceived usefulness → Attitude towards use → Behavioral intention to use2.0440.041Accept
Table 10. Reliability and Convergent Validity Analysis (for eco-toilet system (ETS)).
ConstructIndicatorMeanStandard DeviationFactor LoadingComposite Reliability (CR)Average Variance Extracted (AVE)Cronbach’s Alpha (α)
Political ClimatePC14.2980.8990.8340.9070.7650.848
PC24.0650.7920.919
PC33.8150.7760.863
AnxietyANX13.1441.1070.4760.3910.1790.871
ANX23.2191.0400.748
ANX33.1381.1100.300
ANX43.1781.100-0.027
ANX53.1561.0890.126
User DemandUD13.9410.7510.7900.8550.5530.786
UD23.8800.7950.798
UD34.1980.6940.852
UD44.2360.7130.786
UD53.9940.9580.402
Perceived UsefulnessPU14.2720.7670.8590.9210.7950.871
PU24.2600.7160.936
PU34.1730.7940.877
Perceived Ease of UsePEU14.1300.7340.9460.9440.8950.882
PEU24.0240.7340.946
Attitude Towards useATU14.2980.7520.8360.8900.7290.813
ATU24.0650.8390.909
ATU33.8150.9800.813
Perceived Behavioral ControlPBC13.4791.0990.4510.7290.4910.584
PBC23.5830.9850.676
PBC34.0540.7910.902
Subjective NormsSN14.0000.7420.9210.9460.8540.915
SN24.0530.7070.948
SN34.0470.7440.904
Behavioral Intention To UseBIU13.5600.9110.8870.8550.7480.664
BIU23.4520.8280.841
Table 11. Fornell-Larcker Criterion (for ETS).
AVEPCANXUDPUPEUATUSNBIU
PC0.7280.853
ANX0.603−0.0750.777
UD0.669−0.0370.0590.818
PU0.8980.325−0.084−0.0320.948
PEU0.8140.283−0.173−0.0470.4670.902
ATU0.710.561−0.108−0.140.4960.4670.843
SN0.8190.338−0.231−0.0330.5650.7040.510.905
BIU0.7080.158−0.1640.0160.1360.180.3290.2670.841
Table 12. Path Coefficients and Model Quality Assessment (for ETS).
ConstructPredictorHβt-Valuep-ValueDecisionf2R2adjVIFQ2
Perceived usefulnessPolitical climateH1−0.0470.7310.465Reject0.0040.5951.4900.440
AnxietyH20.0350.6350.526Reject0.0031.124
User demandH30.4555.4090.000Accept0.2462.134
Perceived ease of useH40.4365.3620.000Accept0.3021.595
Perceived ease of usePolitical climateH50.0351.0190.308Reject0.0060.3621.4800.312
AnxietyH6−0.1491.4480.148Reject0.0321.089
User demandH70.5907.6460.000Accept0.3521.579
Attitude towards usePerceived usefulnessH80.4245.5470.000Accept0.1820.4741.8980.325
Perceived ease of useH90.3304.4110.000Accept0.1101.898
Behavioral intention to usePerceived usefulnessH100.0600.6990.485Reject0.0020.2292.1040.156
Attitude towards useH110.4253.9250.000Accept0.1072.232
Subjective normH130.0550.5210.603Reject0.0022.275
Table 13. Indirect effects of the mediating variables (ETS).
Patht-Statisticsp-ValueDecision
User Demand → Perceived Ease of Use → Perceived Usefulness → Attitude towards use → Behavioral intention to use 2.7700.006Accept
User Demand → Perceived Ease of Use → Perceived Usefulness → Attitude towards use3.6230.000Accept
User Demand → Perceived Ease of Use → Perceived Usefulness 4.4910.000Accept
User Demand → Perceived Usefulness → Attitude towards use → Behavioral intention to use2.4310.015Accept
User Demand → Perceived Usefulness → Attitude towards use 3.3760.001Accept
User Demand → Perceived Ease of Use → Attitude towards use3.7860.000Accept
Perceived ease of use → Perceived usefulness → Attitude towards use → Behavioral intention to use2.8900.004Accept
Perceived ease of use → Perceived usefulness → Attitude towards use 4.3150.000Accept
Perceived ease of use → Attitude towards use → Behavioral intention to use2.8270.005Accept
Perceived usefulness → Attitude towards use → Behavioral intention to use3.0150.003Accept

