Article

Hydrodynamics of Uasb Reactor Treating Domestic Wastewater: A Three-Dimensional Numerical Study

by
Maria G. S. L. Brito
1,*,
Flávio C. B. Nunes
2,
Hortência L. F. Magalhães
3,
Wanderson M. P. B. Lima
3,
Flávia L. C. Moura
1,
Severino R. Farias Neto
3 and
Antonio G. B. Lima
4
1
Course of Civil Engineering, Federal University of Cariri, Juazeiro do Norte, CE 63010-225, Brazil
2
Course of Technology in Industrial Automation, Federal Institute of Education, Science and Technology of Ceará, Juazeiro do Norte, CE 63010-225, Brazil
3
Department of Chemical Engineering, Federal University of Campina Grande, Campina Grande, PB 58429-900, Brazil
4
Department of Mechanical Engineering, Federal University of Campina Grande, Campina Grande, PB 58429-900, Brazil
*
Author to whom correspondence should be addressed.
Submission received: 14 December 2019 / Revised: 13 January 2020 / Accepted: 15 January 2020 / Published: 18 January 2020
(This article belongs to the Special Issue Industrial and Urban Wastewater Treatment and Reuse)

Abstract

:
This work performed a three-dimensional numerical study to describe the hydrodynamics of upflow anaerobic sludge blanket reactor treating domestic wastewater. The simulations were made in the commercial software Ansys CFX®. Different inclinations of the gas deflector were considered, to assess its influence on the velocity field inside the reactor. In order to validate the numerical study, we used experimental data regarding the inflow, the inlet and outlet concentrations of the organic matter, the concentration of solids at the liquid-gas interface and at the reactor outlet, and the pressure field inside it. The comparison between the numerical and experimental results demonstrated small differences. The mathematical model used to describe the hydrodynamics flow in the UASB reactor was quite satisfactory since it adequately has reproduced the physical behavior inside the reactor.

1. Introduction

Anaerobic processes have been used in the treatment of concentrated, domestic and industrial wastewater for more than a century, but interest in anaerobic processes as the main biological stage (secondary treatment) in wastewater treatment emerged with the development of the upflow anaerobic sludge blanket reactor (UASB). Currently, the UASB reactor is the most popular anaerobic system of high rate used in wastewater treatment, especially in tropical countries, often being used for the treatment of wastewater with different concentrations of both soluble and complex organic matter [1,2,3,4,5,6,7,8,9].
The satisfactory performance of UASB reactors is mainly due to the formation of compact granular sludge, which ensures high specific methanogenic activity and high settleability [8,10,11,12], which occurs naturally and spontaneously when the environmental conditions are suitable for self-immobilization of bacteria [13,14,15]. These factors allow the reactor functioning with reduced hydraulic retention times, which implies smaller dimension equipment and lower cost [16,17]. Other important advantages, typical of anaerobic systems, include low sludge production, no aeration, and production of methane gas [18,19,20,21].
Among the negative aspects of UASB reactors can be cited the need for post-treatment, since anaerobic processes produce effluent with residual constituents, such as dissolved gases, organic matter, suspended solids, nutrients (phosphorus and nitrogen), and pathogenic organisms. Another important factor concerns the lack of information regarding flow dynamics and its impact on processes occurring in different designer reactors [6], resulting in the development of projects based on empirical relationships and not considering the fluid dynamic behavior.
A UASB reactor consists of a continuous three-phase system (liquid, solid, and gas) and thus inserted in multiphase systems class that, depending on the flow parameters and system characteristics, such as velocity, pressure, density, and volume fraction, may have different flow regimes. Peña et al. [22] reported that different factors such as intensity of mixing, temporal and spatial variations of the mixture, degree of segregation of the material, and intensity and bubble pattern of the biogas affect the hydrodynamic behavior of these reactors.
Thus, the performance of UASB reactors can be affected by several physical factors (upward velocities of the liquid, gas and solid, interfacial mass transfer between the phases, and axial dispersion) and biochemical variables, which makes very complex the analysis of fluid dynamic behavior inside the device. For this reason, it is essential to develop studies related to fluid dynamic behavior inside the device, under specific conditions, in particular, the effect of deflectors on the reactor performance, seeking to understand the phenomena involved in the flow behavior and thus, to contribute for the optimization of this device.
According to Vieira and Garcia Jr. [23], the deflectors of the UASB reactor have as function the multiphase separation of biogas. Therefore, it should be designed to prevent biogas diversion to the reactor settling region by driving the biogas through the equipment into the gas chambers. The authors suggest a minimum overlap of twenty centimeters between the reactor settler wall and the deflector, in order to avoid gas loss.
Van Lier et al. [24] reported that, deflectors are responsible to directing biogas and to diverting upward solids from the opening to the settling zone. In this work, they authors showed different types of deflectors: (a) an inverted V-shaped deflector with coupled pipes below the top of the deflector. This deflector type allows the liquid-biogas-solid mixture to enter, with the formation of a gas-liquid interface in the upper region, causing the foam formation. This situation can cause present clogging and uncontrolled gas discharge, with possible leaks to the settling, which is not interesting for the equipment, (b) a deflector configuration similar to the first one, but now, the pipes are located at the deflector top, preventing the appearance of the gas-liquid interface, consequently avoiding the problems caused by interface. In other situation, unlike the two previous deflectors, they authors present a new design of the deflector with the closed lower region, also preventing the formation of the gas-liquid interface, however, with the possibility of biogas drag to the settling zone. The last project also presents a closed configuration; however, different from the previous one, the baffle’s inferred section is slanted, solving the problem of biogas escapement.
Lin and Yang [25] in their work about an UASB reactor have reported the use of deflectors at the settler inlet to facilitate biogas collection using the natural tendency of gas to flow vertically in liquids. The authors suggest employing a deflector with an inclination of approximately 50° with the horizontal that was considered adequate to avoid settling sludge entrapment in the settlers. In addition, the authors state that the liquid gas interface within the cone is a critical design factor, so this region should be kept well agitated with a small area to facilitate trapped gas escape and consequently avoid foaming.
In this context, a viable alternative for this study is the numerical simulation using sophisticated the mathematical models previously defined and implemented in a computer. This allows the verification of the adopted model and enables the study of optimal and actual operating conditions of this treatment system. In this way, in 2D space, Lima et al. [26] conducted a study of a UASB reactor treating domestic wastewater. The comparative analysis of the numeric and experimental results of the pressure and of the sludge concentration in the exit of the reactor presented differences of the order of 2 kPa and of 10 mg/L, respectively, thus, being considered satisfactory. However, there is still little research in this area, especially in a 3D approach.
Therefore, this work conducted a theoretical study to describe the hydrodynamics of a UASB reactor treating domestic wastewater. A mathematical model in three-dimensional space was used to obtain a numerical solution for the model, using the commercial software Ansys CFX. There were considered different inclinations of the gas deflector to assess its influence on the velocity field inside the reactor.
In order to support and validate the numerical study, experimental data obtained by Lima et al. [26] will be used especially inlet volumetric flow rate to the reactor, the concentration of solids at the liquid-gas interface, and at the reactor outlet and the pressure field inside it in different locations.

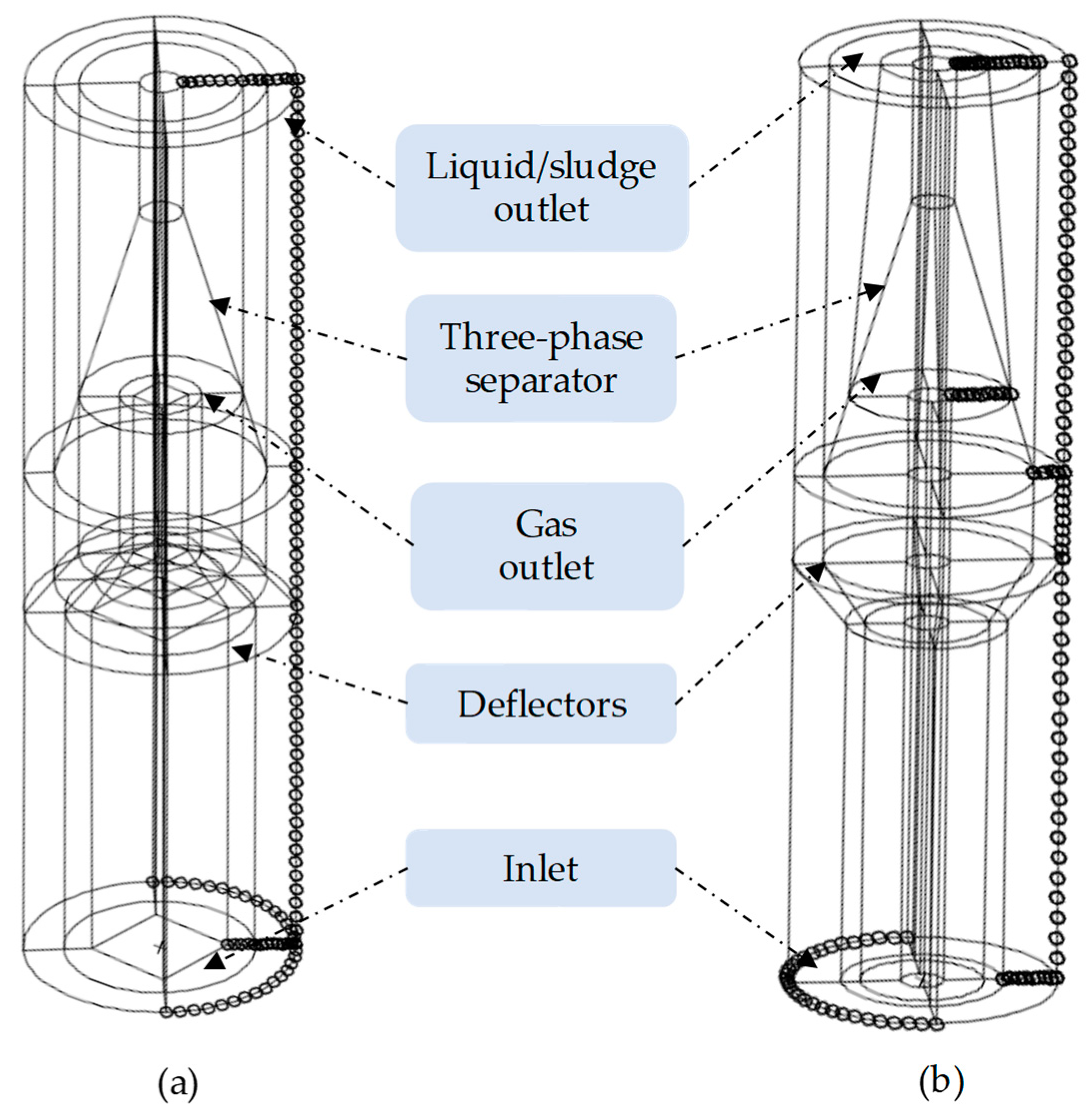
2. Materials and Methods

Simulations of multiphase flow inside the UASB reactor were carried out with the aid of commercial package CFX versions 4 and 10.

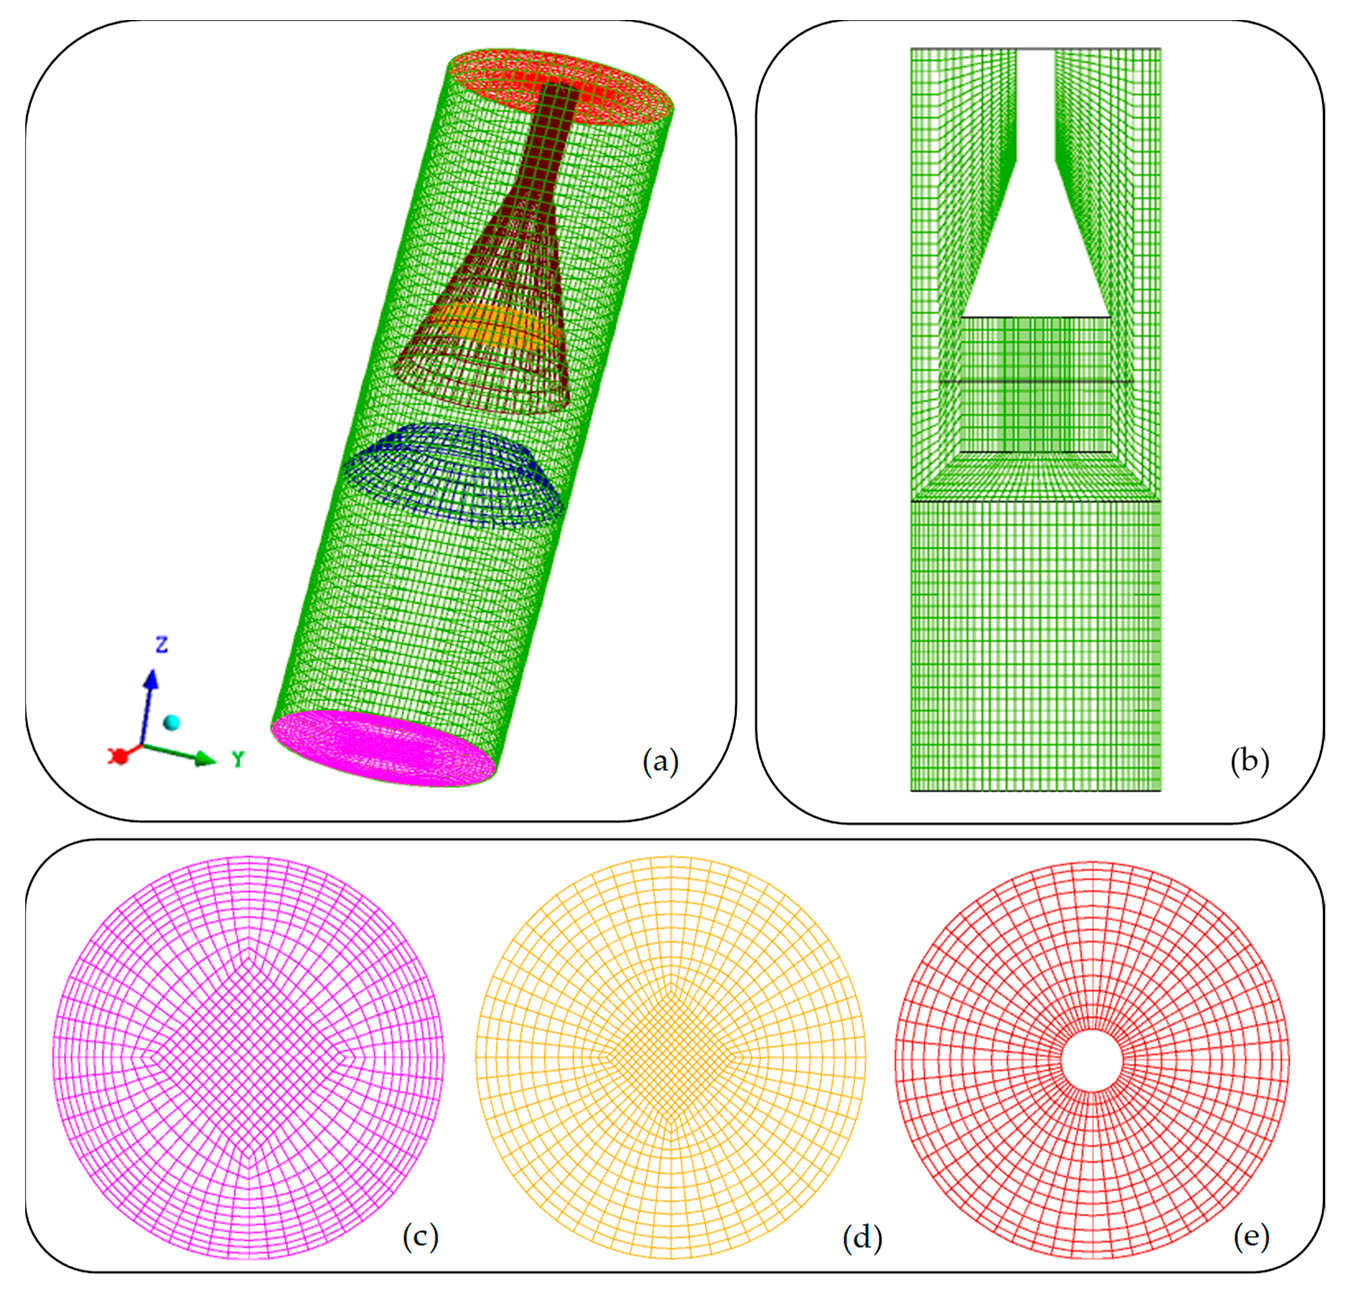
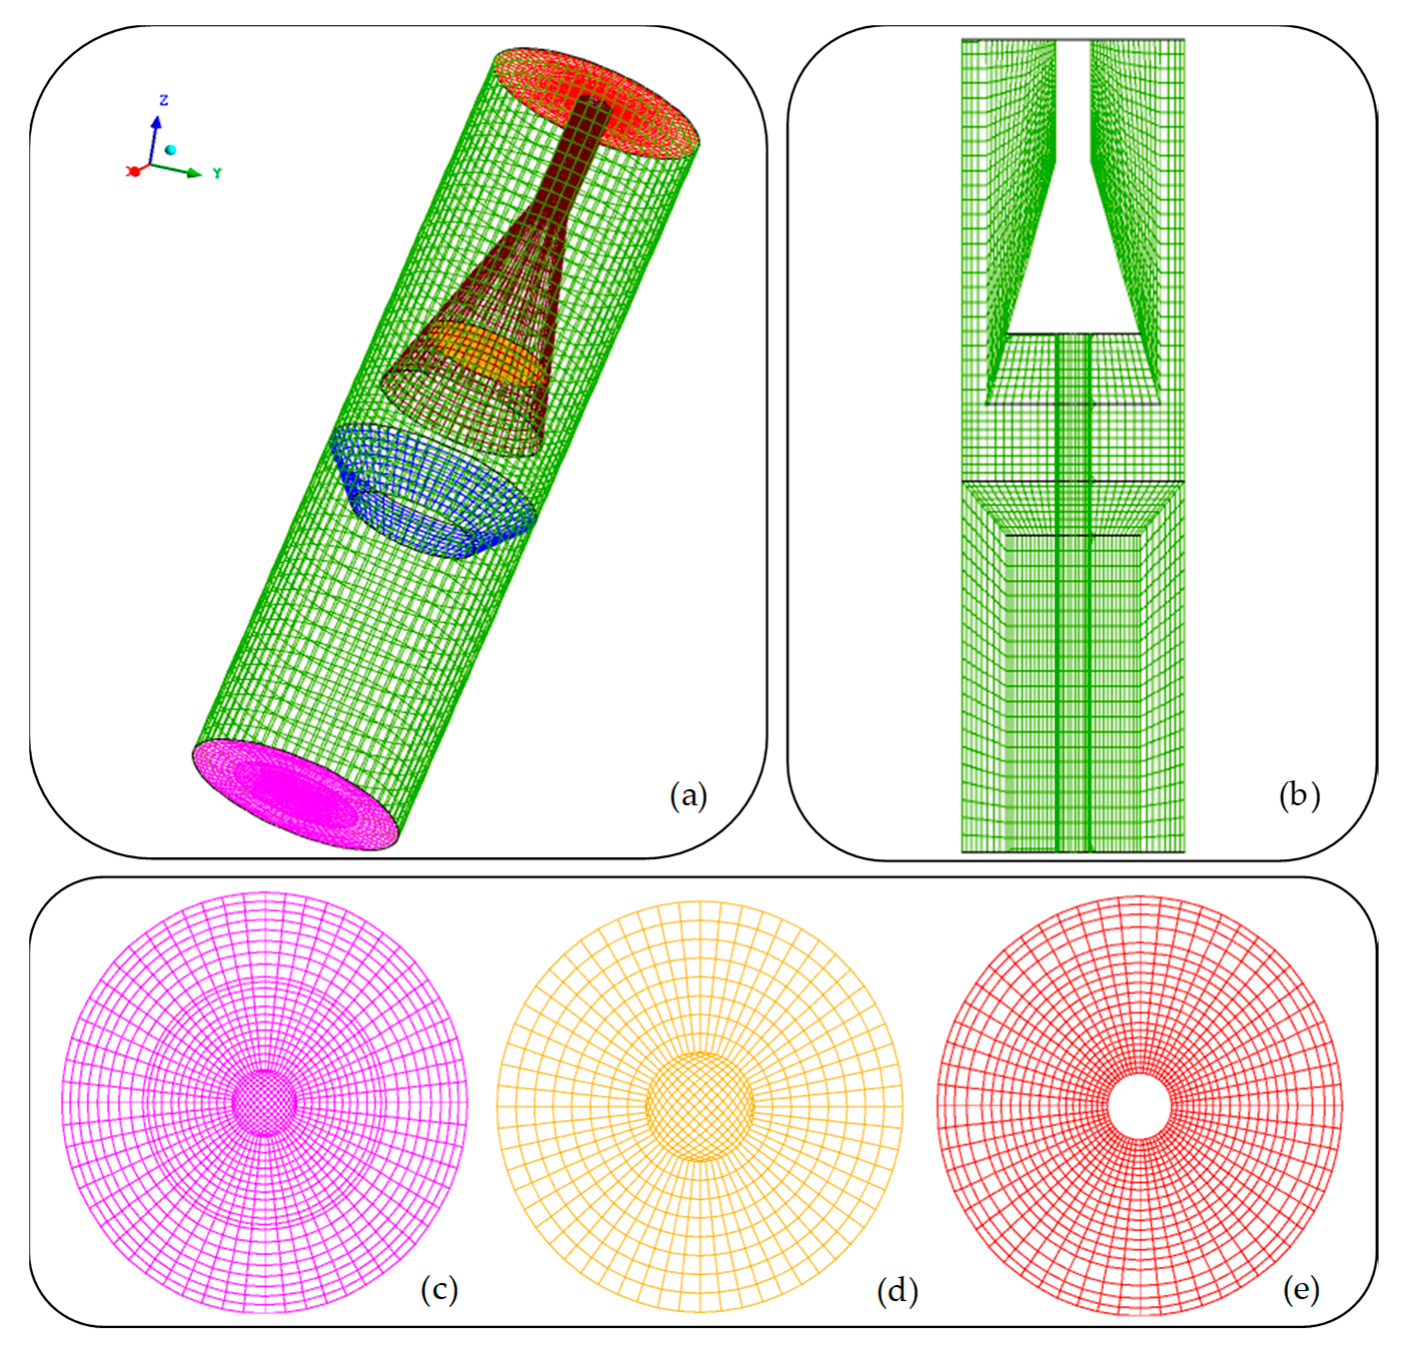
2.1. Mesh Generation

Due to the great complexity of the problem, especially by the presence of a porous area (sludge bed), for simplification, there were not considered conical region of the reactor (comprising the sludge bed), the input ducts (reactor feeding), output ducts (collection of effluent) and the sampling collection ducts (along the reactor height) and thermal and mass transfer effects between phases.
For the study, two meshes were made in three-dimensional space, one with inclination of the deflector upwards and one downwards. Then, twelve refinements were performed in order to eliminate the dependence of the results on the mesh.
Figure 1 shows the distribution of the spacing between the elements obtained with the aid of command ‘mesh seed’ in the CFX®. Figure 2 and Figure 3 illustrate the meshes resulting from this refinement, with the deflector slope upwards (67,875 hexahedral elements) and downwards (81,630 hexahedral elements), respectively, which were used in the numerical simulations. These figures show the deflector, the three-phase separator and the sections of inlet (liquid, biogas and sludge), outlet of biogas (inside the three-phase separator) and the outlets of liquid and sludge (top of the reactor). Figure 2 and Figure 3c–e illustrate the sections of inlet and outlet of biogas and outlet of three phases on the xy plane at the axial positions z = 0 m, z = 2.29, and z = 3.58 m, respectively.

2.2. Mathematical Modeling

2.2.1. The model

For hydrodynamic study in UASB reactor considering the liquid (water), gaseous (biogas) and solid (sludge) phases, real situation in the UASB reactor, it was used the dispersed multiphase model with interfacial transfer (Eulerian—Eulerian approach).
For this analysis, we adopted the following considerations:
(a)
Turbulent and steady state flow regime.
(b)
Three-phase turbulent flow consisting of a continuous phase (liquid-α) and two dispersed phases (biogas-β and sludge-γ).
(c)
The biogas produced was considered as being composed of methane (70%) and carbon dioxide (30%).
(d)
Gas bubbles and sludge particles were considered as spherical with a diameter of 0.003 m.
(e)
Production of bubbles was considered uniform over the cross section of the sludge blanket, positioned at 0.44 m from the reactor base.
(f)
The interfacial transfer of momentum between the phases α and β is only due to the drag force.
(g)
The source of momentum for the external forces depended only on the buoyancy force.
(h)
Whereas the gas bubbles and sludge particles were spherical and with scarce distributions, we used the following correlations for the determination of drag coefficients [27], for the biogas/water pair of fluids, and Schiller and Naumann [28] for the solid/water pair.
(i)
The biochemical reactions effects have been disregarded.
Based on the considerations mentioned above, the fluid dynamic behavior of the UASB reactor was studied using the equations of mass conservation (1) and linear momentum conservation (2, 3 and 4) described as follows:
- Mass conservation:
( r α ρ α U α ) = 0
where r and U are specific mass and velocity vector, respectively.
- Linear momentum conservation:
For the liquid phase:
[ r α ( ρ α U α U α ) ] = r α p + { r α μ α ( U α + ( U α ) T ) } + r α ( ρ α ρ ref ) g + c α β ( d ) ( U β U α )
where r is the volumetric fraction, p is the pressure, μ is the dynamic viscosity, g is the gravity acceleration, and c α β ( d ) is the interfacial drag term between the α and β phases.
For the gas phase:
[ r β ( ρ β U β U β ) ] = r β p + { r β μ β ( U β + ( U β ) T ) } + r β ( ρ β ρ ref ) g + c α β ( d ) ( U β U α )
For the solid phase:
[ r γ ( ρ γ U γ U γ ) ] = r γ p + { r γ μ γ ( U γ + ( U γ ) T ) } + r γ ( ρ γ ρ ref ) g + c α γ ( d ) ( U γ U α )
where c α γ ( d ) is the interfacial drag term between the α and γ phases (β and γ represent the dispersed phases, and α represent the continuous phase).
As a result of being considered turbulence k-ε model, the terms referring to the following were added:
- Turbulent kinetic energy:
{ r α [ ρ α U α k α ( μ + μ t α σ k ) ] k α } = r α ( p α ρ α ε α ) + T α β ( k )
where k is the turbulent kinetic energy, σ is the superficial tension ( σ k = 1.0 and σ ε = 1.3), ε is the turbulent dissipation rate, T α β ( k ) is the interfacial transfer for turbulent kinetic energy, and μ t is the eddy viscosity expressed by Equation (6).
μ t = ρ c μ k 2 ε
where c μ is a constant and equal to 0.09.
- Turbulent dissipation rate:
[ r α ρ α U α ε α ( μ + μ t α σ ε ) ε α ] = r α ε α k α ( c ε 1 p α c ε 2 ρ α ε α ) + T α β ( ε )
where c ε 1 and c ε 2 are the constant model ( c ε 1 = 1.44 and c ε 2 = 1.92), and T α β ( ε ) is the turbulent dissipation rate.

2.2.2. Boundary Conditions and Physical Properties of the Phases

The input conditions specified for all cases studied (inclination of the deflector upwards and downwards) were: mass flow rate of the mixture 0.004 kg s−1 and volume fraction 0.91, 0.06 and 0.03 for liquid, gaseous and solid phases, respectively. The value of the mass rate was obtained from the concentrations of organic matter and inlet volumetric flow rate in the reactor, obtained experimentally. The value of the volume fraction of the gaseous phase was obtained from the estimated COD (oxygen chemical demand) load at the inlet of the reactor that is converted in methane gas and for solid phase the data was based on experimental results and in the literature [6,29]. The volume fraction of the liquid phase was specified to keep the sum of the volume fractions equal to 1 ( r w a t e r + r a i r + r o i l = 1 ).
The boundary conditions specified in the walls of the reactor, gas deflector, and outlet of sludge and water of the reactor (top of the reactor) are provided in Table 1. For the boundary of biogas outlet (inside the three-phase separator), the degassing condition was specified, which allows the passage of the gaseous phase through the boundary and prevents the passage of water and sludge. This condition is commonly used in distillation columns [30]. Table 2 reports the physical properties of phases involved in the physical problem treated here.

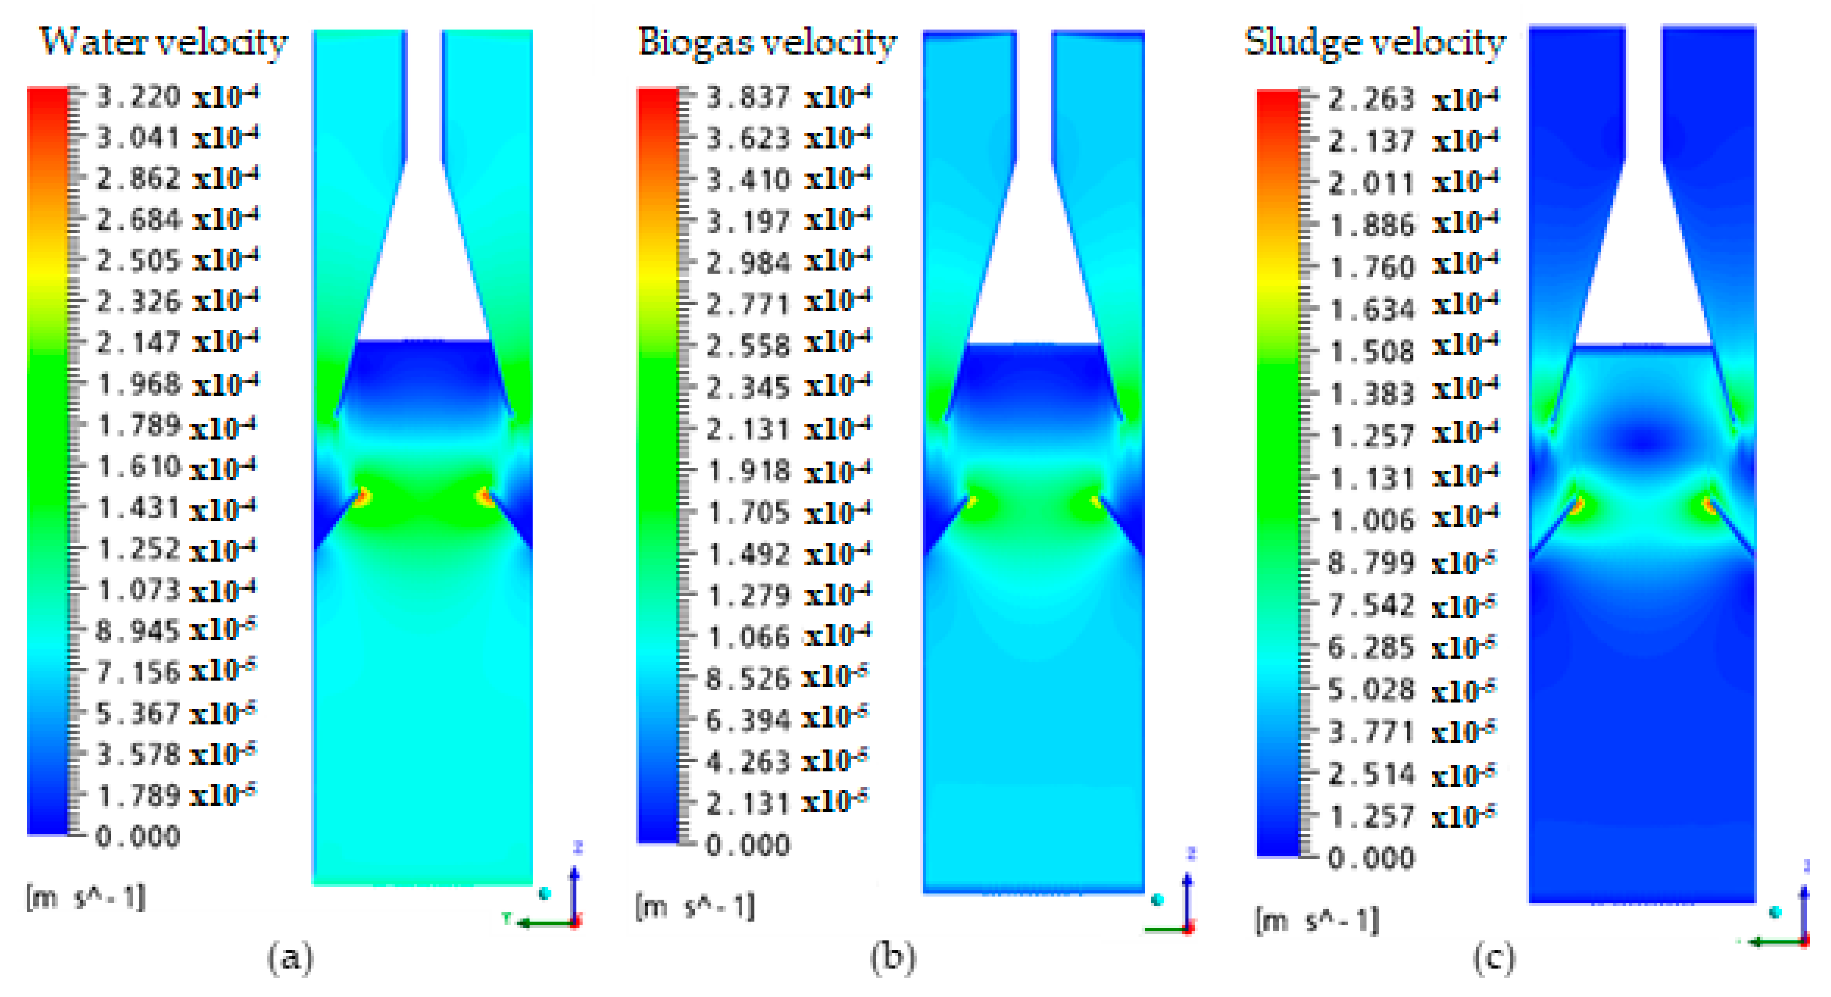
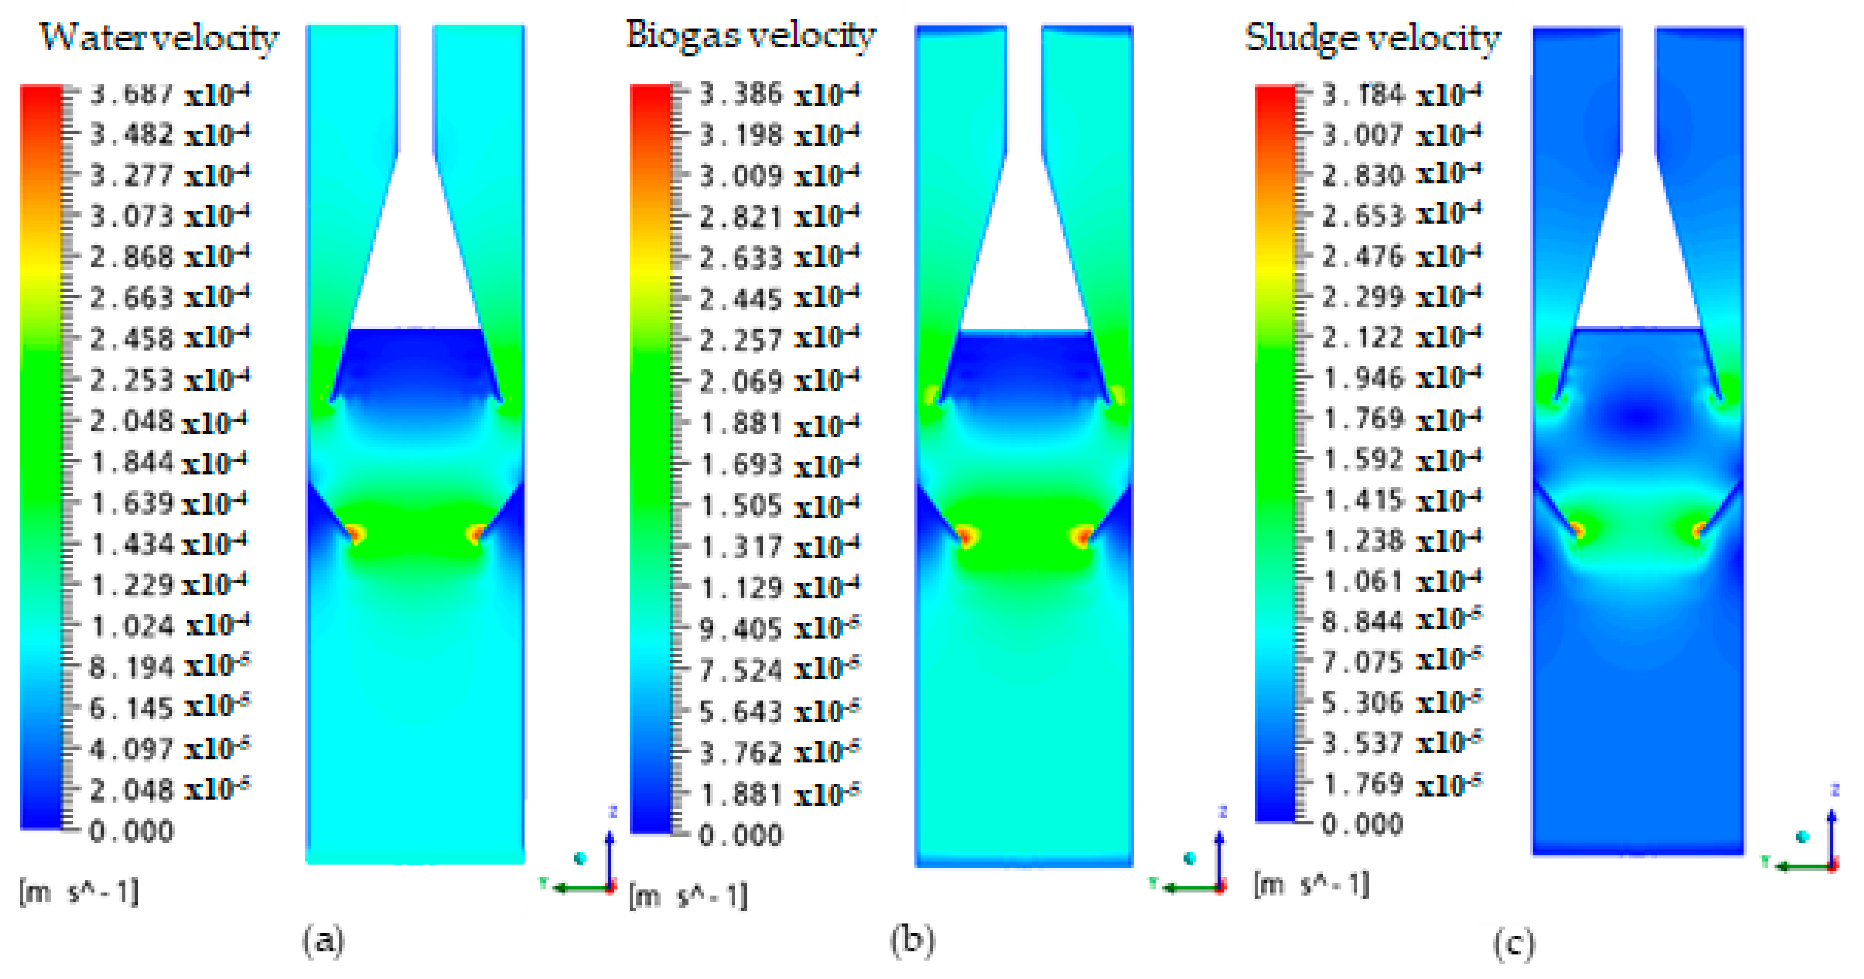
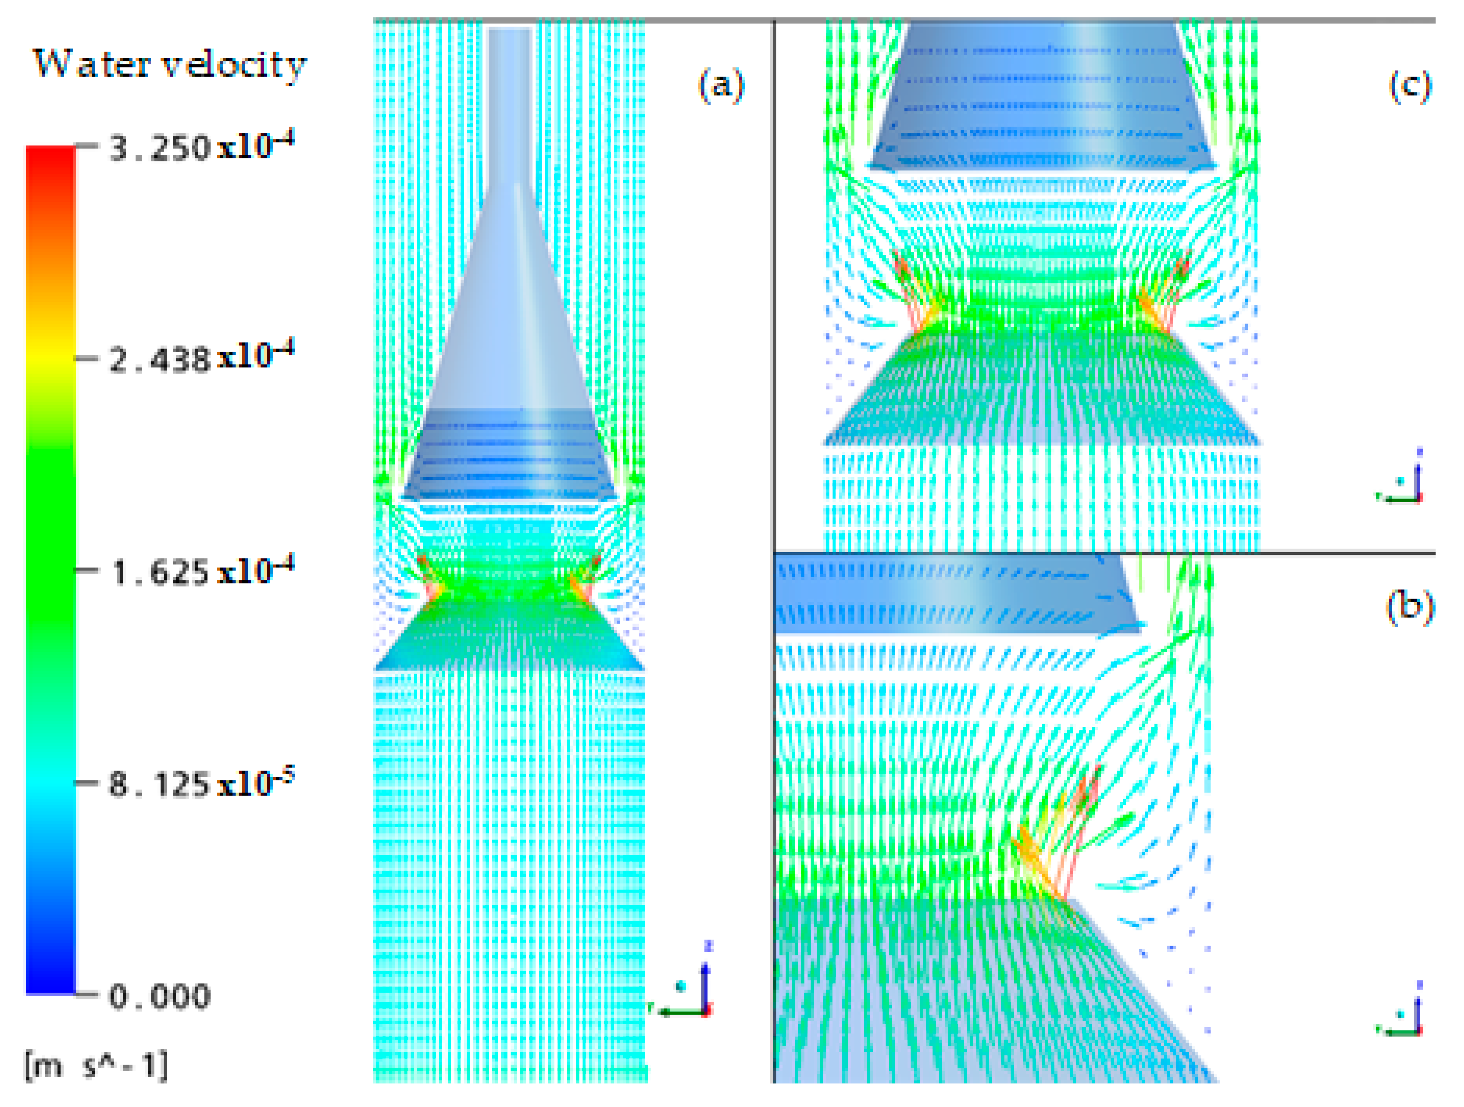
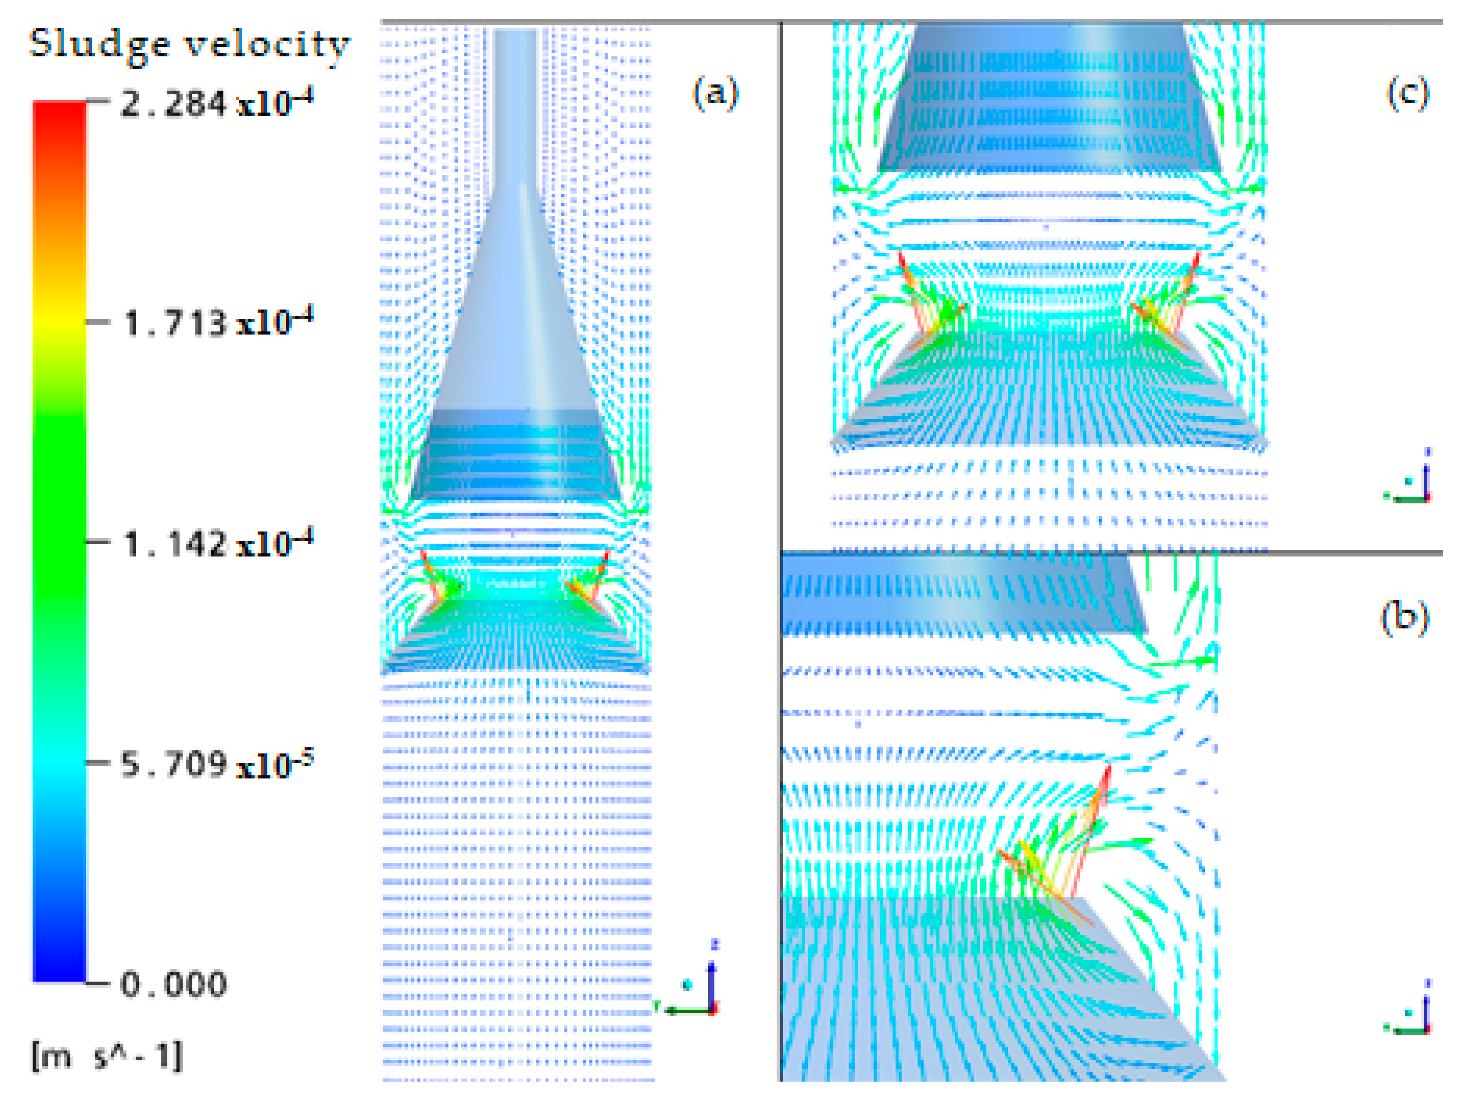
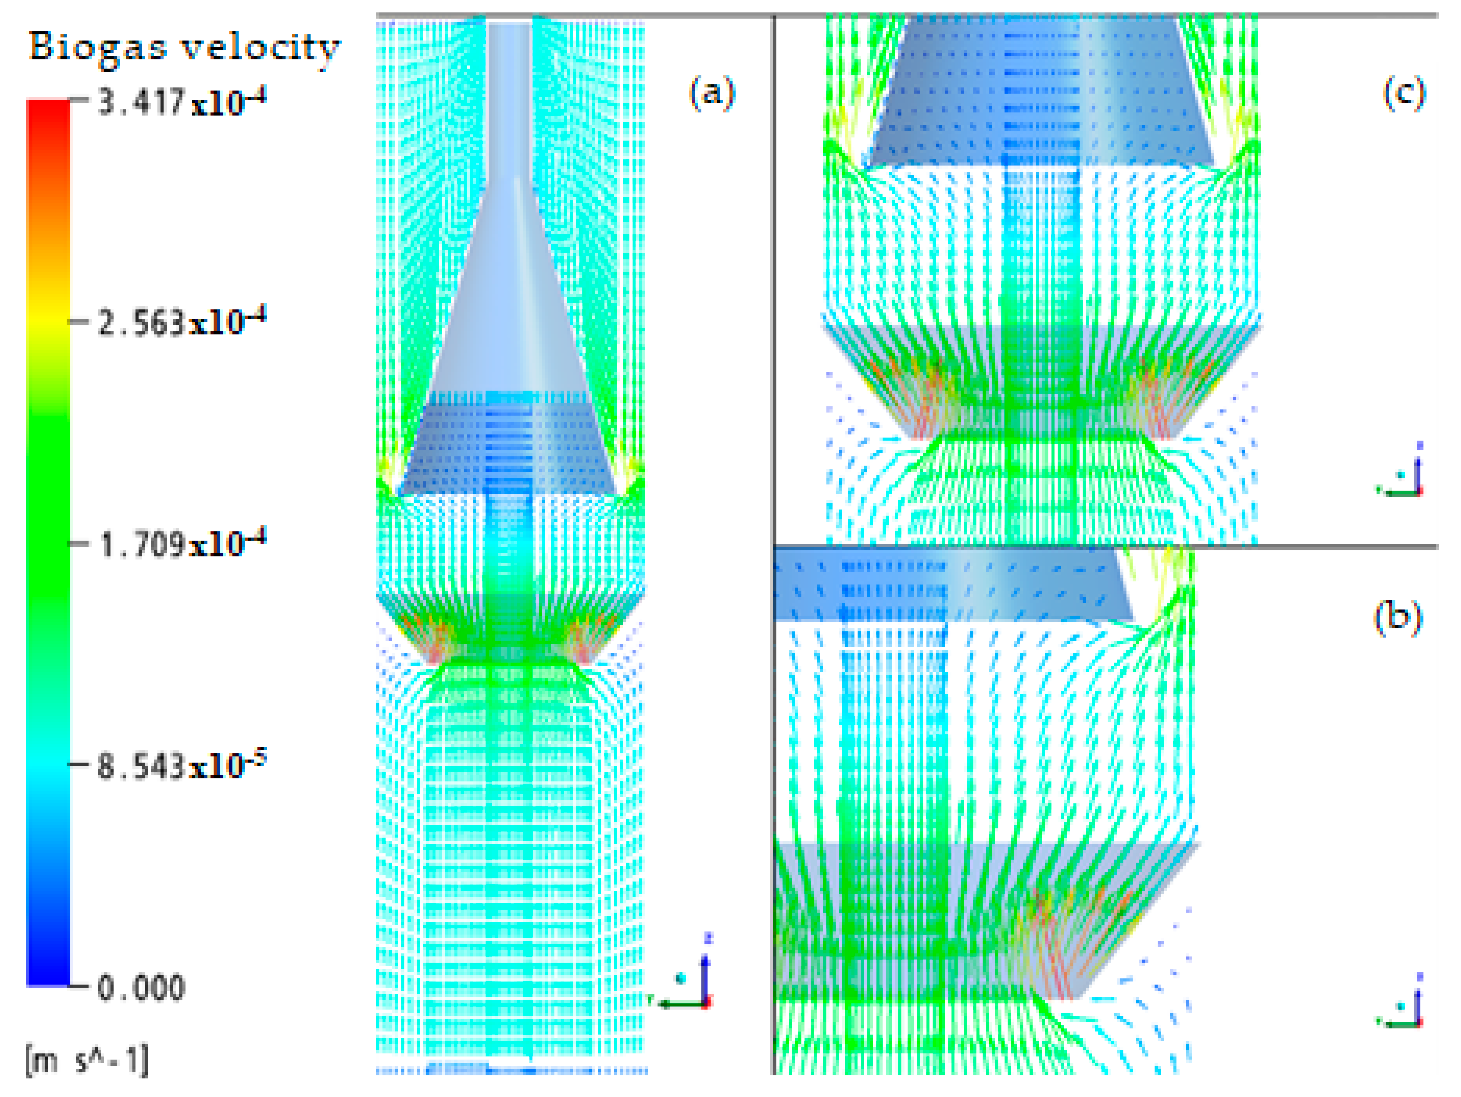
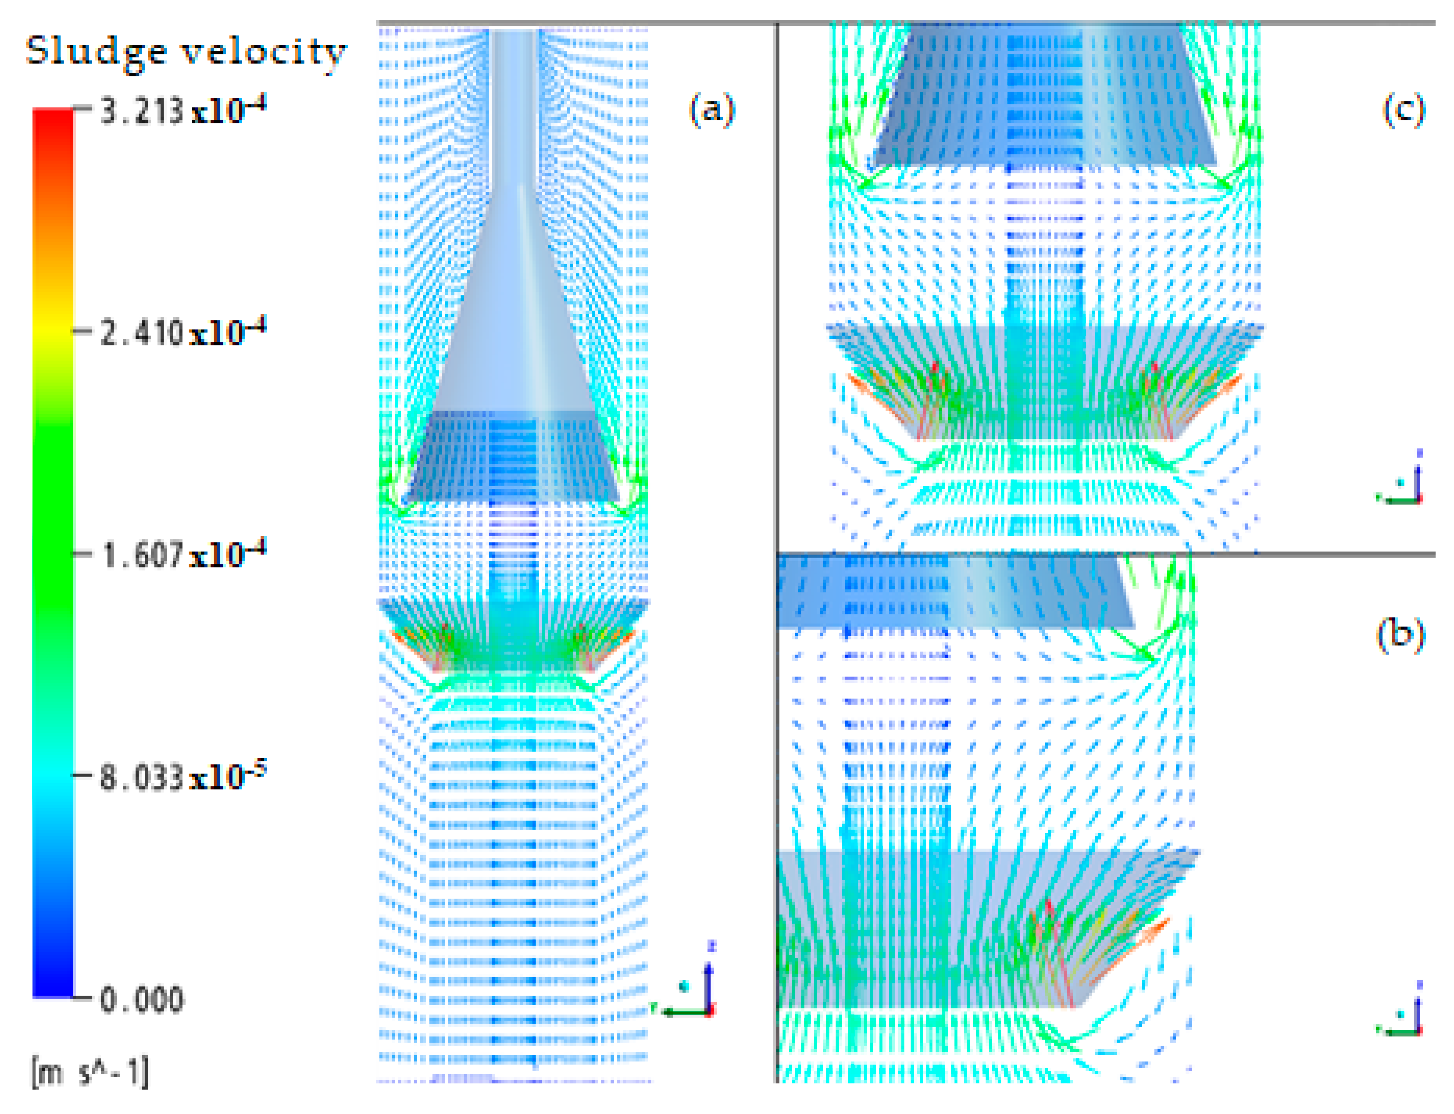
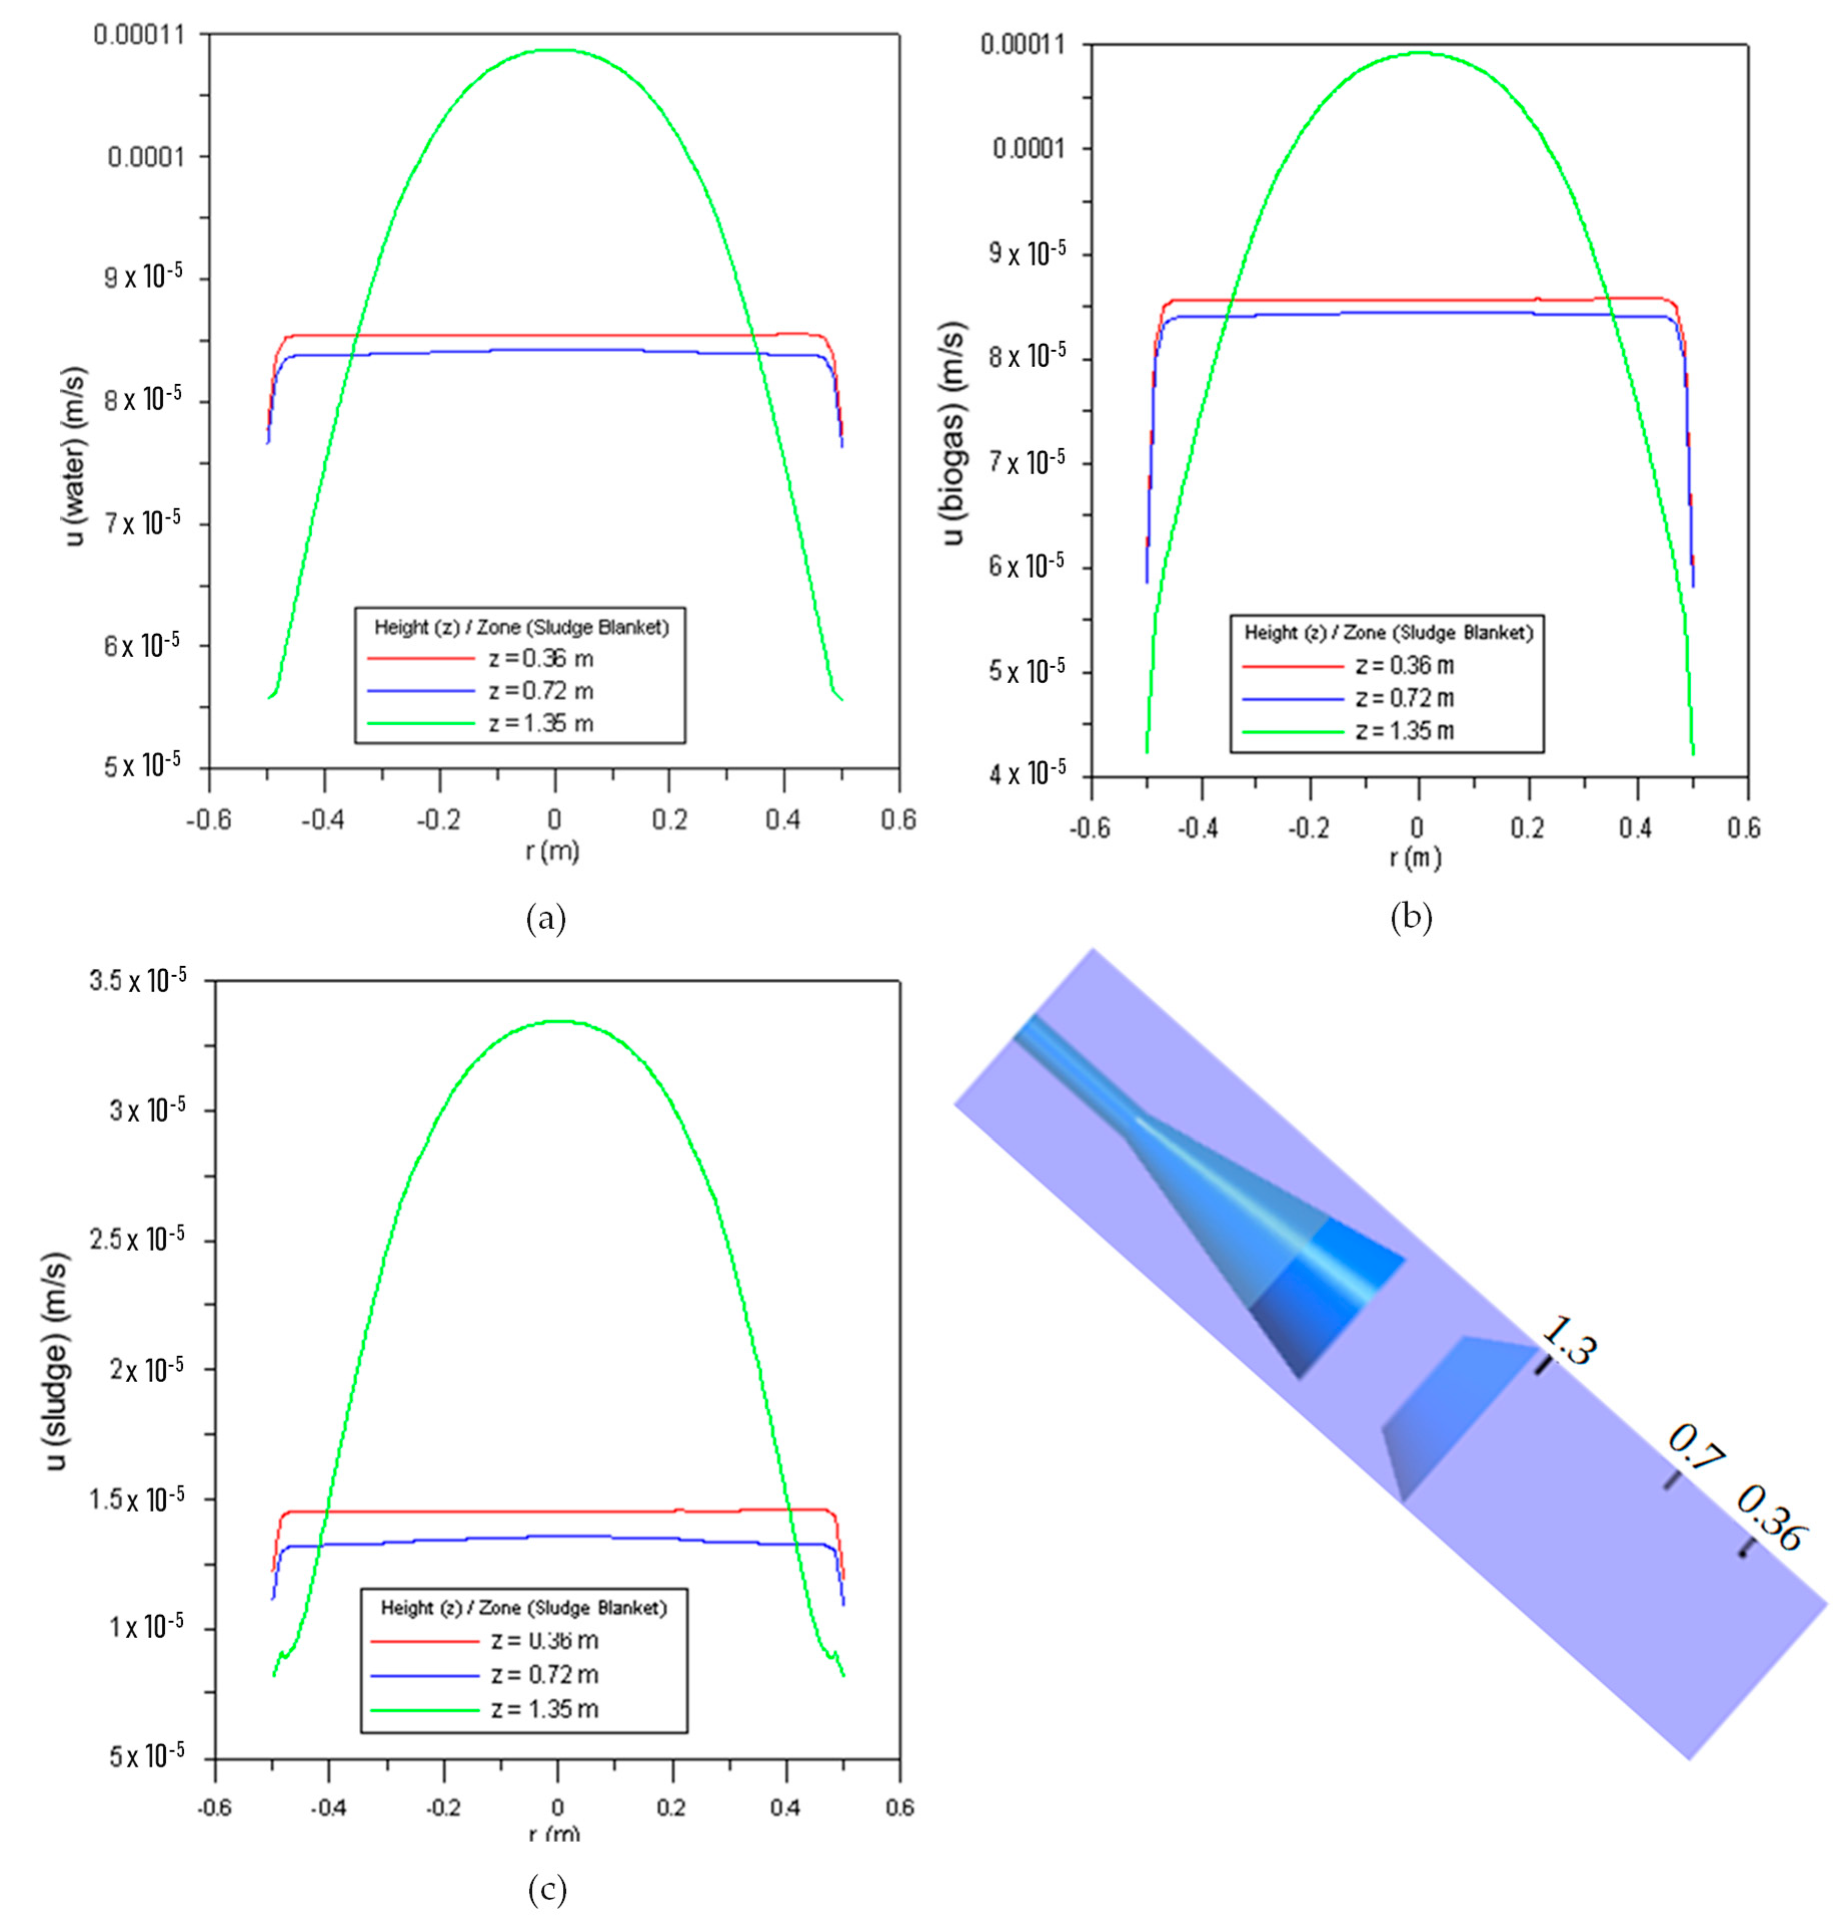
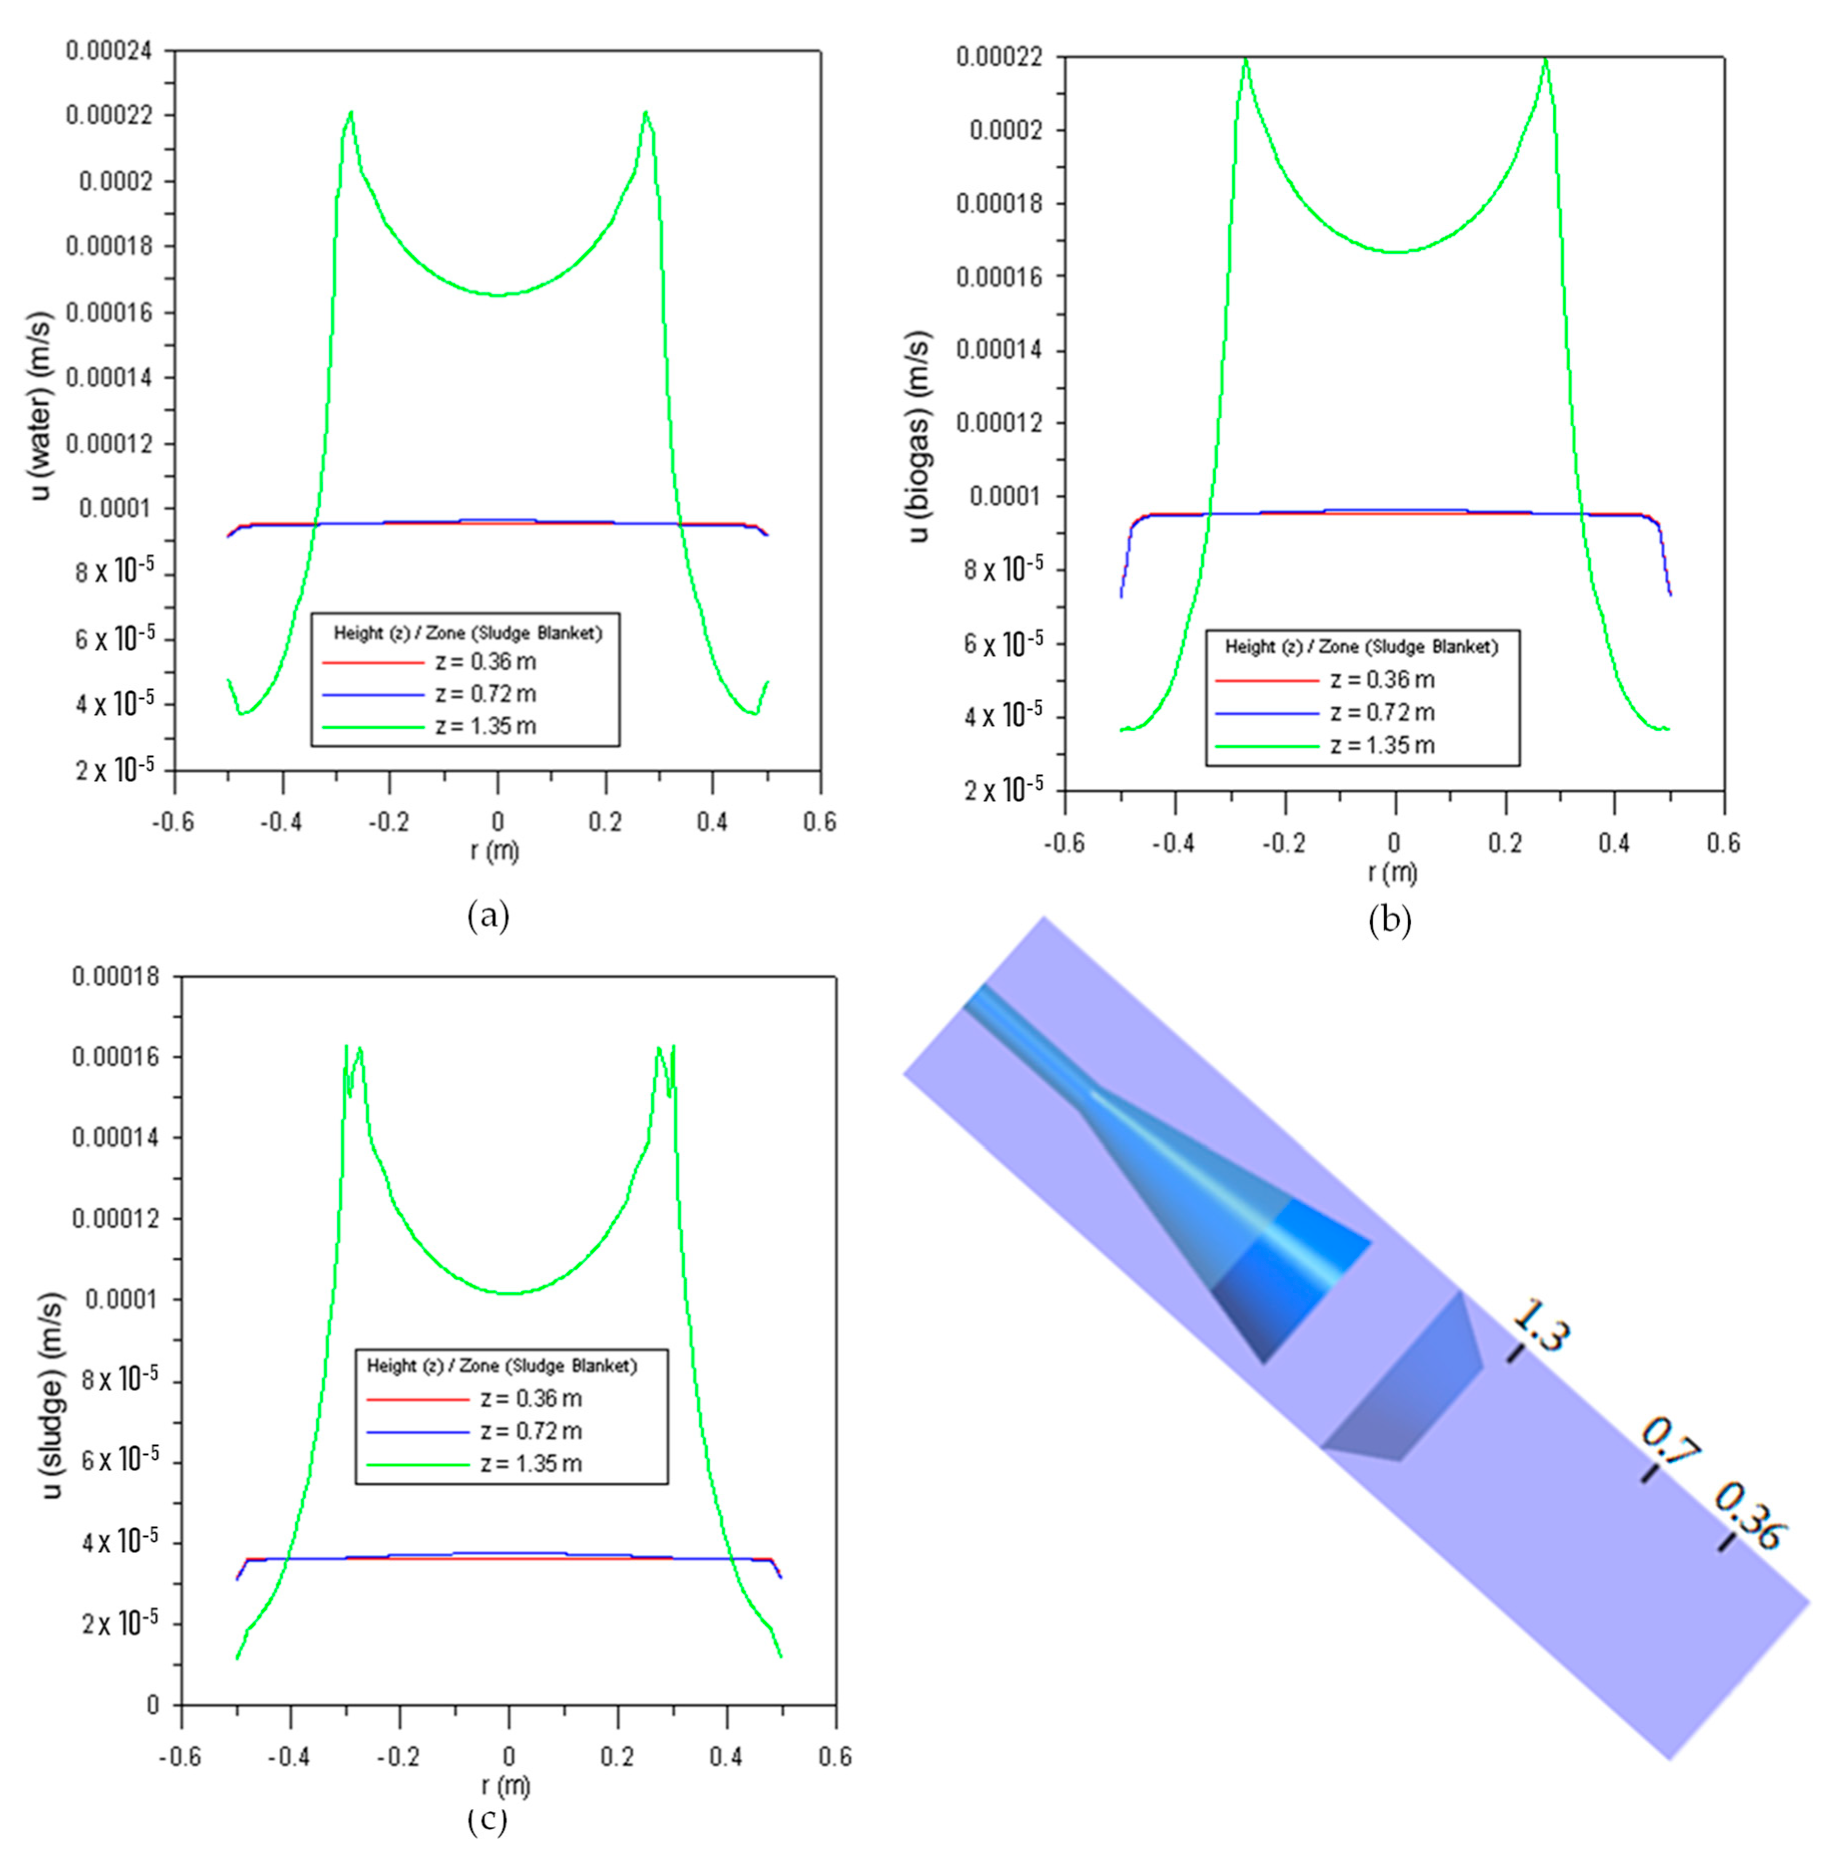
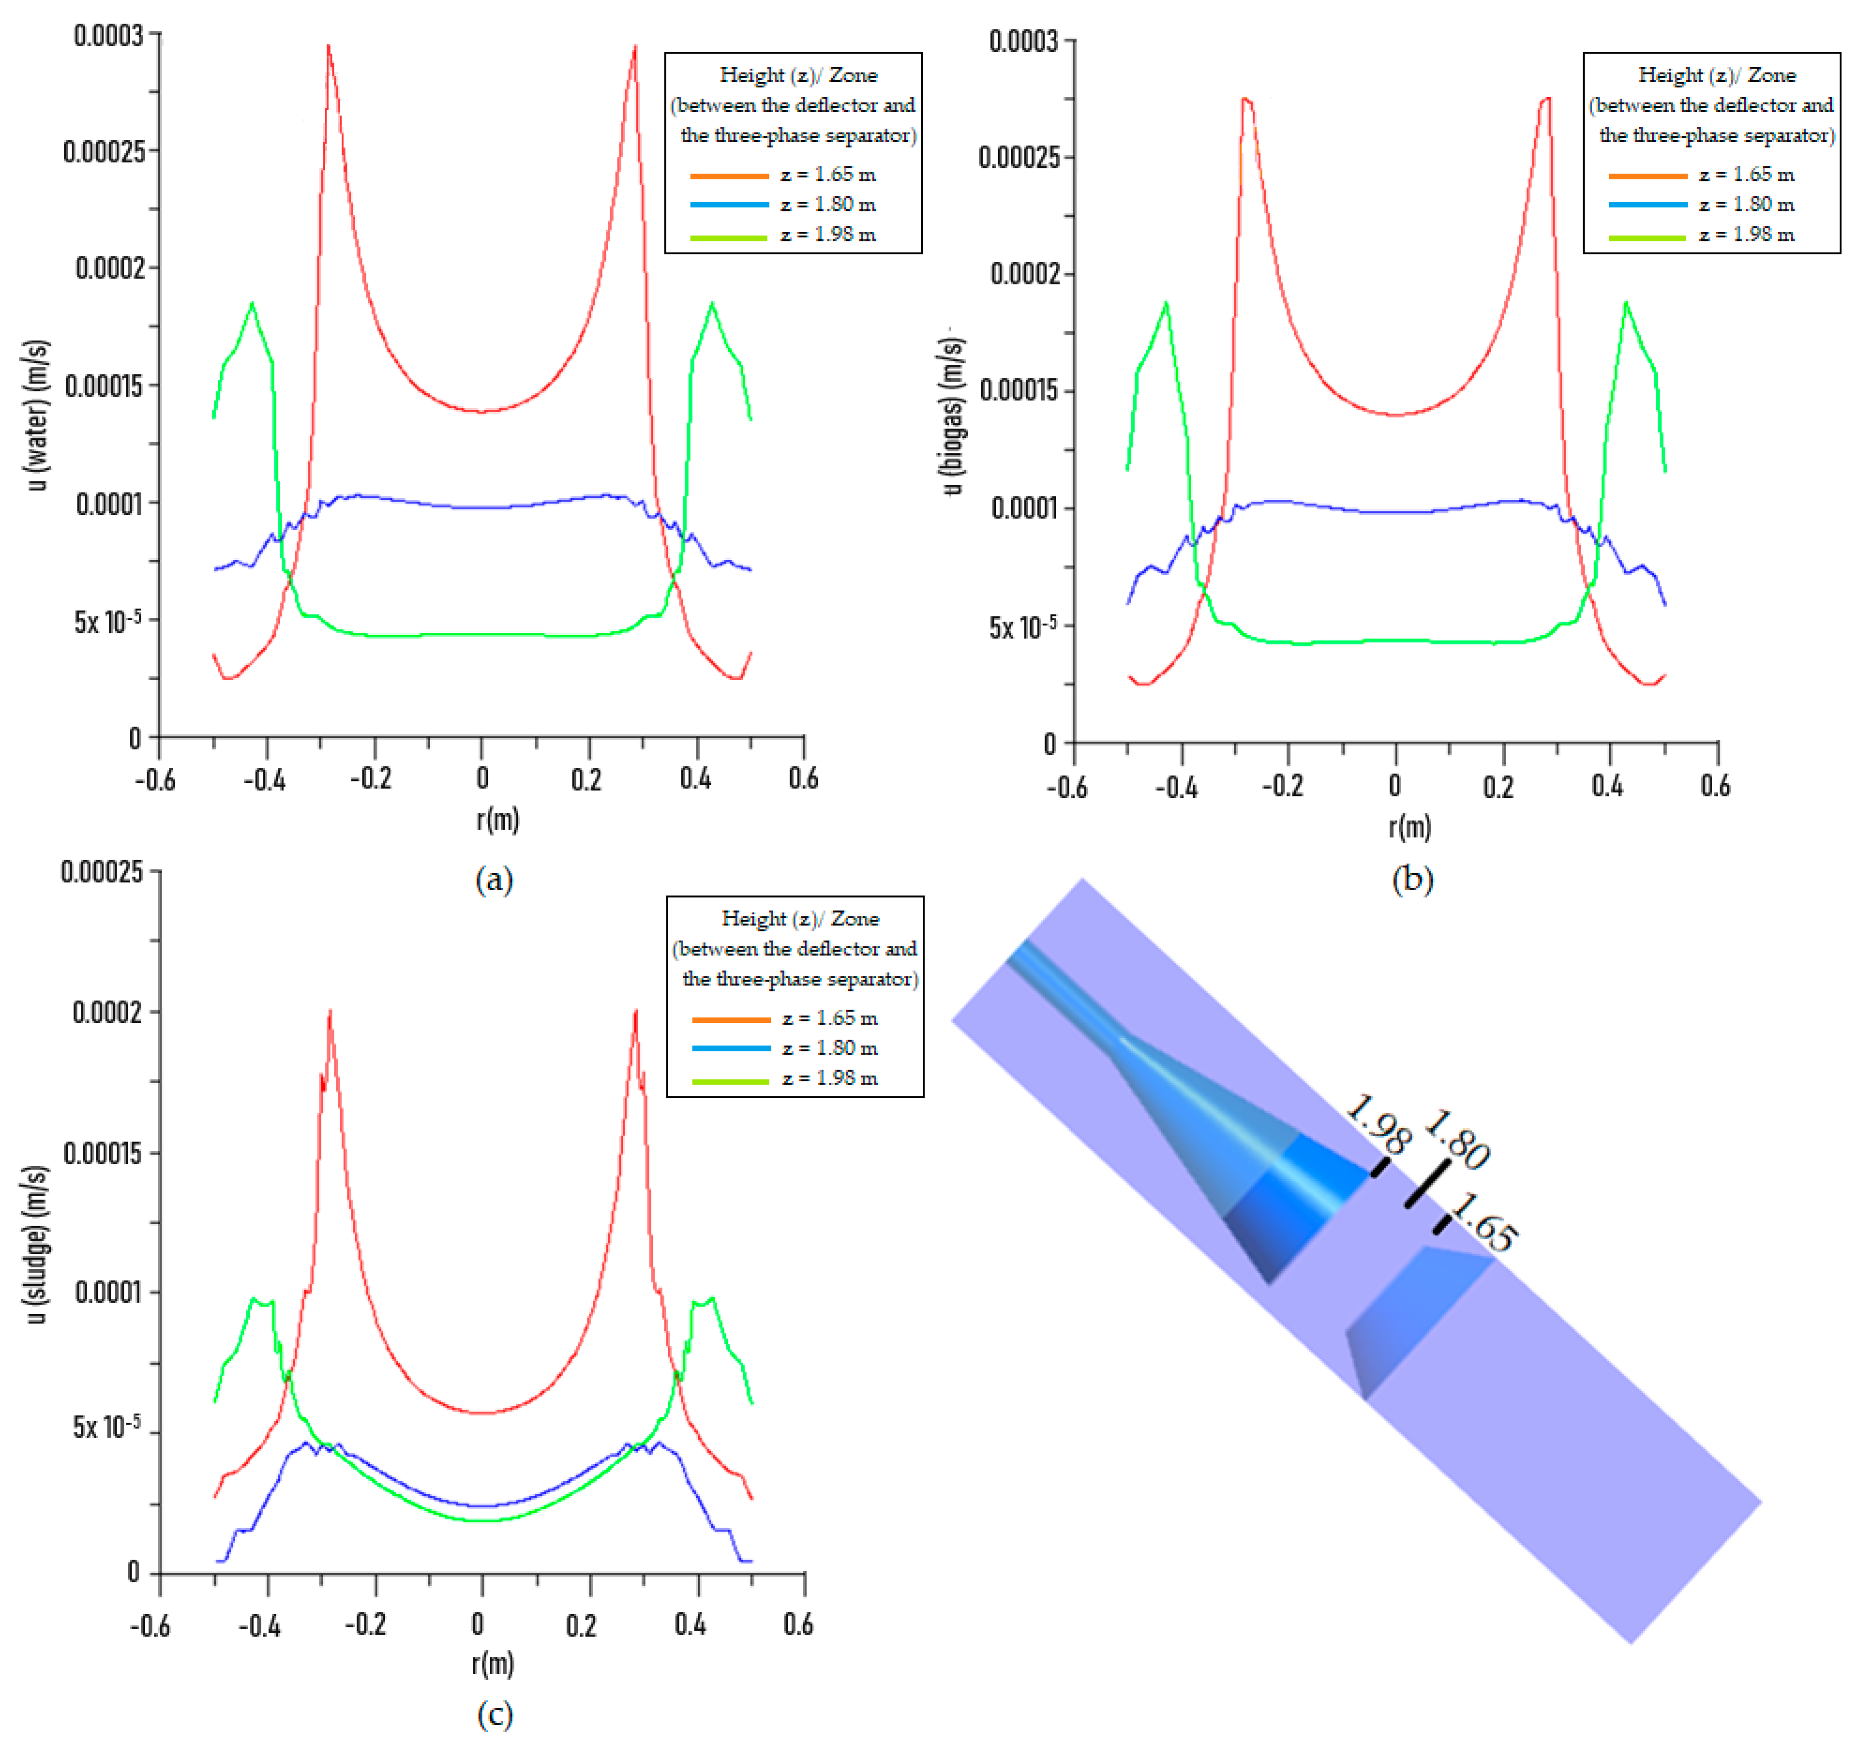
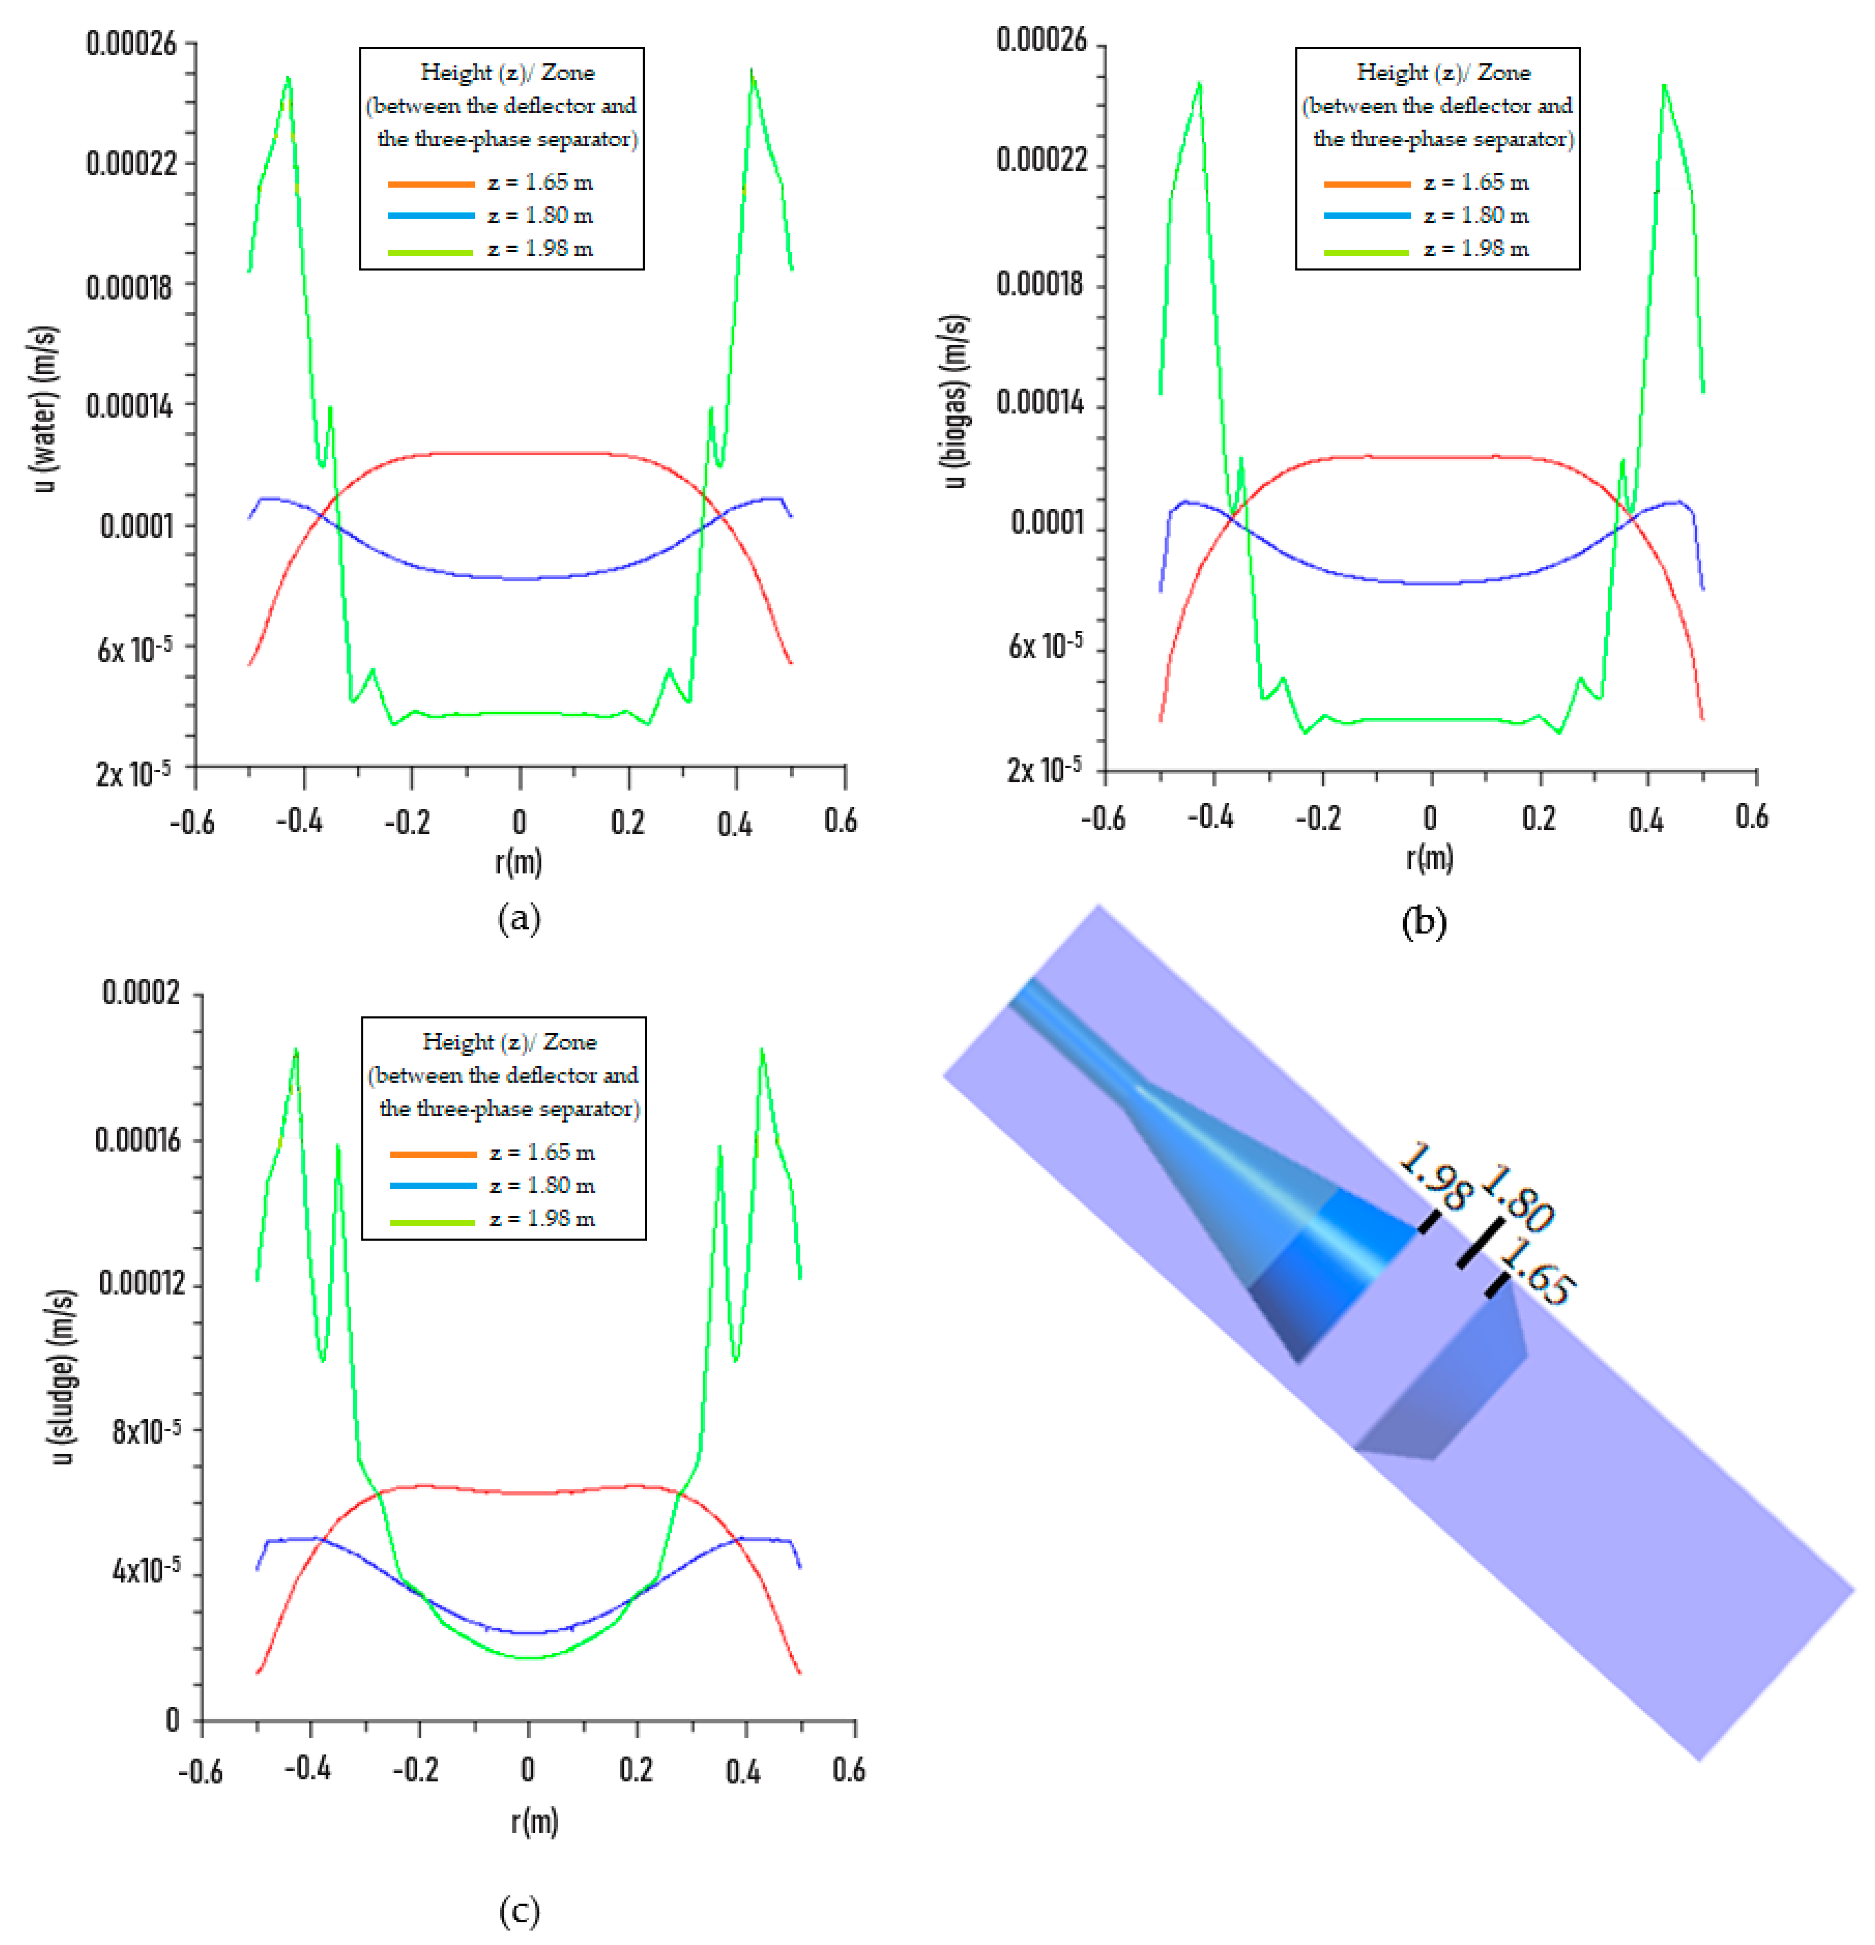
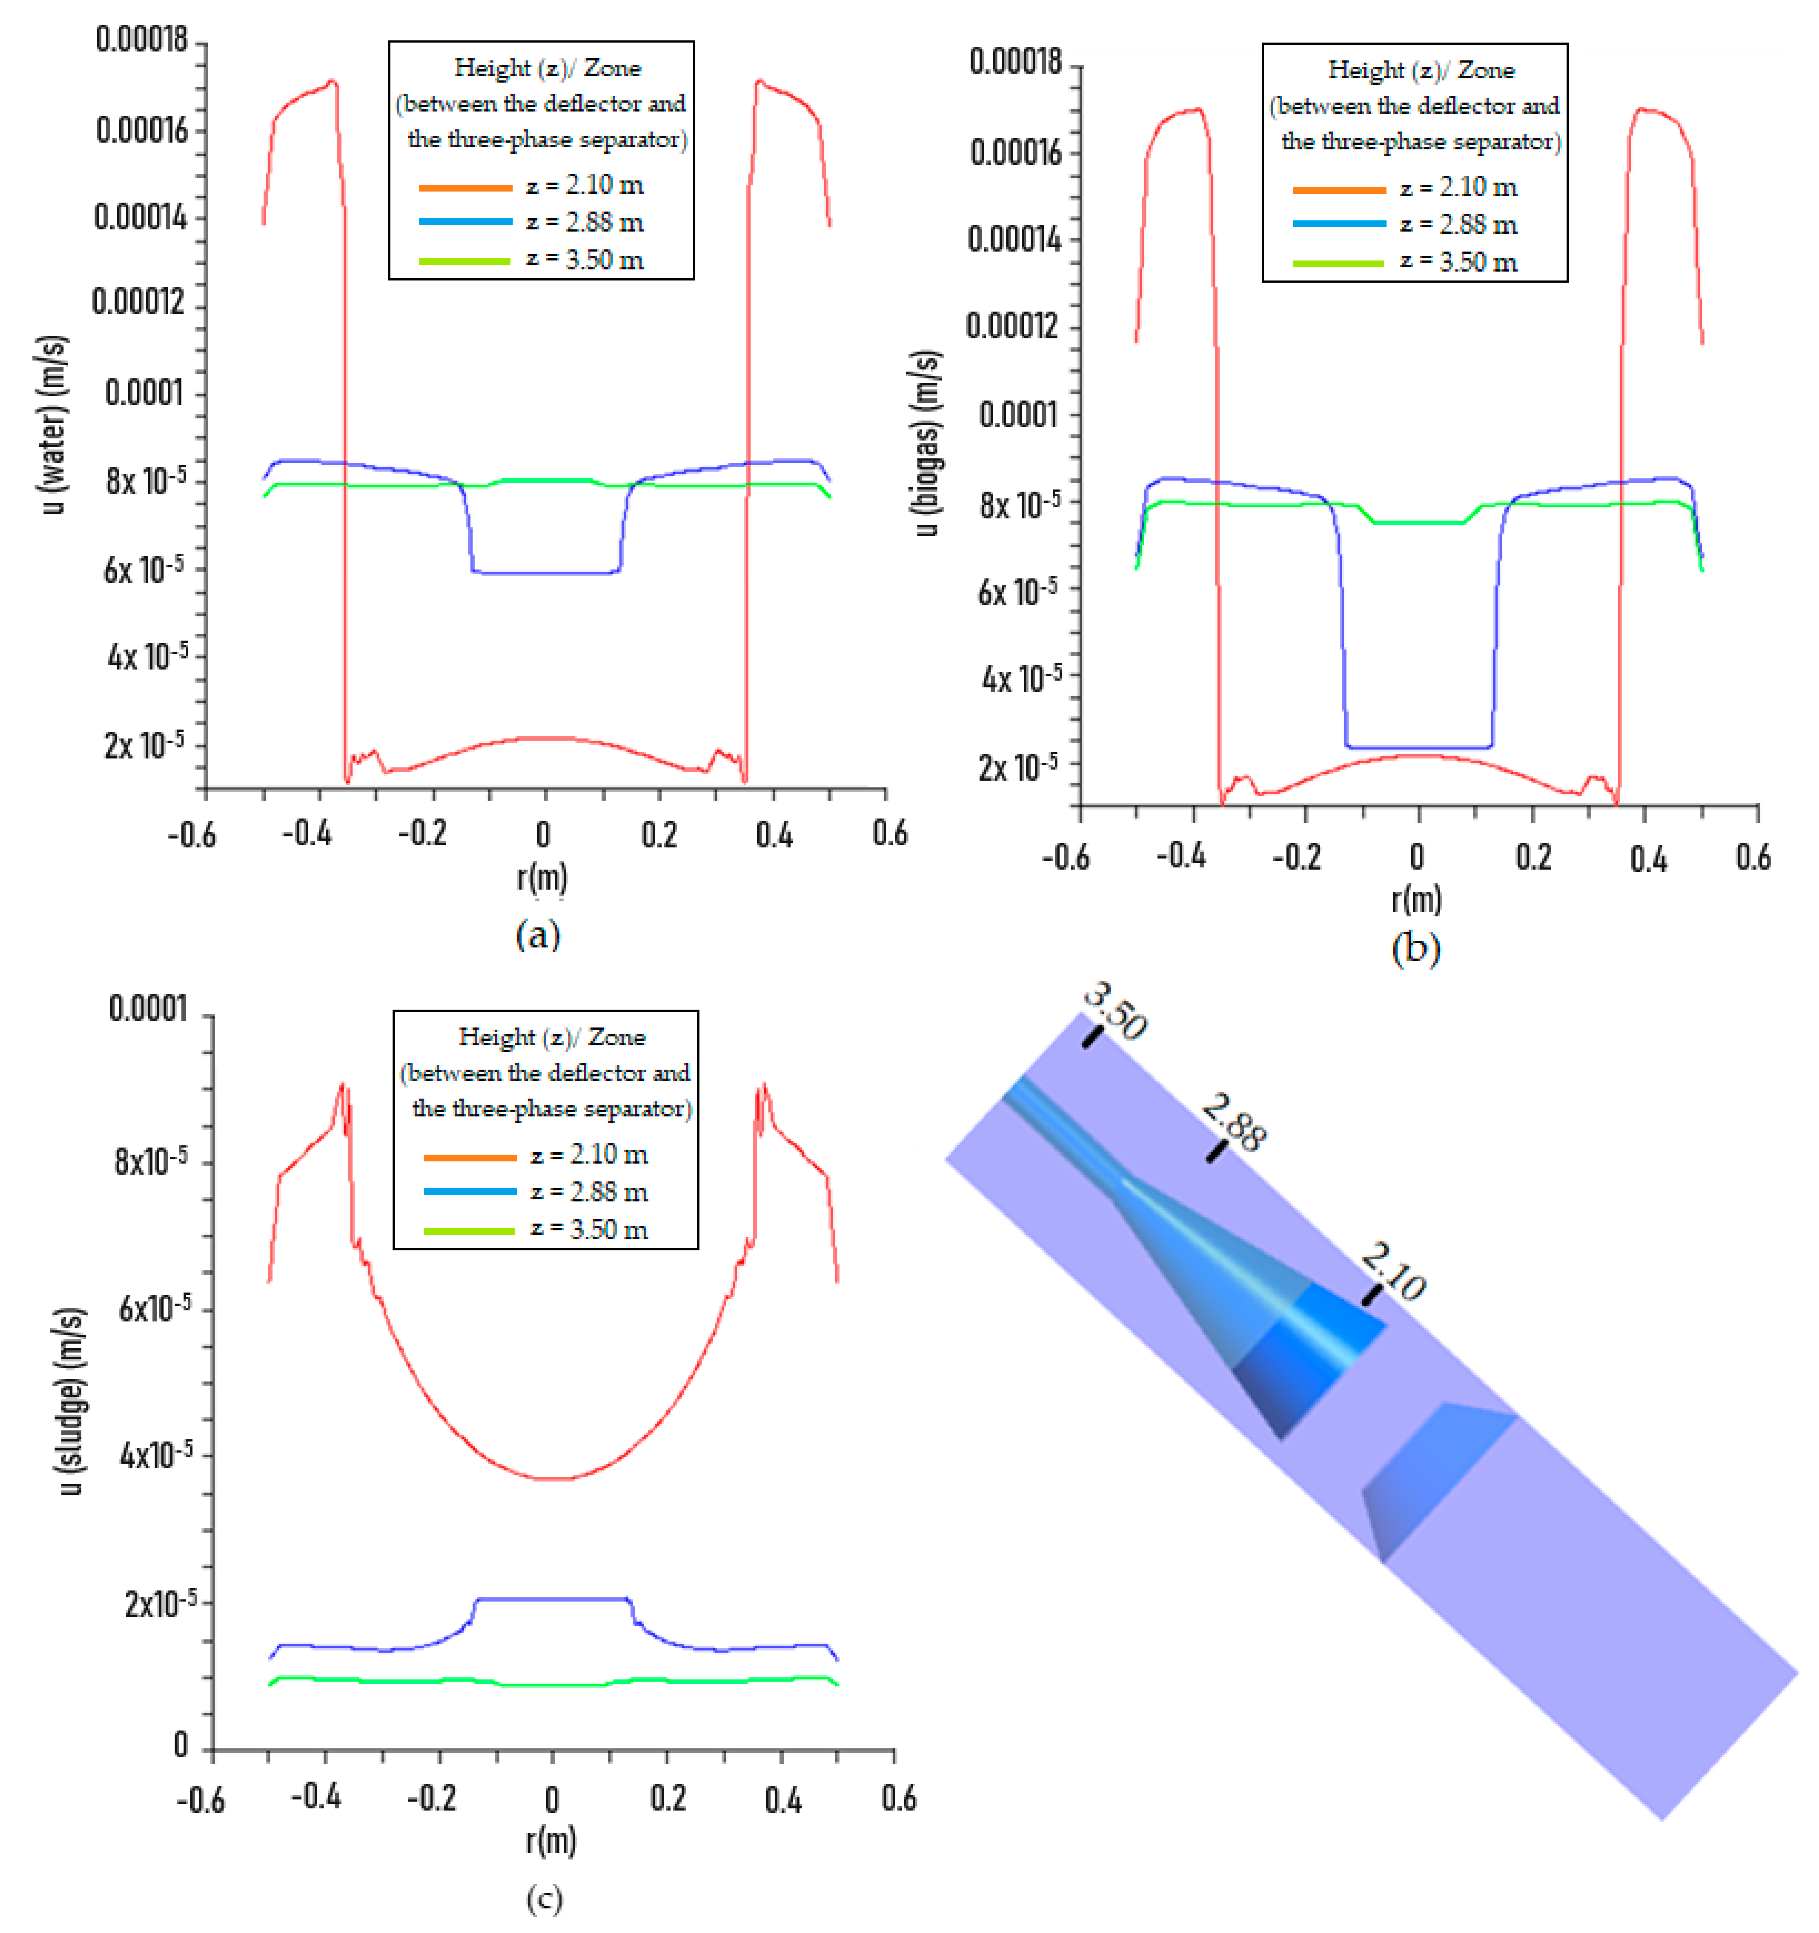
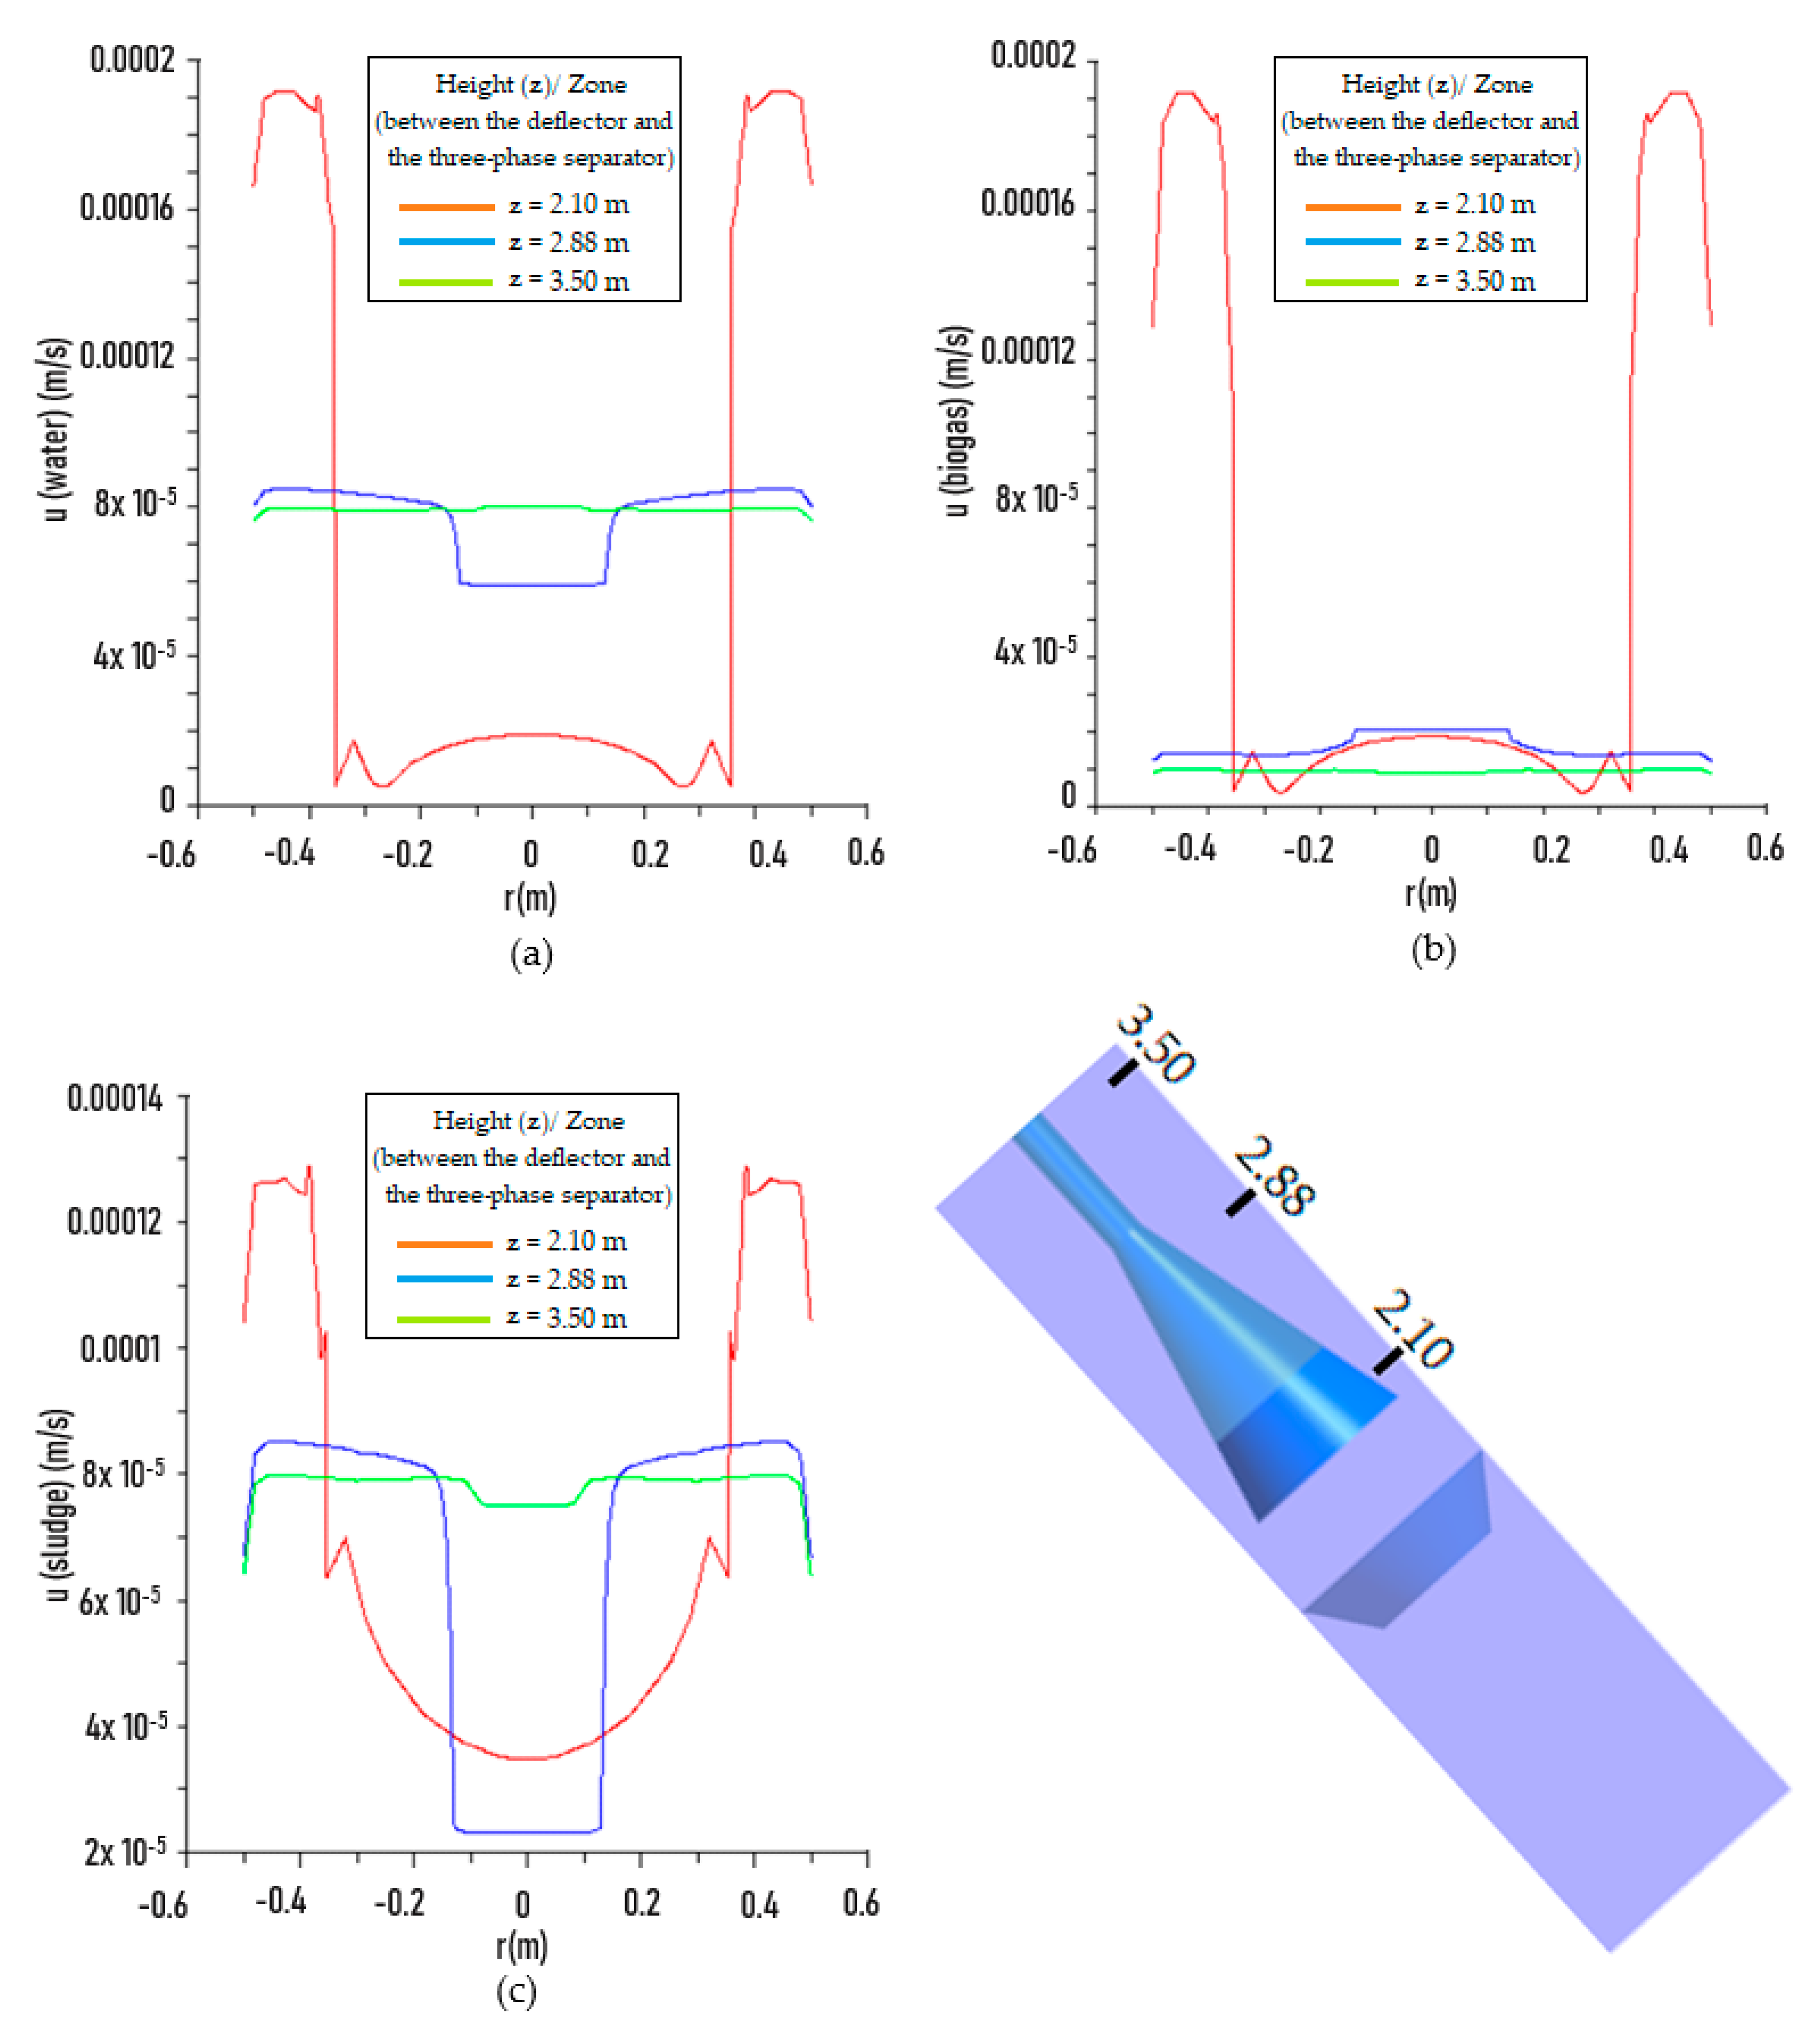
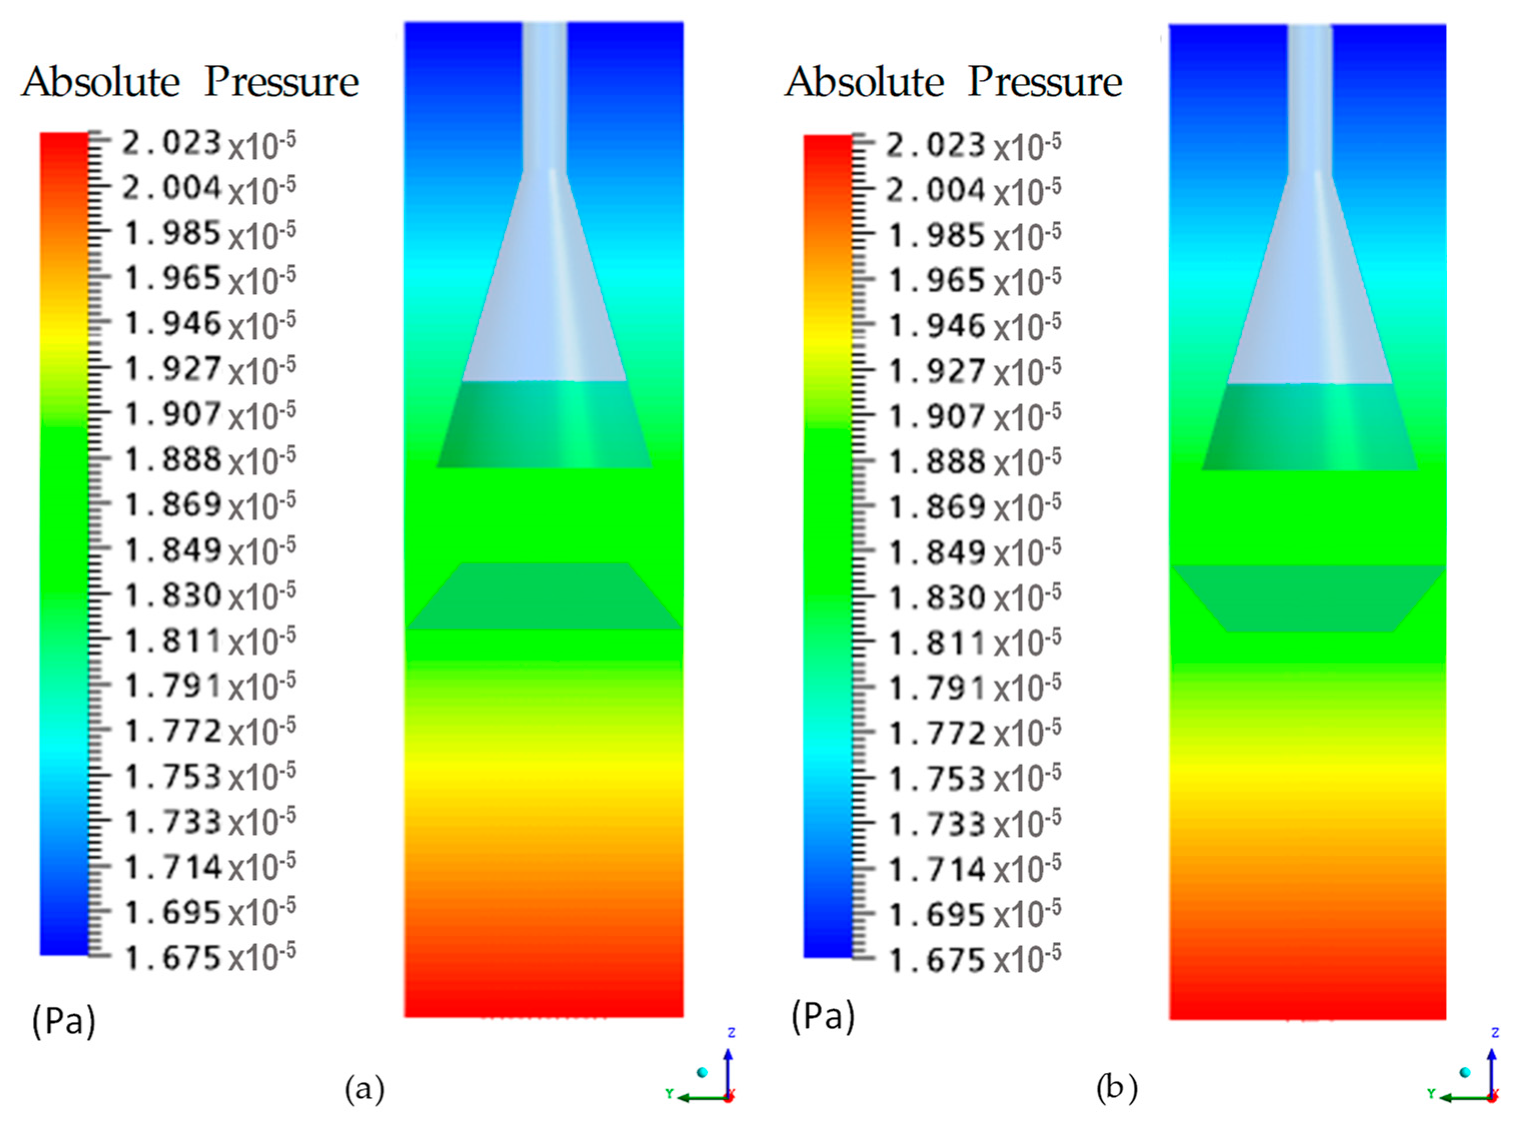
3. Results and Discussion

Figure 4 and Figure 5a–c illustrate the isosurfaces of velocities of water, biogas and sludge on the zx plan, for the geometries of the UASB reactor with inclination of the deflector upwards and downwards, respectively.
With the analysis of these figures, the isosurfaces of velocities showed similar behavior in both cases, and as expected, for all phases, higher velocities are found in the regions where there is a reduction of the cross section for the phases flow (smaller diameter section in the deflector and between the apertures of the three-phase separator and the reactor walls). The gaseous phase presented the highest values of velocity. Figure 6, Figure 7, Figure 8, Figure 9, Figure 10 and Figure 11 evidence the observations above, representing the velocity vector fields on the zx plane passing through the reactor axis. The detail in the figures comprises the region between the walls of the reactor and the gas deflector (Figure 6 and Figure 11b. It is clearly observed the presence of recirculation zones from the increase in the velocity phase in the smaller diameter section of the deflector, which promotes the drag of the phase between the walls of the reactor and deflector. The water near the wall falls giving origin to recirculation zones. However, these recirculation zones (local disturbances, vortices, and reverse flow indicating local turbulence) are more intense for the solid phase, as can be seen in Figure 8b and Figure 11b.
In regions between gas deflector and three-phase separator, in detail in Figure 6, Figure 7 and Figure 8c, there is a gradual contraction and an abrupt increase of velocity vectors when the three phases flow into the interior of the gas deflector. To the reactor with inclination of the deflector downwards (Figure 9, Figure 10 and Figure 11c), exactly the equal behavior.
For the specific case of the solid phase, considering the different positions of the gas deflector (Figure 8 and Figure 11c), it is observed that when reached the liquid—gas interface (inside the three-phase separator), the velocity vectors change direction and return to the region between the gas deflector and the three-phase separating element, then getting the same direction (upwards) of vectors that intersect them.
Figure 12, Figure 13, Figure 14, Figure 15, Figure 16 and Figure 17 demonstrate that, in most situations evaluated, all the involved phases present different velocity distribution at different axial positions as a function of radial position. The main differences are obtained by comparing the velocity distributions of the liquid and gaseous phases with the solid phase velocity distribution, inside the reactor, for both physical situations: reactor with the deflector inclination upwards and the reactor with the deflector inclination downwards. The smallest differences were obtained between the velocity for the liquid and gas phases, mainly in the sludge blanket region.
The comparison of Figure 12, Figure 13, Figure 14, Figure 15, Figure 16 and Figure 17 indicated the effect of gas deflector inclination (upwards or downwards) on the velocity distribution in the reactor. Figure 12a–c illustrates the distribution of the velocity components according to the radial position in three axial positions (0.36, 0.72 and 1.35 m) arranged in the sludge blanket region with deflector directed upwards. It is noteworthy that, at the axial position z = 1.35 m, the speed profile shows a behavior that approaches the parabolic profile found in tubes. In this same position in the reactor with the deflector inclination downwards (Figure 13a–c), there is, due to the sudden contraction of flow at this position, the formation of two speed peaks and a minimum value at the reactor center. Similar behavior can be verified in Figure 14 (z = 1.65 and 1.98 m) and Figure 16 (z = 2.10 m) corresponding to simulation in the reactor with the deflector inclination upwards, and Figure 15 (z = 1.80 and 1.98 m) and Figure 17 (z = 2.10, 2.80 and 3.50 m) in simulation in the reactor with the deflector inclination downwards.
When comparing the mean values of upward velocities of the continuous and dispersed phases, Figure 12, Figure 13, Figure 14, Figure 15, Figure 16 and Figure 17, for the reactors configurations with deflector inclinations upwards and downwards, except for the three-phase separator region (Figure 16 and Figure 17b), it is found that mean velocities of biogas were equal to mean velocities of water, indicating biogas drag by water. Regarding the sludge, the mean velocity of this phase in the reactor with inclination upwards and at the axial position z = 3.5 m (region of the three-phase separator), was about 10 times less than the mean velocities of water and biogas, which contributes to the sludge return to the digestion zone (sludge blanket zone) and, consequently, to increase the cell retention time and to enhance the efficiency of the sewage treatment process (herein represented by the water, biogas, and sludge mixture).
The increase in the sludge average velocity is attributed to its specific mass (1020 kg/m3) being higher than the water (997 kg/m3) and biogas (0.72 kg/m3), and because the ascending velocities of the liquid phase (Figure 16 and Figure 17) in the settling zone are lower than those observed in the sludge blanket region (Figure 12 and Figure 13), resulting in the establishment of low turbulence conditions. For this reason, the settling velocity of the sludge particles in the settling zone becomes greater than the rising velocity of the liquid. In this way the sludge flakes entrained by the upward flow of liquid and biogas will settle and accumulate at the surface of the phase separation element. Then, by the action of the gravitational force, they will slide and return to the sludge blanket region. As a result, the sludge volumetric fraction changed along the reactor.
The volumetric fractions of the involved phases (water, biogas and sludge) were reported in Lima et al. [26]. According to these authors, the highest sludge concentrations (validated by the experimental results) are in the inlet region (sludge blanket) and on the sloping walls of the three-phase separator and the gas deflector.
On the other hand, in the reactor with deflector inclination downwards also at the axial position z = 3.5 m, the mean velocities of sludge and water remained similar, pointing the drag of sludge by water and its outlet through the top of the reactor, resulting in an increased concentration of solids in the effluent and reduced cell retention time, which is undesirable from a practical point of view.
This approach can be corroborated by the experimental and simulation results reported by Lima et al. [26], who simulated in two-dimensional space, the fluid dynamic behavior of the UASB reactor, the object of this study, and found that the reactor with inclination of the deflector downwards presented much higher concentrations of solids at the outlet the reactor (1729 mg L−1) than those with inclination of the deflector upwards (60.9 mg L−1). According to the authors, this result can be attributed to the large area between the separation devices (gas deflector and three-phase separator). By conducting further simulations of the reactor with deflector inclination downwards, but with reduced spacing between the gas deflector and the three-phase separating element (0.34 m to 0.1 m), Lima et al. [26] registered that the average concentration of solids (sludge) in the reactor outlet was reduced from 1729 mg L−1 to 91.05 mg L−1. We state that the numerical results performed with simulations using meshes in two-dimensional space, as reported by Lima et al. [26], were obtained with significantly reduced computational effort and properly compared with experimental results, with minor differences, an average of 8%. This validation could be extended to the present study, in which the UASB reactor was discretized in three-dimensional mesh, because the results obtained in this study indicated the existence of angular and radial symmetries of velocity distributions inside the reactor. Further, comparison between predicted (3D simulations) and experimental pressure data presented differences in results close to 6% (maximum error).
The analysis of these results allows the observation that despite the values of mean upward velocities of water, biogas and sludge (Figure 12, Figure 13, Figure 14, Figure 15, Figure 16 and Figure 17) at the inlet of the phase separator are below the critical threshold specified by the literature for domestic sewage (1.1 m/h), there was sludge in the reactor outlet. This indicates that although the upward velocities of the sewage, mainly at the inlet of the three-phase separator, exert some influence on the sludge present at the reactor outlet, other factors should be considered, such as the inclination and arrangement of phase separating elements, as stressed by van Haandel and Lettinga [20] and verified in the simulations of Lima et al. [26].
Figure 18 shows pressure distribution along the axial position of the reactor in the three-phase system, for both deflector inclinations: upwards (Figure 18a) and downwards (Figure 18b). The absolute pressure illustrated in this figure corresponds to the sum of the most hydrostatic plus atmospheric pressures, being the hydrostatic pressure the system dominant pressure. However, although the position of the deflectors in the figures is placed in the same depth, which implies the same hydrostatic pressure, they are arranged differently, one with upward inclination and one downward. Thus, in theory, they would have different influence on the fluid dynamics inside the reactor, especially due to the turbulence region caused by the presence of biogas, and, in principle, could change the pressure field in this region. However, the analysis of this figure shows that, for the conditions studied in this research, the position of the deflector does not interfere in the pressure distribution behavior along the reactor.

4. Conclusions

Considering the results obtained in this study, it can be concluded that:
-
The mathematical model used to describe the flow hydrodynamics in the UASB reactor was quite satisfactory, as it adequately reproduced the physical behavior inside the reactor.
-
Recirculation zones (eddies) were observed in the region between the gas deflector and the three-phase separator, as well as next to the walls of the separator, resulting from the increased velocity of the phases in the smaller diameter section of the deflector, associated with the unbalance between the forces of drag, thrust, and weight acting on the particles of gas (bubbles) and sludge. These recirculation zones contributed to the settlement of solid particles inside the gas deflector (inclination upwards). This observation was confirmed by the direct proportional relationship obtained between the mass flow and retention of solids in the UASB reactor.
-
Results obtained with the three-dimensional mesh validated the presence of a radial and angular symmetrical behavior, indicating the possibility of studying the fluid dynamics in the UASB reactor using a two-dimensional mesh.

Author Contributions

1—Conceptualization: M.G.S.L.B., F.C.B.N., F.L.C.M.; 2—Methodology: M.G.S.L.B., F.C.B.N., F.L.C.M.; 3—Software: M.G.S.L.B., F.C.B.N., F.L.C.M; 4—Validation: M.G.S.L.B., F.C.B.N., F.L.C.M; 5—Formal analysis: M.G.S.L.B., F.C.B.N., F.L.C.M.; 6—Investigation: M.G.S.L.B., F.C.B.N., F.L.C.M.; 7—Writing-original draft preparation: M.G.S.L.B., H.L.F.M., W.M.P.B.L.; 8—Writing-review and editing: H.L.F.M., W.M.P.B.L.; 9—Supervision: S.R.F.N., A.G.B.L. All authors have read and agreed to the published version of the manuscript.

Funding

This research was funded by CNPq, CAPES and FINEP (Brazilian Research Agencies).

Acknowledgments

The authors wish to express their gratitude to ACS ENGENHARIA AMBIENTAL for providing the UASB reactor, indispensable for the development of this study, and to funding agencies CNPq, FINEP and PETROBRAS for their support.

Conflicts of Interest

The authors declare no conflict of interest.

References

  1. Yetilmezsoy, K. Integration of kinetic modeling and desirability function approach for multi-objective optimization of UASB reactor treating poultry manure wastewater. Bioresour. Technol. 2012, 118, 89–101. [Google Scholar] [CrossRef]
  2. Dong, F.; Zhao, Q.B.; Zhao, J.B.; Sheng, G.P.; Tang, Y.; Tong, Z.H.; Yu, H.Q.; Li, Y.Y.; Harada, H. Monitoring the restart-up of an upflow anaerobic sludge blanket (UASB) reactor for the treatment of a soybean processing wastewater. Bioresour. Technol. 2010, 101, 1722–1726. [Google Scholar] [CrossRef] [PubMed]
  3. Ren, T.T.; Mu, Y.; Ni, B.J.; Yu, H.Q. Hydrodynamics of upflow anaerobic sludge blanket reactors. AIChE J. 2009, 55, 516–528. [Google Scholar] [CrossRef]
  4. Moawad, A.; Mahmouda, U.F.; El-Khateebb, M.A.; El-Mollaa, E. Coupling of sequencing batch reactor and UASB reactor for domestic wastewater treatment. Desalination 2009, 242, 325–335. [Google Scholar] [CrossRef]
  5. Puyol, D.; Mohedano, A.F.; Sanz, J.L.; Rodríguez, J.J. Comparison of UASB and EGSB performance on the anaerobic biodegradation of 2,4-dichlorophenol. Chemosphere 2009, 76, 1192–1198. [Google Scholar] [CrossRef]
  6. Narnoli, S.K.; Mehrotra, I. Sludge Blanket of UASB Reactor: Mathematical Simulation. Water Res. 1997, 31, 715–726. [Google Scholar] [CrossRef]
  7. Tay, J.H.; Yan, Y.G. Influence of substrate concentration on microbial selection and granulation during start-up of upflow anaerobic sludge blanket reactors. Water Env. 1996, 68, 1140–1150. [Google Scholar] [CrossRef]
  8. Fang, H.H.P.; Chui, H.K.; Li, Y.Y. Microbial Structure and Activity of UASB Granules Treating Different Wastewaters. Water Sci. Technol. 1994, 30, 87–96. [Google Scholar] [CrossRef]
  9. Lettinga, G.; Van Velsen, A.F.; Hobma, S.W.; Zeeuw, W.; Klapwy, A. Use of the upflow sludge blanket (USB) reactor concept for biological wastewater treatment especially for anaerobic treatment. Biotechnol. Bioeng. 1980, 22, 699–734. [Google Scholar] [CrossRef]
  10. Rastegar, S.O.; Mousavi, S.M.; Shojaosadati, S.A.; Sheibani, S. Optimization of petroleum refinery effluent treatment in a UASB reactor using response surface methodology. J. Hazard. Mater. 2011, 197, 26–32. [Google Scholar] [CrossRef]
  11. Li, J.; Hu, B.; Zheng, P.; Mahmood, Q.; Mei, L. Filamentous granular sludge bulking in a laboratory scale UASB reactor. Bioresour. Technol. 2008, 99, 3431–3438. [Google Scholar] [CrossRef]
  12. Pol, L.W.H.; Lopes, S.I.C.; Lettinga, G.; Lens, P.N.L. Anaerobic sludge granulation. Water Res. 2004, 38, 1376–1389. [Google Scholar] [CrossRef]
  13. Bhunia, P.; Ghangrekar, M. Influence of biogas-induced mixing on granulation in UASB reactors. Biochem. Eng. J. 2008, 41, 136–141. [Google Scholar] [CrossRef]
  14. Vlyssides, A.; Barampouti, E.M.; Mai, S. Granulation mechanism of a UASB reactor supplemented with iron. Anaerobe 2008, 14, 275–279. [Google Scholar] [CrossRef]
  15. Tay, J.H.; Xu, H.L.; Teo, K.C. Molecular mechanism of granulation. I: Hþ translocation-dehydration theory. J. Env. Eng. 2000, 126, 403–410. [Google Scholar] [CrossRef]
  16. Vlyssides, A.; Barampouti, E.M.; Mai, S. Influence of ferrous iron on the granularity of a UASB reactor. Chem. Eng. J. 2009, 146, 49–56. [Google Scholar] [CrossRef]
  17. Majumder, P.S.; Gupta, S.K. Degradation of 4-chlorophenol in UASB reactor under methanogenic conditions. Bioresour. Technol. 2008, 99, 4169–4177. [Google Scholar] [CrossRef]
  18. Lauwers, J.; Appels, L.; Thompson, I.P.; Degrève, J.; Van Impe, J.F.; Dewil, R. Mathematical modelling of anaerobic digestion of biomass and waste: Power and limitations. Prog. Energy Combust. Sci. 2013, 39, 383–402. [Google Scholar] [CrossRef] [Green Version]
  19. Chong, S.; Sen, T.K.; Kayaalp, A.; Ang, H.M. The performance enhancements of upflow anaerobic sludge blanket reactors for domestic sludge treatment-A state of the art review. Water Res. 2012, 46, 3434–3470. [Google Scholar] [CrossRef]
  20. Van Haandell, A.C.; Lettinga, G. Anaerobic Sewage Treatment: A Practical Guide for Regions with a Hot Climate; John Wiley and Sons: Chichester, UK, 1994. [Google Scholar]
  21. Isik, M.; Sponza, D.T. Effects of Alkalinity and Co-substrate on the Performance of an Upflow Anaerobic Sludge Blanket (UASB) Reactor Through Decolorization of Congo Red Azo Dye. Bioresour. Technol. 2005, 96, 633–643. [Google Scholar] [CrossRef]
  22. Peña, M.R.; Mara, D.D.; Avella, G.P. Dispersion and performance analysis of an UASB reactor under different hydraulic loading rates. Water Res. 2006, 40, 445–452. [Google Scholar] [CrossRef]
  23. Vieira, S.M.M.; Garcia Jr, A.D. Sewage treatment by UASB-reactor. Operation results and recommendations for design and utilization. Water Sci Technol. 1992, 25, 143–157. [Google Scholar] [CrossRef]
  24. Van Lier, J.B.; Vashi, A.; Lubbe, J.V.D.; Heffernan, B. Anaerobic Sewage Treatment using UASB Reactors: Engineering and Operational Aspects. Environ. Anaerob. Technol. 2010, 59–89. [Google Scholar] [CrossRef] [Green Version]
  25. Lin, K.C.; Yang, Z. Technical review on the UASB process. Int. J. Environ. Stud. 1991, 39, 203–222. [Google Scholar] [CrossRef]
  26. Lima, M.G.S.; Neto, S.R.F.; Lima, A.G.B.; Nunes, F.C.B.; Gomes, L.A. Theoretical/Experimental Study of an Upflow Anaerobic Sludge Blanket Reactor Treating Domestic Wastewater. Int. J. Chem. React. Eng. 2011, 9, 1–24. [Google Scholar] [CrossRef]
  27. Ishii, M.; Zuber, N. Drag coefficient and relative velocity in bubbly, droplet and particulate flow. AlChE J. 1979, 25, 834–854. [Google Scholar] [CrossRef]
  28. Schiller, L.; Naumann, Z. Über die grundlegenden Berechungen bei der Schwerkraftbereitung. Z. Ver. Dtsch. Inglaterra. 1933, 77, 318. [Google Scholar]
  29. Campos, J.R. Sanitary Sewage Treatment by Anaerobic Process. and Controlled Soil Disposal; PROSAB: Rio de Janeiro, Brasil, 1999. (In Portuguese)
  30. Manual CFX 10.0; Ansys: Harwell, UK, 2005.
Figure 1. Geometric illustration of meshes in three-dimensional space: (a) inclination of the deflector upwards and (b) inclination of the deflector downwards.
Water 12 00279 g001
Figure 2. Mesh representation with deflector inclination upwards: (a) overview, (b) plan yz, (c) inlet (z = 0 m), (d) biogas outlet (z = 2.29 m), and (e) output of sludge and biogas (z = 3.58 m).
Water 12 00279 g002
Figure 3. Mesh representation with deflector inclination downwards: (a) overview, (b) plan yz, (c) inlet (z = 0 m), (d) biogas outlet (z = 2.29 m), and (e) output of sludge and biogas (z = 3.58 m).
Water 12 00279 g003
Figure 4. Velocity field in the UASB reactor, with deflector inclination upwards, for phases: (a) water, (b) biogas, and (c) sludge.
Water 12 00279 g004
Figure 5. Velocity field in the UASB reactor, with deflector inclination downwards, for phases: (a) water, (b) biogas, and (c) sludge.
Water 12 00279 g005
Figure 6. Water velocity vector in the reactor with deflector inclination upwards: (a) overview, (b) detail of the region between the gas deflector and the three-phase separating element, and (c) detail of the region corresponding to the settling zone.
Water 12 00279 g006
Figure 7. Biogas velocity vector in the reactor with deflector inclination upwards: (a) overview, (b) detail of the region between the gas deflector and the three-phase separating element, and (c) detail of the region corresponding to the settling zone.
Water 12 00279 g007
Figure 8. Sludge velocity vector in the reactor with deflector inclination upwards: (a) overview, (b) detail of the region between the gas deflector and the three-phase separating element, and (c) detail of the region corresponding to the settling zone.
Water 12 00279 g008
Figure 9. Water velocity vector in the reactor with deflector inclination downwards: (a) overview, (b) detail of the region between the gas deflector and the three-phase separating element, and (c) detail of the region corresponding to the settling zone.
Water 12 00279 g009
Figure 10. Biogas velocity vector in the reactor with deflector inclination downwards: (a) overview, (b) detail of the region between the gas deflector and the three-phase separating element, and (c) detail of the region corresponding to the settling zone.
Water 12 00279 g010
Figure 11. Sludge velocity vector in the reactor with deflector inclination downwards: (a) overview, (b) detail of the region between the gas deflector and the three-phase separating element, and (c) detail of the region corresponding to the settling zone.
Water 12 00279 g011
Figure 12. Distribution of the resulting velocity according to the radial position for different axial positions, z, on the sludge blanket region (upward inclination of the deflector): (a) water, (b) biogas, and (c) sludge.
Water 12 00279 g012
Figure 13. Distribution of the resulting velocity according to the radial position for different axial positions, z, on the sludge blanket region (downward inclination of the deflector): (a) water, (b) biogas, and (c) sludge.
Water 12 00279 g013
Figure 14. Distribution of the resulting velocity according to the radial position for different axial positions, z, on the region between the deflector and three-phase separator (upward inclination of the deflector): (a) water, (b) biogas, and (c) sludge.
Water 12 00279 g014
Figure 15. Distribution of the resulting velocity according to the radial position for different axial positions, z, on the region between the deflector and three-phase separator (downward inclination of the deflector): (a) water, (b) biogas, and (c) sludge.
Water 12 00279 g015
Figure 16. Distribution of the resulting velocity according to the radial position for different axial positions, z, on the three-phase separating region (upward inclination of the deflector): (a) water, (b) biogas, and (c) sludge.
Water 12 00279 g016
Figure 17. Distribution of the resulting velocity according to the radial position for different axial positions, z, on the three-phase separating region (downward inclination of the deflector): (a) water, (b) biogas, and (c) sludge.
Water 12 00279 g017
Figure 18. Pressure field inside the UASB reactor, considering the three-phase system: (a) deflection inclination upwards (b) deflection inclination downwards.
Water 12 00279 g018
Table 1. Boundary conditions specified on the field of study.
LocationValue
Reactor inlet U z = 1.0403 × 10 4   m / s * U x = U y = 0
Reactor walls U x = U y = U z = 0
Outlet (reactor top)Static pressure: 98,000 Pa
* Determined from the mean values of volumetric flow rates obtained experimentally.
Table 2. Physical properties of the phases.
PropertyContinuous Phase (Liquid)Dispersed Phase (Biogas)Dispersed Phase (Solid)
Density, ρ (kg.m−3)9970.721020
Dynamics viscosity, μ (Pa.s) 8.899 × 10 4   1.114 × 10 5 1.295 × 10 4
Particle diameter, dβ (m)-0.003 *0.003 **
Surface tension, σ, (N.m-1)0.072-
* According to Narnoli and Mehrotra [6], the average diameter of the bubbles leaving the bed of a UASB reactor is 3 mm (variation range 1 to 4 mm). ** Campos [29] assumes that the average diameter of the bubbles has a range from 1 to 5 mm. Pol et al. [12] reports values solid particle diameter ranging from 0.4 to 4 mm.

