Evaluation of Lamella Settlers for Treating Suspended Sediment


1
Department of Civil and Environmental Engineering, Auburn University, Auburn, AL 36849, USA
2
School of Concrete and Construction Management, Middle Tennessee State University, Murfreesboro, TN 37132, USA
*
Author to whom correspondence should be addressed.
Water 2020, 12(10), 2705; https://0-doi-org.brum.beds.ac.uk/10.3390/w12102705
Submission received: 8 September 2020
/
Revised: 22 September 2020
/
Accepted: 24 September 2020
/
Published: 27 September 2020
(This article belongs to the Special Issue Hydrologic and Water Quality Performance of Stormwater Best Management Practices)
Abstract
:Stormwater quality management has become an increasingly important topic. Pollutants from construction, urban, and agricultural runoff sources create adverse water quality impacts to receiving water bodies. Among these sources, suspended sediment has a significant influence on water quality and further acts as a media for transporting pollutants. Current stormwater treatment practices remove large, rapidly settable, soil particles; however, fine soil particles tend to remain suspended and contribute to elevated turbidity conditions. A need exists for an economical and passive treatment mechanism for the removal of suspended solids. Lamella settlers have been shown to enhance soil particle capture by increasing surface area and reducing settling distance. The objective of this research was to identify and optimize design configurations for a lamella settler system in treating a variety of synthetic soils. Five types of synthetic soils suspended in simulated stormwater at 500, 1000, and 5000 mg/L concentration were treated using system configurations of three lamella settler reactors at 0.5, 1.0, and 1.5-h residence times. Statistical analyses through a full factorial method followed with a regression analysis and analysis of variance (ANOVA) test suggested that there was a significant difference exists between these experimental variables and turbidity levels. An optimized lamella settler reactor providing 1.8 cm (0.7 in.) settling space with 1.5-h residence time reduced turbidity by up to 90% when compared to a control reactor without lamella plates and a 0.5-h residence time. In addition, particle size distribution analysis indicated a decrease in the D90 by up to 84%, which showed that the optimized reactor was effective in capturing larger diameter soil particles.
1. Introduction
Stormwater quality has become an increasingly important topic across the agricultural, urban, and construction sectors [1]. Construction sites, in particular, have the potential to create the greatest sources of sediment pollutants that can have profound impacts on the downstream environment [2]. Compared to other land uses, construction operations produce a large amount of sediment yield due to earth disturbing activities. In addition to sediment, pollutants carried by soil particles (i.e., nutrients, heavy metals, petrochemicals, etc.) create adverse water quality impacts to downstream receiving water bodies [3]. Sediment-laden stormwater runoff can contribute to turbidity plumes, which impact biological structure, ecological functions, and biotic diversity [4,5]. To minimize these impacts, stormwater is managed through the use of passive “best management practices” (BMPs). For example, urban stormwater may be managed by detention basins, bioretention cells, and enhanced swales; agricultural stormwater is treated through bioreactors, saturated buffers, and constructed wetlands; and construction sites rely on a suite of erosion and sediment control practices to prevent soil loss and capture eroded soil particles [6]. While performance-based research has proven the effectiveness of sediment capture for many stormwater BMPs, fine-grained soil particles (i.e., clay and silt with particle sizes <0.05 mm [0.002 in.]) are challenging to capture with current practices. To capture these fine-grained particles and reduce runoff turbidity, stormwater practices rely primarily on the use of extended detention. Extended detention refers to the process of retaining sediment-laden stormwater to allow fine soil sedimentation to occur prior to offsite discharge. Sediment basins are often used to provide extended detention, which can often require days or weeks to provide sufficient residence time for microscopic grain particles to settle out of suspension [7].
In construction and post-construction applications, chemical-based flocculants are often used with detention-based practices (e.g., sediment basins, sediment traps, detention basins, etc.) to increase sedimentation rates by inducing inter-particle attraction through Brownian motion assisted by turbulent mixing and self-settling [8]. When used in conjunction with extended detention, flocculants can be highly effective in reducing turbidity and total suspended solids (TSS) [9]. In construction applications, on-site contractors rely primarily on passive dosing of flocculants through a variety of forms, such as: powders, blocks, and socks. These forms are designed to facilitate flocculant dosing as runoff passes by them, causing dissolution. Regular maintenance is required to keep blocks and socks from over-drying and silting over, which reduce dosing capabilities. Furthermore, the use of powder flocculant requires reapplication following rain events. The effective use of flocculants at field-scale is challenging for several reasons. To begin with, some flocculants are soil-specific and require soil testing [9]. While soils vary regionally, soil types can also vary greatly across a site. Soil samples used to test for optimum flocculant type and dosage rate may not be a uniform representation of the soil variations across the site, which often results in ineffective use of a flocculant type and/or dosage rate [10]. For proper contact, dosing of flocculants requires flowing water with a moderate velocity and agitation. In addition, U.S. Environmental Protection Agency (US EPA) regulations require that a sediment control practice, such as a sediment basin, be used downstream to capture flocculated material and prevent resuspension [11].
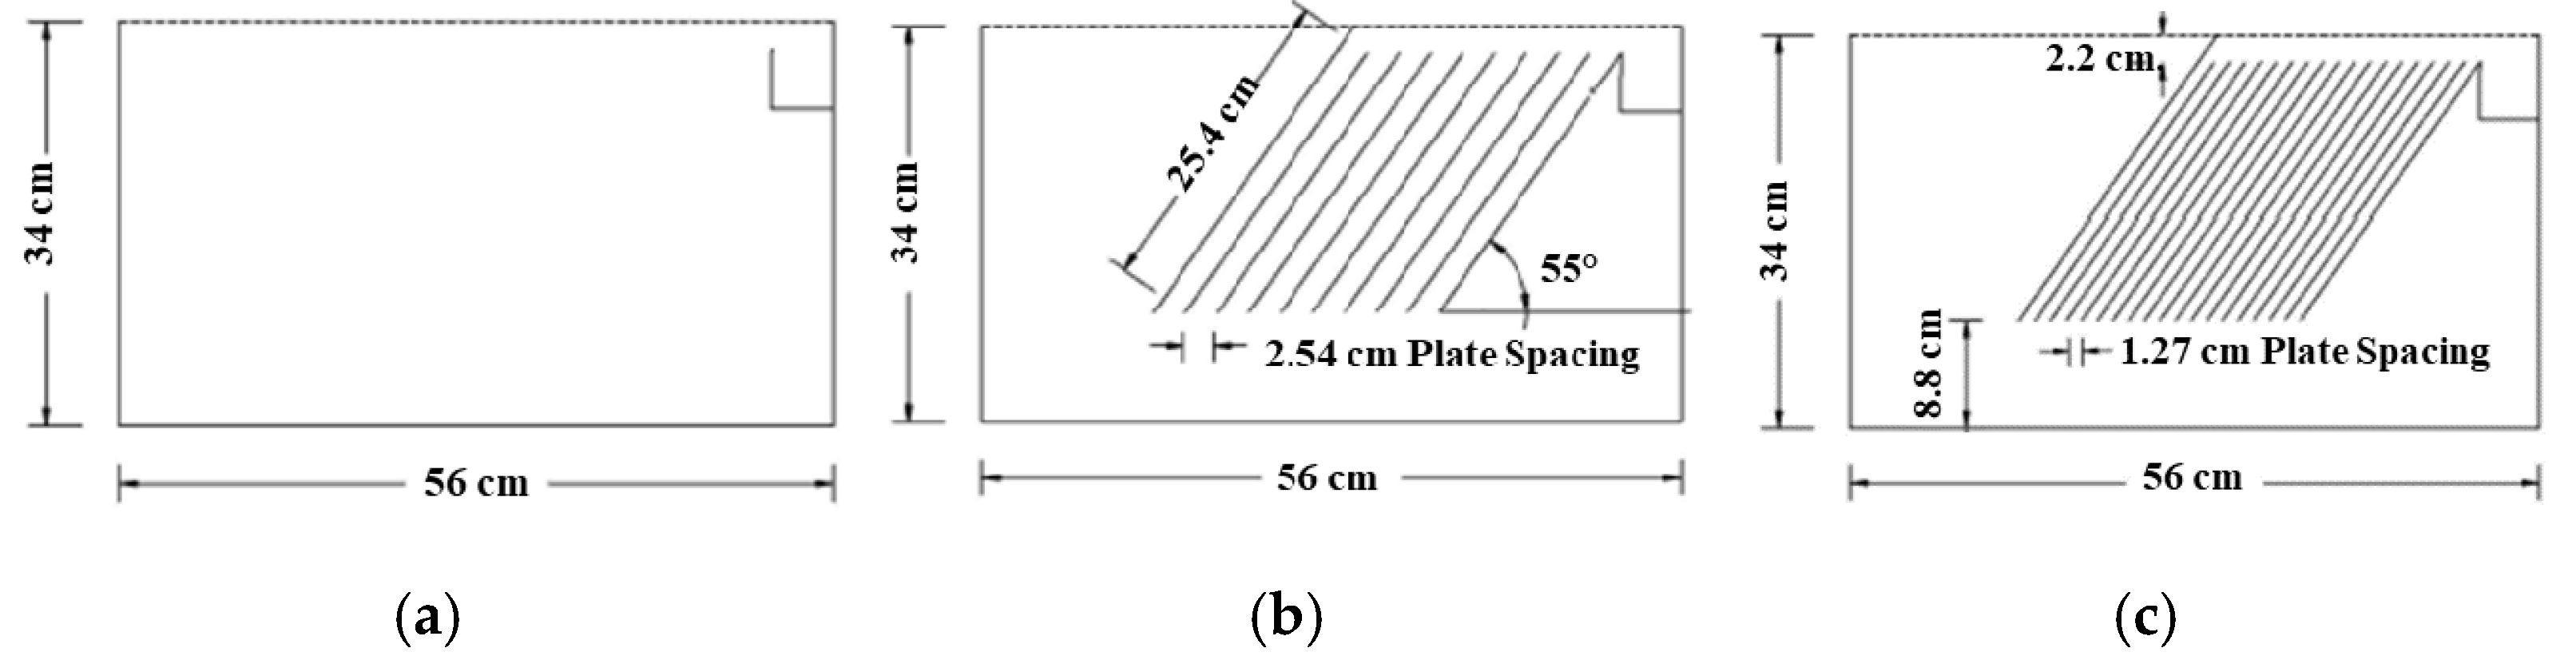
The challenges associated with the use of flocculants on construction sites provide an opportunity for innovative passive systems that can be used to provide similar treatment without the use of chemicals. Lamella settlers are one potential technology that can improve sediment capture efficiency by modifying the geometry of a settling chamber. These systems are passive treatment mechanisms traditionally used in wastewater and industrial water treatment applications which consist of a series of inclined parallels that provide increased surface contact area for promoting settling area for suspended solids [12]. As shown in Figure 1, when lamella settlers are used for stormwater treatment, narrow spacing between parallels decrease vertical sedimentation distance while also reducing flow velocity. The parallel plate system creates laminar flow, by directing flow between the plates where suspended solids settle from water [13]. To study the efficiency of lamella settlers, soil turbidity, TSS, and soil grain size distribution were measured and analyzed by researchers [8,14]. Turbidity and total suspended solids (TSS) are general parameters used to assess water quality. Turbidity is a measure of the amount of light that can pass through a water sample, which is an indicator for water clarity. The lower the turbidity, the less particulates are associated with the sample. TSS is the measurement of mass per unit volume (mg/L) of suspended material in a sample and is determined by removing all water through filtration and evaporation.
Recent large-scale testing research of high rate lamella settlers suggested that they could be an effective approach to treat construction site stormwater runoff, improving sediment capture by up to 33% when compared to traditional sediment basin designs [15]. In addition, research has proved that surface area determines the sedimentation performance in lamella settlers [13]. A recent study conducted by Nguyen et al. (2019) suggested that definitive relationships among treatment efficiency design factors have yet to be identified for treatment systems such as these. Thus, additional research is needed to identify design factors influencing sediment capture efficiency.
Many design factors (e.g., wetted surface area, settling distance, influent concentration, residence time, flow rate, etc.) can influence the performance of lamella settlers. The purpose of this research effort was to analyze sediment capture capabilities of various lamella system design configurations using bench-scale lamella reactors. This research sought to bridge the gap between theoretical knowledge and the practical application of lamella settlers by conducting experiments to determine the settling performance across several design factors. A Full-Factorial Method (FFM) statistical analysis was conducted to estimate influence of different design factors (e.g., sediment concentration, particle settling distance, and residence time) on efficiency of evaluated treatments. The design factors were independent variables used for analysis, and the calculated turbidity reduction rates between influent and effluent water samples were dependent variables. Ultimately, results obtained from this research effort provide design guidance for developing field-scale lamella systems to treat polluted stormwater runoff.
2. Materials and Methods
2.1. Lamella Settler Design
As shown in Figure 1, three reactor tanks were designed and constructed for this study: RA: control reactor, without lamella plates, RB: 9 lamella plates at 2.5 cm (1.0 in.) spacing, and RC: 18 lamella plates with 1.3 cm (0.5 in.) spacing. The settling distance, or the vertical distance between plates, were 34.3 cm (13.5 in.), 3.6 cm (1.4 in.), and 1.8 cm (0.7 in.), for RA, RB, and RC, respectively. RA, the control reactor, was run to provide a direct comparison of performance. These tempered glass reactor tanks measured 56 cm (22.0 in.) × 32 cm (12.5 in.) × 34 cm (13.5 in.) (length × width × height). Each reactor was outfitted with a rectangular weir with three 0.43 cm (0.17 in.) diameter orifices to discharge water from the surface of the tanks. The control reactor tank had no plates inserted and was treated as a base comparison by simply providing detention in an open reactor. RB and RC contained acrylic sheets that were 25 cm (9.8 in.) wide by 25.4 cm (10 in.) long and installed at a 55° angle. Plate dimensions were selected to tightly fit within the tank, forcing water to flow through the inclined plates, while avoiding short-circuiting through the sides of the reactor. These acrylic plates were situated 8.8 cm (3.5 in.) from the base of the reactor and the plate angle was determined based on optimized industrial water treatment designs for lamella settlers [4].
2.2. Sample Preparation and Flow Introduction
Lamella settlers are intended to improve the settling efficiency of fine-grain particles by decreasing settling distance. Thus, the focus of the evaluations was on fine clay and silt sized particles that are difficult to remove from suspended surface runoff. Five different synthetic soils were selected based on their small grain size diameters, which correlate closely with naturally occurring silt and clay particles. Synthetic soils were selected due to homogeneity and uniformity in material that would minimize inter-batch discrepancies. With the exception of Soil E and Soil F, all soil information was obtained through manufacturer’s technical data sheets [16,17,18]. Soil A was Imsil® A25 (25.0% clay, 75.0% silt), a microcrystalline silica filler produced from a natural alpha quartz with a density of 2.65 g/cm3 (165.4 lb/ft3). Soil B, SNOBRITE® S75 (19% clay, 81% silt) and Soil C, SNOBRITE® S60 (19% clay, 80% silt, 1% sand), were white extender pigment produced from air floated intermediate kaolin, each with a density of 2.77 g/cm3 (172.9 lb/ft3). Soil D, MINEX® M4 (10% clay, 90% silt), is produced for use as a filler by from nepheline syenite, a natural sodium potassium alumina silicate, an igneous rock (combination of nepheline, microcline, albite, and minor minerals such as mica, hornblende and magnetite). The density of Soil D was 2.60 g/cm3 (162.3 lb/ft3). Soil E and F, Kaolin, primarily consists of mineral kaolinite (Al2[OH]4Si2O5) with a density of 2.65 g/cm3 (165.4 lb/ft3). The mineral kaolinite (hydrous aluminum silicate) forms from feldspar or other aluminum silicate under chemical weathering. Preliminary pilot tests indicated that Soil E was difficult to uniformly suspend in solution due to its natural tendency to coagulate and flocculate. Solutions prepared through rapid mixing provided inconsistent turbidity measurements. To overcome this limitation with Soil E, a deflocculant agent was added by applying sodium hexametaphosphate prior to suspending in water. Deflocculation is a technique widely applied for soil particle size analysis. Following ASTM D6913/D6913M standard method, 40 mg/L of sodium hexametaphosphate was prepared with distilled water [19]. Soil E was submerged in the prepared solution for 12 h. The results of deflocculation are shown through the departed spacing of kaolinite particles in the microscopy observations. The treated kaolinite soil is referred as Soil F. Comparing to other soil samples, Soil A had the largest fraction of clay, which was expected to result in the lowest turbidity removal compared to other soils under same treatments. To calculate the particle settling velocities, the median grain sizes and shape factors for the tested samples were used as shown in Table 1.
Performance of the lamella settler reactors was evaluated across three suspended soil concentrations (500 mg/L, 1000 mg/L and 5000 mg/L) of simulated runoff. Field monitoring of erosion and sediment control practices has shown that TSS levels in treated construction site stormwater runoff are often around or below 1000 mg/L [20,21]. For this study, two concentrations including 500 mg/L and 5000 mg/L were selected to simulate a low and high range in sediment concentration and can be correlated to construction site stormwater runoff upstream and downstream of a sediment basin.
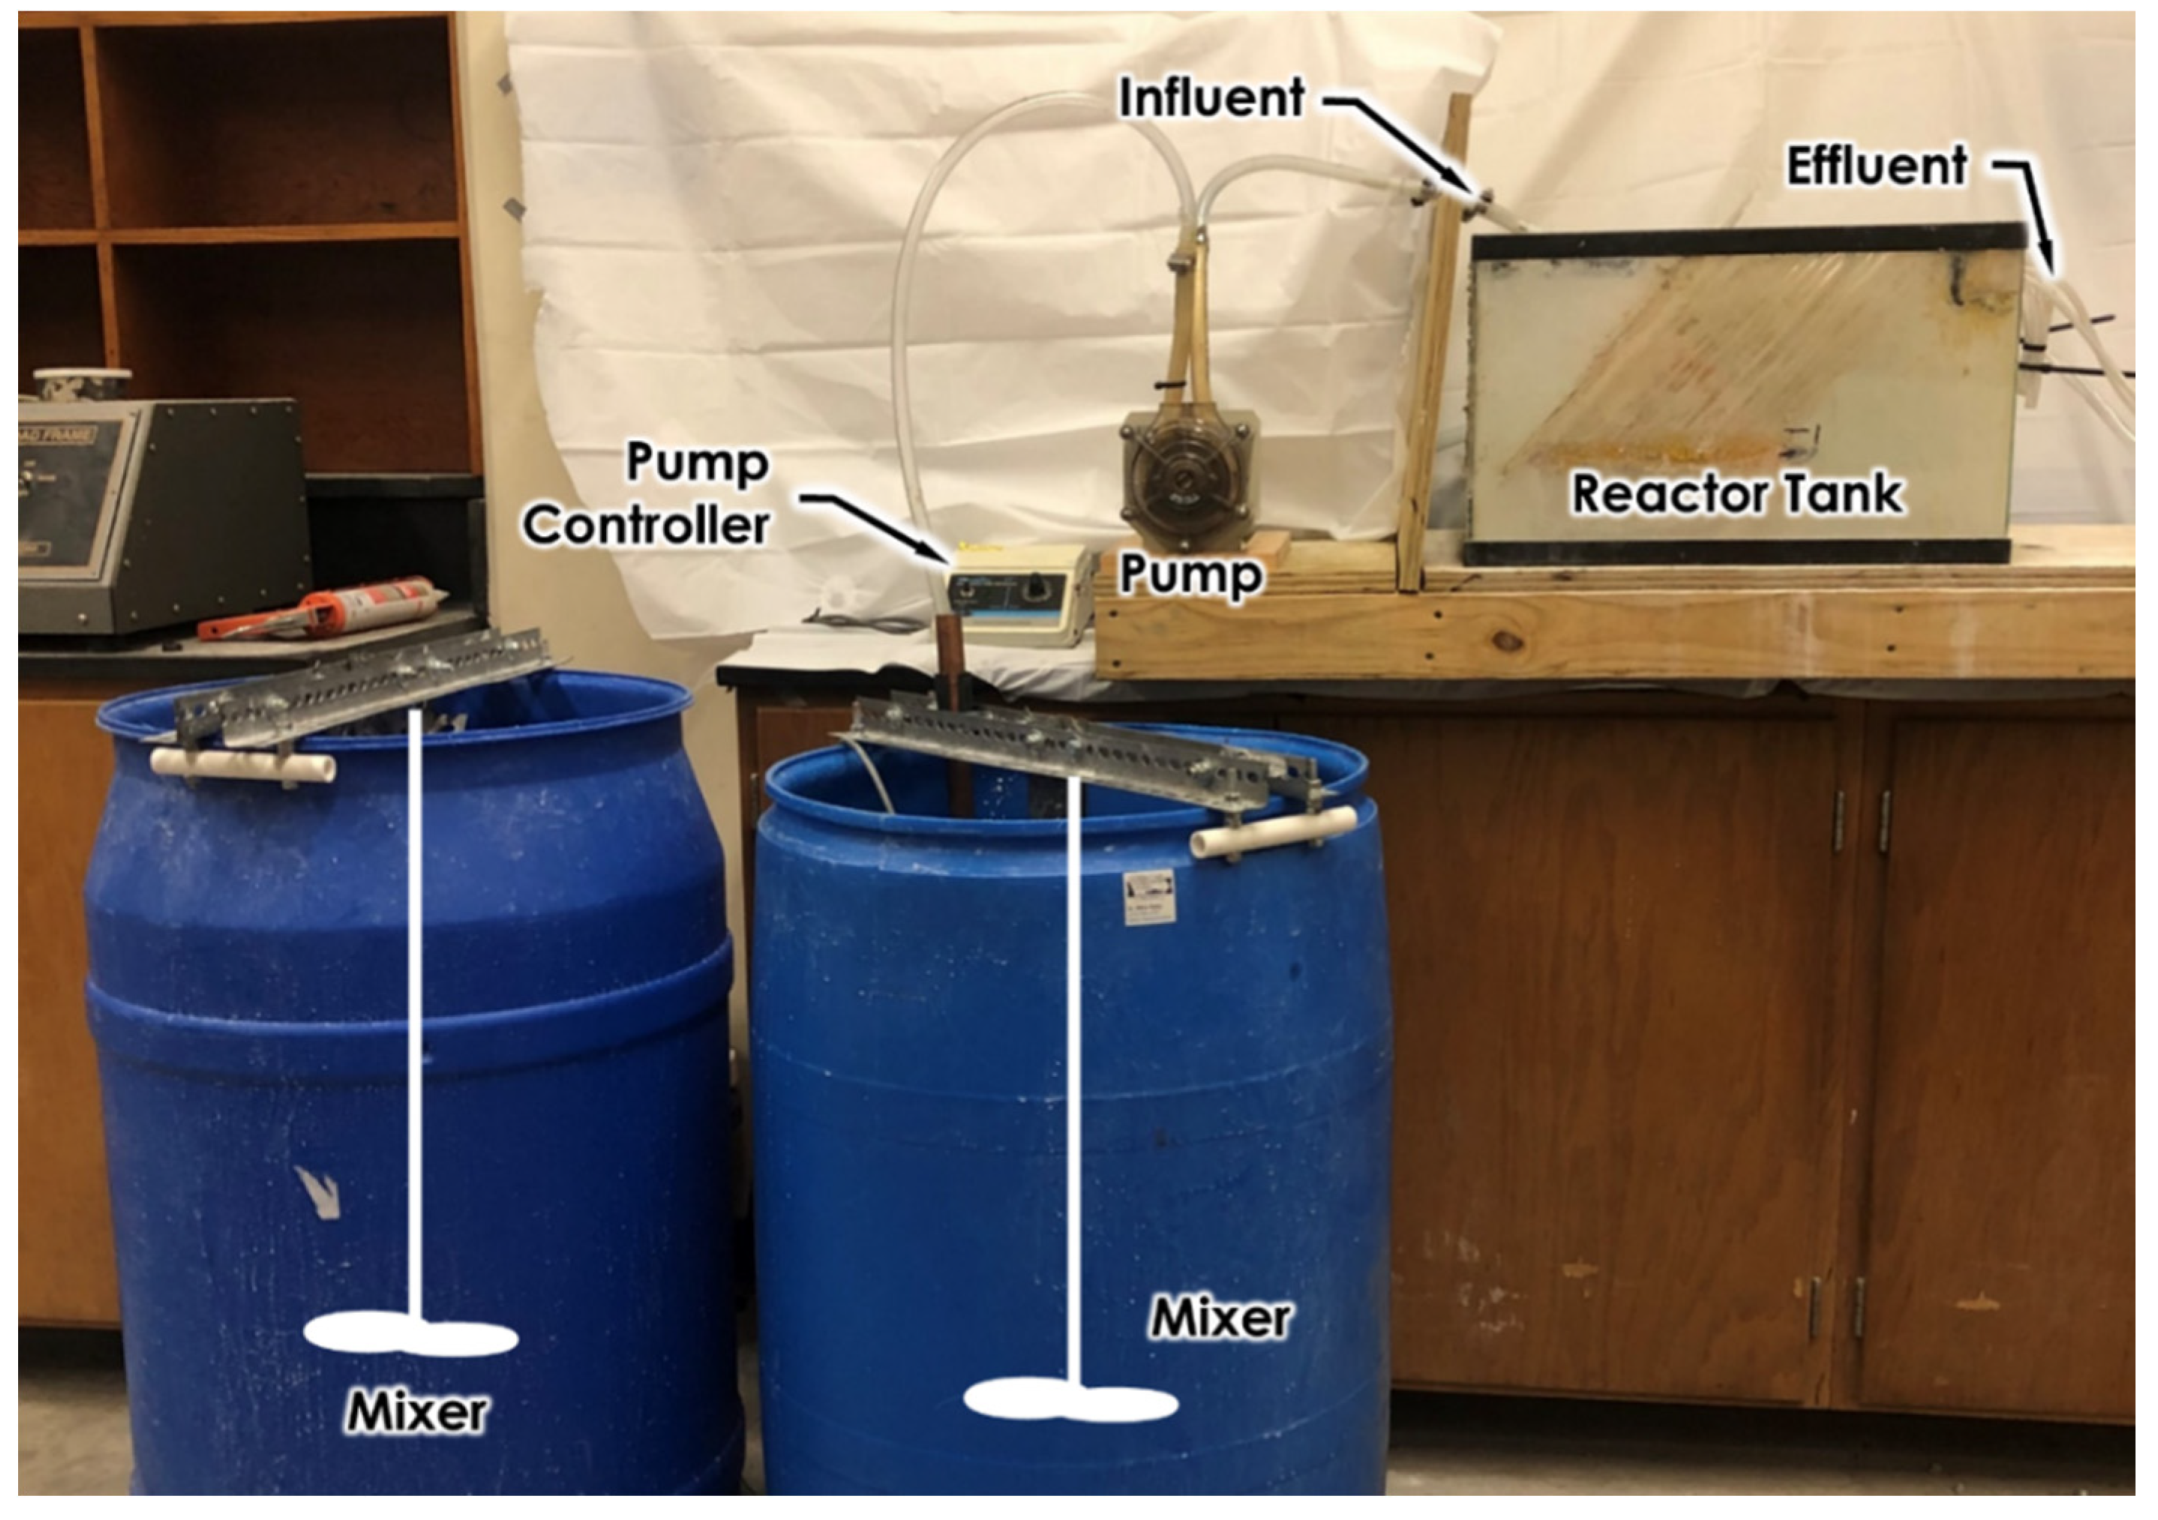
Experiments were designed to introduce simulated sediment-laden stormwater at the inflow of the reactors. The experimental testing setup is shown in Figure 2. The introduced flow was controlled to achieve one of three desired residence time: 1.5 h–0.42 L/min (0.11 gal/min), 1.0 h–0.64 L/min (0.17 gal/min), and 0.5 h–1.25 L/min (0.33 gal/min). A ColeParmer® pump drive (model 7591-50 (Cole-Parmer, Vernon Hills, IL, USA) and a MasterFlex® pump controller (Cole-Parmer®, Vernon Hills, IL, USA) were used to transfer solutions from mixing drums to reactor tanks. Sediment-laden stormwater was prepared in two inter-connected 208 L (55 gal.) drums by mixing synthetic soil with 132 L (35 gal.) of room-temperature tap water at a ratio equal to the target concentration (i.e., 500 mg/L, 1000 mg/L, and 5000 mg/L) in each drum. To achieve a homogenous concentration, mixing was provided by 7.6 cm (3 in.) right-handed propeller fitted motors (Eastern Instruments®, Wilmington, NC, USA, Model 5VB-C) in each drum with power levels maintained at mid-range for a period of 20 min prior to introducing the sample solution into the reactors. The mixers remained in use throughout the duration of the experiments to maintain uniform sediment suspension. These mixers were attached to the top of each drum with custom-built mounts.
2.3. Turbidity Analysis
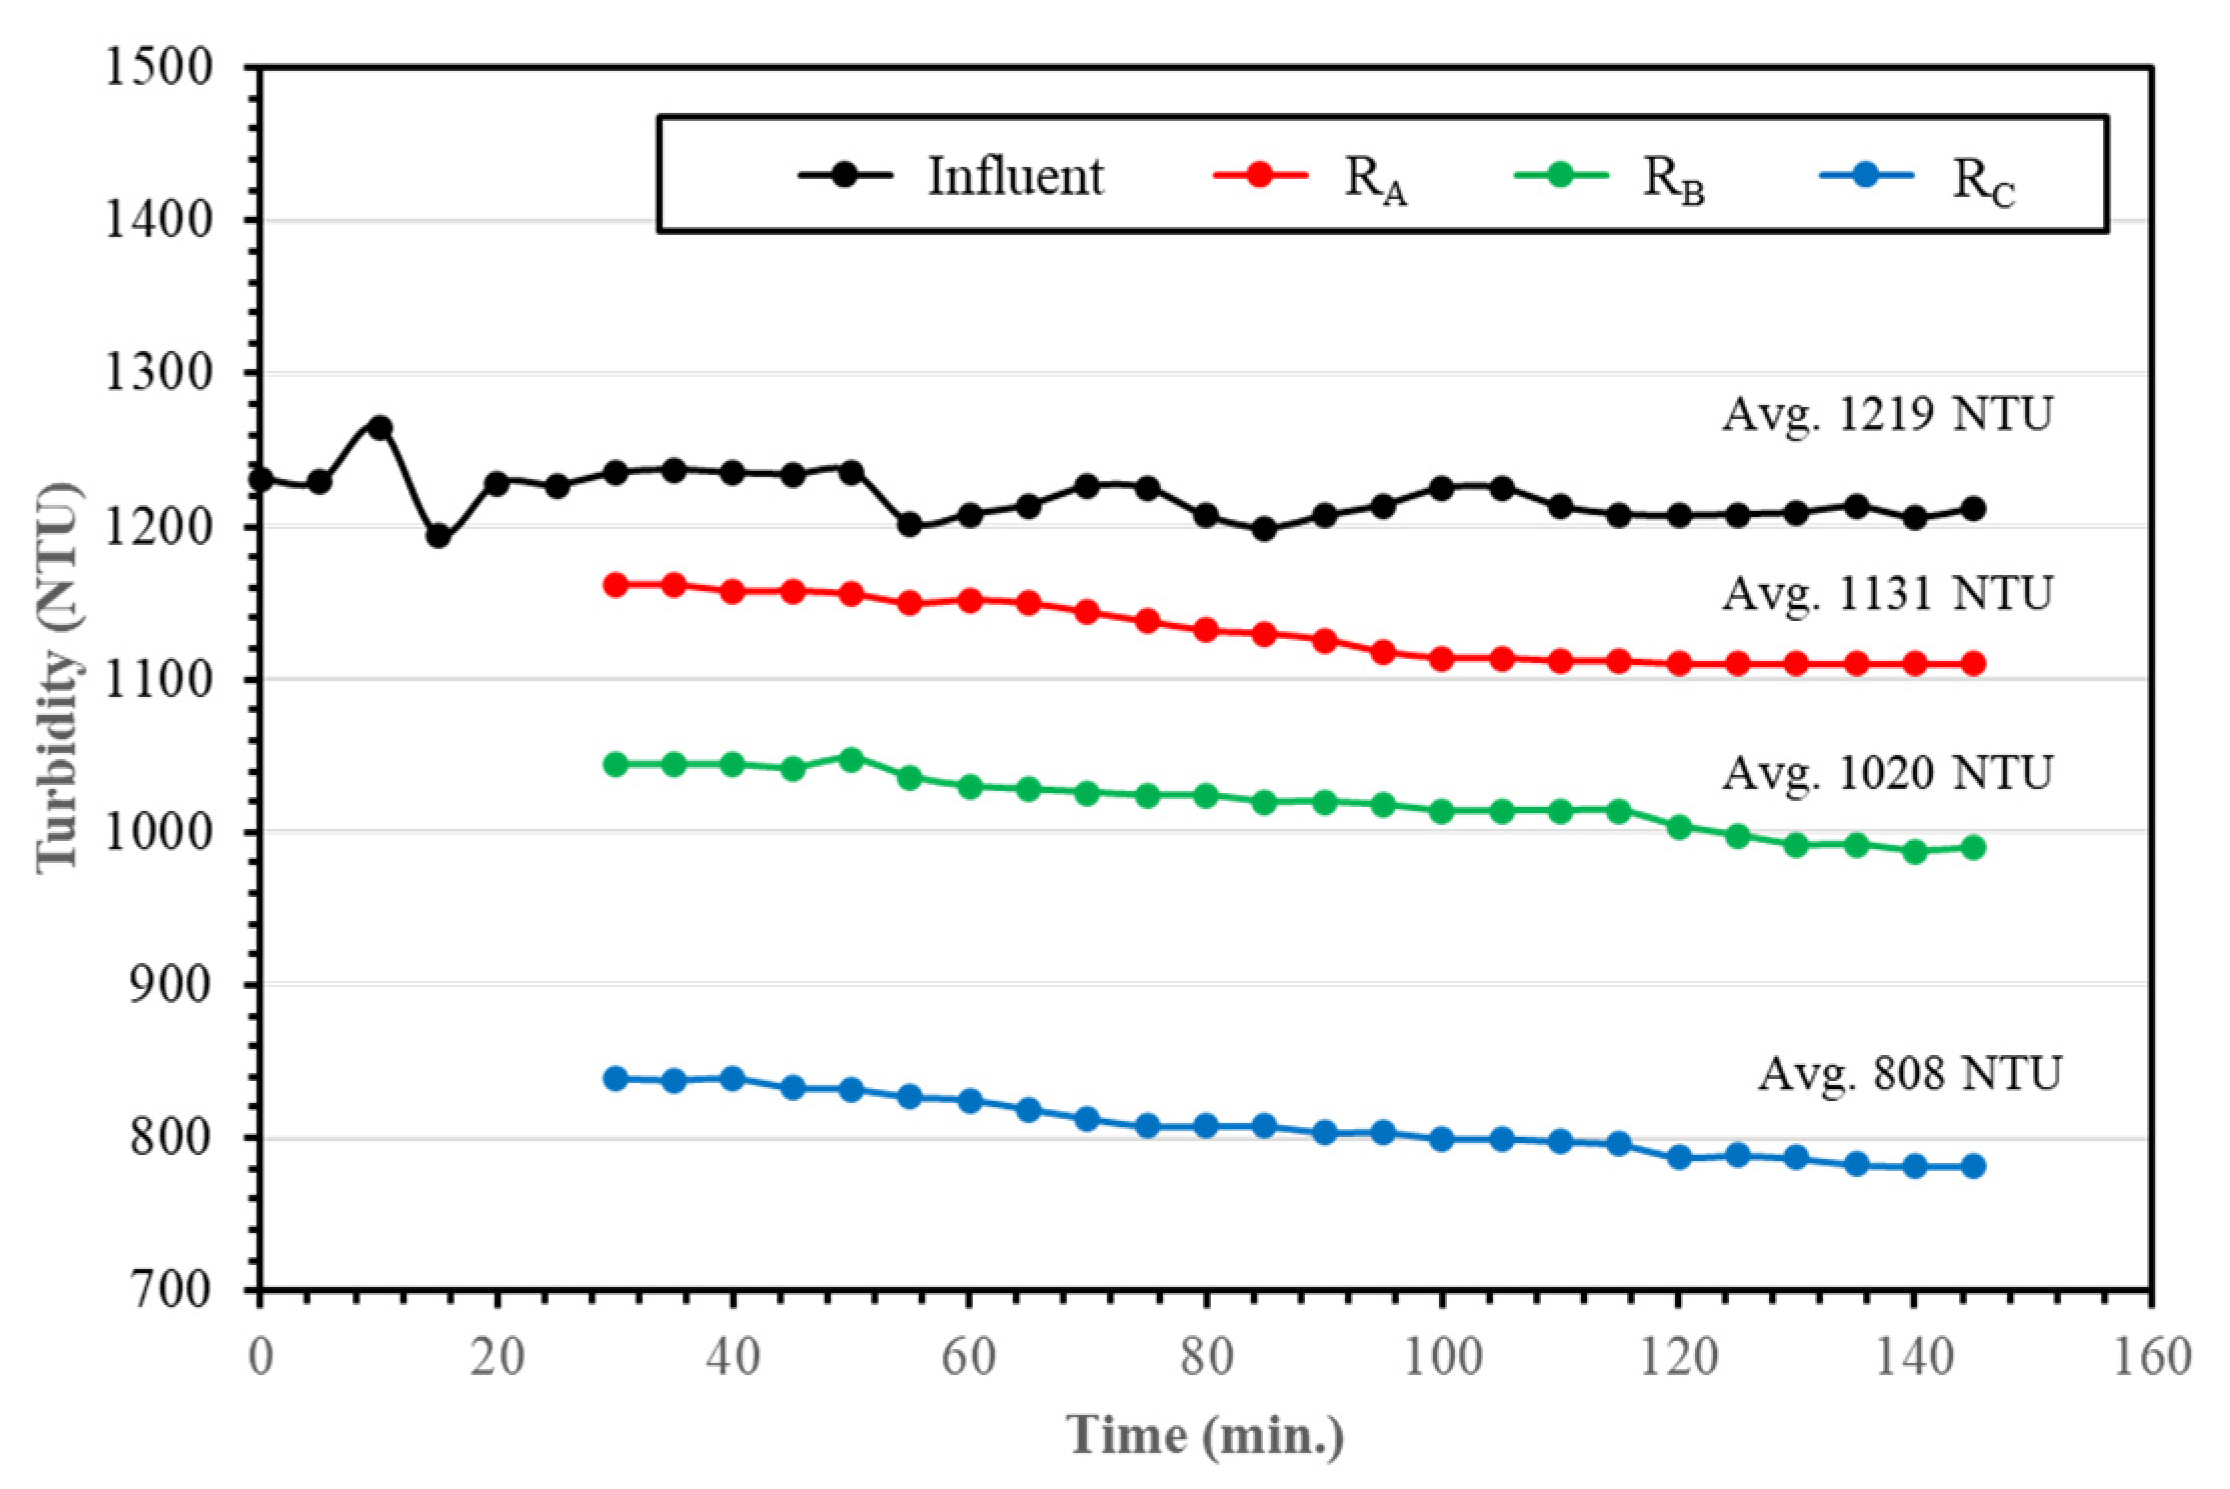
Manual grab samples were taken at the surface of the reactor’s inflow and outflow at 5 min intervals throughout experiments. Turbidity was selected as a measure of performance due to the ease and consistency in the measurement. The turbidity measurements are defined by using the Nephelometric Turbidity Units (NTU). Inflow and outflow water quality samples were measured using a Hach® 2100Q turbidimeter (HACH®, Loveland, CO, USA). Figure 3 depicts data from one experiment (Soil A, 1000 mg/L concentration, 30 min residence time) to demonstrate data collection and analysis. Collected data were used to determine the average inflow and outflow turbidity rates throughout the experiment. The system’s efficiency was determined by applying Equation (1):
where is the inflow turbidity, and is the discharge turbidity. The greater the turbidity reduction, the more efficient the system. The treatment efficiencies for the example demonstrated in Figure 3 are: 7% for RA, 16% for RB, and 34% for RC.
To statistically evaluate the degree of effectiveness of each experimental variable, statistical analysis using the full factorial method (FFM) was conducted to identify mathematical relationship [22]. This method was performed by developing scatter plots for evaluated variables. These scatter plots were used to generate the trendlines to explain relationship in patterns with the turbidity reduction rates. Through the results of the FFM, a proposed factorial model was generated and solved by a multiple regression analysis, from which a lamella settler design recommendation will be produced considering different inflow concentration, particle’s settling distance, and residence time. The regression test was conducted for all evaluated soils by using the averaged turbidity measurements, corresponded sample concentration, settling distance, and residence time. Each considered factor was treated as categorical variable in the regression analysis. In addition, ANOVA test was performed to test the null hypothesis of the study which was that there was no significant difference among turbidity reduction rates, inflow concentration, particle’s settling distance, and residence time. When the results of p-values were lower than 0.05, the null hypothesis was rejected which indicated there is a significant difference exists between design factors and turbidity changes at a 95% confidence level.
2.4. Particle Size Distribution (PSD) Analysis
PSD analysis was conducted on samples obtained from 5000 mg/L samples using a laser spectrometer (Mastersizer® 3000, Malvern PANalytical, Worcestershire, UK). The laser spectrometer is capable of measuring PSDs from 10 nm (3.94 × 10⁻⁷ in.) to 3.5 mm (0.14 in.) through laser diffraction technique. This technique uses static light scattering to measure a volume weighted distribution. PSD analysis allowed for the comparison of grain size distribution between inflow and outflow samples. Results from this analysis displayed differences between the D10, D60, and D90, where Dx is the x% finer diameter found through the size distribution curve. Soil F samples were excluded form PSD analysis due to the use of deflocculant. The results of PSD experiments were used to compare the results of turbidity measurements and describe the sediment treatment efficiencies of different lamella settlers.
2.5. Settling Velocity Calculation
The settling time of suspended particles can be modeled through Stokes’ law, where the settling time is a function of a particle’s size, specific gravity, and distance to settling surface. This method has been widely applied to calculate particle settling velocities in wastewater treatment processes [23,24,25]. Determination of Stoke’s settling velocity is shown in Equation (2).
where, ws is settling velocity, g is gravitational acceleration, d is particle diameter, ρp is particle density, ρw is water density, and µ is dynamic fluid viscosity.
Stokes’ law is limited as it assumes unhindered settling conditions of uniformly sized perfectly spherical particles. The synthetic soils used in this study were mostly in angular shapes. To address this inconsistency in particle shape, Equation (3) was developed and introduced to calculate the settling velocity more precisely considering gravity acceleration [26]. In Equation (3) the particle density is equal to specific gravity multiplied water density, 1 g/cm3 (0.01 lbs/gal), which means the values of specific gravity and particle density are equal.
where S is specific gravity, Cm is shape factor, ws is settling velocity, t is settling time, FD is frictional force, ρp is particle density, Vs is volume of sample.
Equation (4) can be used to determine settling velocity of different soil samples. Settling velocity was estimated by considering a complete version of force balance without ignoring sample gravity acceleration and inconsistent particle shape. The settling time of a soil particle needed in alternative lamella settler designs can be calculated by integrating the settling velocity equation as shown in Equation (5). The results of calculated settling velocities and settling time for different samples can be used to compare with turbidity reductions in the same treatment to determine the model accuracy.
where L is vertical settling distance. The settling time and velocity calculated with consideration of mass balance were used to estimate settling process throughout the system.
3. Results
3.1. Turbidity Reduction
The objective of these experiments was to determine the rate of turbidity reduction as flow passed through the reactors. It was found that turbidity reduction efficiency can be improved when using decreased settling space, increased residence times, or increased inflow sample concentrations as shown in Table 2. The minimum and maximum turbidity reduction rates are shown in bold in Table 2 to highlight the system improvement by modified design parameters. It was found that the averaged turbidity removal rates at the outflow increased from 10.1% in RA to 81.7% in RC with the longest residence time (1.5 h), where 5859 NTU to 1219 NTU (79.2%) for Soil A, 5610 NTU to 756 NTU (86.5%) for Soil B, 3748 NTU to 377 NTU (89.9%) for Soil C, 2509 NTU to 250 NTU (90.0%) for Soil D, and 4515 NTU to 1678 NTU (62.8%) for Soil F in Reactor C with the longest residence time (1.5 h). Soil D had the greatest amount of silt (90%) compared to other soils, which can explain why it obtained the greatest turbidity reduction rates compared to other samples. In addition, Soil A, Soil B, and Soil C had similar proportions of clay (<2 µm), which can explain why they obtained similar turbidity reduction rates. For the treatment of 5000 mg/L of concentration for 1.5 h residence time, the turbidity reduction rates of these three soil samples ranged between 50.8 and 56.0% in RA, between 34.7 and 44.4% in RB, and between 20.1 and 41.7% in RC. The turbidity reduction rates of Soil F were likely lower compared to other tested soils due to the higher proportion of finer particles present from the deflocculant pretreatment process. The settling velocity calculations and experimental results indicate that the soil particle size may be the greatest contributor to turbidity treatment effectiveness. Based on turbidity reductions calculated from the experiments, the system efficiency was optimized with 1.8 cm (0.7 in.) settling space at 1.5-h residence time for all tested soils.
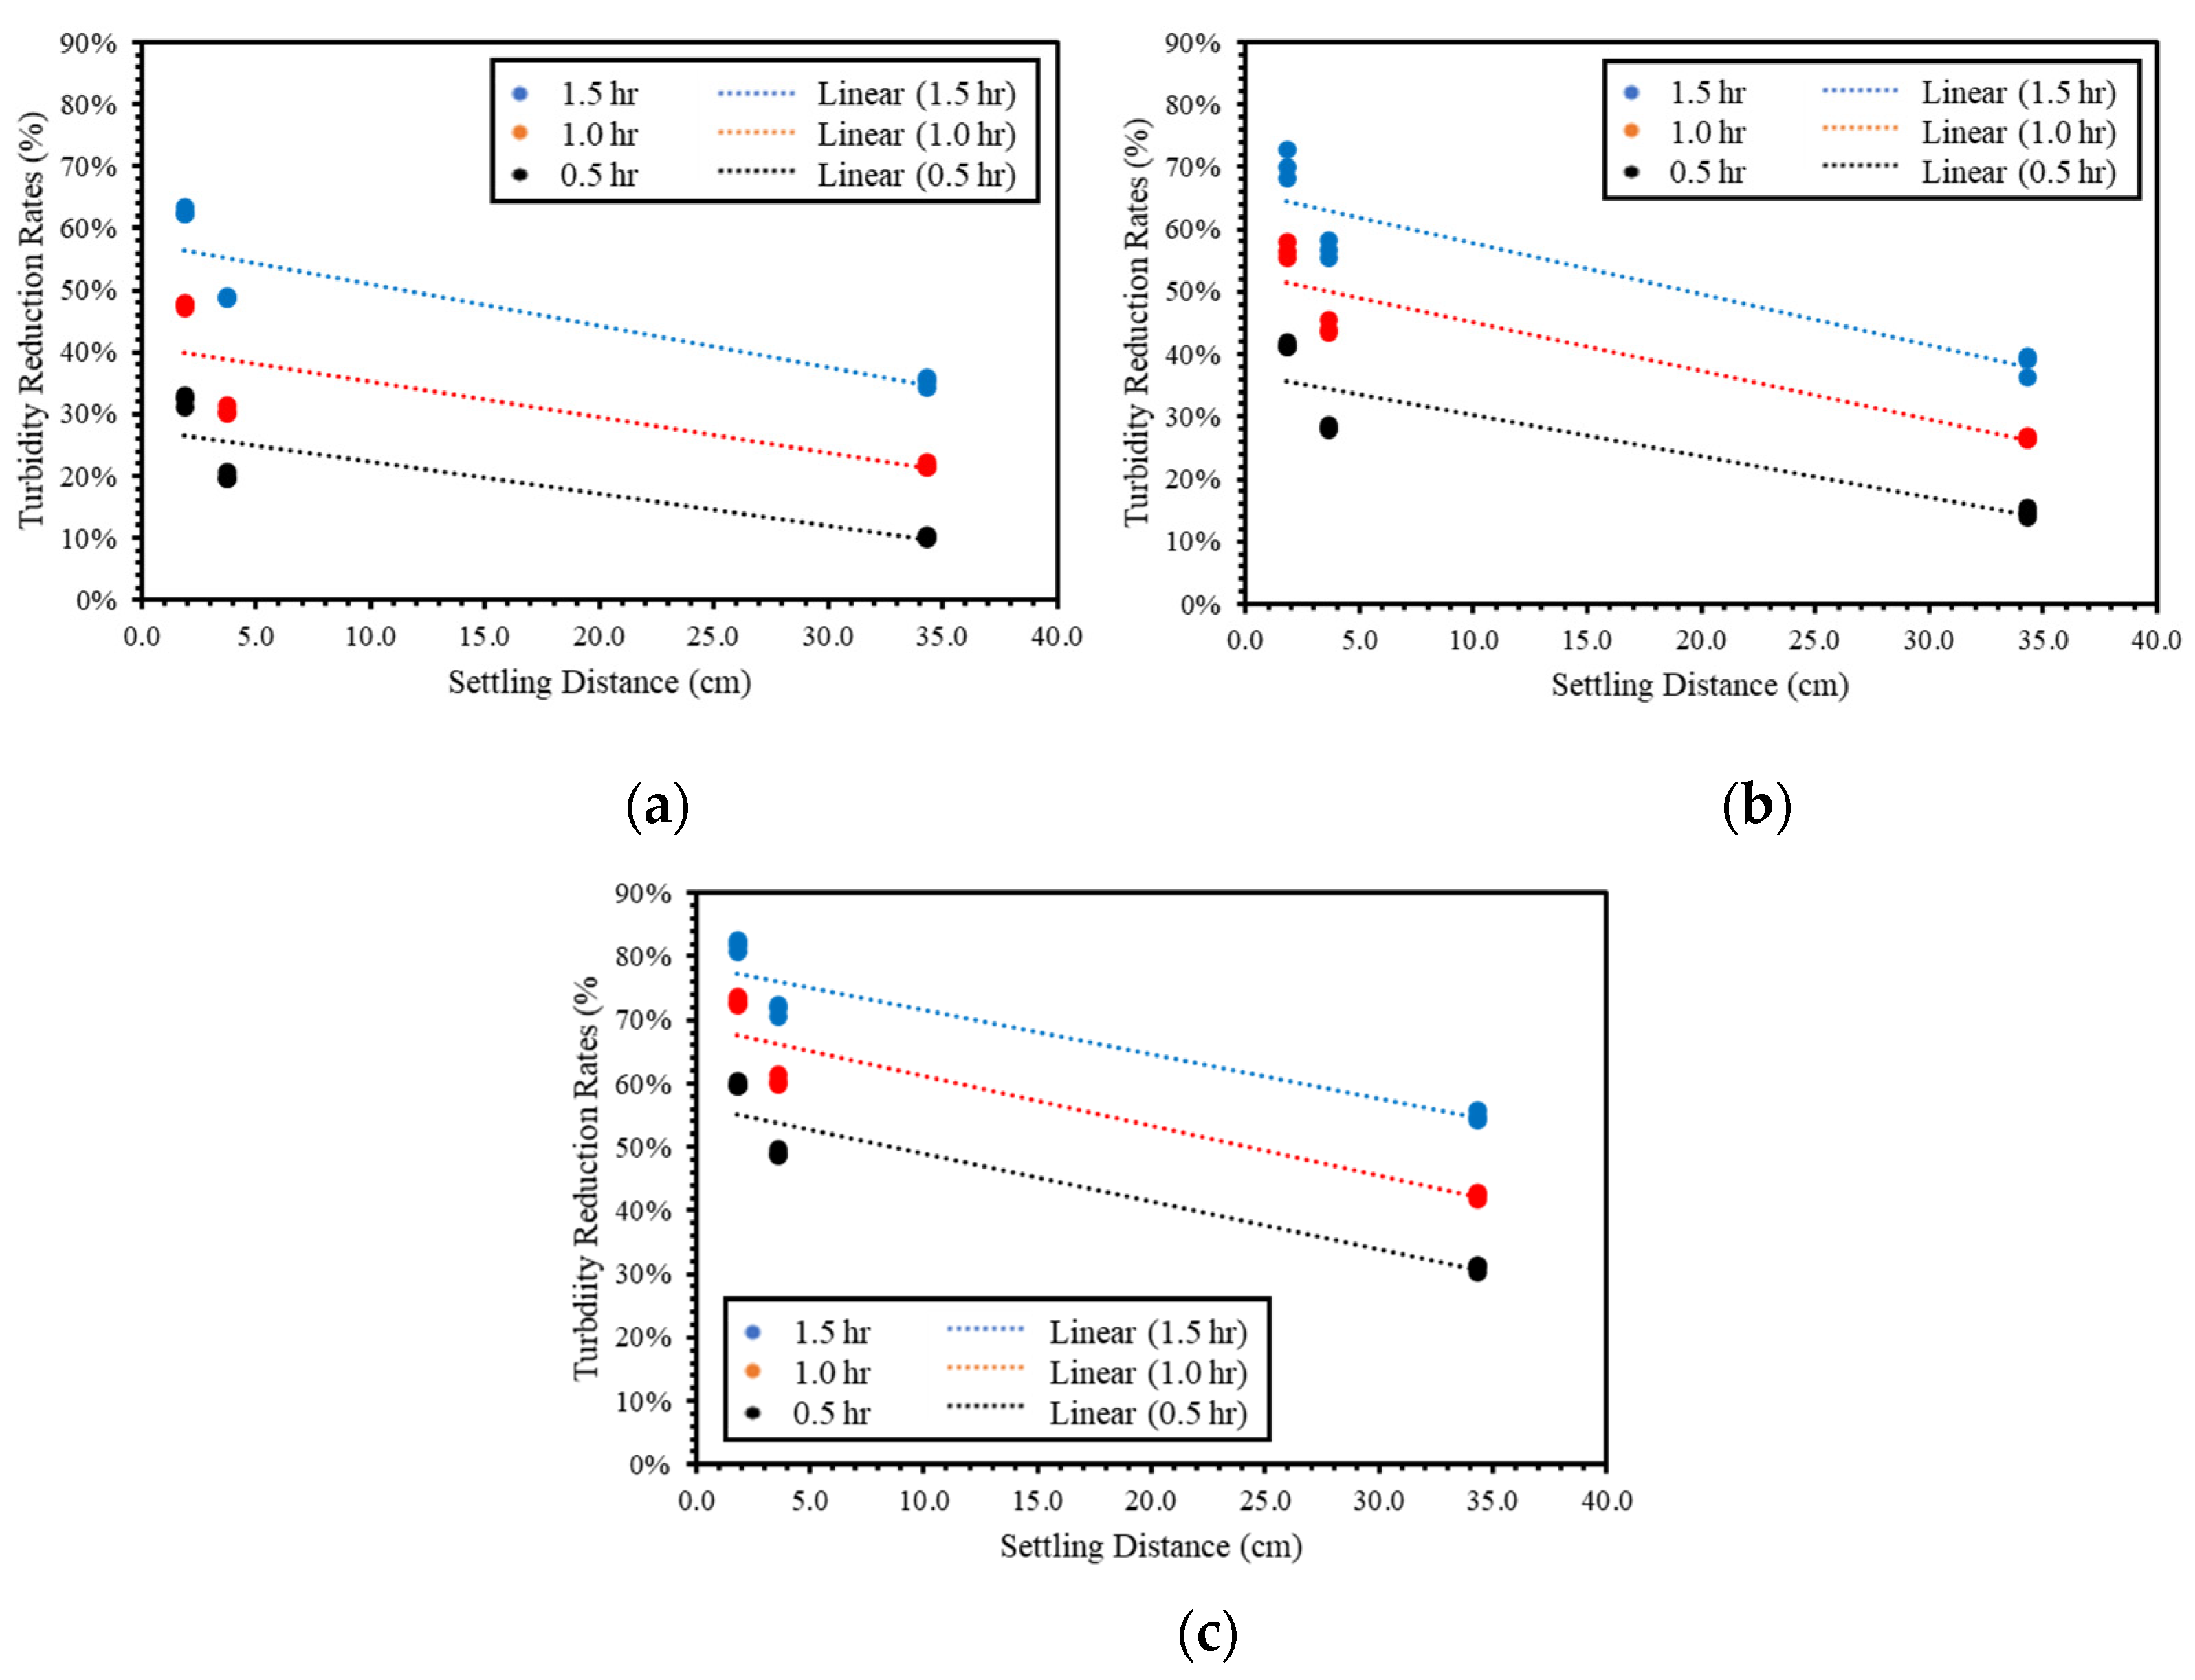
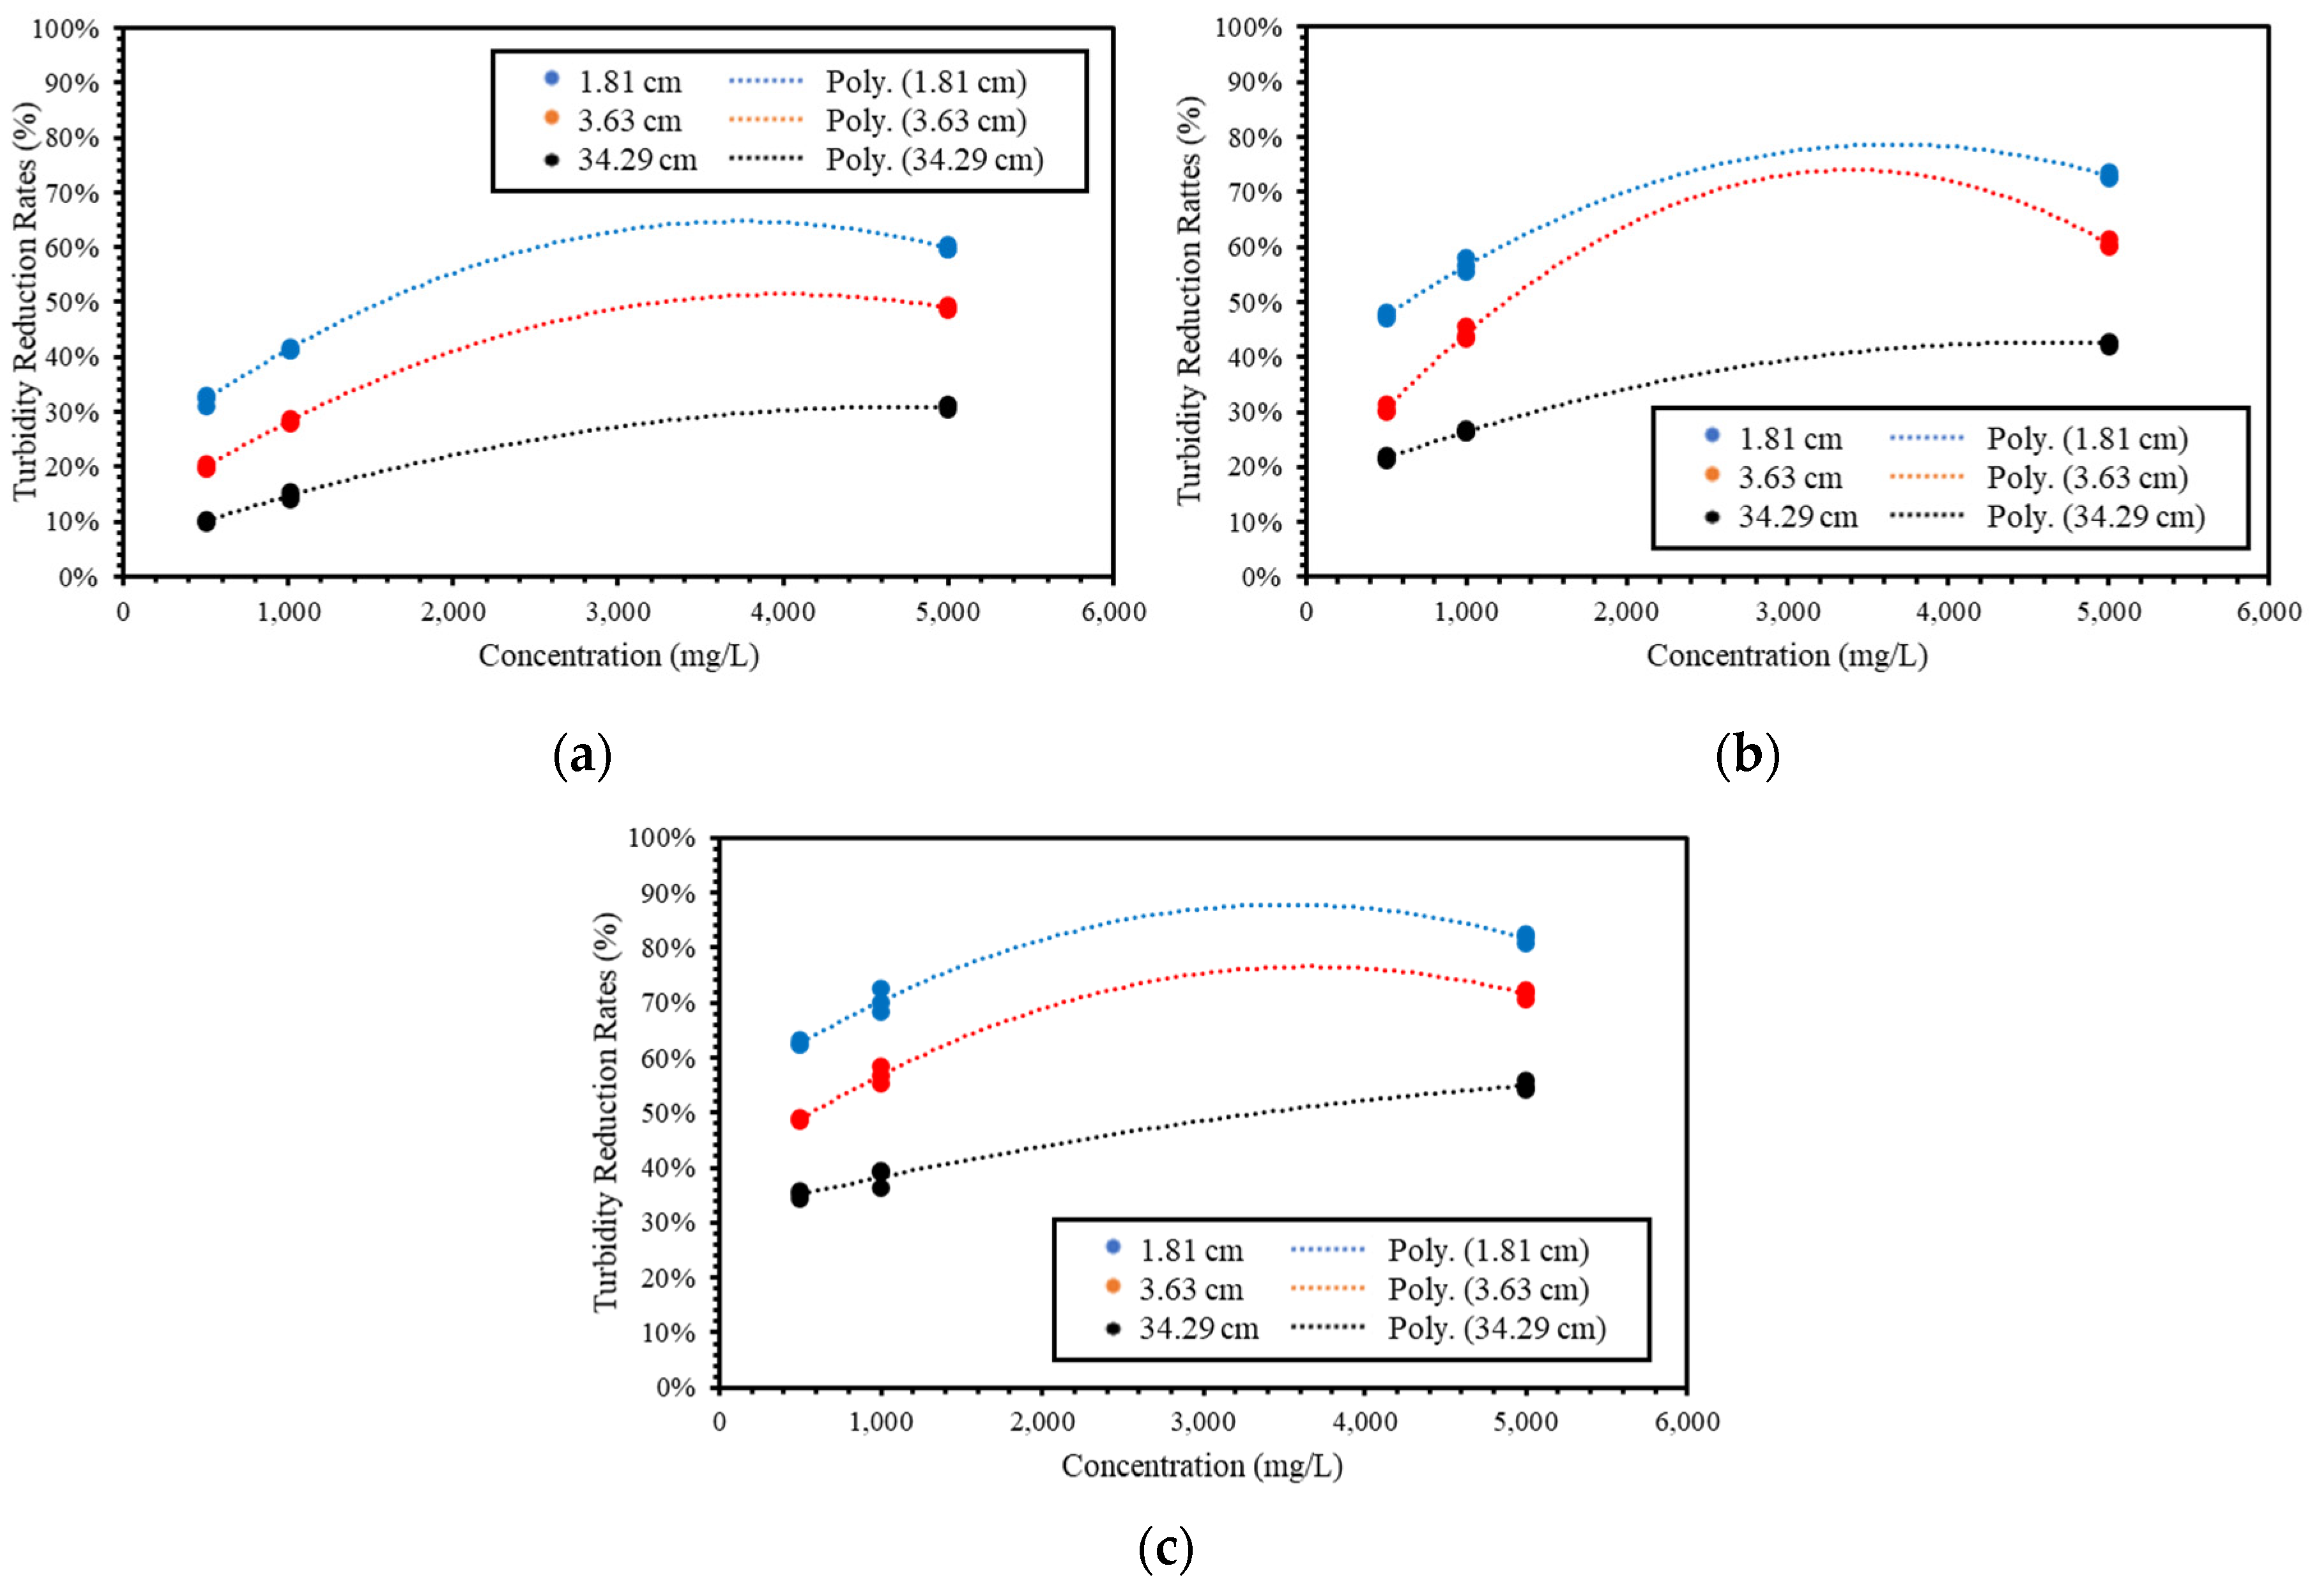
Results of FFM analysis investigated the effects of turbidity reduction rates from experimental variables (i.e., inflow concentration, settling space, and residence time) which are shown in Figure 4 and Figure 5. It was found that the turbidity reduction rates increased as concentration increased with decreased settling distance. Through Figure 4a–c, the turbidity reduction rates versus reactor’s settling distance for different inflow concentration were demonstrated in linear patterns. The turbidity reduction rates increased with decrease in settling distance. For example, the average turbidity reduction rate at 500 mg/L was 32% at Ra, which increased to 48% at 3.6 cm (1.4 in.) settling distance and kept increasing to 63% at 1.8 cm (0.7 in.) settling distance. On the other hand, in Figure 5, the relationship between turbidity reduction rate and concentration was displayed in polynomial patterns.
According to the results of FFM, a factorial model was generated and displayed as a proposed regression equation:
where a0 to a9 are the coefficients determined by least square method through regression analysis, C is the inflow concentration, S is the lamella settler’s settling distance, and t is the residence time.
Turbidity Reduction Rates (%)
= a0 + a1 × C + a2 × S + a3 × t + a4 × C × t + a5 × S × t + a6 × C × S + a7 × C2 + a8 × S2 + a9 × t2
The results of regression analysis and ANOVA tests were displayed in Table 3, where coefficients represent the degree of influence on turbidity reduction and the p-values identify whether treatments had significant effects on turbidity reductions. It was found that the p-value of one term (t2) was above 0.05, which indicated that the test failed to reject the null hypothesis and there was no significant difference among turbidity reduction rates. The terms with p-values less than 0.05 remained as the independent variables and used to re-run the model as displayed in Table 3. The R-square of the final regression analysis was 0.992, which indicated 99.2% of the variation in turbidity reduction rates was explained by the independent variables inflow concentration, residence time, and settling distance through the developed Equation (7).
Turbidity Reduction Rates (%)
= 0.2293 + 0.2042 × C − 0.8095 × S + 0.2957 × t− 0.0113 × C × t − 0.0086 × S × t − 0.0022 × C × S − 0.0249 × C2 + 0.2042 × S2
3.2. PSD
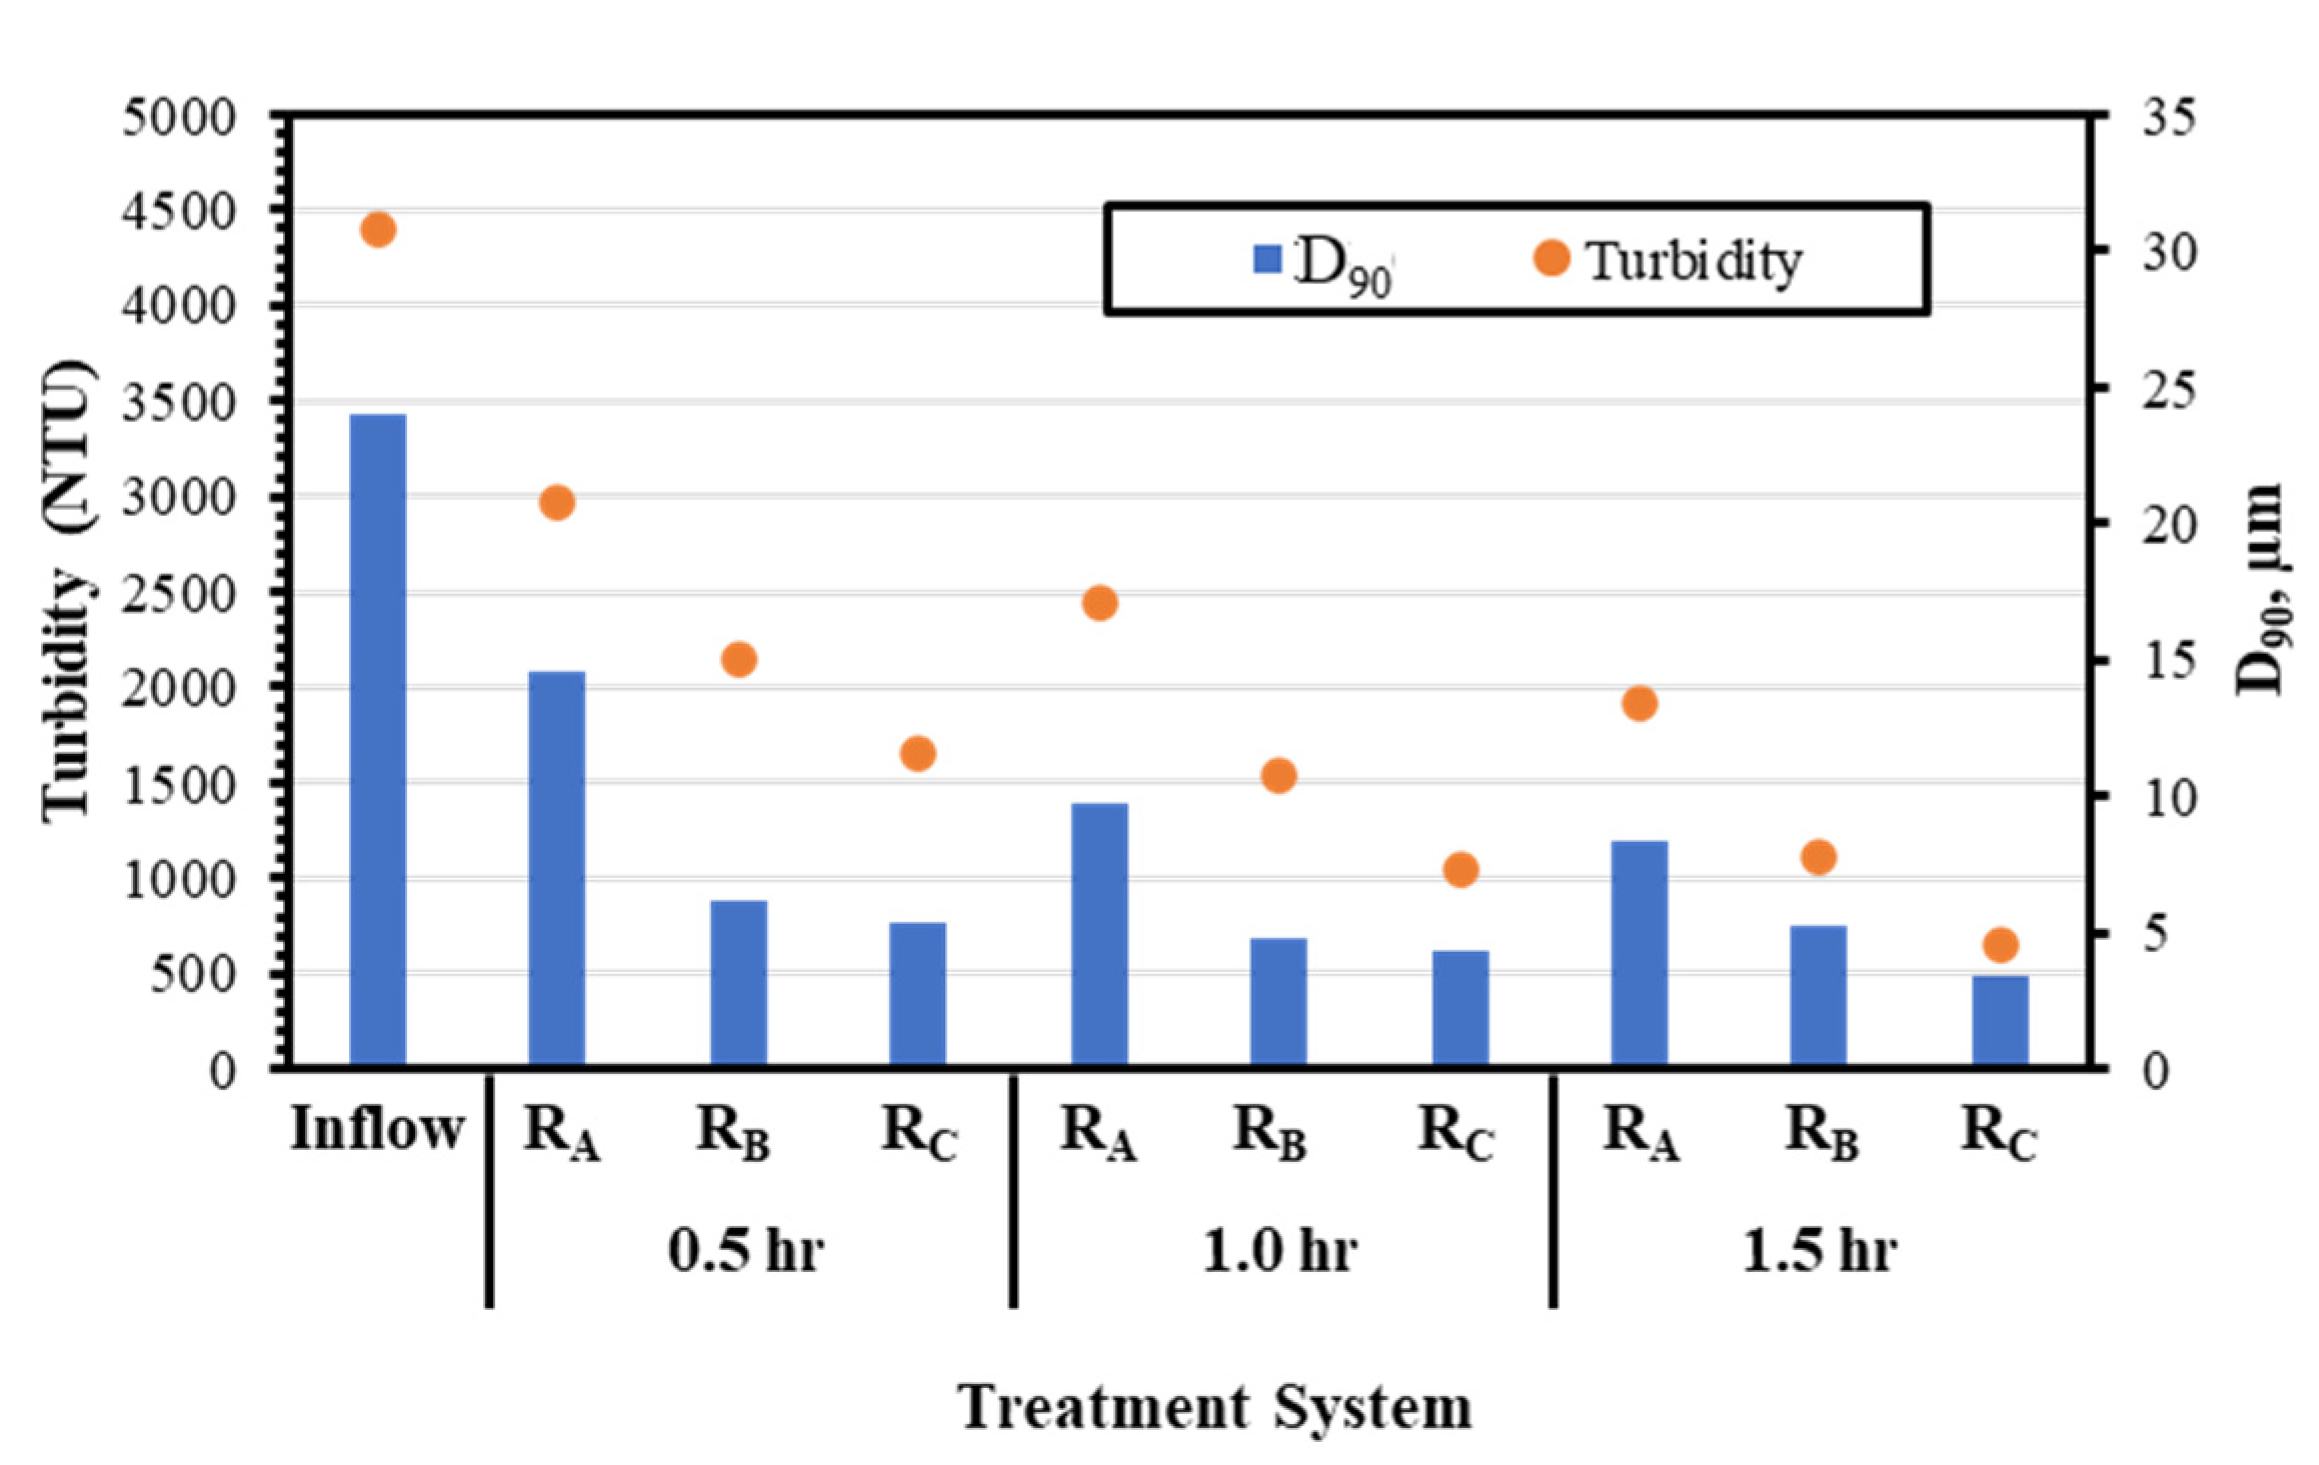
PSD analysis reported D10, D50, and D90 for evaluated soils under 5000 mg/L concentration experiments as shown in Figure 6. It was found that the average D90 of the tested soils decreased considerably with longer residence time or smaller settling space. Among all tested soils, the D90 of Soil D had the greatest decrease from 23.04 µm to 3.01 µm with the optimized design parameters obtained from turbidity analysis, while the D90 of Soil A dropped from 19.24 µm to 2.36 µm under the same treatment. The D90 of Soil B decreased from 28.7 µm to 4.26 µm, and the D90 of S60 decreased from 25.22 µm to 4.05 µm. Soil B and Soil C are made from the same material (extender kaolin), where the D90 of Soil B is larger than S60, which also has smaller D10. This shows why Soil B has a smaller median particle size compared to Soil C. The D90 of untreated Soil A is smaller than other soils, which explains lower turbidity reduction rates observed for Soil A. In addition, it was found that the average Dx (including D10, D50, and D90) dropped off slowly as settling distance decreased from 3.6 cm (1.4 in.) to 1.8 cm (0.7 in.), or residence time increased from 1.0 h to 1.5 h in the same treatment system.
3.3. Settling Velocity
Specific gravity and particle diameter are factors which correlate to the particle settling process. Soil D has same density compared to Soil A with larger median particle size. Soil B and Soil C were the same type of soil with different gradation. Equation (4) provided the same settling velocities and settling times that were obtained through Stoke’s law, which shows that Stoke’s law is applicable to analyze the settling process in this study. As shown in Table 4, the calculated settling velocities ranged from 2 to 348 cm/day (0.8 to 137.0 in./day) for different samples. The settling time of a particle over the vertical spacing between two plates ranged from 0.02 to 3.72 h in RC, which was 98.9% faster than the settling process in the control reactor (RA).
Due to the limited information available on the soil used, the median particle sizes of the soils were used to calculate the settling velocity. Based on settling velocity calculations, turbidity reductions for Soil B were expected to be lower compared to other tested soils. However, the experimental testing revealed that Soils A, B, and C all had similar turbidity reduction results. This may be due to the use of median particle size for the calculation of settling velocity. The difference between experimental results and expectation of sediment removal from settling velocity calculations shows that the median particle size may not be ideal for finer particle soils. On the other hand, the calculated settling velocity of Soil D with larger median sizes was much higher, the turbidity reduction rates of which were also much higher compared to other soil samples. Therefore, the developed equation [Equation (4)] for settling velocity estimation are applicable only to larger diameter soils. The average particle size may be more representative for settling velocity calculations compared to median particle size used during the analysis. In addition, the settling velocity and settling time for Soil A and Soil E were similar due to similar specific gravity, particle sizes, and shape factors. Soil E was pretreated by deflocculation, which influenced the original sample particle size distribution curve as deflocculation separated particles into smaller sizes. This process influenced the turbidity reduction and caused different results out of prediction. Soil D had the highest settling velocity and achieved the greatest turbidity reduction compared to other samples in the experiments, which displayed consistent results.
4. Discussion
The measurements of turbidity and PSD versus the calculated settling velocity were compared for each type of soil. Since Soil F was pre-treated prior the experiments, it was not considered in the discussion. At the 5000 mg/L inflow concentration, Soil B achieved the lowest turbidity reduction rates, as expected due to the slower settling velocity. In the 500 mg/L and 1000 mg/L inflow concentrations, the measured turbidity reduction rates of Soil A, Soil B, and Soil C were similar. The order of turbidity reduction rates was: Soil D ≈ Soil C > Soil B > Soil A in the 5000 mg/L inflow. The order of the calculated settling velocity was: Soil D > Soil A > Soil C > Soil B. These experimental results were acceptable compared to the expectations provided by the calculated settling velocities.
The PSD results of different soils did not vary a lot between each other under the same treatment due to their similar median sizes. Experimental measurements of turbidity and PSD provided consistent results which correlated with the settling velocity calculations. The PSD analysis indicated that the D90 of Soil A decreased 16.88 µm (87.7%) after the optimal treatment (5000 mg/L inflow treated in a 1.8 cm [0.7 in.] settling space Rc with 1.5 h residence time), and the D90 of Soil D decreased 20.03 µm (86.9%). The D90 of Soil A decreased less when compared to Soil D since it contained more clay. For Soil D, the D90 had the greatest decrease with the largest settling velocity and turbidity reduction rates.
The development of the FFM characterized the relationship between turbidity reduction and design parameters mathematically. The average of turbidity reduction rates of five types soils were treated as one group of data during this analysis to create a wide applicable model. The R square of the final developed model was close to one, which displayed high correlation within the model. This developed model can be used in future large-scale lamella experiments to estimate the expected turbidity treatments.
5. Conclusions
This study describes different effects from design parameters of lamella settlers and recommends the optimized factors which can determine the entire system’s efficiency. In total, 405 experiments measuring turbidity reduction and PSD analysis were conducted to optimize lamella design factors. The optimal turbidity removal rates for all five soil samples were achieved by using 1.5 hr residence time in RC (with 1.8 cm settling distance provided by a 1.27 cm of plate spacing). In addition, higher turbidity removal rates were found when concentrations were higher at the inflow. This optimal combination produced the most efficient turbidity reduction rates at 79.2% for Soil A, 86.5% for Soil B, 89.9% for Soil C, 90.0% for Soil D, and 62.8% for Soil F, respectively. The reduction rates of D90 for each soil type were 87.7% for Soil A, 85.2% for Soil B, 83.9% for Soil C, and 86.9% for Soil D. Since Soil F was pre-treated with sodium hexametaphosphate prior the experiments, it was not analyzed in the size distraction analysis. In addition, a settling velocity equation was developed and used for the tested soils. Calculated settling velocity can be used to predict the sedimentation process in the designed reactor systems. The calculated turbidity removal rates for different types of soils were correlated corresponding to the calculated settling velocities. Soil D had largest settling velocity, which created the largest turbidity reduction rate (90.0%) in the same optimized system setup compared to other samples. Soil A was the most suspended sample, with the lowest Dx and turbidity reduction rates (79.2%).
An FFM was conducted to describe the relationship between three quantitative factorial variables (inflow concentration, settling space, and residence time) and the turbidity reduction rates. The final model developed through the regression analysis was acceptable, with 0.993 R-square, which indicated the adequate fit of the model to the observed data points. In addition, the p-values of the independent variables were below 0.05, which indicated that the null hypothesis of there being no significant difference among turbidity reduction rates, inflow concentration, settling distance, and residence time was rejected.
The reactor tank used in these evaluations is scaled down from expected field-scale reactors. The developed treatment model can be applied towards future large-scale lamella settler designs. Findings from this research will pave the way for larger-scale evaluations to further determine the impact on treatment effectiveness of changing the reactor dimensions. In addition, large-scale experiments are expected to achieve a higher efficiency of sediment removal due to the larger particle sizes contained in the local soils compared to the samples used in the bench-scale experiments.
Research results from this study can be widely applicable as it focused on the prediction of the turbidity treatment regardless of the sources of stormwater runoff (urban, construction, and agriculture). The model can assist stormwater professionals by providing estimates of turbidity treatment effectiveness across a variety of design parameters (i.e., inflow concentration, settling distance, and residence time). This research has shown how lamella settler systems can provide significant water quality benefits to turbid water, which is applicable to various types of water treatment, including construction, post-construction, and agricultural stormwater management. Additional applications in other water treatment processes such as wastewater and drinking water may benefit from the outcomes of this research.
Author Contributions
The contributions of each author were shown below: Conceptualization, M.A.P. and L.L.; methodology, M.A.P. and L.L.; software, L.L.; validation, L.L.; formal analysis, L.L.; investigation, L.L., and M.A.P.; resources M.A.P.; data curation, J.B.W., M.A.P., and L.L.; writing—original draft preparation, L.L.; writing—review and editing, M.A.P., L.L., and J.B.W.; visualization, L.L., M.A.P., and J.B.W.; supervision, M.A.P.; project administration, M.A.P.; funding acquisition, M.A.P. All authors have read and agreed to the published version of the manuscript.
Funding
This research received no external funding.
Conflicts of Interest
The authors declare no conflict of interest.
References
- Nayebare, S.R.; Wilson, L.R.; Carpenter, D.O.; Dziewulski, D.M.; Kannan, K. A review of potable water accessibility and sustainability issues in developing countries—Case study of Uganda. Rev. Environ. Health 2014, 29, 363–378. [Google Scholar] [CrossRef] [PubMed]
- Barrett, M.E.; Kearney, J.E.; McCoy, T.G.; Malina, J.F. An Evaluation of the Use and Effectiveness of Temporary Sediment Controls; Technical Report No. 261; Center for Research in Water Resources, University of Texas: Austin, TX, USA, 1995; Available online: https://repositories.lib.utexas.edu/bitstream/handle/2152/6738/crwr_onlinereport95-6.pdf?sequence=2 (accessed on 23 August 2018).
- Reardon, R. Clarification concepts for treating peak wet-weather wastewater flows. Fla. Water Resour. J. 2005, 11, 4431–4444. Available online: http://www.fwrj.com/techarticle05/0105tech1.pdf (accessed on 15 October 2018). [CrossRef] [Green Version]
- Vasconcelos, J.G.; Chosie, C.D.; Guest, H.M.; Patrick, A.C. Lamella Settlers: Sediment. Removal from Roadway Construction Runoff; Highway Research Center: Auburn, AL, USA, 2014; Available online: http://eng.auburn.edu/files/centers/hrc/ir-14-01-lamella-vasconcelos.pdf (accessed on 15 October 2018).
- Donohue, I.; Garcia Molinos, J. Impacts of increased sediment loads on the ecology of lakes. Biol. Rev. 2009, 84, 517–531. [Google Scholar] [CrossRef]
- Forrest, C.L.; Harding, M.V. Erosion and sediment control: Preventing additional disasters after the southern California fires. J. Soil Water Conserv. 1994, 49, 535–541. Available online: https://www.waterboards.ca.gov/rwqcb9/press_room/announcements/firestorm/docs/erosioncontrol_socalfires.pdf (accessed on 11 October 2018).
- Leung, W.F.; Probsteln, R.F. Lamella and Tube Settlers. 1. Model and Operation. Ind. Eng. Chem. Process Des. Dev. 1983, 22, 58–67. [Google Scholar] [CrossRef]
- Vasconcelos, J.G.; Zech, W.C. Evaluation of High-Rate Settling Technology for Sediment Control in Roadway Construction Sites; Highway Research Center: Auburn, AL, USA, 2017. Available online: https://rosap.ntl.bts.gov/view/dot/49456 (accessed on 16 January 2019).
- Shih, I.; Van, Y.; Yeh, L.; Lin, H.; Chang, Y. Production of a biopolymer flocculant from Bacillus licheniformis and its flocculation properties. Bioresour. Technol. 2001, 78, 267–272. [Google Scholar] [CrossRef]
- Teh, C.Y.; Budiman, P.M.; Shak, K.P.Y.; Wu, T.Y. Recent Advancement of Coagulation–Flocculation and Its Application in Wastewater Treatment. Ind. Eng. Chem. Res. 2016, 55, 4363–4389. [Google Scholar] [CrossRef]
- US Environmental Protection Agency (USEPA). National Pollutant Discharge Elimination System General Permit for Discharges from Construction Activities; USEPA: Washington, DC, USA, 2017. Available online: https://www.epa.gov/sites/production/files/2019-06/documents/final_2017_cgp_current_as_of_6-6-2019.pdf (accessed on 12 September 2018).
- Schaller, E.; Schaller, E. Denisty Current Baffle for a Clarifer Tank. U.S. Patent 8,083,075, 1 June 2010. [Google Scholar] [CrossRef]
- Weiss, G. Lamella settlers for treatment of urban storm runoff: Experience with model and prototype tests. Traitement de la pollution/Pollution treatment-Bassins/Detention basins & retention ponds, Germany. 2016. Available online: https://www.semanticscholar.org/paper/Lamella-settlers-for-treatment-of-urban-storm-with-Weiß/0066688b02567396bb598975918b4a9f929b16b1 (accessed on 15 November 2018).
- Nguyentranlam, G.; Galvin, K. Particle classification in the reflux classifier. Miner. Eng. 2001, 14, 1081–1091. [Google Scholar] [CrossRef]
- Perez, M.; Zech, W.C.; Vasconcelos, J.G.; Fang, X. Large-Scale Performance Testing of Temporary Sediment Basin Treatments and High-Rate Lamella Settlers. Water 2019, 11, 316. [Google Scholar] [CrossRef] [Green Version]
- Imsil Company. Technical Data of A25. 2017. Available online: https://coatings.sibelcotools.com/wp-content/uploads/2017/06/Imsil-Combined-11-16.pdf (accessed on 15 March 2019).
- Nobrite Company. Technical Data of Snobrite 60 and Snobrite 75. 2017. Available online: https://coatings.sibelcotools.com/wp-content/uploads/2017/06/Snobrite-Combined_Final.pdf (accessed on 15 March 2019).
- Minex Company. Technical Data of Minex 4. 2017. Available online: https://coatings.sibelcotools.com/wp-content/uploads/2017/03/Nephton-Minex-Functional-Fillers-4-14.pdf (accessed on 15 March 2019).
- ASTM. Standard Test Methods for Particle-Size Distribution (Gradation) of Soils Using Sieve Analysis; D6913-04; ASTM International: West Conshohocken, PA, USA, 2009. [Google Scholar]
- Markusic, M.S. Effects of design changes on sediment retention basin efficiency. Master’s Thesis, NC State University, Raleigh, NC, USA, 2007; pp. 222–231. Available online: http://www.lib.ncsu.edu/resolver/1840.16/1938 (accessed on 12 September 2018).
- Fang, X.; Zech, W.C.; Logan, C.P. Stormwater Field Evaluation and Its Challenges of a Sediment Basin with Skimmer and Baffles at a Highway Construction Site. Water 2015, 7, 3407–3430. [Google Scholar] [CrossRef]
- Rad, M.M.; Khanjani, M.J. Energy Dissipation of Flow in the Vortex Structure: Experimental Investigation. J. Pipeline Syst. Eng. Pract. 2019, 10, 04019027. [Google Scholar] [CrossRef]
- Azema, N.; Pouet, M.-F.; Berho, C.; Thomas, O. Wastewater suspended solids study by optical methods. Colloids Surf. A Physicochem. Eng. Asp. 2002, 204, 131–140. [Google Scholar] [CrossRef]
- Vahidifar, S.; Saffarian, M.R.; Hajidavalloo, E. Numerical simulation of particle-laden flow in an industrial wastewater sedimentation tank. Meccanica 2019, 54, 1–17. [Google Scholar] [CrossRef]
- Tang, P.; Raper, J. Modelling the settling behaviour of fractal aggregates—A review. Powder Technol. 2002, 123, 114–125. [Google Scholar] [CrossRef]
- Vahedi, A.; Gorczyca, B. Predicting the settling velocity of flocs formed in water treatment using multiple fractal dimensions. Water Res. 2012, 46, 4188–4194. [Google Scholar] [CrossRef] [PubMed]
Figure 1.
Reactor tank design profiles. (a) Reactor A, RA; (b) Reactor B, RB; (c) Reactor C, RC.

Figure 2.
Lamella reactors experimental setup.

Figure 3.
Average turbidity results for Soil A, 1000 mg/L, 30 min residence.

Figure 4.
Turbidity reduction rates versus settling distance at different concentrations. (a) 500 mg/L; (b) 1000 mg/L; (c) 5000 mg/L.
Figure 4.
Turbidity reduction rates versus settling distance at different concentrations. (a) 500 mg/L; (b) 1000 mg/L; (c) 5000 mg/L.

Figure 5.
Turbidity reduction rates versus inflow concentrations at different settling distances. (a) 500 mg/L; (b) 1000 mg/L; (c) 5000 mg/L.
Figure 5.
Turbidity reduction rates versus inflow concentrations at different settling distances. (a) 500 mg/L; (b) 1000 mg/L; (c) 5000 mg/L.

Figure 6.
Average measurements of turbidity and D90 for all tested soils.


Table 1.
Soil Information.
| ID | Soil Name | Mineral | Gradation | Median Size, microns, µm (in.) | Specific Gravity | Shape Factor | ||
|---|---|---|---|---|---|---|---|---|
| Clay, % | Silt, % | Very Fine Sand, % | ||||||
| Soil A | Imsil® A25 | Quartz | 25.0 | 75.0 | - | 5.0 (0.0002) | 2.65 | 0.83 |
| Soil B | Snobrite 75 | Kaolin | 19.1 | 80.9 | 0.5 (0.00002) | 2.77 | 0.77 | |
| Soil C | Snobrite 60 | Kaolin | 18.5 | 80.3 | 1.2 | 1.2 (0.00005) | 2.77 | 1.25 |
| Soil D | Minex 4 | Nepheline Syenite | 10.1 | 89.9 | - | 6.8 (0.0003) | 2.60 | 0.67 |
| Soil E and F | Kaolin | Kaolinite | - | - | - | 5.0 (0.0002) | 2.65 | 0.81 |
Table 2.
Turbidity Reduction.
| Inflow Concentration | 500 mg/L | 1000 mg/L | 5000 mg/L | ||||||
|---|---|---|---|---|---|---|---|---|---|
| Residence Time | 0.5 h | 1.0 h | 1.5 h | 0.5 h | 1.0 h | 1.5 h | 0.5 h | 1.0 h | 1.5 h |
| Soil A | |||||||||
| RA | 5.3% | 10.5% | 16.1% | 7.6% | 11.9% | 24.2% | 37.2% | 44.2% | 54.6% |
| RB | 14.1% | 24.1% | 39.2% | 16.3% | 36.3% | 52.8% | 44.7% | 64.1% | 73.5% |
| RC | 30.8% | 42.7% | 57.3% | 32.8% | 45.5% | 65.5% | 55.6% | 73.1% | 79.2% |
| Soil B | |||||||||
| RA | 6.6% | 18.4% | 32.2% | 8.0% | 22.2% | 36.8% | 20.1% | 34.7% | 56.0% |
| RB | 20.1% | 24.3% | 46.3% | 27.9% | 32.5% | 52.6% | 44.0% | 56.5% | 71.1% |
| RC | 28.3% | 40.9% | 54.3% | 34.5% | 42.7% | 62.9% | 57.4% | 68.4% | 86.5% |
| Soil C | |||||||||
| RA | 10.1% | 23.1% | 30.1% | 15.1% | 27.8% | 32.7% | 41.7% | 44.4% | 50.8% |
| RB | 18.1% | 30.7% | 41.5% | 27.1% | 45.9% | 50.8% | 65.8% | 68.9% | 77.8% |
| RC | 32.9% | 47.0% | 57.0% | 36.6% | 54.6% | 71.6% | 73.0% | 83.9% | 89.9% |
| Soil D | |||||||||
| RA | 19.2% | 32.7% | 62.0% | 26.5% | 44.2% | 65.0% | 35.1% | 63.0% | 73.0% |
| RB | 34.6% | 45.0% | 74.2% | 42.9% | 71.2% | 81.6% | 60.3% | 78.1% | 81.9% |
| RC | 42.3% | 61.5% | 85.9% | 64.2% | 83.2% | 89.8% | 74.2% | 86.6% | 90.0% |
| Soil F | |||||||||
| RA | 9.5% | 23.4% | 35.2% | 16.2% | 26.3% | 32.7% | 20.6% | 25.8% | 40.2% |
| RB | 12.8% | 29.0% | 42.6% | 27.1% | 35.7% | 46.4% | 30.0% | 35.2% | 53.5% |
| RC | 26.4% | 46.0% | 58.5% | 39.0% | 57.4% | 61.7% | 39.1% | 52.8% | 62.8% |
| Average of All Soils | |||||||||
| RA | 10.1% | 21.6% | 35.1% | 14.7% | 26.5% | 38.3% | 31.0% | 42.4% | 54.9% |
| RB | 19.9% | 30.6% | 48.8% | 28.3% | 44.3% | 56.9% | 49.0% | 60.6% | 71.6% |
| RC | 32.1% | 47.6% | 62.6% | 41.4% | 56.7% | 70.3% | 59.9% | 73.0% | 81.7% |
Note: (1) Soil E was not evaluated for turbidity reduction. (2) reduction percentages in bold indicate minimum and maximum turbidity reduction rates for different inflow.
Table 3.
Results of ANOVA test.
| Equation (6) | Equation (7) | |||
|---|---|---|---|---|
| Coefficients | p-Value | Coefficients | p-Value | |
| Intercept | 0.2291 | <0.05 a | 0.2293 | <0.05 a |
| C | 0.2042 | <0.05 a | 0.2042 | <0.05 a |
| S | −0.8095 | <0.05 a | −0.8095 | <0.05 a |
| t | 0.2960 | <0.05 a | 0.2957 | <0.05 a |
| t× C | −0.0113 | <0.05 a | −0.0113 | <0.05 a |
| t× S | −0.0086 | <0.05 a | −0.0086 | <0.05 a |
| C× S | −0.0022 | <0.05 a | −0.0022 | <0.05 a |
| C2 | −0.0249 | <0.05 a | −0.0249 | <0.05 a |
| S2 | 0.2042 | <0.05 a | 0.2042 | <0.05 a |
| t2 | −0.0002 | 0.9913 b | 0 | - |
Note: a statistically significant result; b not statistically significant.
Table 4.
Settling Velocity.
| ID | Settling Velocity, cm/Day (in./Day) | Settling Time (hr) | ||
|---|---|---|---|---|
| RA | RB | RC | ||
| Soil A | 194 (76) | 3.47 | 0.02 | 0.04 |
| Soil B | 2.0 (0.8) | 323.86 | 1.86 | 3.72 |
| Soil C | 12(5) | 56.23 | 0.32 | 0.65 |
| Soil D | 348 (137) | 1.94 | 0.01 | 0.02 |
| Soil F | 194 (76) | 3.47 | 0.02 | 0.04 |
© 2020 by the authors. Licensee MDPI, Basel, Switzerland. This article is an open access article distributed under the terms and conditions of the Creative Commons Attribution (CC BY) license (http://creativecommons.org/licenses/by/4.0/).
Share and Cite
MDPI and ACS Style
Liu, L.; Perez, M.A.; Whitman, J.B. Evaluation of Lamella Settlers for Treating Suspended Sediment. Water 2020, 12, 2705. https://0-doi-org.brum.beds.ac.uk/10.3390/w12102705
AMA Style
Liu L, Perez MA, Whitman JB. Evaluation of Lamella Settlers for Treating Suspended Sediment. Water. 2020; 12(10):2705. https://0-doi-org.brum.beds.ac.uk/10.3390/w12102705
Chicago/Turabian StyleLiu, Lan, Michael A. Perez, and J. Blake Whitman. 2020. "Evaluation of Lamella Settlers for Treating Suspended Sediment" Water 12, no. 10: 2705. https://0-doi-org.brum.beds.ac.uk/10.3390/w12102705
Note that from the first issue of 2016, this journal uses article numbers instead of page numbers. See further details here.