Article

Particle Size and Pre-Treatment Effects on Polystyrene Microplastic Settlement in Water: Implications for Environmental Behavior and Ecotoxicological Tests

1
Technische Universität Berlin, Sekr. KF 4, Straße des 17, Juni 135, D-10623 Berlin, Germany
2
German Environment Agency (UBA), Section II 3.1, Schichauweg 58, D-12307 Berlin, Germany
*
Author to whom correspondence should be addressed.
Submission received: 19 October 2020 / Revised: 26 November 2020 / Accepted: 4 December 2020 / Published: 8 December 2020

Abstract

:
Microplastic (MP) particle dispersions used in many recent publications covering adsorption or toxicological studies are not characterized very well. The size distribution of polydisperse dispersions is highly dependent on the agglomeration processes and influences experimental outcomes. Therefore, pre-treatment is a prerequisite for reproducibility. In this study, manual/automated shaking and ultrasonic treatment as different mechanical dispersion techniques were applied for the dispersion of cryomilled polystyrene (PS). Particle numbers and size distribution of dispersions were analyzed by a light extinction particle counter and the dispersion efficiency (ED) as the ratio between calculated volume and theoretical volume of suspended particles was used to compare techniques. PS dispersions (20 mg/L) treated for 90 min in an ultrasonic bath (120 W, 35 kHz) were evenly dispersed with a particle concentration of 140,000 particles/mL and a high reproducibility (rel. SD = 2.1%, n = 6). Automated horizontal shaking for 754 h (250 rpm) reached similar particle numbers (122,000/mL) but with a lower reproducibility (rel. SD = 9.1%, n = 6). Manual shaking by hand dispersed the lowest number of particles (55,000/mL) and was therefore found to be unsuitable to counteract homo-agglomeration. ED was calculated as 127%, 104% and 69% for ultrasonic treatment, horizontal shaking and manual shaking, respectively, showing an overestimation of volume assuming spherical shaped particles.

1. Introduction

A great emphasis in microplastic (MP) research is put on the spatial distribution, transport and behavior of microplastics in water. The interactions of MP in the aqueous phase are numerous: leaching of potentially toxic additives, adsorption of organic compounds and metals to MP and toxicological effects on organisms are being investigated. With a few exceptions, all these studies use artificial MP dispersions to extrapolate laboratory findings to environmental behavior. For this reason, meaningful results require attention during the preparation of MP dispersions.
MP exposure experiments conducted with only a few details on applied mass, particle size distribution and concentration are hard to compare [1]. Prerequisites have been formulated for particle characterization used in toxicology studies regarding surface area or size distribution but also homogeneity of dispersion [2,3]. Only fully dispersed, stable dispersions with most particles existing separately allow for correct extrapolations of mass/number concentration effects. Dispersion stability is linked to particle size and specific surface area. However, pristine polymer particles as used in many studies are highly hydrophobic and poorly wettable if not chemically stabilized or further processed [4]. Depending on the material type and applied concentration of these particles, attachment to laboratory glassware, accumulation at the liquid–gas interface, and formation of homo-agglomerates are the consequences [5]. This reduces the availability of particles to participate in experiments and can strongly bias outcomes. The OECD Guideline concerning stability of nanomaterials highlights the dispersion stability as an important parameter affecting the environmental behavior of nanomaterials (with nanoplastics already being studied by some research groups) [6]. In many cases, surfactants such as sodium dodecyl sulfate or polysorbate (Tween) 20 or 80 are used and commercial particle dispersions are thereby commonly stabilized [7,8]. Surfactants are also added during the synthesis of MP which could alter the surface characteristics and thus the adsorption process [8,9]. Nevertheless, surfactants can also bias experiments: Renzi et al. [10] recorded a higher mortality and immobilization in toxicological experiments with MP when the surfactant Triton X-100 was used. The surfactant itself had negative effects on the organisms but the more stable dispersion of particles could also lead to increased ingestion and toxicity. Xia et al. [11] reported the effect of non-ionic surfactants on the sorption of organic pollutants onto microplastics. Natural organic matter (NOM) is also used in some studies to stabilize MP and mimic environmental conditions, but the effect of NOM on dispersion stability has not been fully resolved yet. Reported results indicate a stabilizing as well as no effect using NOM standard samples from the International Humic Substances Society (IHSS) in MP dispersions [12,13,14,15,16].
Oxidation of MP surfaces as an effect of weathering processes increases polarity, hydrophilicity and induces charge [17,18]. Artificial weathering can be achieved by UV photodegradation or chemical oxidation using hydrogen peroxide or ozone. Van der Esch used an alkaline oxidation with potassium hydroxide to simultaneously fragment and oxidize polystyrene (PS), polyethylene terephthalate (PET) and polyactic acid (PLA) polymers to obtain a stable dispersion [3]. The advantage of surface activation lies in the mode of stabilization which can closely resemble environmental weathering processes and thus create more realistic scenarios. Artificial weathering, however, is a time-consuming process, especially when using UV radiation. Ozone has been applied to stabilize PS particles, but the oxidation caused a size reduction of particles and a fraction of PS was dissolved [5].
The agglomeration behavior of dispersions has already been broadly studied for nanoparticles [19,20], with a focus on ecological investigations [21]. Pre-treatment for deagglomeration is an important step to ensure size/surface-dependent particle effects for specific applications. In the case of nanoparticle research, pre-treatments for dispersing solids include hot air oxidation, application of ozone, deep-freezing below 195 °C and the use of chemical stabilizers [22,23,24].
Ultrasonic treatment is also commonly used in this field, as it is reported to break down agglomerates in the nanoscale [25]. Acoustic cavitation as the main process leads to deagglomeration and formation of OH-radicals with temperatures of up to 5000 K and pressures of 1000 atm after bubble collapse. Cavitation and cavitation-induced shockwaves accelerate particles in dispersion which will eventually collide. These interparticle collisions can change the surface morphology, composition and reactivity [26]. Sonochemistry, therefore, offers interesting possibilities to stabilize MP dispersions through a combination of physical and chemical interactions.
A stable and fully dispersed dispersion is characterized by stronger repulsive forces which kinetically hinder the non-equilibrium state to reach equilibrium in an agglomerated state [6]. So, either the net forces in the dispersion have to be measured or the state of particles (isolated or agglomerated) has to be monitored. In many studies, scanning electron microscopy (SEM) images are provided to characterize particles used for dispersions [8]. Static imaging, however, may not be suitable since particles are removed from the test matrix (usually water), dried and further prepared (e.g., sputtered with gold) to meet prerequisites of the imaging process. SEM images still give valuable insights concerning particle size and morphology [27].
Zeta potential measurements are widely used to study the effects of ion strength, pH and humic substances on the stability of MP and nanoplastic (NP) dispersions [12,13,15,16]. This parameter is essential to characterize dispersions, but measurements are elaborate and time-consuming and limited to smaller particle sizes depending on the density of the particle. Particle concentration measurements, on the other hand, are fast and can give an insight into the size distribution of a polydisperse system. Through the simple measurement of light extinction, the particle concentration can be determined directly in the liquid as an index of dispersibility. The number of particles per unit volume combined with size measurements are good indicators for the state of a dispersion [21].
In this work, we evaluated additive-free methods of dispersion for cryomilled PS particles. For this purpose, manual shaking by hand, long-term horizontal shaking and ultrasonic treatment were compared regarding the suitability of dispersing particles, and the effects on particle numbers and size fractions were investigated. Light extinction measurements were used as a quality indicator for the degree of dispersion. By volume calculation of dispersed particles, the dispersion efficiency ED was determined to evaluate the methods of dispersing.

2. Materials and Methods

PS particles were produced by cryogenic ball milling (Cryomill, Retsch, Germany) of pristine PS pellets (BASF, Ludwigshafen, Germany). The procedure was previously documented in detail [5]. The PS powder was then dry-sieved over a 100 µm stainless steel mesh (Retsch, Haan, Germany) to exclude larger particles. Ultrapure water (ELGA, Celle, Germany) was used for all batches and cleaning steps. In this process, 500 and 1000 mL glass bottles (Schott, Mainz, Germany) were used for the preparation of the batches. Thorough cleaning of all glassware was achieved by multiple washing, including the use of detergent and ultrasonic baths.
PS particle batches were prepared by weighing-in with a lab scale (A200S, Sartorius, Germany) using an anti-static gun and carefully rinsing the particles into the bottles. Ultrapure water was added by weight to obtain a particle concentration of 20 mg/L PS particles. Three different treatment approaches were used to disperse the hydrophobic PS particles: manual shaking by hand, automated shaking on a horizontal shaker and ultrasonic treatment.
Manual shaking was continuously done by hand with a consistent movement so that the water–gas interface was disrupted. Each up and down movement of the bottle was counted as one agitation. Particle measurements were made every 50 agitations up to a total of 250 agitations.
A horizontal shaker was used at 250 rounds per minute for automated shaking. Initially, the batches were measured every 60–80 min, and this interval was increased throughout the experiment for, in total, 754 h to fully evaluate the impact of long-term agitation.
Ultrasonic treatment was done in an ultrasonic bath (Sonorex Super RK 106, Bandelin, Germany) with a rated output of 120 W, and a frequency of 35 kHz was applied in 5–15 min intervals. Bottles were submerged in a deionized/tap water mixture to approximately 2/3 of the height. The uniformity of the ultrasonic field was not tested.
Particle size and number was determined by light extinction measurement using a particle counter (SVSS, PAMAS, Rutesheim, Germany). For each measurement, 3 mL of the sample was analyzed and every sample was measured in triplicate (mean value is shown, error bars are provided). The particle counter groups detected particles into channels, the boundary settings for these channels are provided in the SI, Section D. Batches were slightly stirred before measurement to resuspend deposited particles and rinse-off particles attached to the upper part and neck of the bottles. Previous experiments showed that magnetic stir bars can increase particle concentration through abrasion of the bars or the bottle bottom, and were therefore not used. For the settling experiment, the batch was not shaken and only moved carefully for measurement purpose. All concentration values shown are averaged from 3 measurements, and no particle settling could be detected between triplicate measurements. Average particle diameter was about 3 µm and differences in the densities of PS and water is low, therefore significant settling in the time frame of a measurement—(approximately 3 min for triplicate analyses)was not expected. As illustrated in Figure 1, the timespan of measurement is too small for a considerable settling process of particles expected in the size range of 1–20 µm.
The suspended solid volume of PS particles was calculated using particle size data with the lower channel boundary and using spherical shape (see SI, Section A). In a previous study, the irregular morphology of cryogenic milled PS powder was shown [5]. The lower channel boundaries were therefore used to partly compensate for the overestimation of volume by assuming a spherical shape of particles. In order to compare the preparation methods, the parameter dispersion efficiency ED was used (for formulae see SI, Section C). ED is the ratio between calculated suspended solid volume Vcss and theoretical suspended solid volume Vtss and indicates the state of the dispersion (fully dispersed vs. agglomerated/attached to surfaces etc.). Vtss was calculated using the suspended solid mass and a PS density of 1.05 g/cm3. Vcss was calculated using the particle counter data and the lower channel boundary (see SI, Section D) and volume formula for spherical shape.

3. Results

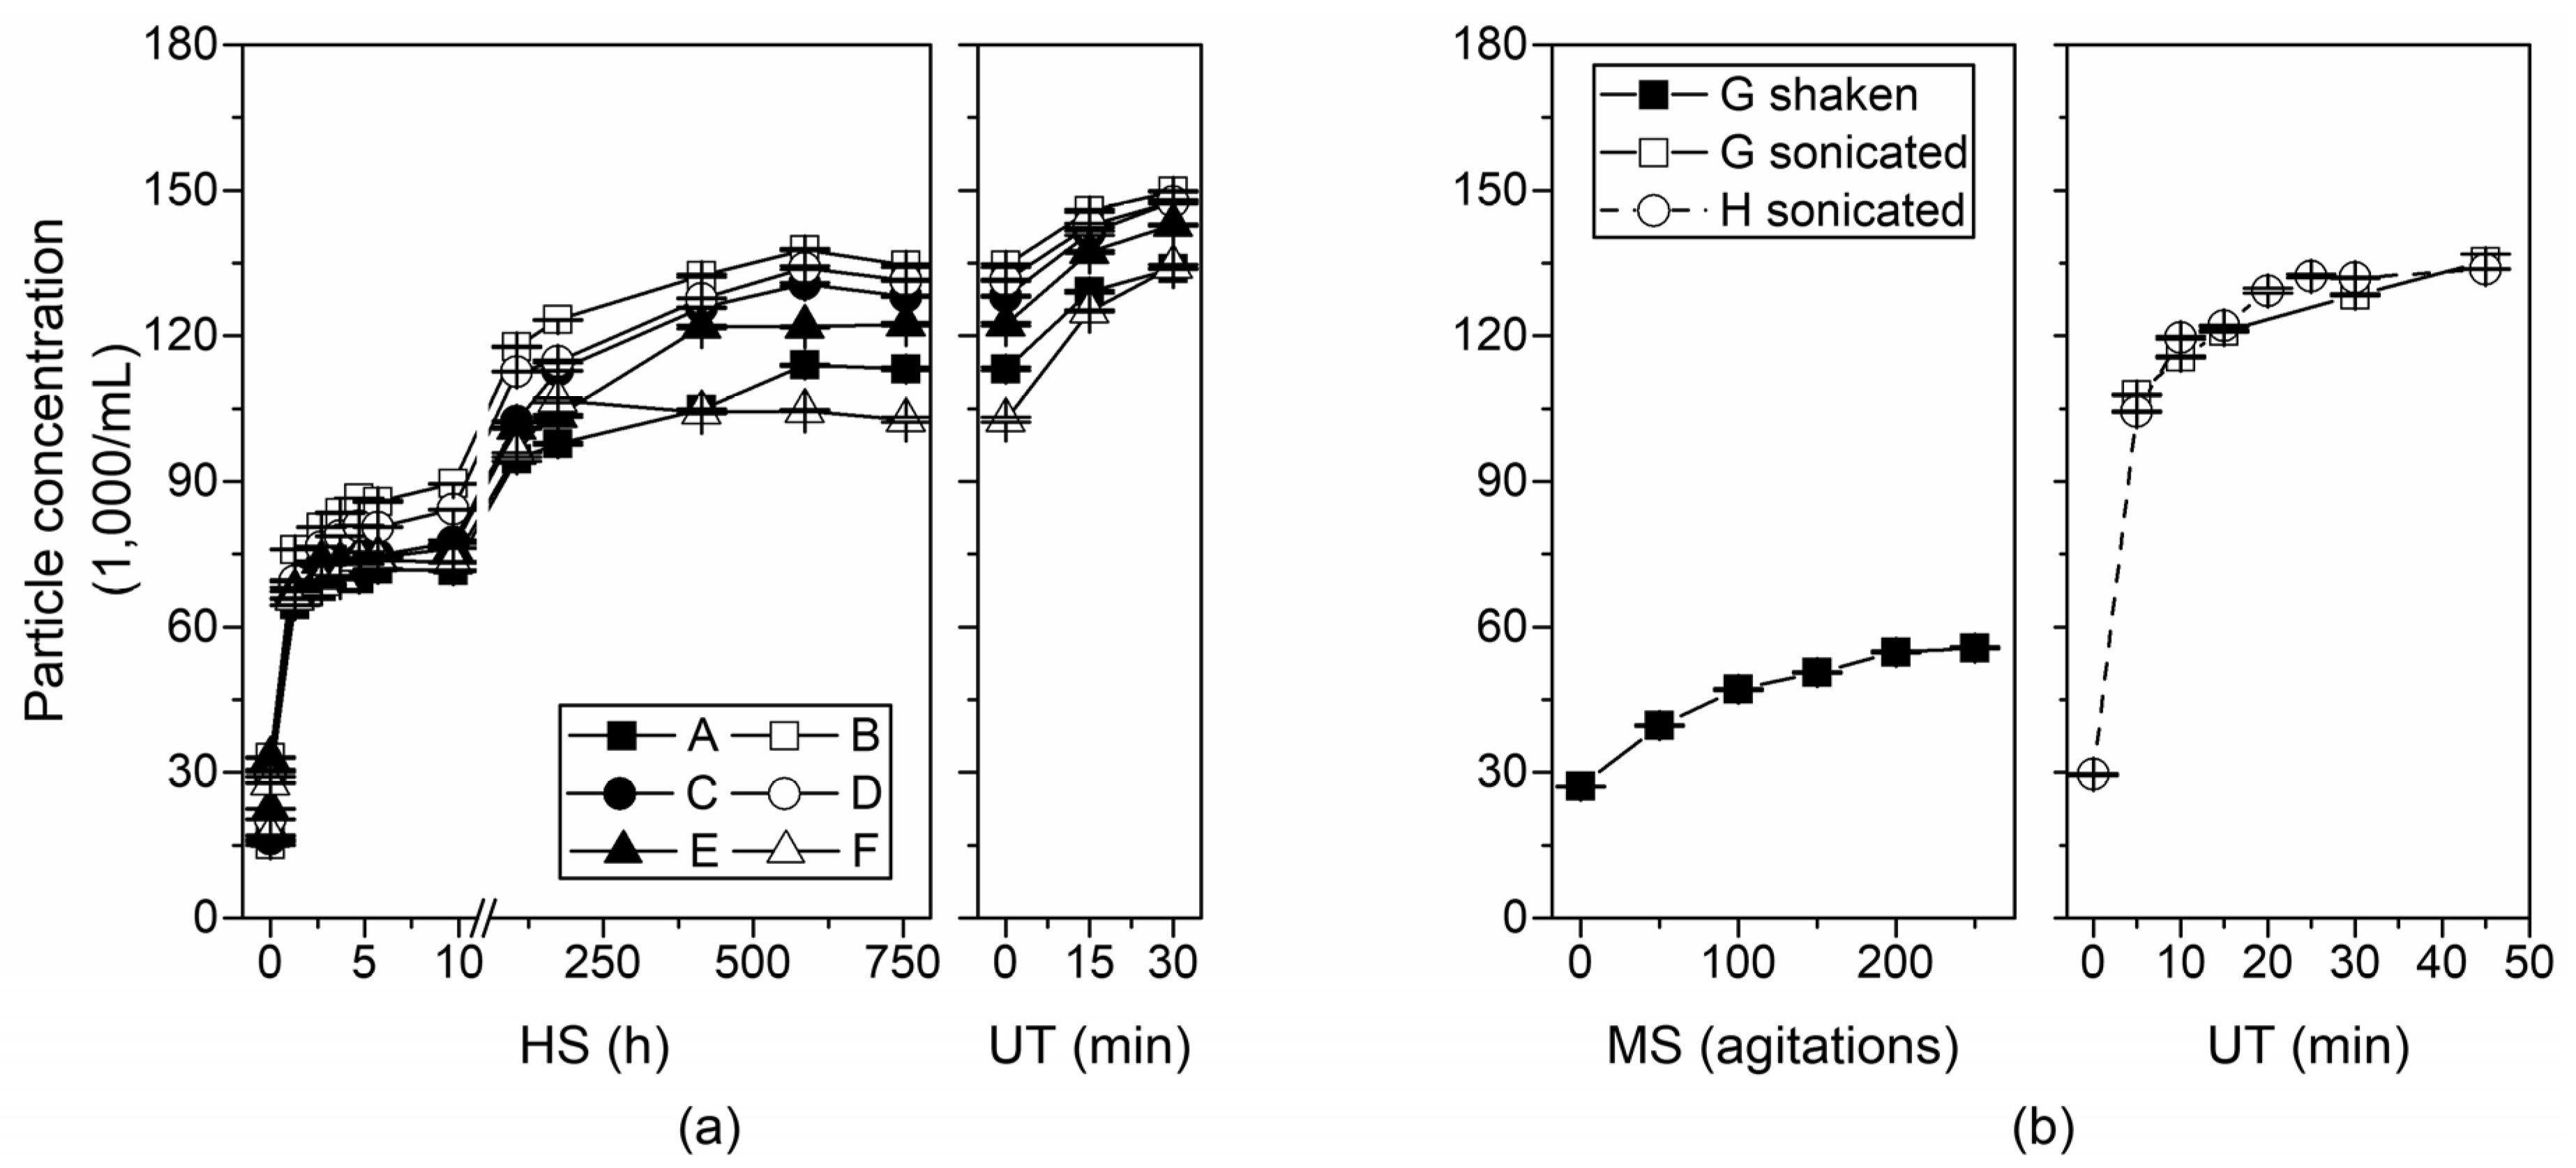
3.1. Horizontal Shaker vs. Ultrasonic Treatment

A set of six identically prepared batches was placed on a horizontal shaker for 754 h and particle concentrations were repeatedly measured (Figure 2a). After 754 h, the batches were treated ultrasonically twice for 15 min. Initial particle concentrations varied between 27,000 and 33,000 1/mL and increased to a plateau of about 102,000–134,000 1/mL after 410 h (mean = 120,000 1/mL, rel. SD = 9.1%). Additional horizontal shaking did not significantly increase particle numbers. Subsequent ultrasonic treatment, however, led to a further increase in particle numbers by 18% (mean = 143,000 1/mL) possibly due to deagglomeration of particles through higher shear forces compared to physical shaking. In addition, rel. SD decreased to 4.5%, equalizing the batches. Mean ED after 754 h was 104%, additional ultrasonic treatment decreased ED to 98%. Long-term horizontal shaking only resulted in a partial deagglomeration. This has to be seen critically since usual contact times of adsorption experiments are in the magnitude of 48–72 h [28,29] with even less efficient dispersion.

3.2. Manual Shaking vs. Ultrasonic Treatment

To analyze the effect of manual shaking compared to sonication, two batches (20 mg/L PS) were prepared. Initial particle concentrations of both batches were 25,000 1/mL after slight mixing. Batch G was then repeatedly shaken 50 times and measured up to 250 agitations (Figure 2b left diagram, full squares), then sonicated for a total of 45 min (Figure 2b right diagram, empty squares). Batch H (right diagram, empty circles) was directly sonicated without manual shaking.
Manual shaking of batch G reached 55,000 1/mL after 250 agitations with only a small increase in particle numbers. Sonication for 45 min increased particle concentration of batch G to 135,000 1/mL. After 45 min of sonication, batch H also reached a concentration of 133,000 1/mL. Manual shaking achieved an ED of 69% after 250 agitations. After ultrasonic treatment, batches G and H reached ED of 106% and 104%, respectively. Almost complete dispersion was reached after 25 min of ultrasonic treatment. Measurements at ultrasonic durations of 5, 10, 15, and 30 min show that manual shaking before sonication did not improve dispersibility. The final particle concentrations of both batches are almost identical after sonication, showing the reproducibility of ultrasonic treatment. This strongly emphasizes that manual shaking only is not a sufficient way of dispersing particles that tend to agglomerate.

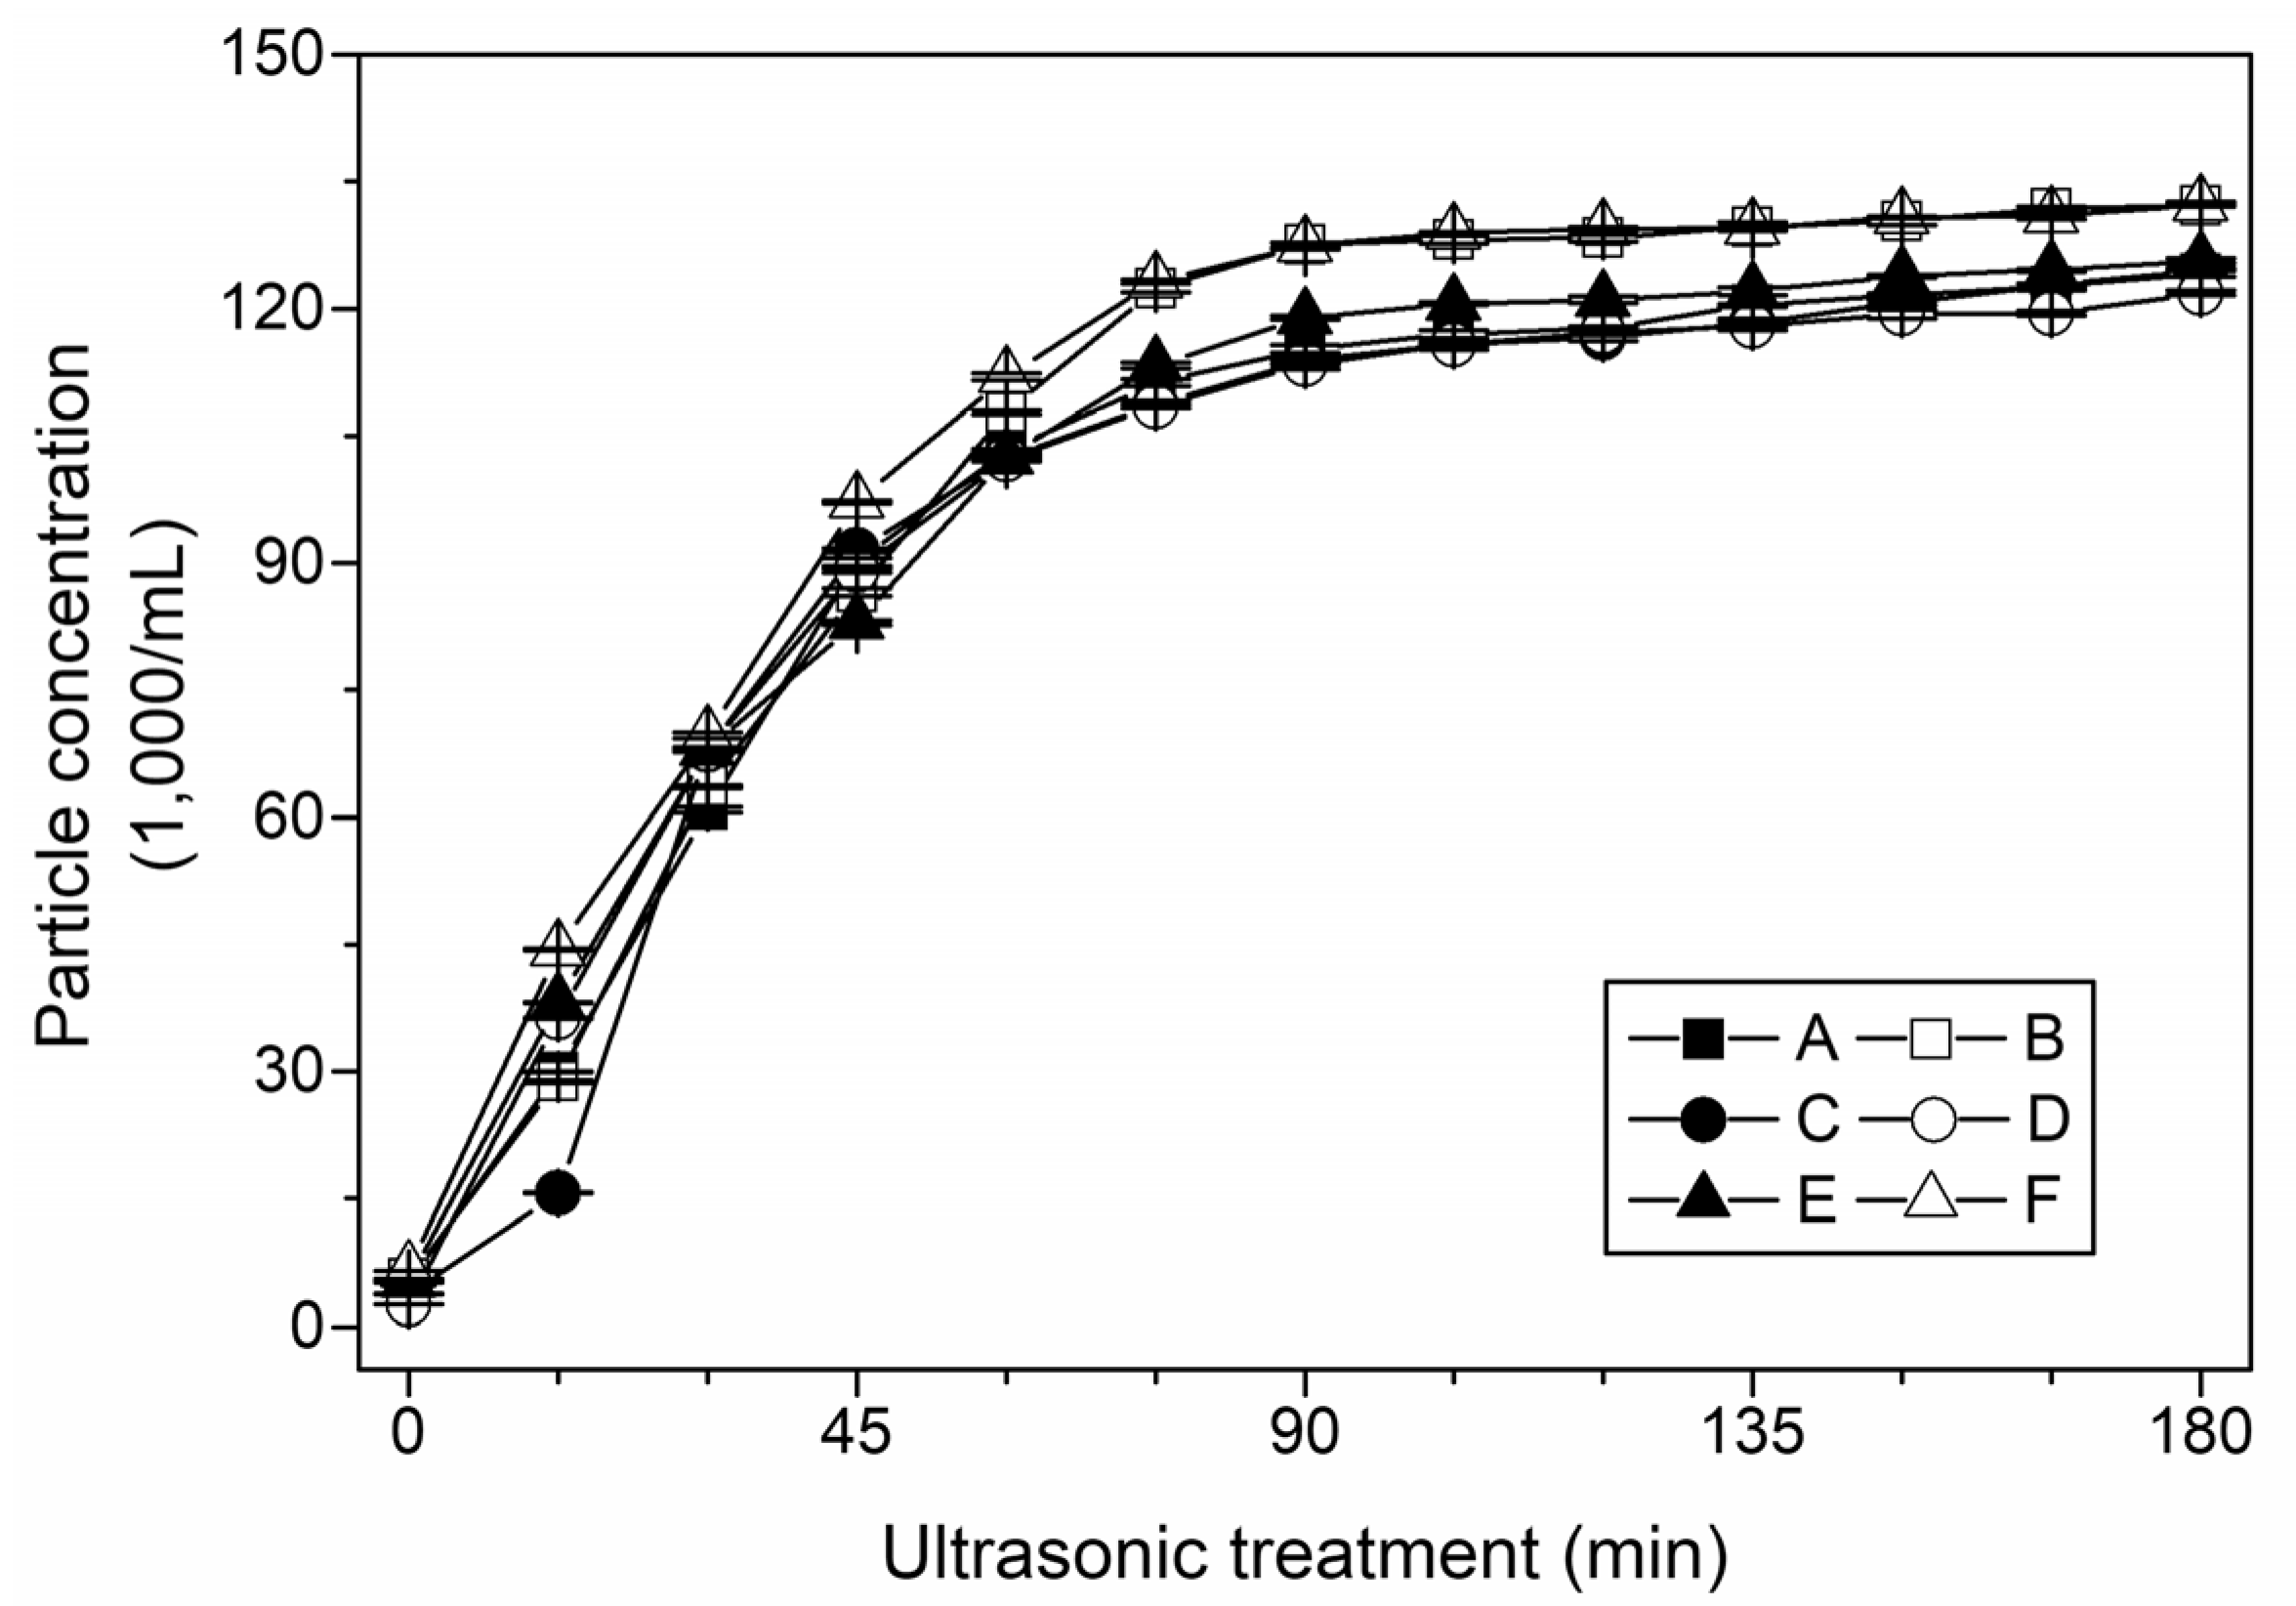
3.3. Reproducibility of Ultrasonic Treatment

Reproducibility of the dispersion preparation is an essential requirement. Therefore, a set of six batches (20 mg/L PS particles) was sonicated consecutively and particles were measured after every 15 min of treatment (Figure 3). Initial particle concentrations varied from 2600 to 6500 1/mL (mean = 4800 1/mL, rel. SD = 26.4%) without any treatment. Particle concentrations reached a mean of 120,000 1/mL with rel. SD of 3.5% after 120 min of sonication. An additional relatively small increase to 126,000 1/mL occurred after treatment for 180 min, indicating that ultrasonic treatment did not further erode particles. Ultrasonic treatment broke up agglomerates to a specific limit which is likely a function of applied power, as was suggested in another work [30]. This pre-treatment technique produced comparable dispersions, but attention has to be paid on the extent of interparticle bonding (which depends on material, size, shape and surface groups). In contrast to prior experiments, the discrepancy between the batches after 30 min is greater compared to the batch from Figure 2b (right diagram) and full dispersibility was reached within 90–120 min. The mean ED after 90–120 min was 125%, which implies an overestimation of the suspended solid volume.

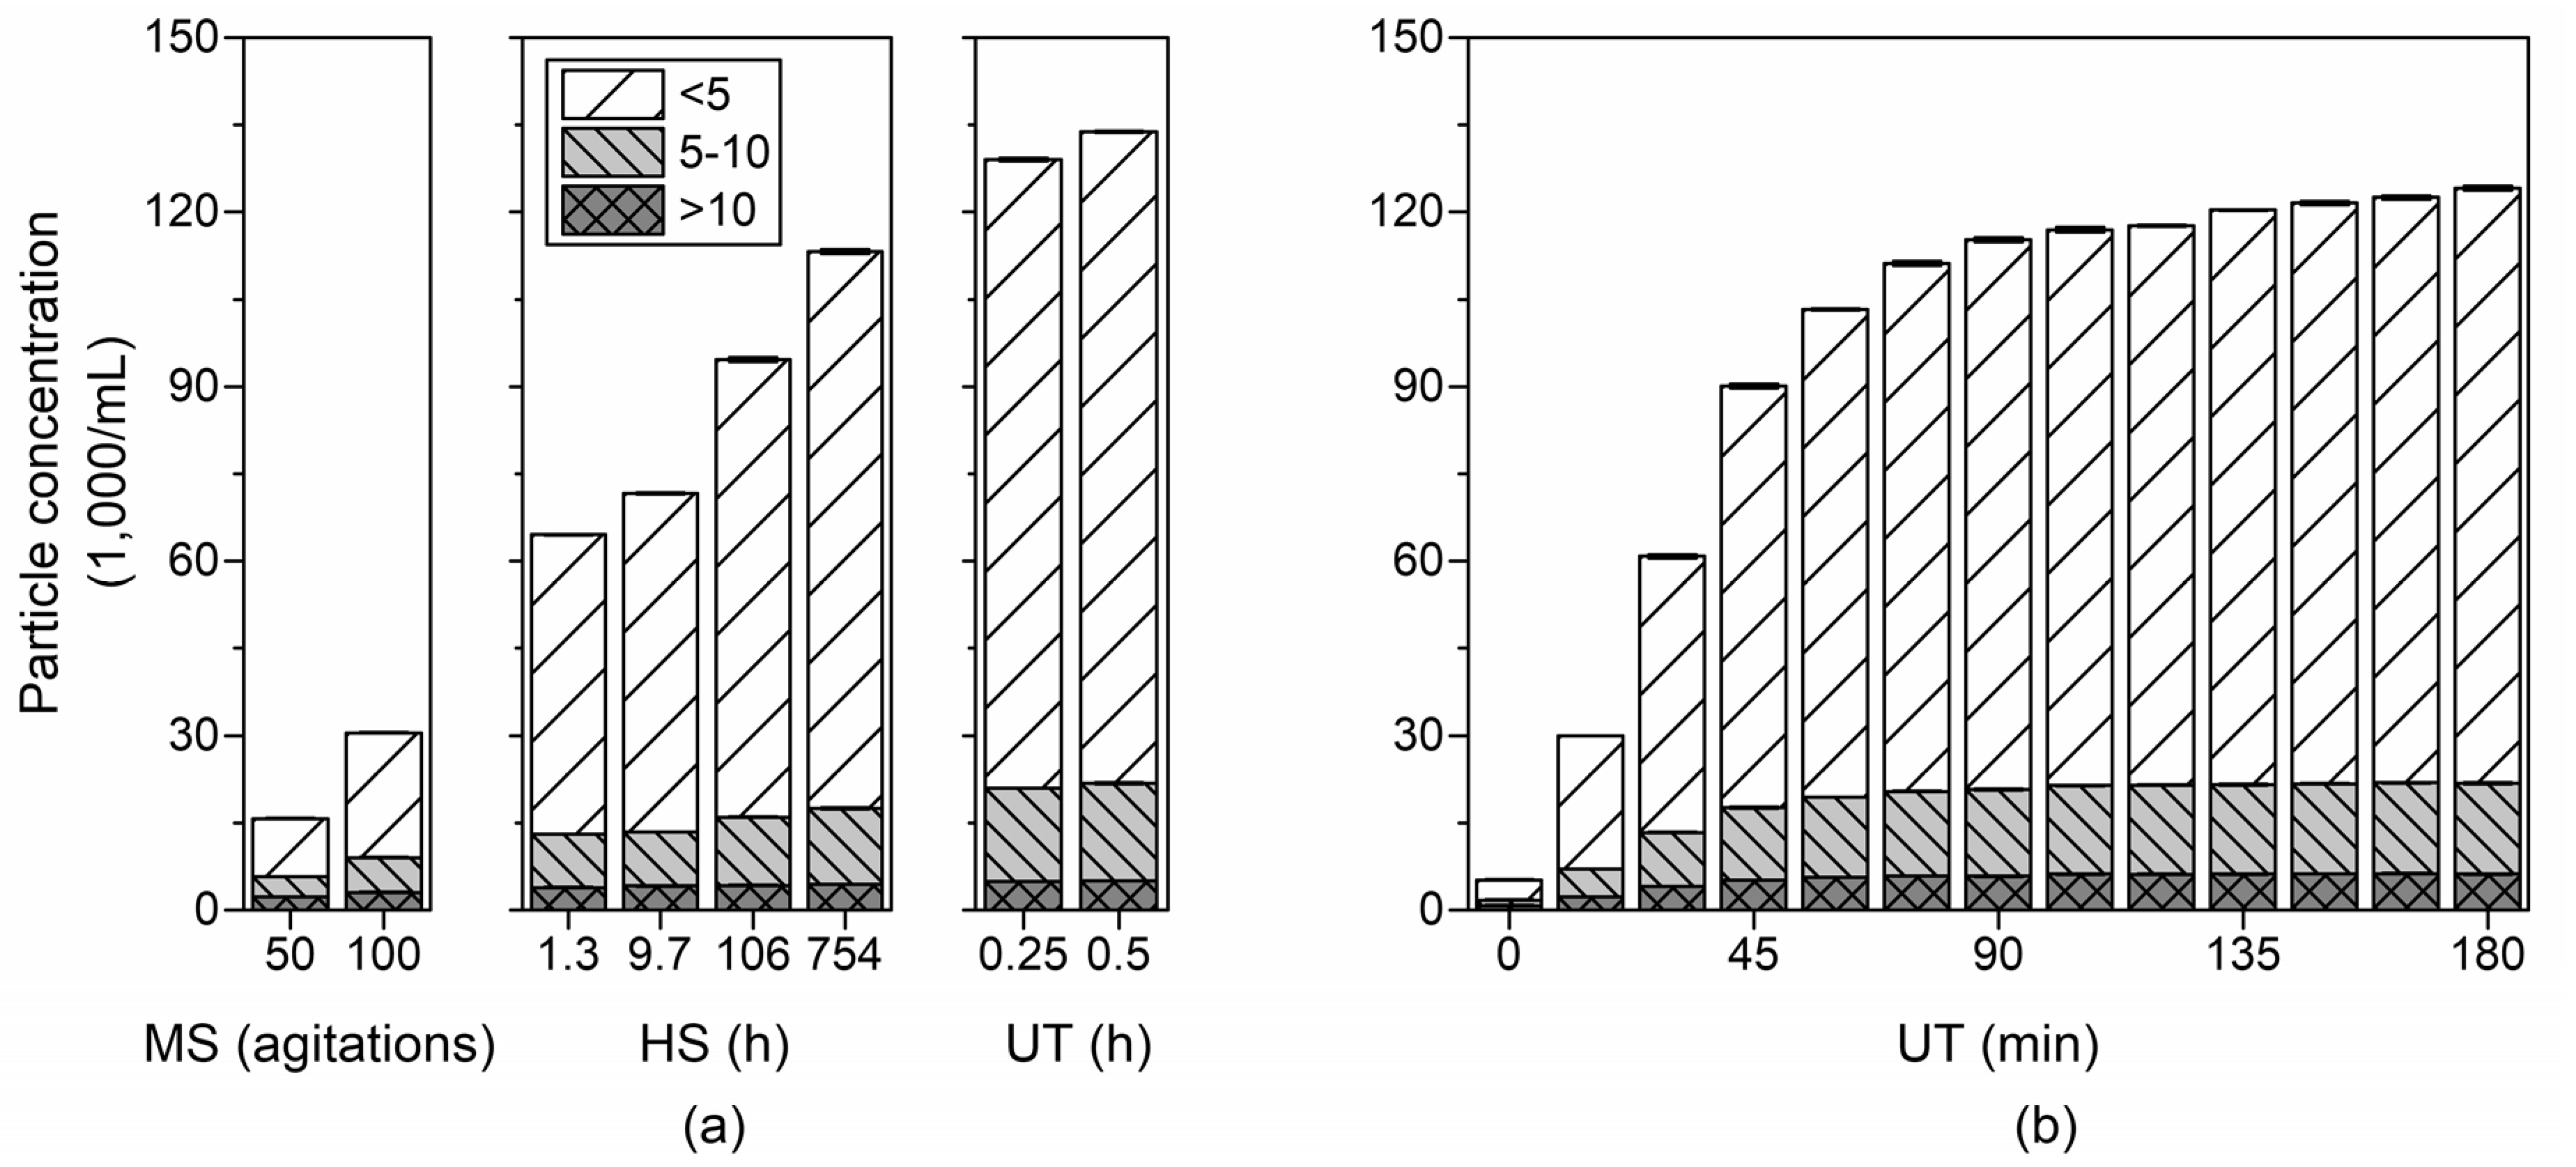
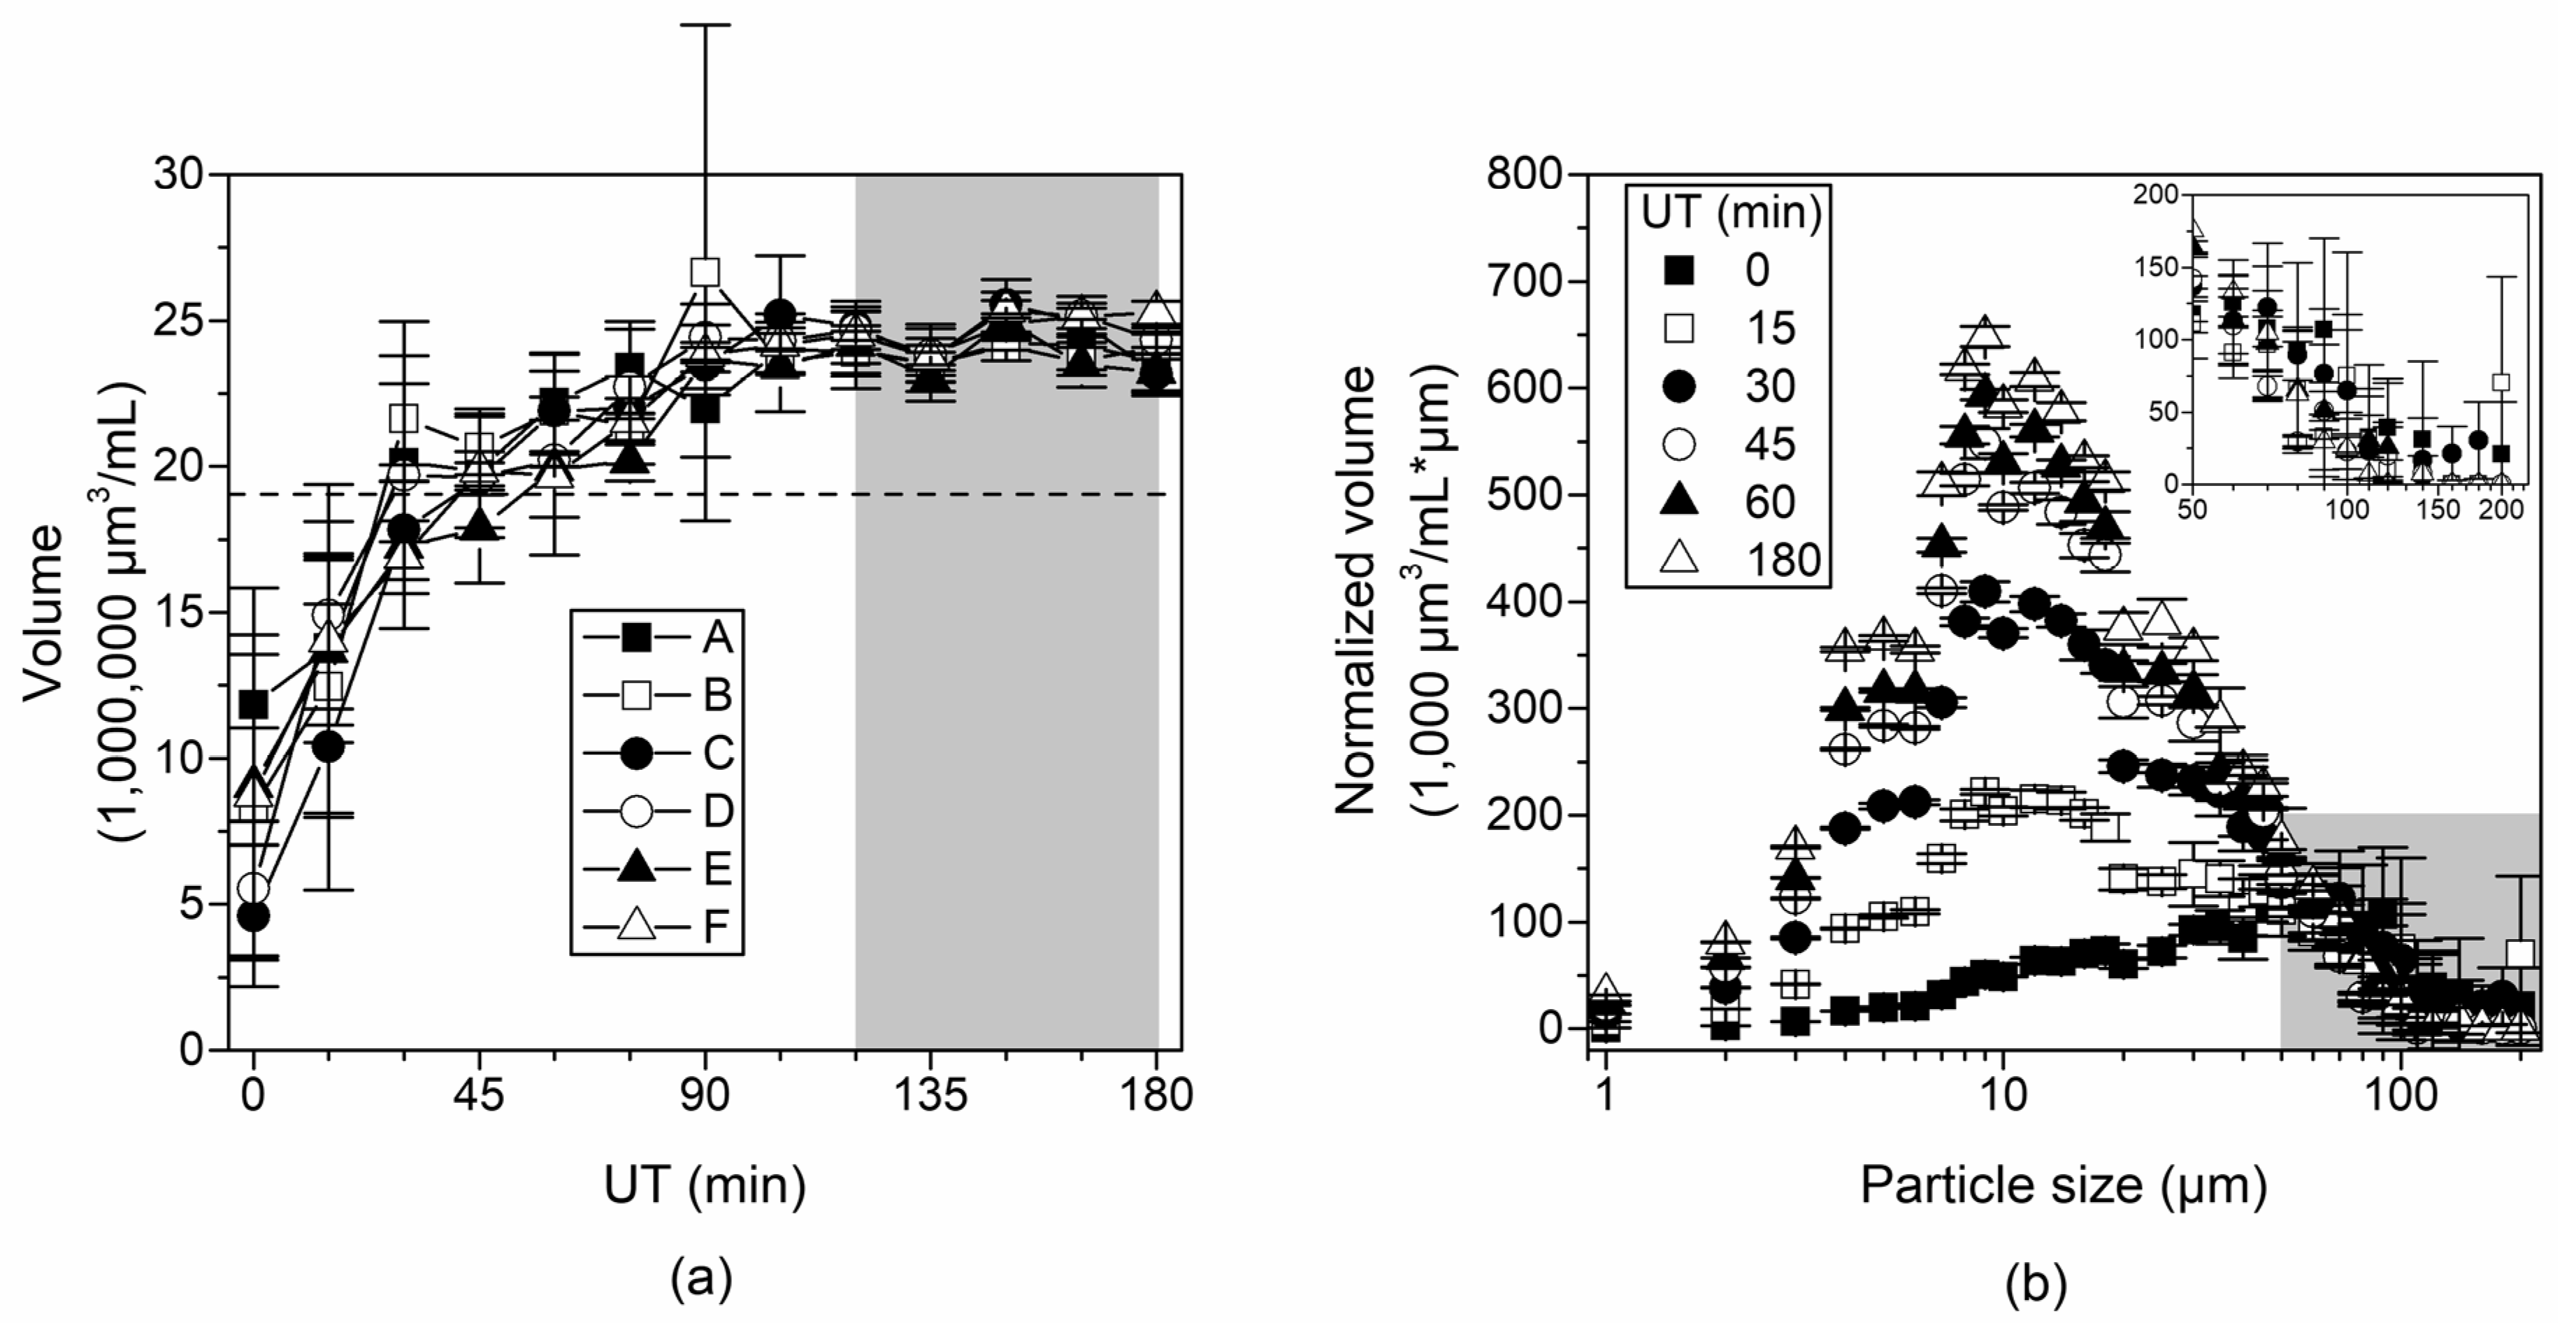
3.4. Changes in Particle Size Distribution

To identify changes in the particle composition through deagglomeration, the particles were grouped into the size fractions <5, 5–10, and >10 µm, since the majority of particles detected are well below 10 µm in size. As can be seen from Figure 4a, physical agitation increased the particle numbers of all size fractions (data shown here are for batch A of the horizontal shaker experiment, but similar outcomes were achieved with all other batches). The increase in the size fraction <5 µm is considerably larger than in the other two size fractions and increased from around 63.5% after 100 agitations by manual shaking to 83.7% after 754 h automated shaking and 0.5 h ultrasonic treatment. The proportion of the fractions 5–10 and >10 µm in size decreased from 22.0% and 14.5% to 12.6% and 3.7%, respectively.
For sonication, the first minutes of ultrasonic treatment sufficed to increase numbers of dispersed particles and greatly change particle composition (Figure 4b, data shown for batch A). Particle numbers of the fractions 5–10 µm and >10 µm did not further increase after 90 min of ultrasonic treatment, whereas a slight increase for the fraction <5 µm was observed.
Before ultrasonic treatment, the size fractions <5, 5–10, and >10 µm made up 66.5%, 18.6% and 14.8% of all particles, respectively. After 30 min, the size fraction ratios changed to 78.1%, 15.2%, and 6.7% for <5, 5–10, and >10 µm, respectively. Subsequent ultrasonic treatment increased the number of particles but only led to minor changes in the size composition. The size fractions after 180 min ultrasonic were 82.5%, 12.5%, and 5.0% for <5, 5–10, and >10 µm, respectively. In terms of dispersion characterization, horizontal shaking and sonication lead to a similar dispersion composition (see Figure 4a,b). The initial increase in particle concentrations was caused by deagglomeration of larger particles with weak coherence and the number of particles of fraction <5 µm increased, whereas particle numbers of the two larger fractions decreased with increasing treatment time. Further disintegration of larger particles or agglomerates could not be shown since the number of larger particles/agglomerates (fraction > 10 µm) remained constant. This is in accordance with Meissner et al. [31], who reported no further deagglomeration/disintegration visible after thorough sonication of carbide nanoparticles.

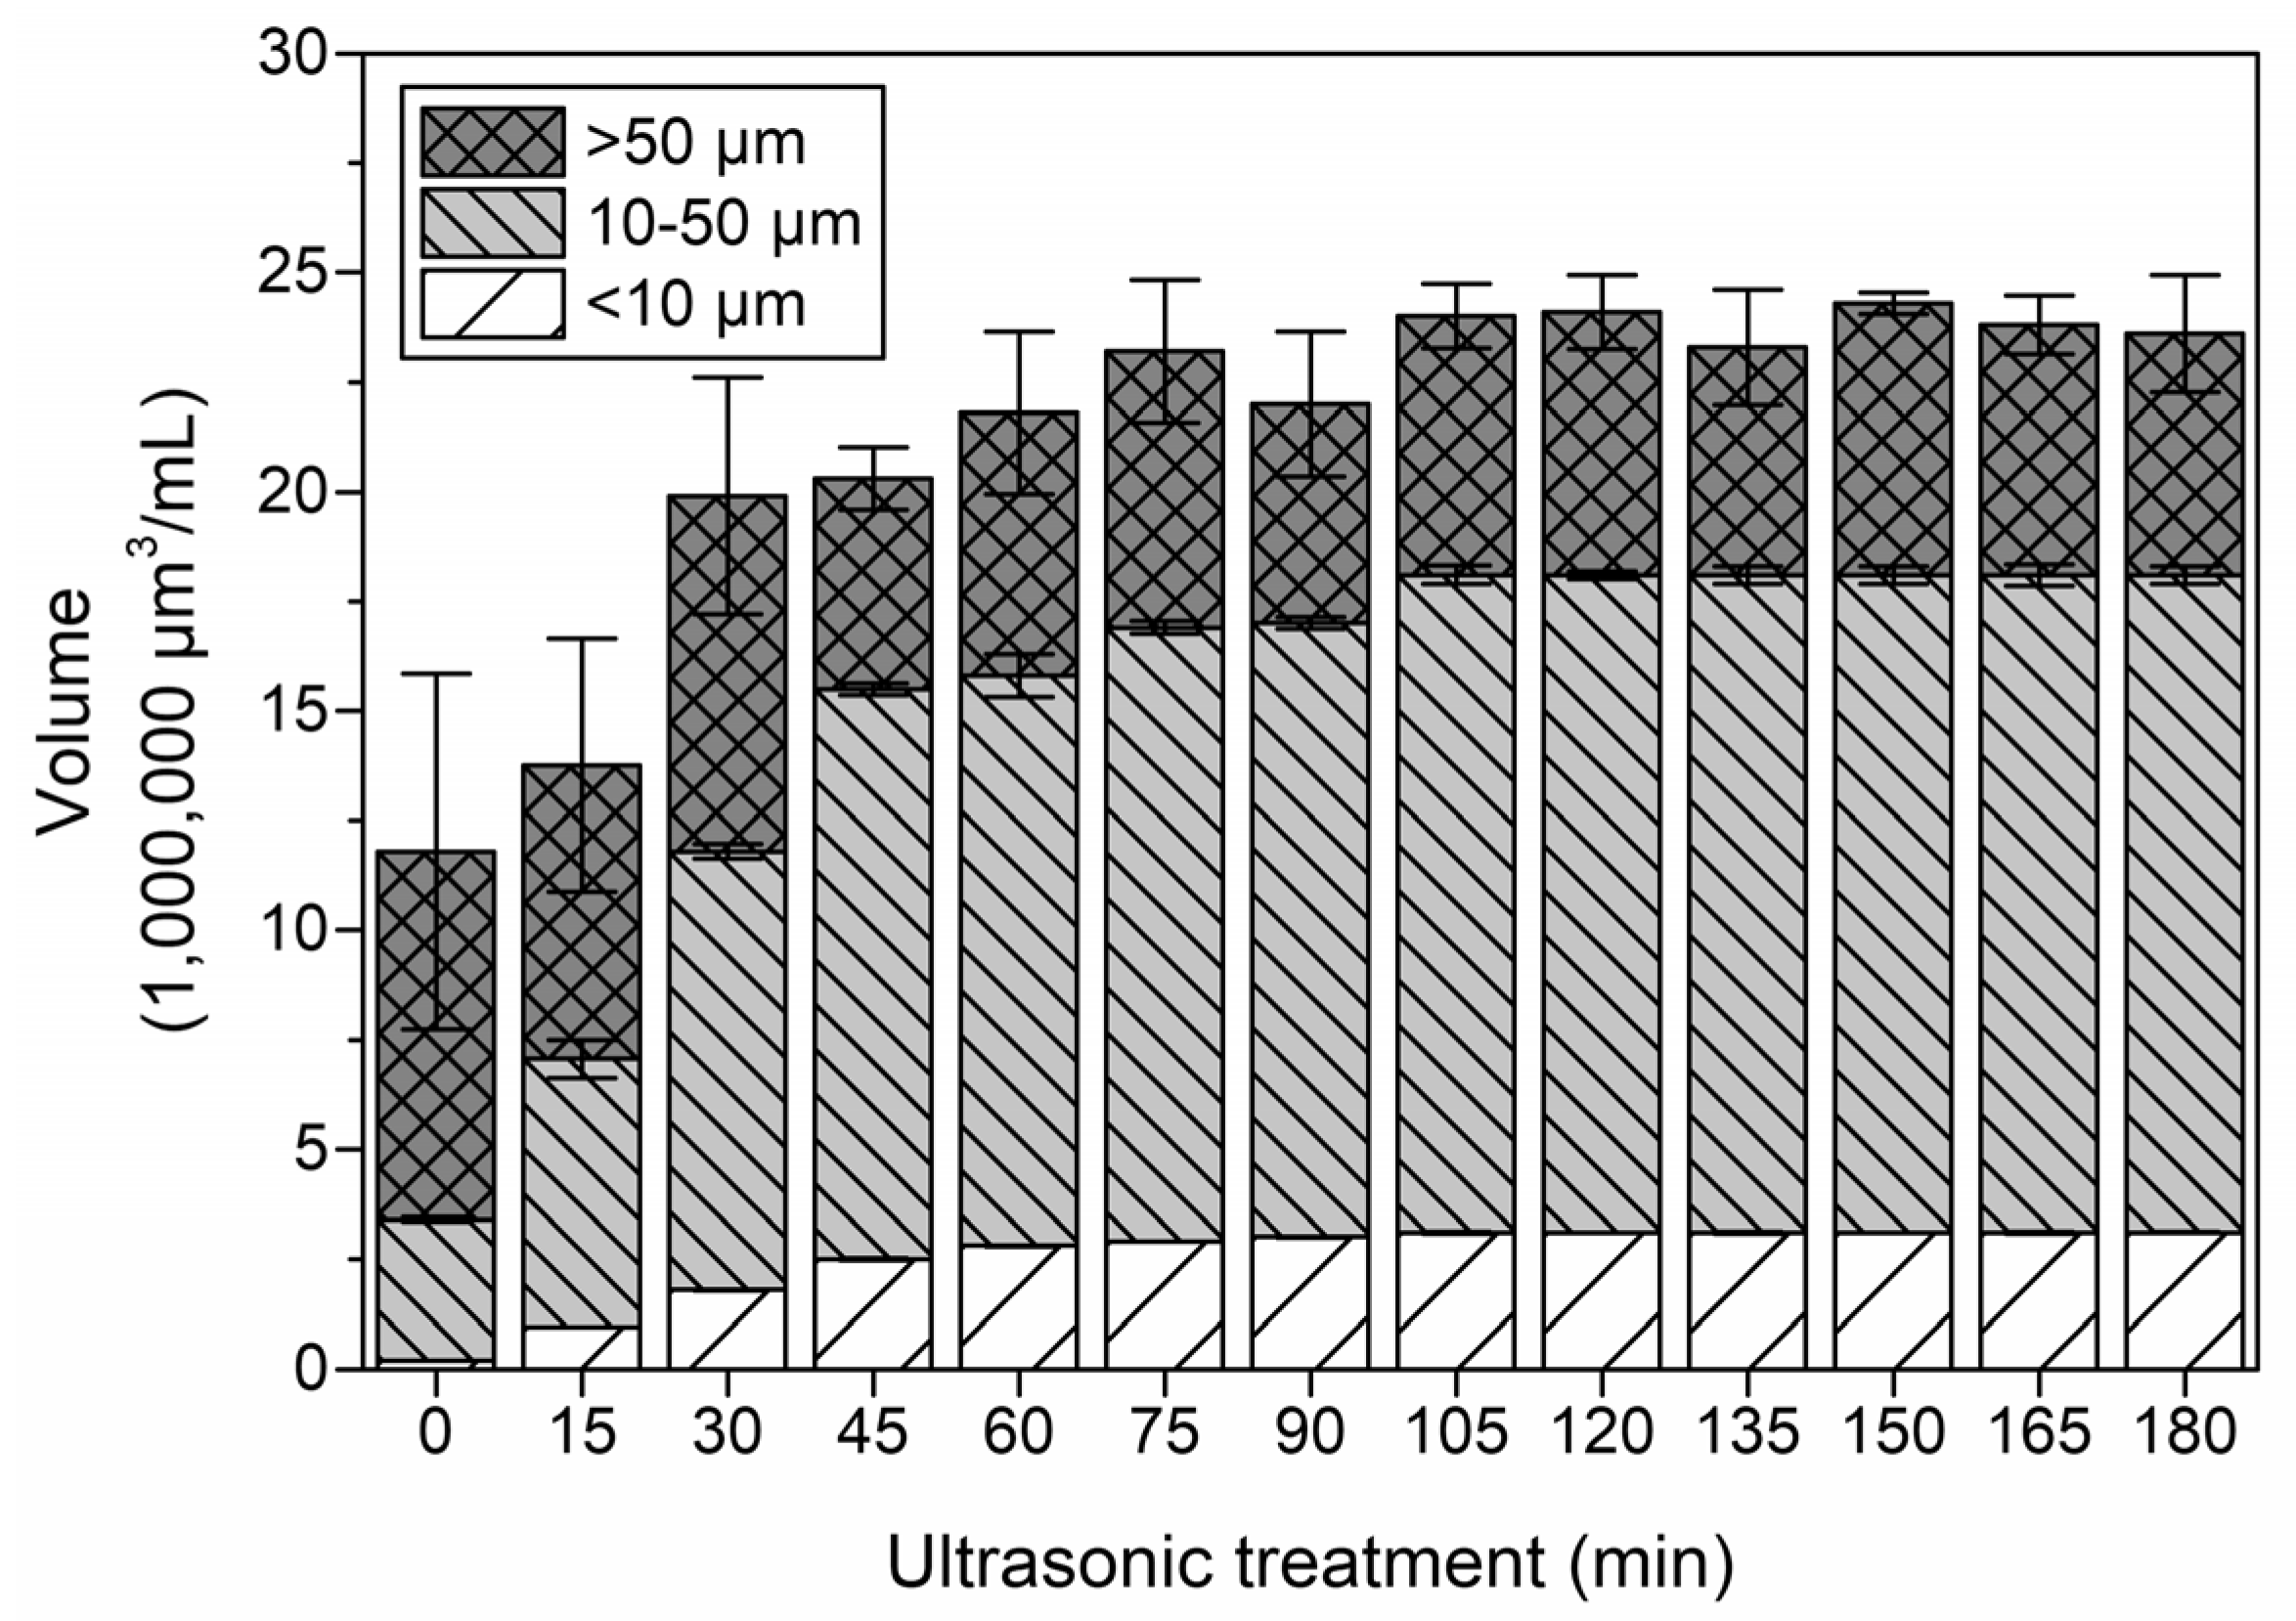
3.5. Changes in Calculated Volume Distribution during Ultrasonic Treatment

As additional criteria for dispersion efficiency, suspended solid volumes were calculated from particle numbers of each measurement channel. After 90 min of sonification, the calculated volume did not further increase (Figure 5a). However, values from 90 to 180 min are scattered due to a few larger particles still present in the batch which greatly affected the total calculated volume (which can also be seen in Figure 6). The calculated particle volume of sonicated samples from ultrasonic experiments increased to a mean of 24.1 × 106 µm3/mL (calculated from values 120–180 min) with rel. SD of 3.2%, whereas the total theoretical suspended volume of the PS is 19.6 × 106 µm3/mL. ED calculated with the mean volume of 120–180 min was therefore 127%, which indicates that calculation of the volume overestimated the volume in dispersion.
To identify the cause of the increase in total suspended solid volume, the contributing volume of each measurement channel is shown in Figure 5b. All channels up to 50 µm contribute to the increase in total volume of 180 min of ultrasonic compared to the distribution after 15 min of ultrasonic treatment. A decrease in the volumes of particles >50 µm can be noted with prolonged treatment (see inset diagram). Since total volume of particles <50 µm increased it can be concluded that breakdown of larger particles occurred mostly for particles >50 µm.
To further elucidate the changes in volume, Figure 6 shows the volume of batch A during ultrasonic treatment of 180 min grouped into three size fractions, <10, 10–50, and >50 µm. The untreated sample had a low initial volume which increased with further treatment. The fractions <10 and 10–50 µm increased from 1.6% and 27.4% of the total volume to a share of 13.3% and 63.4%, respectively, whereas the fraction >50 µm decreased from 70.9% to 23.3%, as was mentioned before. Size fraction <10 µm remained relatively constant after 60 min of treatment, and size fraction 10–50 µm remained constant after 105 min. The volume of particles >50 µm, however, showed strong fluctuation over the whole treatment duration. These larger particles/agglomerates were not disintegrated with ultrasonic treatment, explaining the fluctuations in total calculated volume.

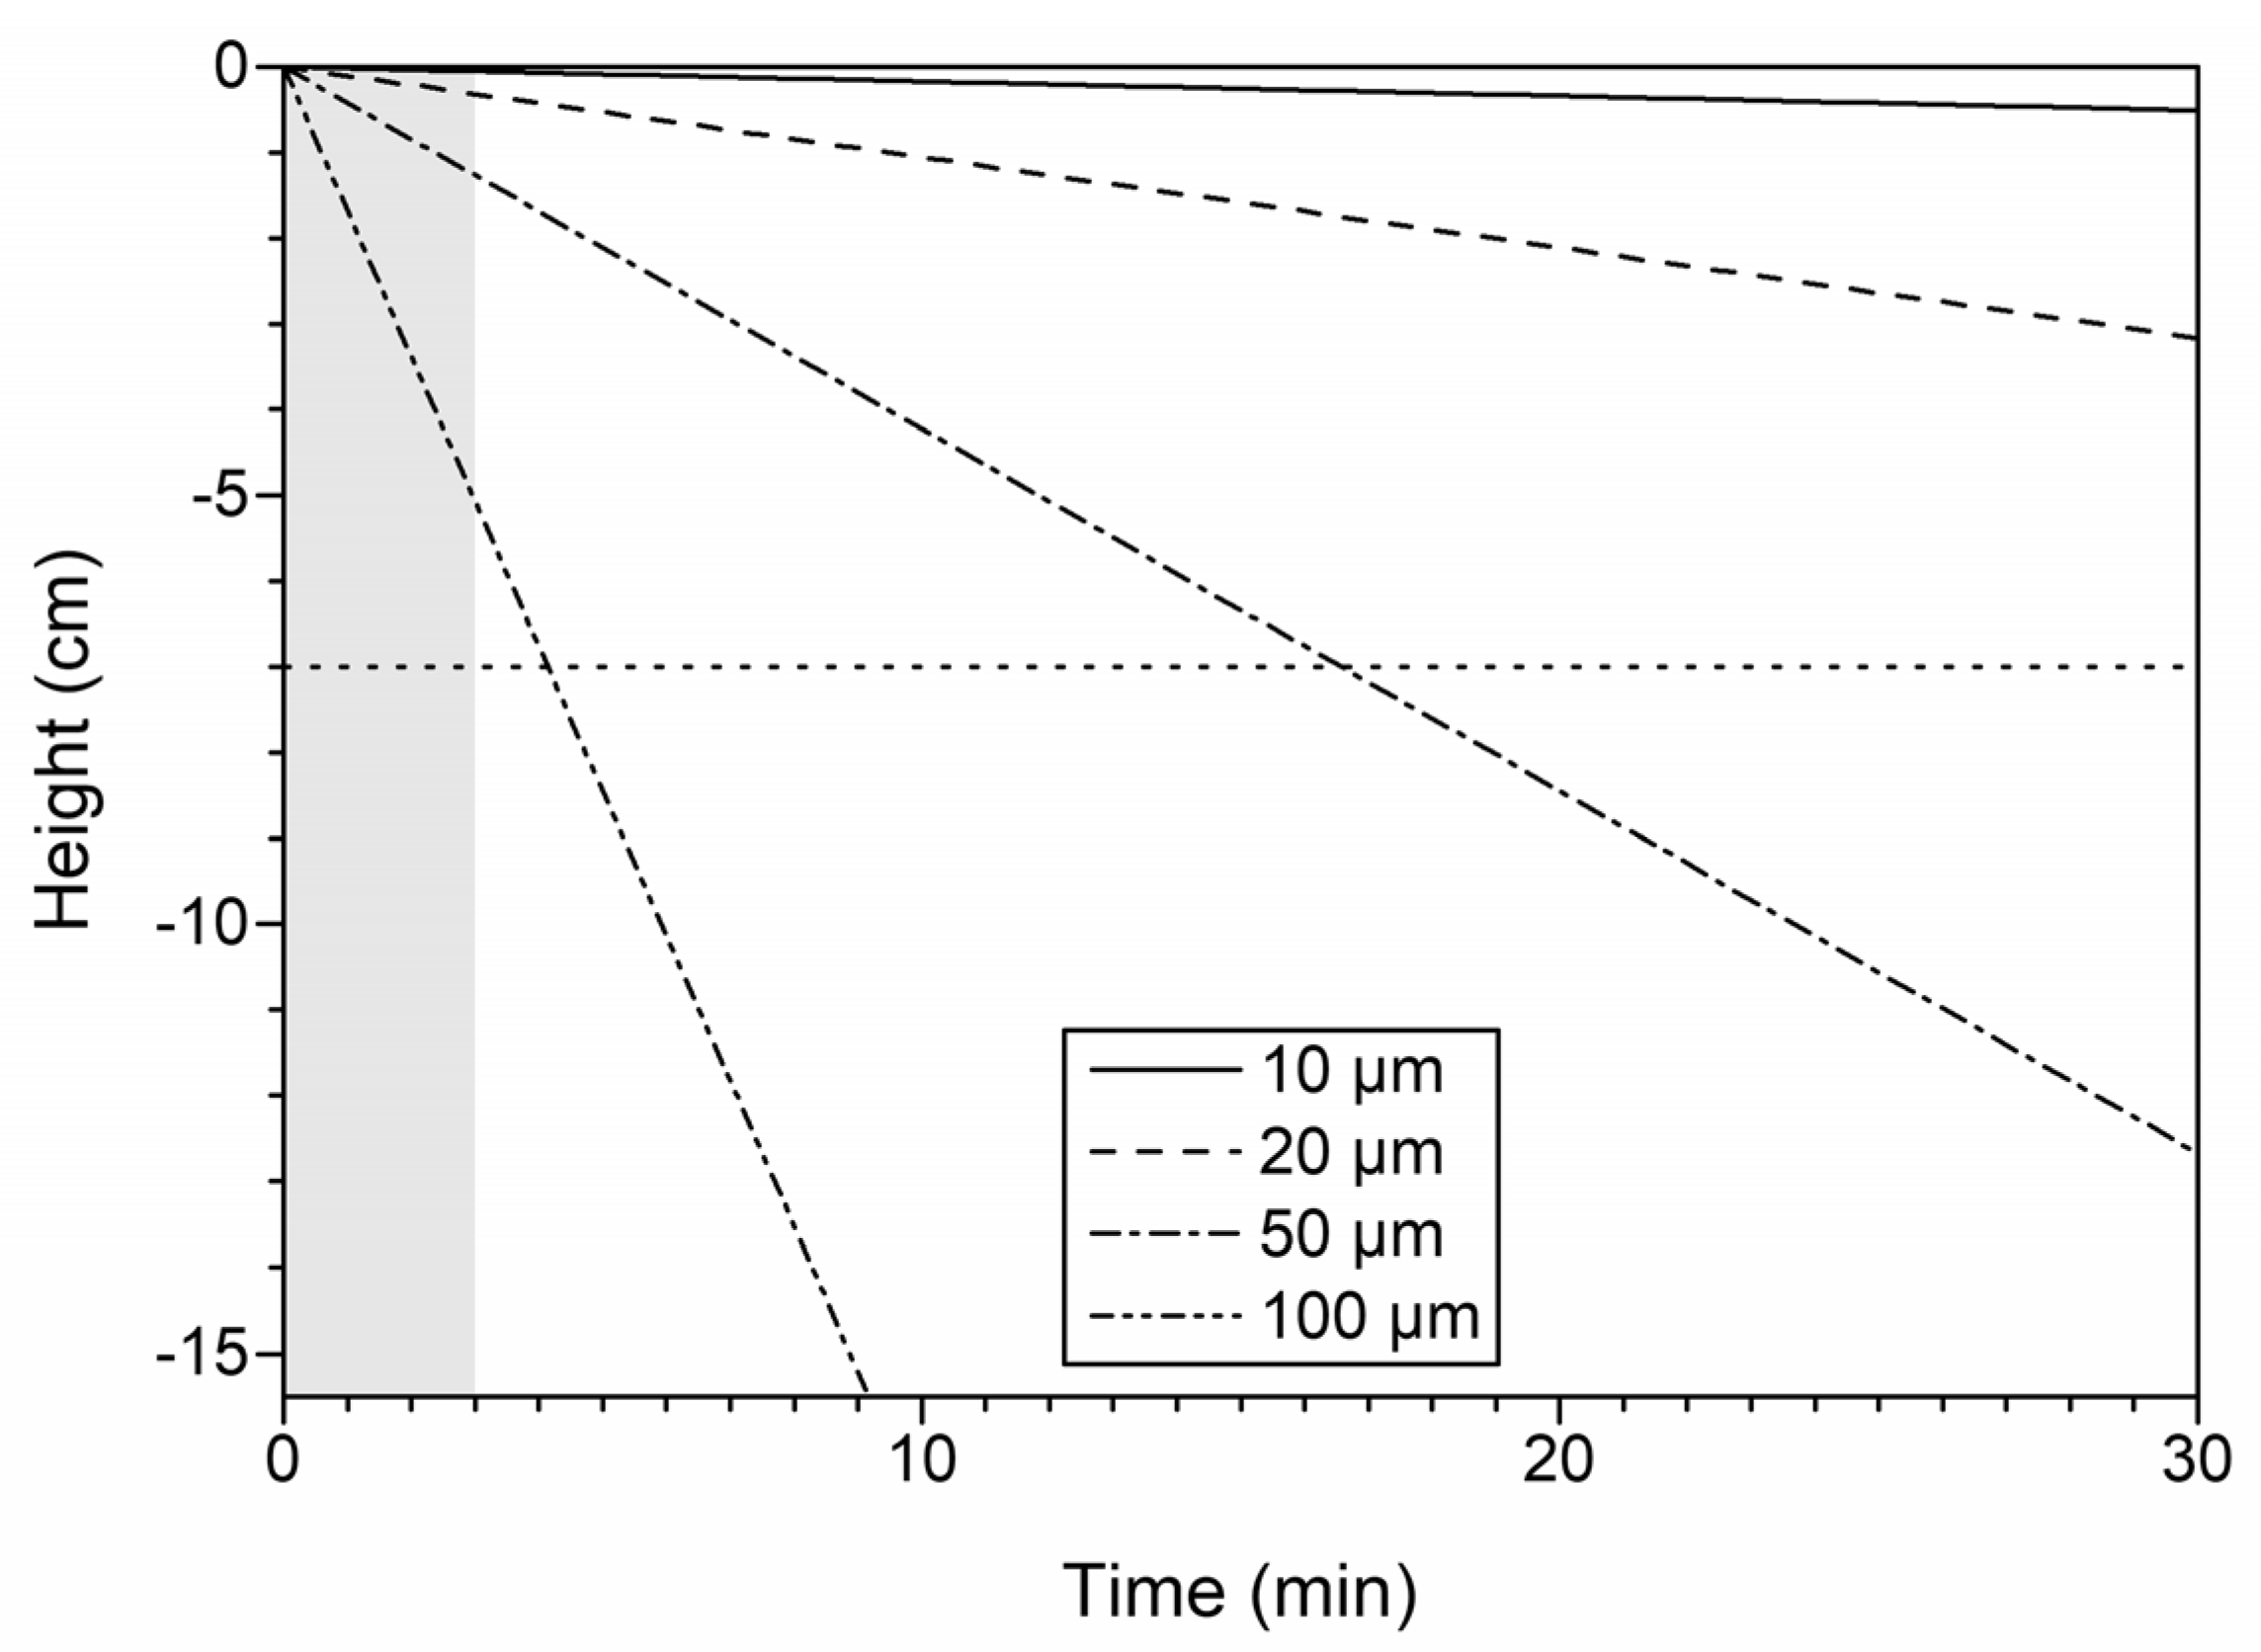
3.6. Settling of Particles after Ultrasonic Treatment

Small particles of a fully dispersed solution should follow Stoke’s law for settling and not re-agglomerate over time. Therefore, the settling behavior of a dispersion (20 mg/L PS particles, 180 min sonicated) was monitored for one week (SI, Figure S3). Particle concentration decreased from 173,000 1/mL to 124,000 1/mL over 168 h (=30% decrease). Settling was the main process of particle loss and, as expected, larger particles >10 µm settled faster and were not present in the dispersion anymore after 168 h (SI, Figure S4). Interestingly, particles of 3 µm diameter or larger should have settled after this time according to Stoke’s law—however, still 20% of all particles were of this size category (data not shown). No agglomeration could be monitored since volume of all size fractions decreased over time (SI, Figure S5).

3.7. Environmental Implications

Virgin PS particles are hydrophobic and do not independently disperse in water. The experiments showed that an enormous energy input is needed to fully disperse virgin PS particles if no other processes such as biofilm formation, adsorption of organic matter or weathering are involved. Through this energy input, larger agglomerates broke up into smaller particles and the average particle size decreased. Particles were stabilized for more than 168 h and a fraction of particles between 3 and 10 µm did not settle, contrary to calculations with Stoke’s law.

4. Discussion

The aim of this study was to evaluate an additive-free method to disperse model MP particles in water to realistically depict concentration-effect relations of MP particles. Primary MP particles released into the environment most likely start out as a hardly dispersible material, as with the model particles used in this study, and the dispersion of these is still unknown. Therefore, the preparation of these virgin MP particle dispersions for laboratory studies is important to understand the behavior and fate of virgin MP particles in the environment. Using ultrasonic pre-treatment for cryomilled pristine polystyrene particles, reproducible dispersions of 20 mg suspended solid per liter were obtained. The physical particle interactions induced by the ultrasonic bath after 90 min effectively dispersed particles, while no substantial increase in dispersed particle numbers was observed with longer treatment. With further sonication, the number of particles >50 µm fluctuated while particle numbers <50 µm remained constant, showing that ultrasonic treatment did not further disintegrate PS particles. Ultrasonic treatment as a dispersion technique thus increased the numbers of particles in the dispersion and ensured the availability of particles for possible interaction. After 24 h, around 70% of the particles of a dispersion (180 min of ultrasonic treatment) were still in dispersion.
In contrast to ultrasonic treatment, long-term horizontal shaking and manual shaking did not suffice for fully dispersing all particles. Dispersion efficiency was 127%, 104%, and 69% for ultrasonic treatment (180 min), long-term horizontal shaking (754 h) and manual shaking (250 agitations), respectively. This is in accordance with a similar study implementing nanosized silica and alumina particles in which ultrasonic homogenization as well as stirred media milling proved most effective for deagglomeration [32]. ED values of above 100% indicated that the presumption of spherical shape for cryogenically produced particles is a simplification, as cryomilled particles are more shard-like fragments [5]. This overestimated the calculated volume of measured particles when using the Feret diameter given by the particle counter, which was only partly counteracted by using the lower boundaries of the measurement channels.
Using alkaline ultrasonic treatment van der Esch et al. [3] reported stable dispersions with aged MP but with a high variability (1,5 log-orders) in particle concentrations. For PS, the toxicologically interesting fraction <20 µm ranged from 40 to 80% within three replicates. This emphasizes the need for appropriate production of particles and pre-treatment for dispersions. Chung et al. [30] reported a maximum dispersing effect after 20–30 min for zinc oxide nanoparticles using ultrasonic baths. Although the materials and therefore binding forces are not directly comparable, a maximum was also found in this study for ultrasonic dispersion after 90 min. Treatment times can possibly be shortened by using a higher input power; however, the potentially achievable deagglomeration is a function of output power of the ultrasonic device and two different ultrasonic devices need to be cautiously compared.
Van der Esch [3] reported eroded surfaces on 1 cm2 polystyrene squares cut from larger sheets and additional FTIR-bands mimicking weathering processes in the environment. We did not investigate changes in the morphology through radical attack during sonification. Such changes were not expected since the duration of ultrasonic treatment was much shorter (180 min compared to 15 h) and pH (unbuffered) was around 5.5 (van der Esch: pH = 13). Therefore, surface oxidation during sonication in this study is unlikely. Nevertheless, it needs to be discussed whether polymers pre-treated in an ultrasonic bath even for short periods can still be regarded as pristine if the surface of particles is potentially altered.
Another challenge in dispersion preparation is the weighing-in: a precise execution is difficult due to fine powder in the µm area, low density materials and potential electrostatic forces. Air drafts and charged surfaces of laboratory equipment can easily carry away the finer fraction of polydisperse powders. The particle concentration of six batches of identical weight-in particles still showed a rel. SD of 3.5% after 180 min of ultrasonic treatment. We therefore suggest preparing a more concentrated dispersion which has to be thoroughly treated with ultrasound before further dilution to targeted concentrations.
Concerning the stability of dispersions, no agglomeration behavior could be observed in a dispersion after 168 h. This was expected since larger particles settled quickly while smaller particles apparently remained as single particles in dispersion. Settling could have been disturbed by the high number of particles in dispersion, this would explain particles of the size 3–10 µm still present in the water column after 168 h. The settling of irregularly shaped particles does not necessarily follow Stoke’s law applied on spherically shaped objects, as is the case for natural colloid aggregates [33]. Ultrasound treatment is therefore suitable for pre-treatment of PS particle dispersions for eco-toxicological studies since the stabilized particles are available for possible ingestion by aquatic species. Nevertheless, the results point out the reluctance of microplastic particles to behave as predicted by models—in laboratory studies as well as in environmental sampling.
Delmas and Barthe [34] claimed that addition of surfactant for stabilization is still required after the use of ultrasound to stop agglomeration; however, this type of interparticle bonding is weaker after ultrasonic treatment rendering the use of surfactant more effective. Whether the use of surfactant is still required needs to be decided depending on the experiment. The time-dependent stability of dispersions (the tendency to agglomerate) has to be evaluated individually for each experimental setup since particle size and surface chemistry are key factors in agglomeration processes. This is an important issue for toxicological studies as well as the transport behavior of particles during experiments. Regarding a potential stability of over 168 h through ultrasonic treatment, we do not suggest the use of surfactants for microplastic experiments due to possible side-effects, as stated above by some other authors.
In the environment, the dispersion of virgin MP particles through energy input could be achieved by strong currents and turbulence in rivers and other surface waters. Other processes influencing the stabilization of virgin MP particles in natural environment include biofilm formation, adsorption of organic substances and weathering. Once stabilized, these particles are mobile and do not necessarily settle according to model calculations. As a consequence, MP particles are found throughout the water column and not only in the sediment, aggravating possible remediation techniques. The removal of virgin MP in wastewater treatment plants thus seems to depend on inclusion in flocs or foams. Further research needs to focus on the concurrence of environmental processes contributing to the stabilization of virgin MP particles and the resulting behavior in water to evaluate target-oriented measures to remove MP particles from the environment.
This study provides valuable insights for research groups working with model suspensions. Basic understanding of the behavior of model particles in aqueous suspensions is one of the pre-requisites for systematic research and the transfer of laboratory investigations to environmental research outcomes.

Supplementary Materials

The following are available online at https://0-www-mdpi-com.brum.beds.ac.uk/2073-4441/12/12/3436/s1, Figure S1: Calculated volume of six batches (A–F) of 20 mg/L polystyrene particles during ultrasonic treatment. Batches were repeatedly placed for 15 min in ultrasonic bath and particle numbers measured through light extinction; Figure S2. Calculated volume per size channel of batch ‘A’ during 180 min of ultrasonic treatment. Values were non-normalized compared to Figure 5b; Figure S3. Particle settling of a 20 mg/L polystyrene dispersion which was left to settle for one week and only moved for measuring purpose. Inlay shows particle concentration during the first two hours. Dispersion was prepared with 180 min of ultrasonic treatment. Sample was measured in triplicate; Figure S4. Size fractions of long-term particle settling dispersion (20 mg/L polystyrene) with 180 min of ultrasonic treatment. Sample was measured in triplicate; Figure S5. Calculated volume of a long-term particle settling dispersion (20 mg/L polystyrene) up to 180 min of ultrasonic treatment. Sample was measured in triplicate.

Author Contributions

The article was written by L.E. within his project, with supervision by A.S.R. and M.J. All authors have read and agreed to the published version of the manuscript.

Funding

This research received no external funding.

Acknowledgments

We acknowledge support by the German Research Foundation and the Open Access Publication Fund of TU Berlin.

Conflicts of Interest

The authors declare no conflict of interest. The funders had no role in the design of the study; in the collection, analyses, or interpretation of data; in the writing of the manuscript, or in the decision to publish the results.

References

  1. Connors, K.A.; Dyer, S.D.; Belanger, S.E. Advancing the quality of environmental microplastic research. Environ. Toxicol. Chem. 2017, 36, 1697–1703. [Google Scholar] [CrossRef] [PubMed]
  2. Potthoff, A.; Oelschlägel, K.; Schmitt-Jansen, M.; Rummel, C.D.; Kühnel, D. From the sea to the laboratory: Characterization of microplastic as prerequisite for the assessment of ecotoxicological impact. Integr. Environ. Assess. Manag. 2017, 13, 500–504. [Google Scholar] [CrossRef] [PubMed]
  3. Von der Esch, E.; Lanzinger, M.; Kohles, A.J.; Schwaferts, C.; Weisser, J.; Hofmann, T.; Glas, K.; Elsner, M.; Ivleva, N.P. Simple Generation of Suspensible Secondary Microplastic Reference Particles via Ultrasound Treatment. Front. Chem. 2020, 8, 169. [Google Scholar] [CrossRef] [PubMed] [Green Version]
  4. Waldman, W.R.; Rillig, M.C. Microplastic Research Should Embrace the Complexity of Secondary Particles. Environ. Sci. Technol. 2020, 54, 7751–7753. [Google Scholar] [CrossRef] [PubMed]
  5. Eitzen, L.; Paul, S.; Braun, U.; Altmann, K.; Jekel, M.; Ruhl, A.S. The challenge in preparing particle suspensions for aquatic microplastic research. Environ. Res. 2019, 168, 490–495. [Google Scholar] [CrossRef] [PubMed]
  6. OECD. Test No. 318: Dispersion Stability of Nanomaterials in Simulated Environmental Media: OECD Guidelines for the Testing of Chemicals, Section 3; OECD: Paris, France, 2017. [Google Scholar] [CrossRef]
  7. Fernández, B.; Albentosa, M. Dynamic of small polyethylene microplastics (≤10 μm) in mussel’s tissues. Mar. Pollut. Bull. 2019, 146, 493–501. [Google Scholar] [CrossRef] [PubMed]
  8. Shams, M.; Alam, I.; Chowdhury, I. Aggregation and stability of nanoscale plastics in aquatic environment. Water Res. 2020, 171, 115401. [Google Scholar] [CrossRef]
  9. Ateia, M.; Zheng, T.; Calace, S.; Tharayil, N.; Pilla, S.; Karanfil, T. Sorption behavior of real microplastics (MPs): Insights for organic micropollutants adsorption on a large set of well-characterized MPs. Sci. Total Environ. 2020, 720, 137634. [Google Scholar] [CrossRef]
  10. Renzi, M.; Grazioli, E.; Blašković, A. Effects of Different Microplastic Types and Surfactant-Microplastic Mixtures Under Fasting and Feeding Conditions: A Case Study on Daphnia magna. Bull. Environ. Contam. Toxicol. 2019, 103, 367–373. [Google Scholar] [CrossRef]
  11. Xia, Y.; Zhou, J.-J.; Gong, Y.-Y.; Li, Z.-J.; Zeng, E.Y. Strong influence of surfactants on virgin hydrophobic microplastics adsorbing ionic organic pollutants. Environ. Pollut. 2020, 265, 115061. [Google Scholar] [CrossRef]
  12. Lu, S.; Zhu, K.; Song, W.; Song, G.; Chen, D.; Hayat, T.; Alharbi, N.S.; Chen, C.; Sun, Y. Impact of water chemistry on surface charge and aggregation of polystyrene microspheres suspensions. Sci. Total Environ. 2018, 630, 951–959. [Google Scholar] [CrossRef] [PubMed]
  13. Li, S.; Liu, H.; Gao, R.; Abdurahman, A.; Dai, J.; Zeng, F. Aggregation kinetics of microplastics in aquatic environment: Complex roles of electrolytes, pH, and natural organic matter. Environ. Pollut. 2018, 237, 126–132. [Google Scholar] [CrossRef] [PubMed]
  14. Gao, Y.; Ren, X.; Tan, X.; Hayat, T.; Alsaedi, A.; Chen, C. Insights into key factors controlling GO stability in natural surface waters. J. Hazard. Mater. 2017, 335, 56–65. [Google Scholar] [CrossRef] [PubMed]
  15. Tallec, K.; Blard, O.; González-Fernández, C.; Brotons, G.; Berchel, M.; Soudant, P.; Huvet, A.; Paul-Pont, I. Surface functionalization determines behavior of nanoplastic solutions in model aquatic environments. Chemosphere 2019, 225, 639–646. [Google Scholar] [CrossRef] [PubMed] [Green Version]
  16. Cai, L.; Hu, L.; Shi, H.; Ye, J.; Zhang, Y.; Kim, H. Effects of inorganic ions and natural organic matter on the aggregation of nanoplastics. Chemosphere 2018, 197, 142–151. [Google Scholar] [CrossRef] [PubMed]
  17. Liu, P.; Zhan, X.; Wu, X.; Li, J.; Wang, H.; Gao, S. Effect of weathering on environmental behavior of microplastics: Properties, sorption and potential risks. Chemosphere 2020, 242, 125193. [Google Scholar] [CrossRef]
  18. Ter Halle, A.; Ladirat, L.; Martignac, M.; Mingotaud, A.F.; Boyron, O.; Perez, E. To what extent are microplastics from the open ocean weathered? Environ. Pollut. 2017, 227, 167–174. [Google Scholar] [CrossRef]
  19. Labille, J.; Brant, J. Stability of nanoparticles in water. Nanomedicine 2010, 5, 985–998. [Google Scholar] [CrossRef]
  20. Keller, A.A.; Wang, H.; Zhou, D.; Lenihan, H.S.; Cherr, G.; Cardinale, B.J.; Miller, R.; Ji, Z. Stability and aggregation of metal oxide nanoparticles in natural aqueous matrices. Environ. Sci. Technol. 2010, 44, 1962–1967. [Google Scholar] [CrossRef]
  21. Tantra, R.; Jing, S.; Pichaimuthu, S.K.; Walker, N.; Noble, J.; Hackley, V.A. Dispersion stability of nanoparticles in ecotoxicological investigations: The need for adequate measurement tools. J. Nanopart. Res. 2011, 13, 3765–3780. [Google Scholar] [CrossRef]
  22. Ivanov, M.G.; Ivanov, D.M. Nanodiamond Nanoparticles as Additives to Lubricants. In Ultananocrystalline Diamond; Elsevier: Amsterdam, The Netherlands, 2012; pp. 457–492. ISBN 9781437734652. [Google Scholar]
  23. Ozawa, M.; Inaguma, M.; Takahashi, M.; Kataoka, F.; Krüger, A.; Ōsawa, E. Preparation and Behavior of Brownish, Clear Nanodiamond Colloids. Adv. Mater. 2007, 19, 1201–1206. [Google Scholar] [CrossRef]
  24. Schrand, A.M.; Hens, S.A.C.; Shenderova, O.A. Nanodiamond Particles: Properties and Perspectives for Bioapplications. Crit. Rev. Solid State Mater. Sci. 2009, 34, 18–74. [Google Scholar] [CrossRef]
  25. Hwang, Y.; Lee, J.-K.; Lee, J.-K.; Jeong, Y.-M.; Cheong, S.; Ahn, Y.-C.; Kim, S.H. Production and dispersion stability of nanoparticles in nanofluids. Powder Technol. 2008, 186, 145–153. [Google Scholar] [CrossRef]
  26. Suslick, K.S.; Price, G.J. Applications of Ultrasound to Materials Chemistry. Annu. Rev. Mater. Sci. 1999, 29, 295–326. [Google Scholar] [CrossRef] [Green Version]
  27. Cole, M.; Galloway, T.S. Ingestion of Nanoplastics and Microplastics by Pacific Oyster Larvae. Environ. Sci. Technol. 2015, 49, 14625–14632. [Google Scholar] [CrossRef] [Green Version]
  28. Abdurahman, A.; Cui, K.; Wu, J.; Li, S.; Gao, R.; Dai, J.; Liang, W.; Zeng, F. Adsorption of dissolved organic matter (DOM) on polystyrene microplastics in aquatic environments: Kinetic, isotherm and site energy distribution analysis. Ecotoxicol. Environ. Saf. 2020, 198, 110658. [Google Scholar] [CrossRef]
  29. Bakir, A.; Rowland, S.J.; Thompson, R.C. Competitive sorption of persistent organic pollutants onto microplastics in the marine environment. Mar. Pollut. Bull. 2012, 64, 2782–2789. [Google Scholar] [CrossRef]
  30. Chung, S.J.; Leonard, J.P.; Nettleship, I.; Lee, J.K.; Soong, Y.; Martello, D.V.; Chyu, M.K. Characterization of ZnO nanoparticle suspension in water: Effectiveness of ultrasonic dispersion. Powder Technol. 2009, 194, 75–80. [Google Scholar] [CrossRef]
  31. Meißner, T.; Kühnel, D.; Busch, W.; Oswald, S.; Richter, V.; Michaelis, A.; Schirmer, K.; Potthoff, A. Physical-chemical characterization of tungsten carbide nanoparticles as a basis for toxicological investigations. Nanotoxicology 2010, 4, 196–206. [Google Scholar] [CrossRef]
  32. Schilde, C.; Mages-Sauter, C.; Kwade, A.; Schuchmann, H.P. Efficiency of different dispersing devices for dispersing nanosized silica and alumina. Powder Technol. 2011, 207, 353–361. [Google Scholar] [CrossRef]
  33. Baalousha, M.; Lead, J.R.; Ju-Nam, Y. Natural Colloids and Manufactured Nanoparticles in Aquatic and Terrestrial Systems. In Treatise on Water Science; Elsevier: Amsterdam, The Netherlands, 2011; pp. 89–129. ISBN 9780444531995. [Google Scholar]
  34. Delmas, H.; Barthe, L. Ultrasonic mixing, homogenization, and emulsification in food processing and other applications. In Power Ultrasonics; Elsevier: Amsterdam, The Netherlands, 2015; pp. 757–791. ISBN 9781782420286. [Google Scholar]
Figure 1. Theoretical position of an exemplary cryomilled polystyrene (PS) particle with a density of 1.05 g/cm3 during settling in the course of a measurement with PAMAS particle counter. The particle starts to sink at the water level. Height = 0 cm: water level of glass bottle; height = −15.5 cm: bottom of glass bottle. Full, dashed and dash-dotted lines: theoretical location of particles of different diameters. Horizontal dotted line: suction height of tubing connected to PAMAS device 7 cm from water surface. Highlighted area shows timespan of a measurement (less than 3 min). Stoke’s law with assumption of spherical shape was used for calculations.
Water 12 03436 g001
Figure 2. (a) Left: Particle concentration of six batches (20 mg/L PS particles) during 750 h horizontal shaking (HS). Right: Particle concentration of the same 6 batches during 30 min ultrasonic treatment (UT). (b) Particle concentrations of two batches (20 mg/L PS particles); batch G was manually shaken (MS) for 250 times (left diagram, full squares) and subsequently sonicated (right diagram, empty squares), batch H was directly sonicated (UT; right diagram, empty circles). Error bars show standard deviation of n = 3.
Water 12 03436 g002
Figure 3. Particle concentrations of six batches (A–F = 20 mg/L PS particles) during ultrasonic treatment of 180 min. Error bars show standard deviation of n = 3.
Water 12 03436 g003
Figure 4. (a) Particle concentration of batch A during manual shaking (MS), horizontal shaking (HS) and ultrasonic treatment (UT). (b) Particle concentration of batch A (20 mg/L PS particles) during ultrasonic treatment (UT) for 180 min. Particles in all diagrams were grouped in size fractions <5 µm, 5–10 µm and >10 µm. Error bars show standard deviation of n = 3.
Water 12 03436 g004
Figure 5. (a) Calculated suspended solid volume of six batches (A–F = 20 mg/L PS particles) during ultrasonic treatment (UT). Dotted line at 19,048,000 µm3/mL indicates an ED of 100%. Highlighted area was used for calculation of mean volume and ED. (b) Calculated volume per size channel of batch A during 180 min of ultrasonic treatment. Values were normalized through division by channel width to compare smaller and larger channels. A non-normalized graph can be found in the SI, Figure S2. Error bars show standard deviation of n = 3.
Water 12 03436 g005
Figure 6. Calculated volume of batch A during ultrasonic treatment. Particles were grouped in size fractions <10, 10–50, and >50 µm (please note: different fractions were chosen for volume fractions compared to number fractions). Error bars show standard deviation of n = 3.
Water 12 03436 g006
Publisher’s Note: MDPI stays neutral with regard to jurisdictional claims in published maps and institutional affiliations.

