Characteristics of a Debris Flow Disaster and Its Mitigation Countermeasures in Zechawa Gully, Jiuzhaigou Valley, China

 ,
,
Abstract
:1. Introduction
2. Background
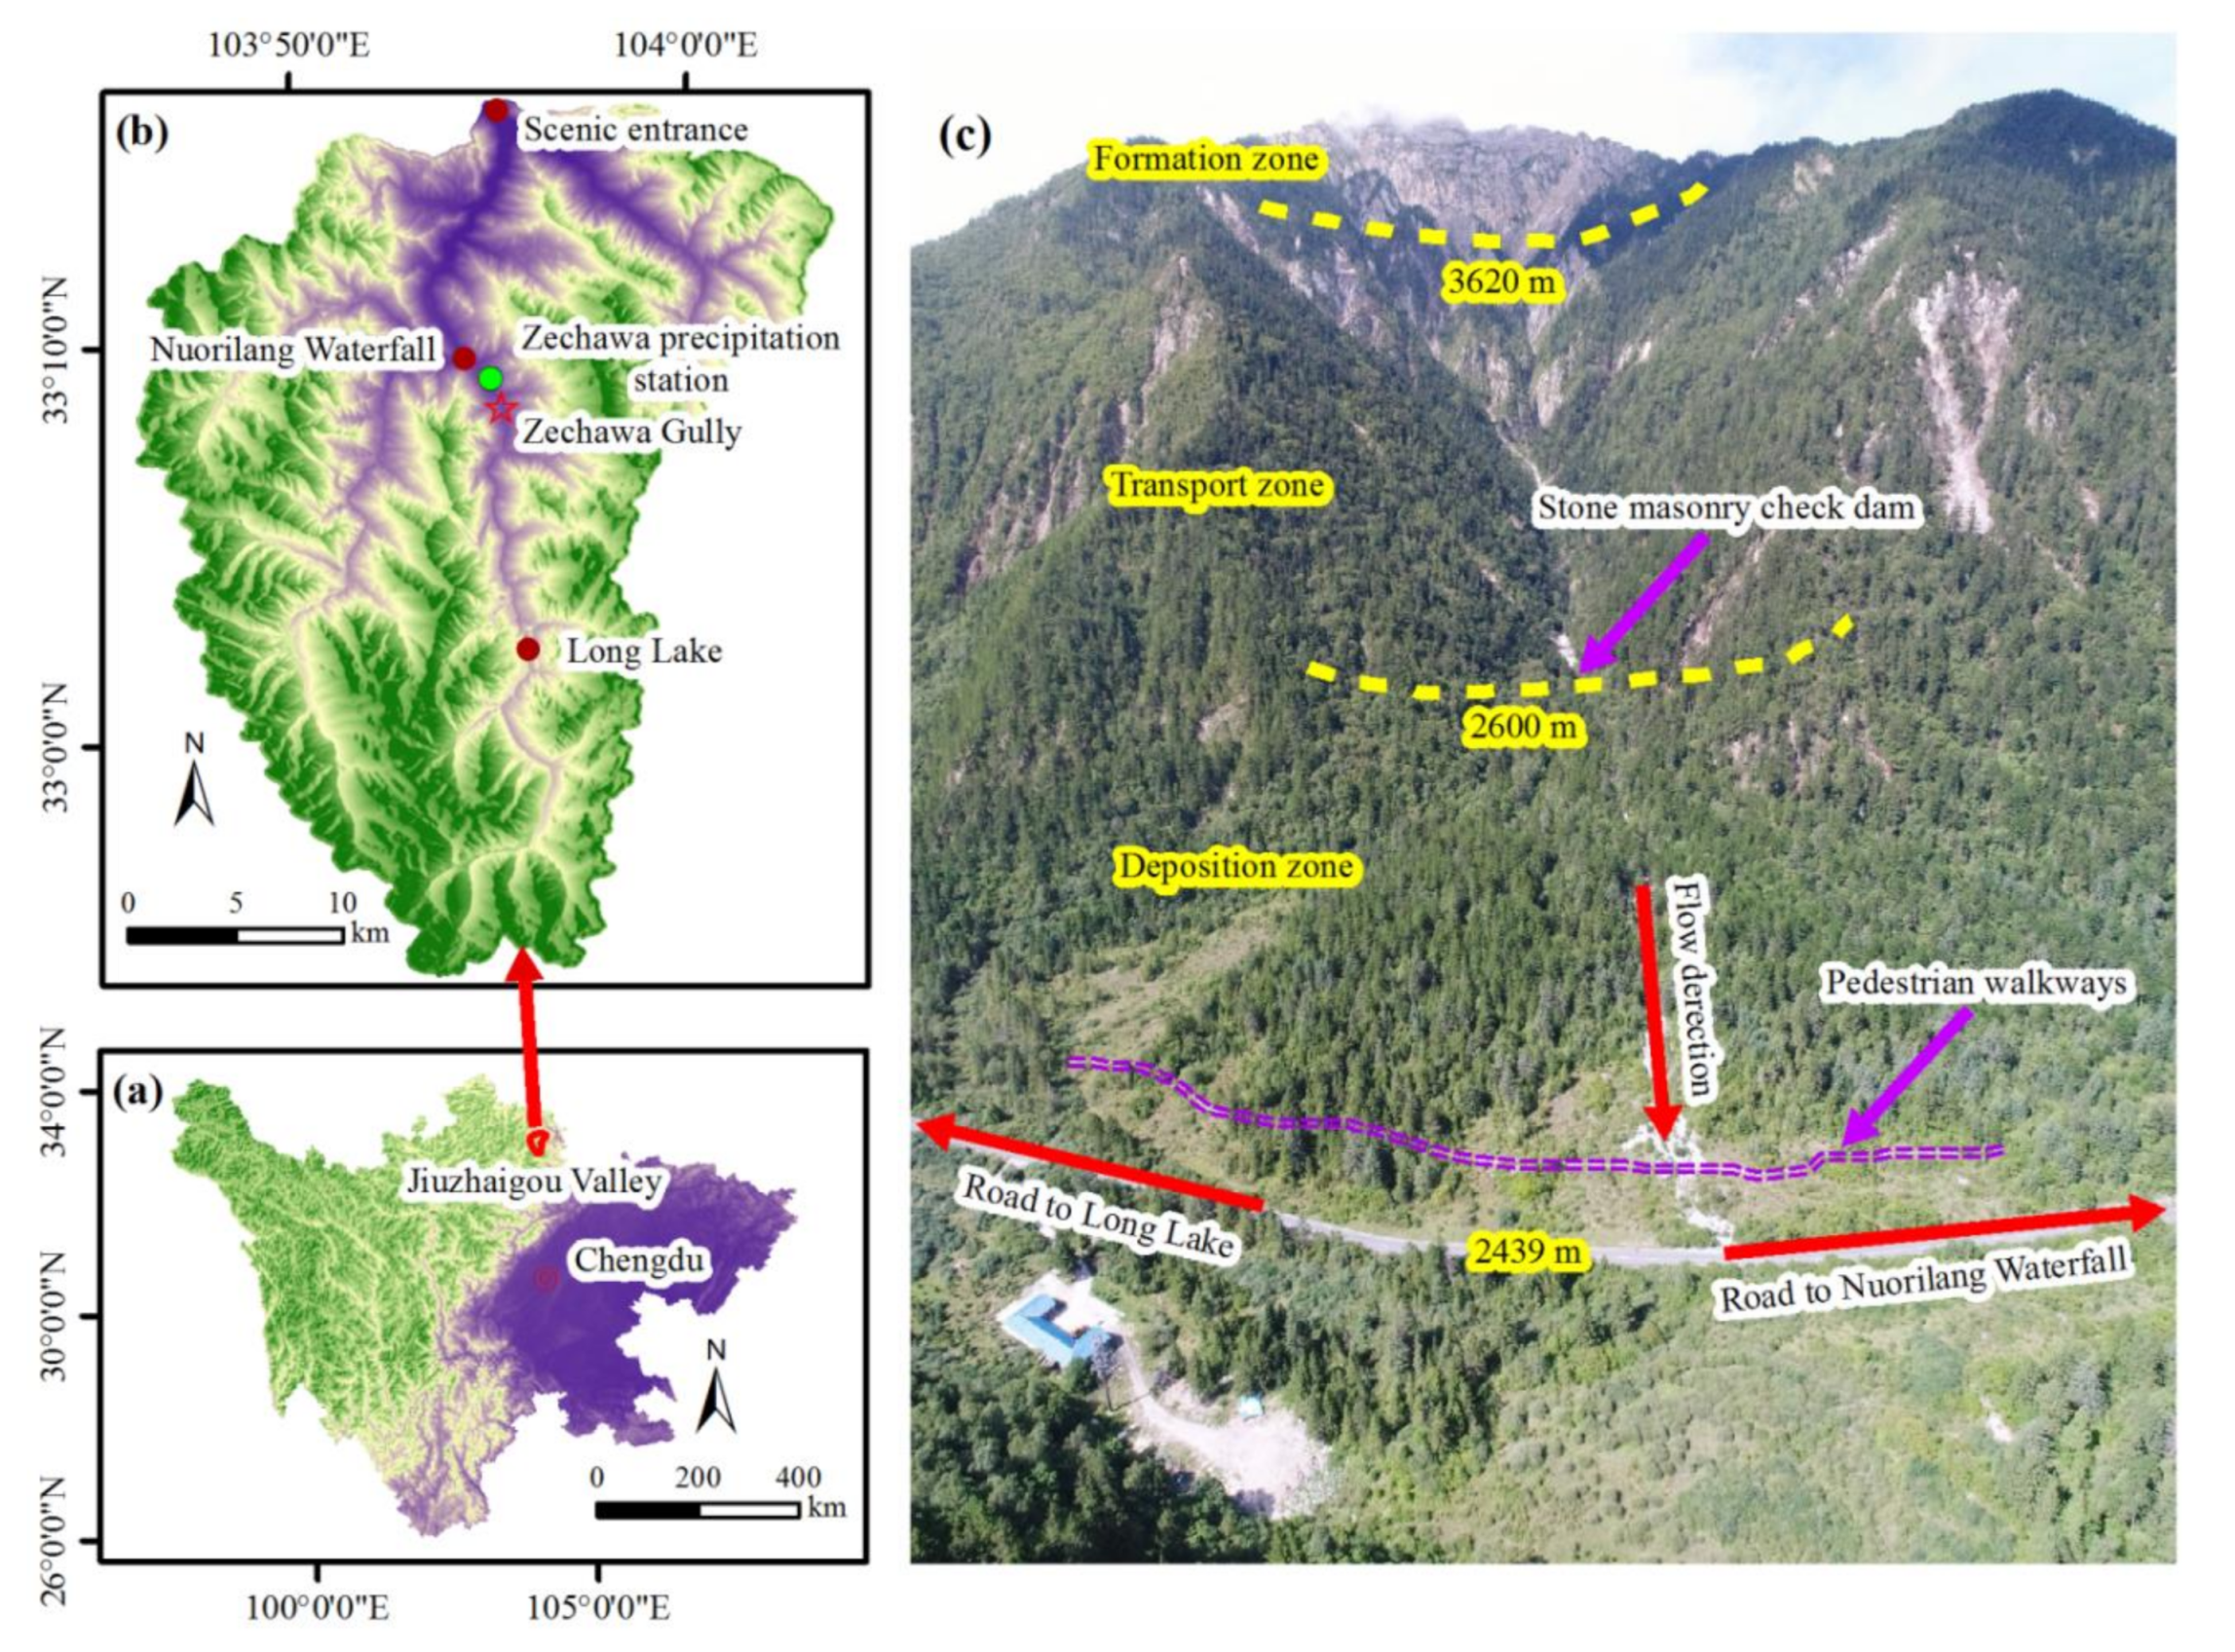
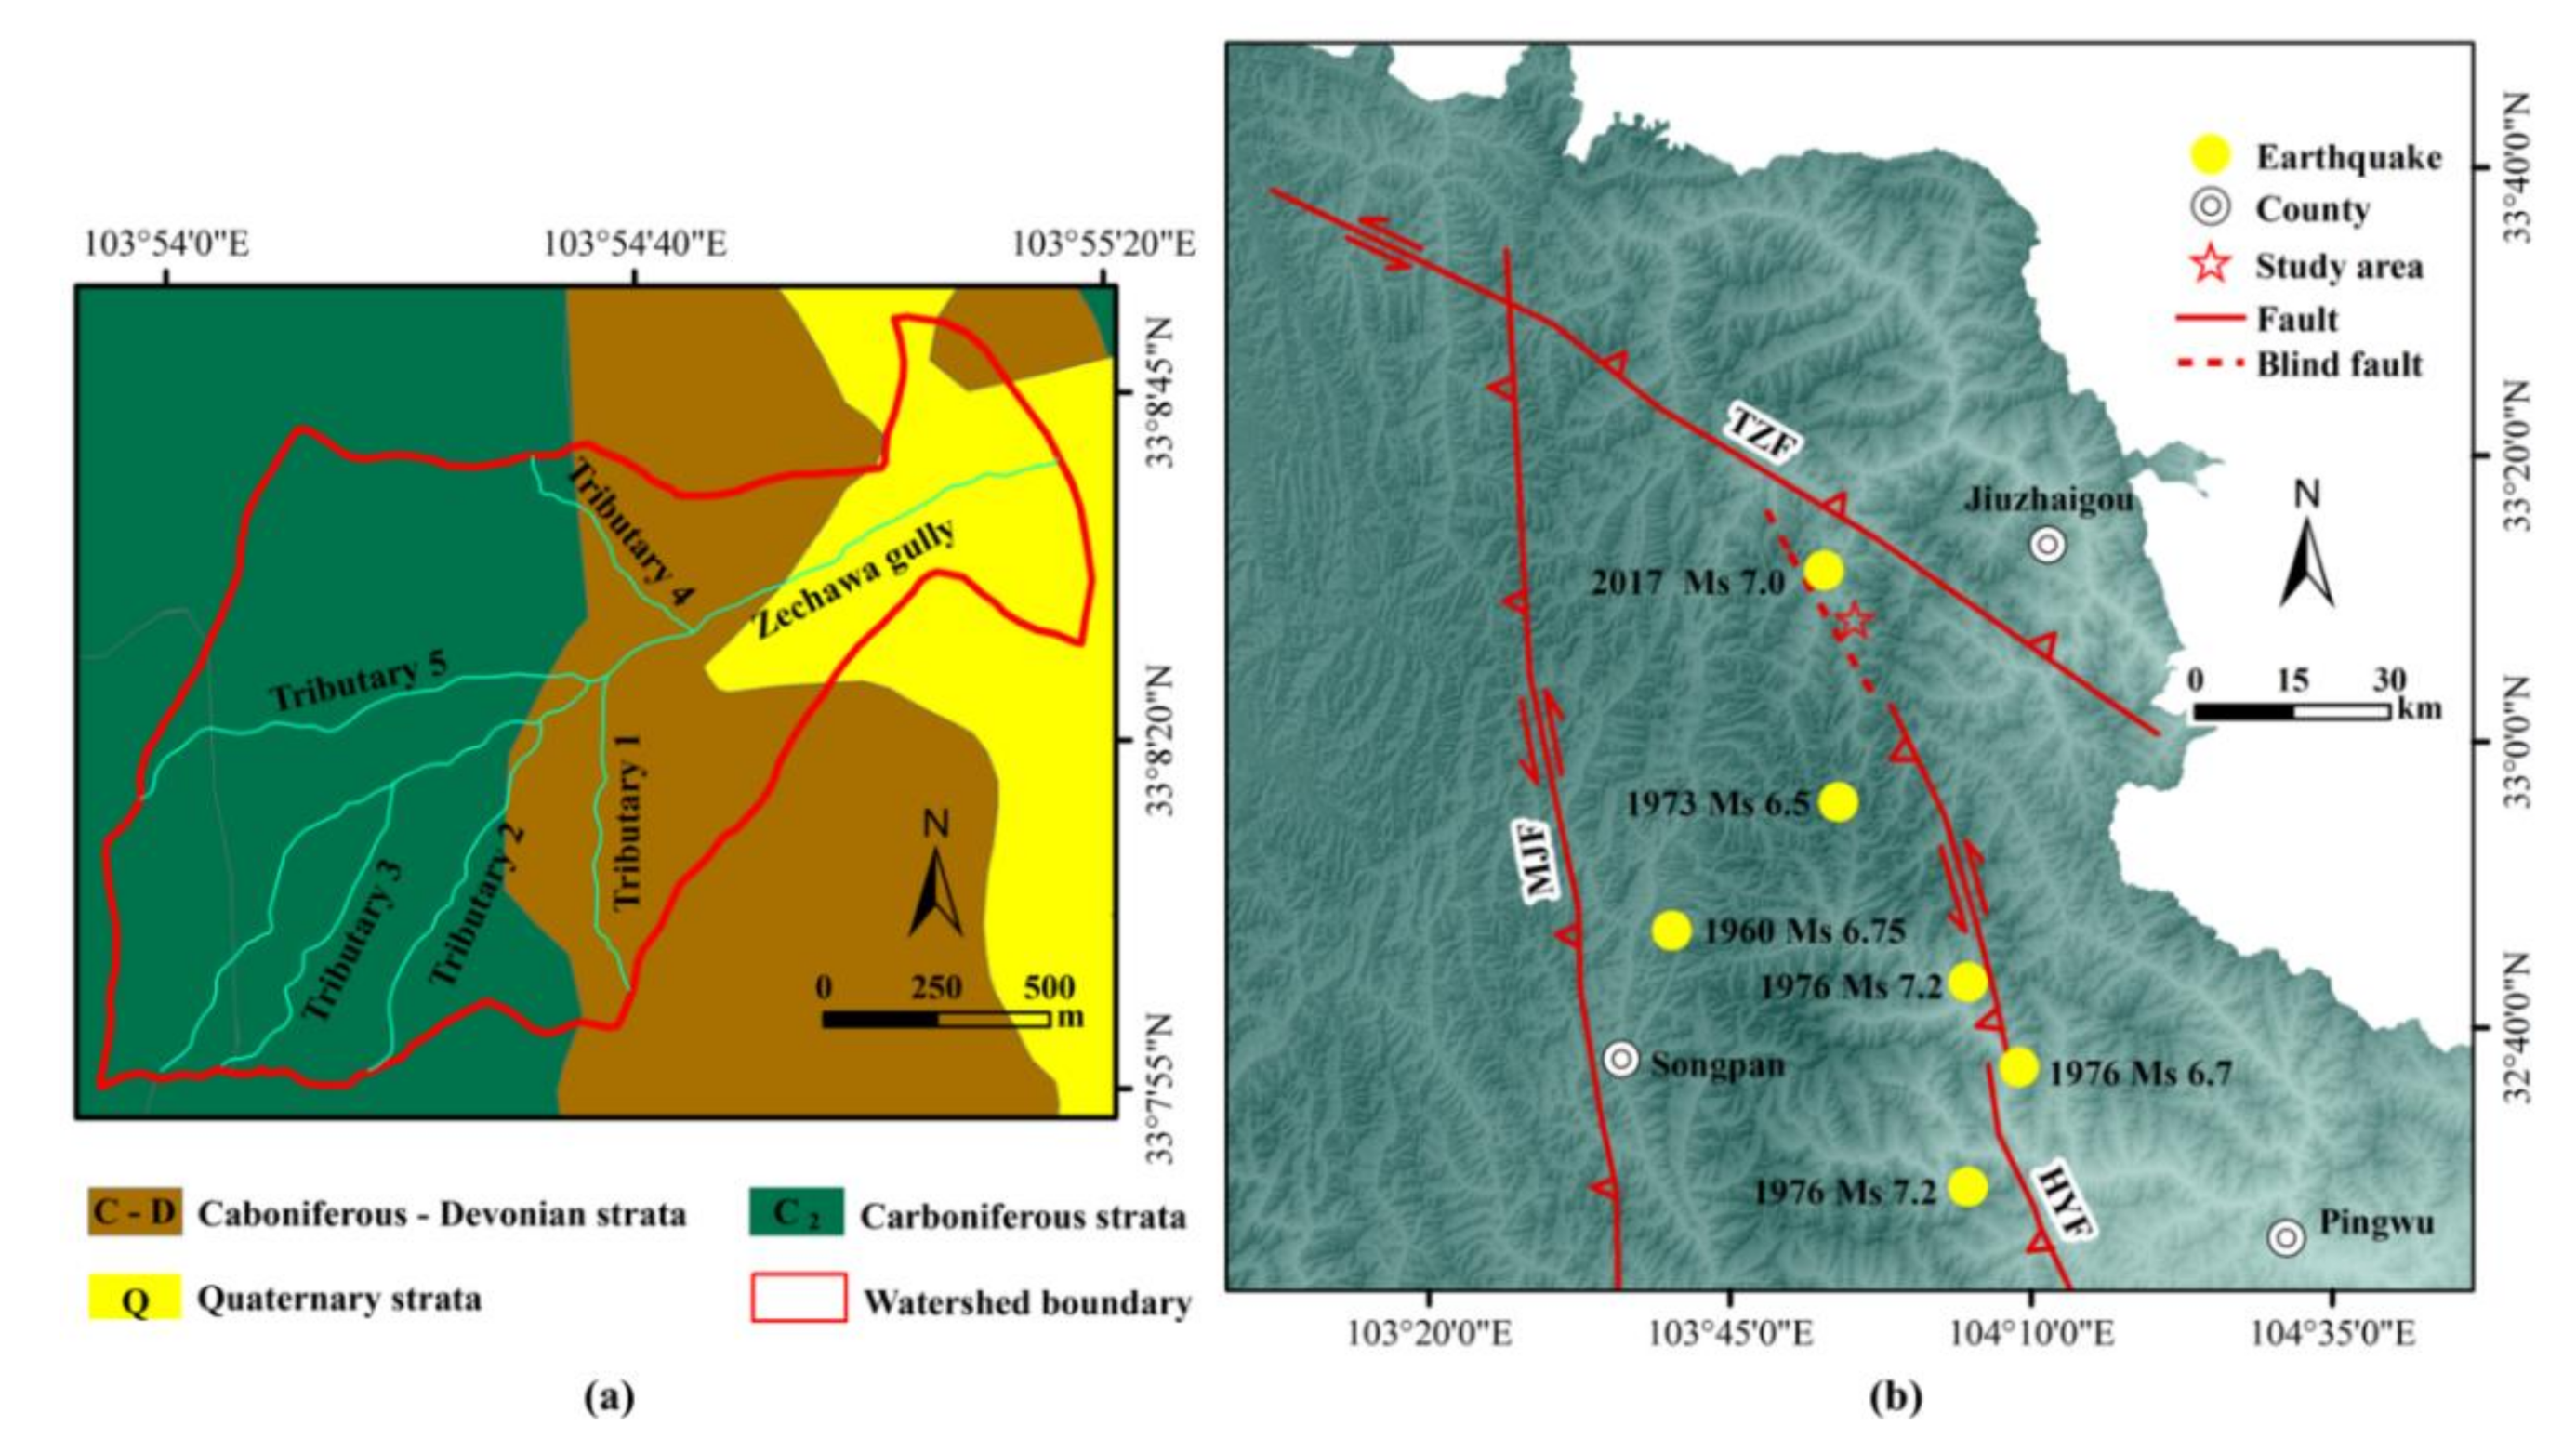
2.1. Formation Conditions of the Zechawa Gully Debris Flow
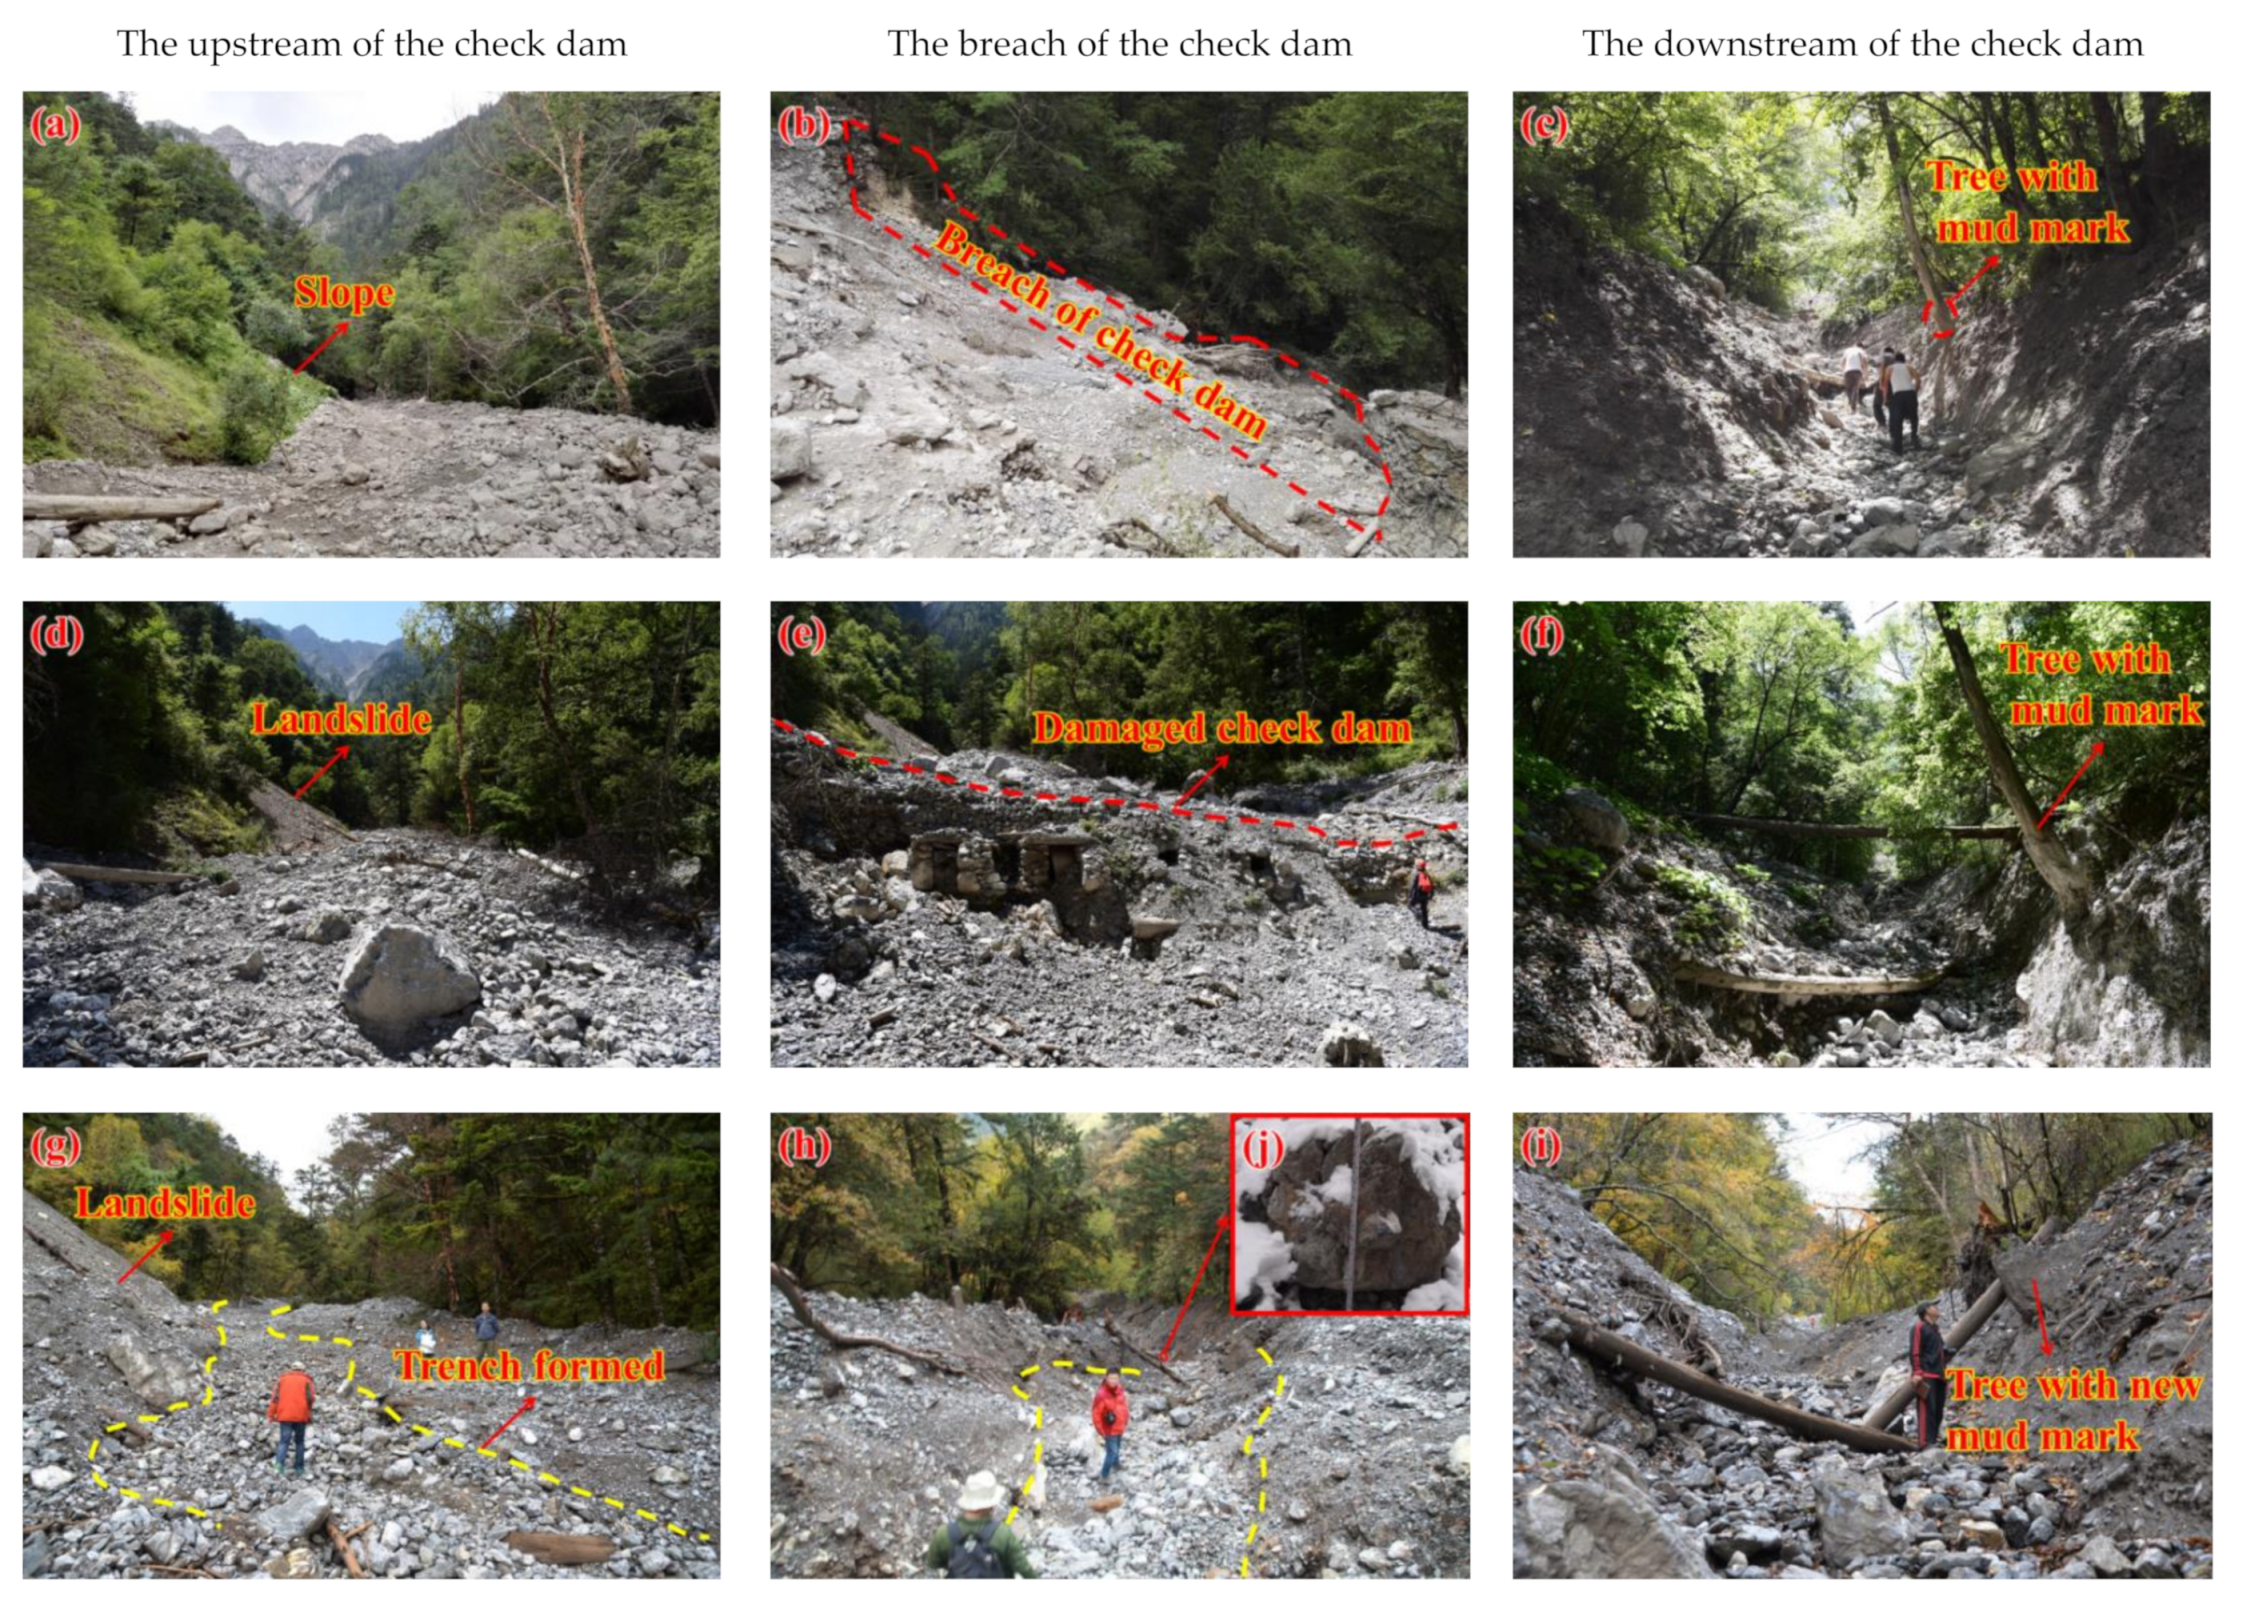
2.2. Description of the Debris Flow Events in Zechawa Gully
3. Calculation of the Debris Flow Peak Discharge
3.1. Rain-Flood Method
3.2. Cross-Section Survey Method
3.3. Dam-Breaking Calculation Method
3.4. Maximum Boulder Size Method
3.4.1. Method of Schoklitsch
3.4.2. Method of Helley
3.4.3. Method of Williams
3.4.4. Method of Clarke
4. Results
4.1. The Calculated Debris Flow Peak Discharge in 2016
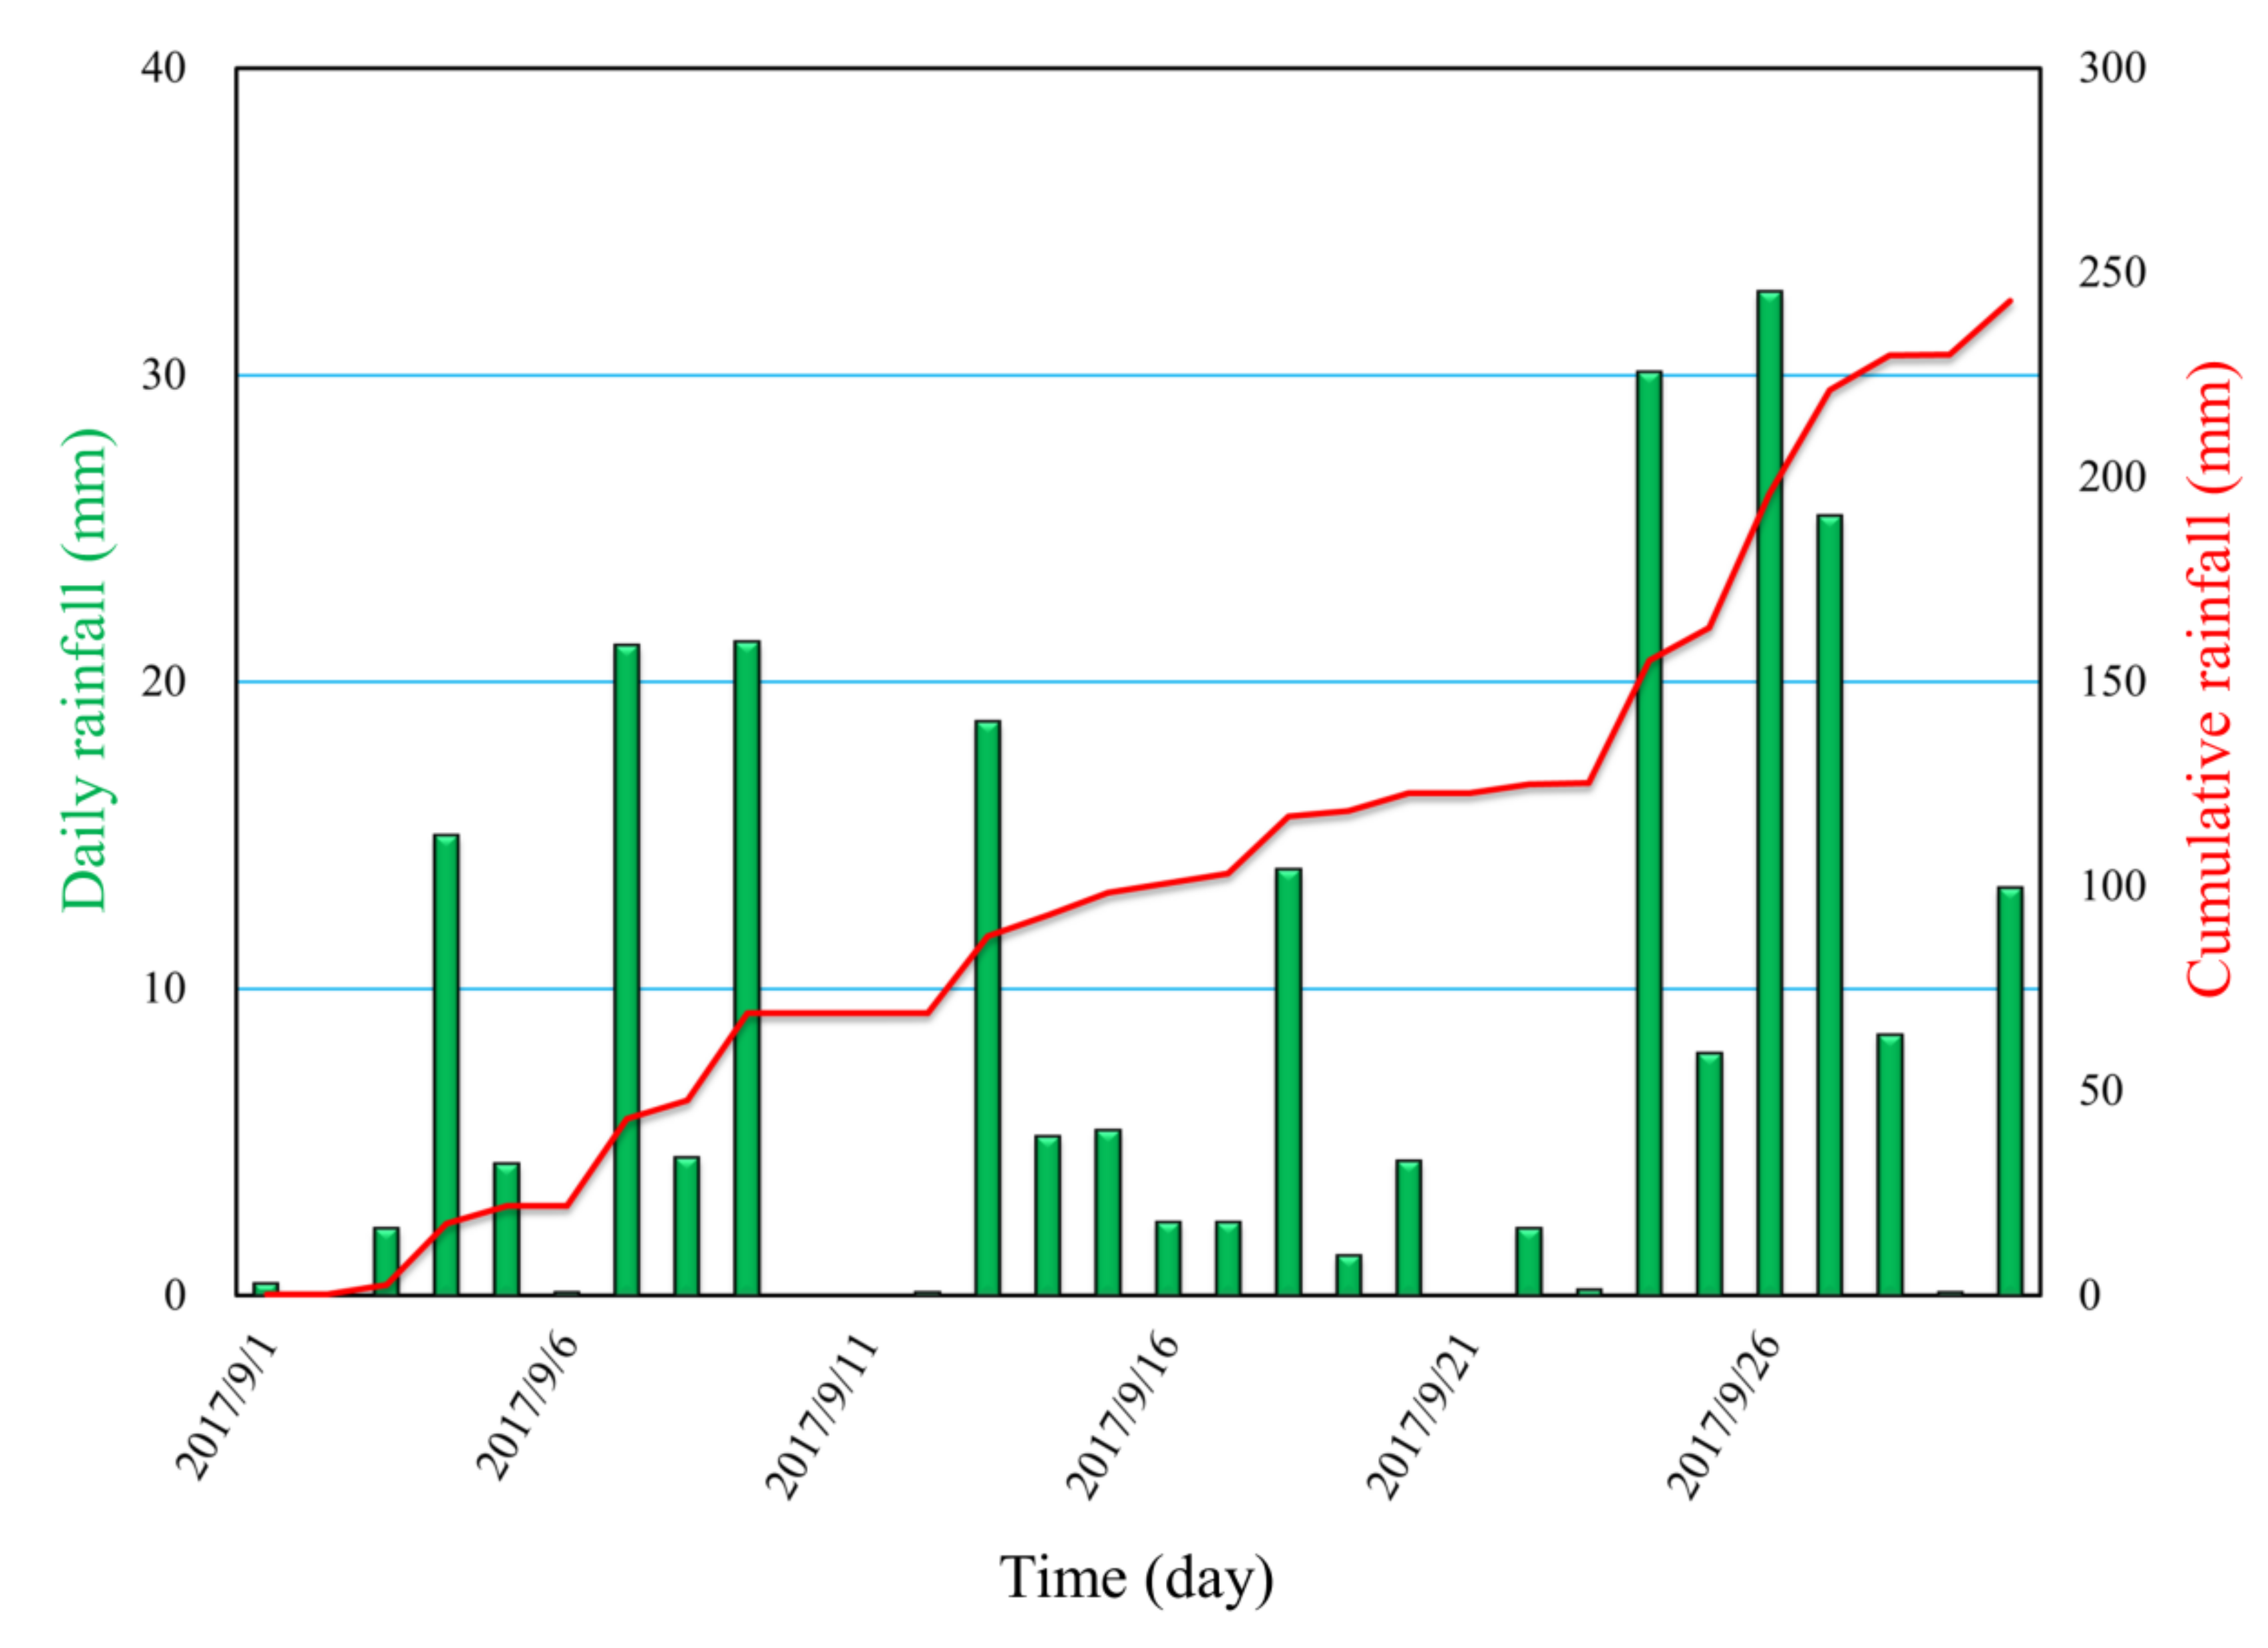
4.2. The Calculated Debris Flow Peak Discharge in 2017
4.3. The Calculated Debris Flow Peak Discharge under Different Occurrence Frequencies
5. Discussion
5.1. The Applicability and Limitations of the Calculated Debris Flow Peak Discharge
- (1)
- Due to the complexity of debris flows and the measurement limitation, the values of relevant parameters are usually obtained by field surveys and querying the specifications. In this study, the roughness coefficient of the debris flow gully (ndf), the roughness coefficient of a mountain stream (nf), the density of debris flow (γdf) and the blockage coefficient (Ddf) were obtained through field investigations and querying specifications.
- (2)
- Considering the complexity of the debris flow and the operability of the calculation method, it is necessary to make certain assumptions and simplifications to obtain the peak discharge of the debris flow in the calculation process. The rain-flood method assumes that the occurrence frequencies of rainstorms, floods and debris flows are the same and that the calculated flood peak discharge is completely converted into the peak discharge of the debris flow [54]. Under such assumptions, important parameters such as debris flow peak discharge and total volume of debris flow material under different occurrence frequencies can be obtained, which provide important references for the design of engineering countermeasures. In addition, the breach in the check dam was idealized as a trapezoidal shape, and the average width of the breach was taken as the calculated value of Bm in the dam-breaking calculation.
- (3)
- Four methods were used to estimate the peak discharge of the debris flow based on the maximum particle size parameters (Table 3), and the related issues in the calculation are as follows: Both Clarke and Helley solved for the critical velocity required to move the largest boulder, obtained the flow depth through the Manning formula, and finally calculated the peak discharge. Differences in the critical velocity result in differences in the flow depth and peak discharge. The method of Clarke idealizes the largest boulder as either cubic or spherical for the shape-dependent parameters, and the calculated velocities are averaged to provide the critical velocity. By setting the critical force FC = 0, the downward gravitational component is balanced by the gravity-induced friction, and the extreme use condition of this method can be obtained. The limit bed slope angle (β) is equal to 34.1° for a cubic boulder and 12.7° for a spherical boulder when using the Clarke method; therefore, a spherical boulder is easier to move than the cubic boulder under the same conditions. According to the field investigation, β is equal to 19°, which exceeds the limit bed slope angle for a spherical boulder. Therefore, the selected boulder in this study was considered a cubic boulder, resulting in a calculated critical velocity that is higher than the actual value. Compared with the method of Clarke, the method of Helley neglects the bed slope, ignoring the downstream gravitational component. Generally, the bed slope of a stream is small; even for a stream with a channel longitudinal slope of 10%, the downstream gravitational component is negligibly small compared to the fluid drag and lift, so this component can be ignored [57]. However, the bed slope is 19° in this study, and neglecting the gravitational component results in a calculated critical velocity that is much higher than the actual value, ultimately resulting in a higher calculated peak discharge. The methods of Schoklitsch and Williams estimate the peak discharge by establishing an empirical correlation based on boulder size parameters without considering the influence of the boulder shape on the calculation results. In addition, the values of w, τ and Vavg in the method of Williams represent the lowest values, and the actual values are higher than the calculated value.
- (4)
- In summary, certain assumptions and simplifications were made in the calculation process, causing the peak discharge of the debris flow calculated by a single method to exhibit low accuracy. Thus, multiple methods should be used to comprehensively obtain the peak discharge, further quantifying the scale of debris flow disasters. It is worth noting that the method for calculating the debris flow peak discharge proposed in this study is mainly based on the specifications in China, especially the selection of some parameters. When calculating the debris flow peak discharge in other countries, local specifications should be considered.
5.2. The Scales of the Debris Flow Disasters in 2016 and 2017
- (1)
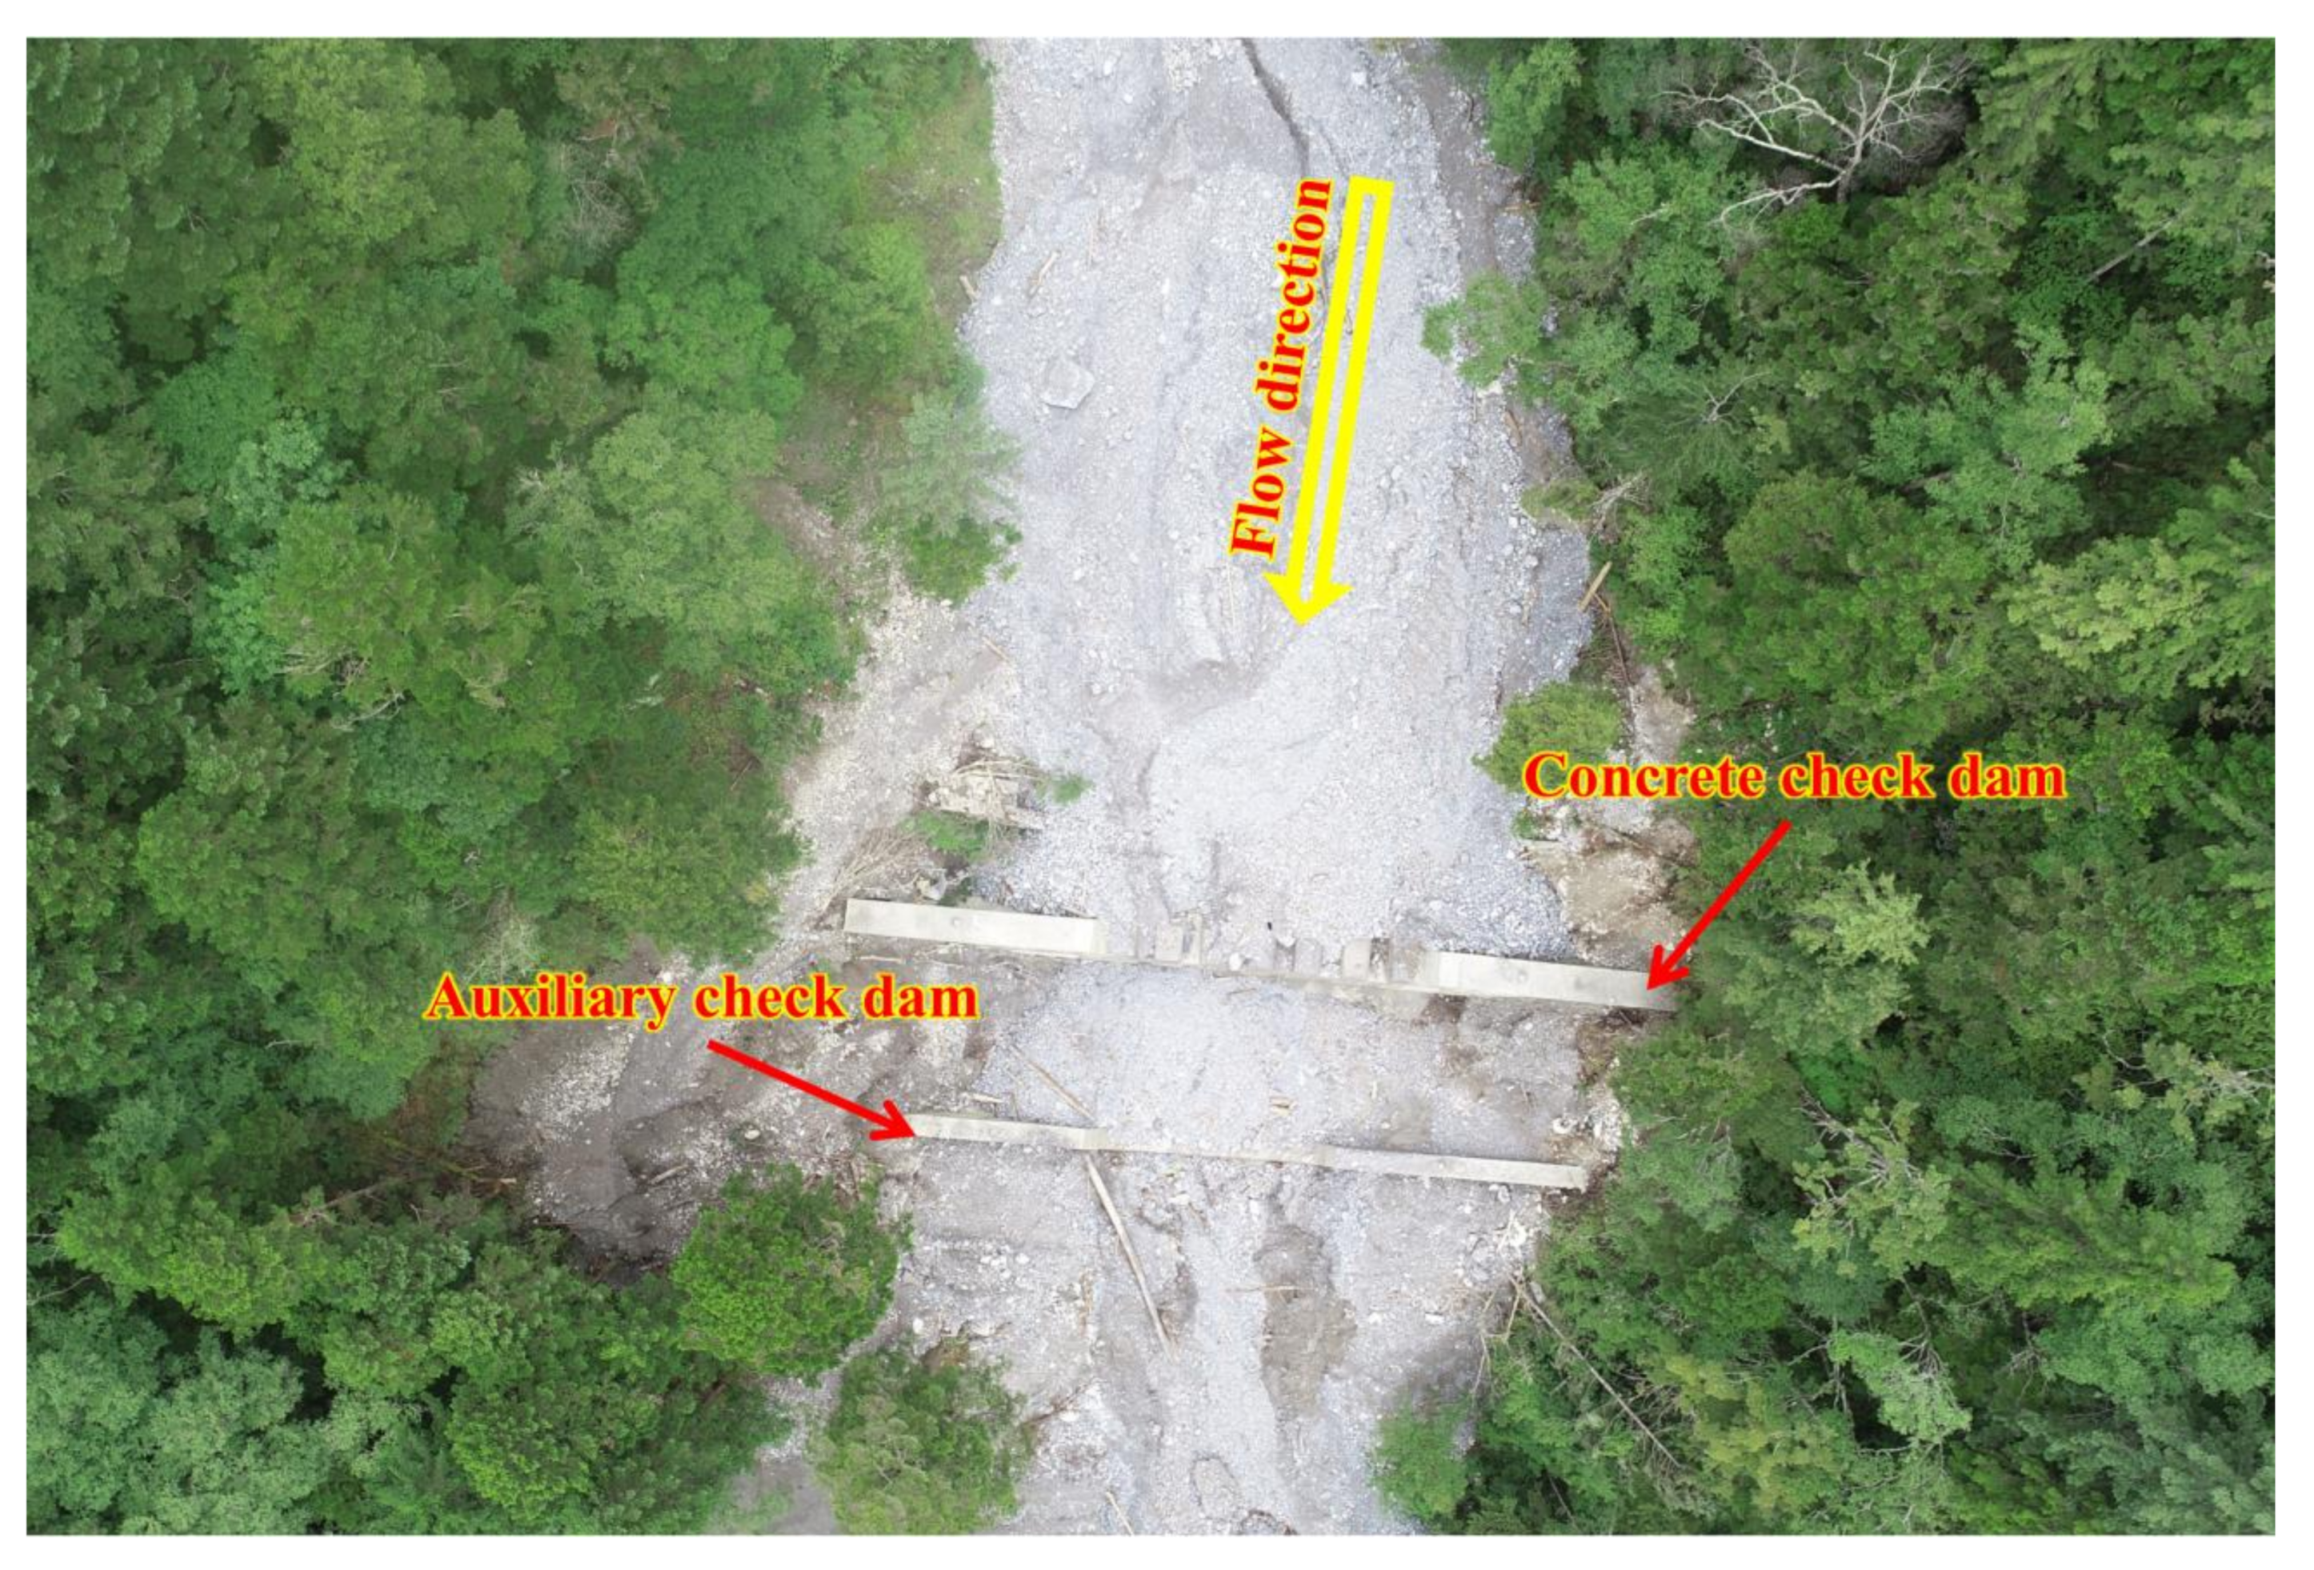
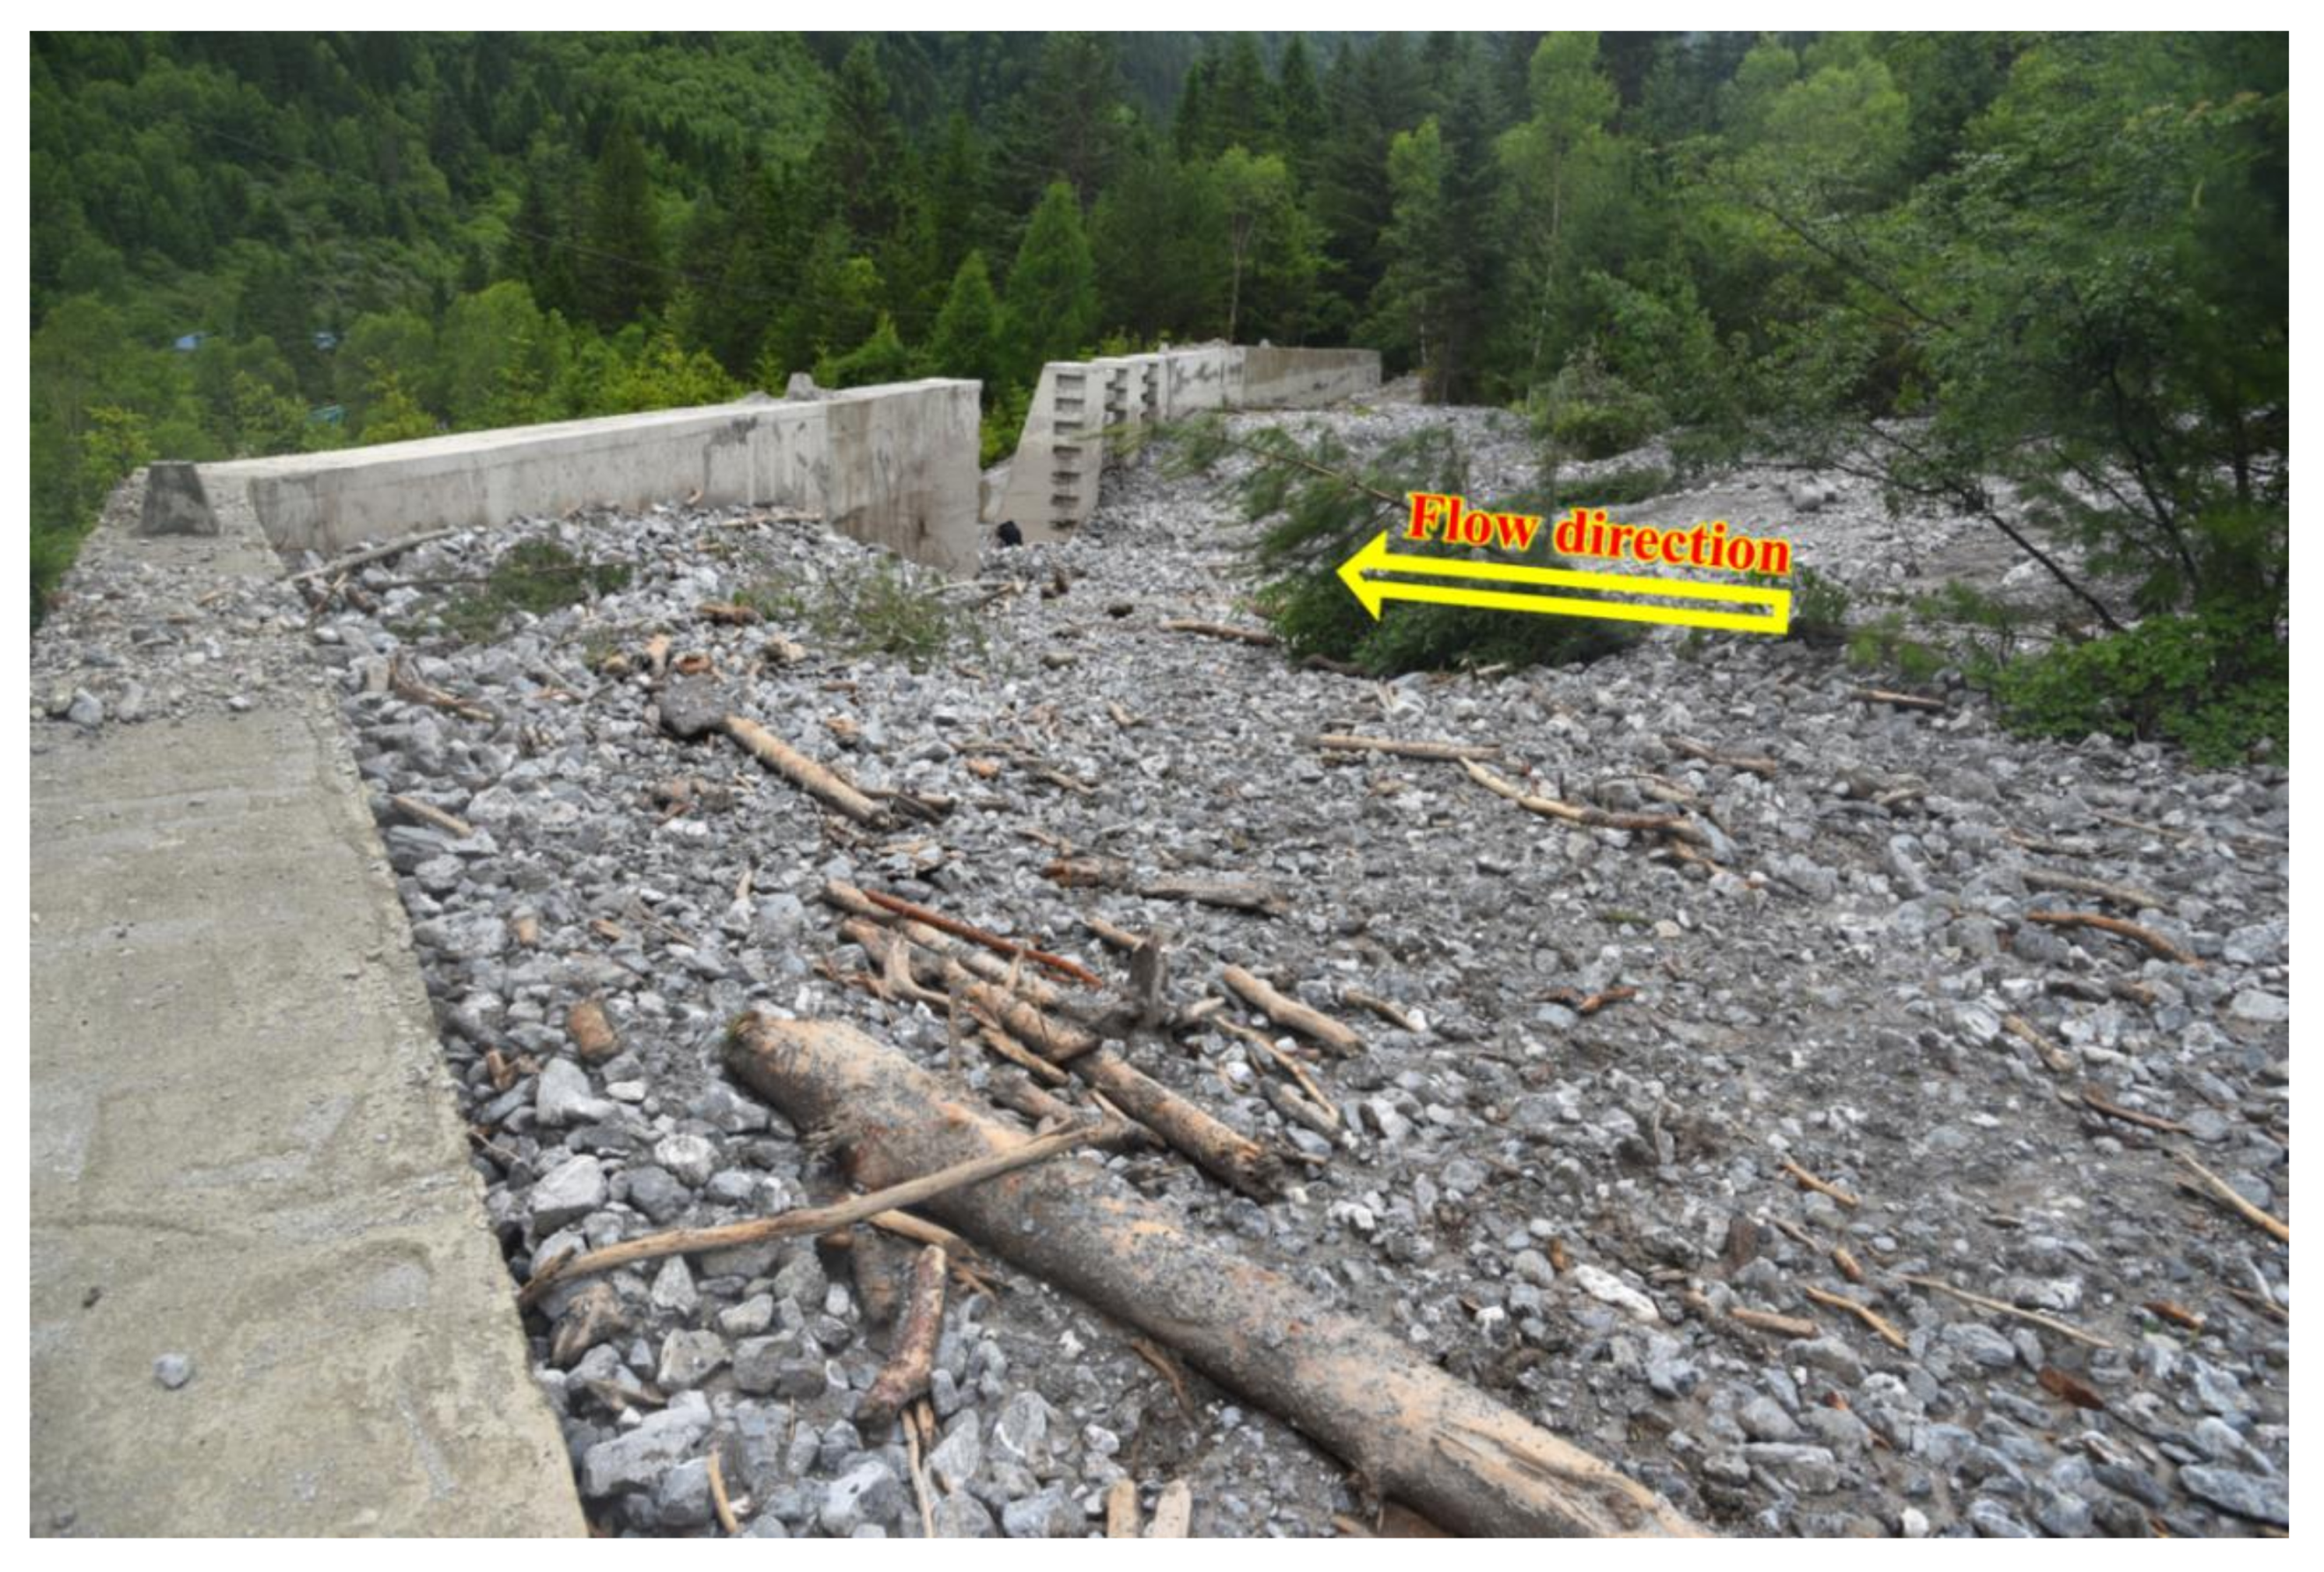
- The debris flow peak flow obtained by the cross-section survey method and dam-breaking calculation method are essentially the same and are generally equivalent to the peak discharge of the debris flow with a 20-year return period (Table 2 and Table 4). In addition, the total volume of the debris flow material Wdf is estimated by Ref. [54]:where Tdf is the duration time of the debris flow (s), and its value is approximately 1500 s based on the reports of patrol personnel. The value of Qdf is the average calculation result through the cross-section survey method and dam-breaking calculation method, and its value is 37.38 m3/s. The total volume of debris flow material from Equation (42) is 1.48 × 10⁴ m3, which is consistent with the value of 1.39 × 10⁴ m3 based on the field investigation. Thus, it is reasonable that the scale of the debris flow on 4 August 2016 is equivalent to that of a debris flow with a 20-year return period. Moreover, based on the study above, the debris flow peak discharges calculated by Equations (14)–(16) were similar to the values obtained by the cross-section survey method. Thus, we conclude that the debris flow peak discharge on 4 August 2016 was amplified by the failure of the check dam, causing widespread damage, and this aspect also explains why the magnitude of the debris flow on 4 August 2016 was large even though the accumulated rainfall and rainfall intensity were extremely low. Similarly, check dam failures have led to catastrophic disasters in other regions, such as the “8.13” Wenjiagou debris flow event [72] and the “8.8” Zhouqu debris flow event [73,74].
- (2)
- Based on the above analysis, the flood peak discharge estimated by the method of Helley is the largest, and is equivalent to that of a debris flow with a 10-year return period. Both of the peak discharges calculated by the methods of Clarke and Helley are larger than the actual value, while the value calculated by the method of Williams is smaller than the actual value. In addition, compared with the extensive destruction of the 2016 debris flow event with a 20-year return period, the destruction of the 2017 debris flow event was smaller, according to the field investigation. Therefore, it is reasonable that the magnitude of the debris flow in September 2017 was less than that of a debris flow with a 10-year return period.
- (3)
- In the remote mountain areas of China, rainfall data are difficult to obtain, and the rainfall throughout a whole catchment usually cannot be recorded by precipitation stations due to the influence of terrain, resulting in inconsistencies between the triggering rainfall and the scale of debris flow disasters. Thus, the relationships between the occurrence of debris flow disasters and the triggering rainfall are not researched in this paper.
5.3. Mitigation Countermeasures in Zechawa Gully
5.4. Effectiveness of Mitigation Countermeasures and Evaluation of Debris Flow Impact Force
6. Conclusions
- (1)
- In this study, the debris flow peak discharge was calculated using the rain-flood method, cross-section survey method, dam-breaking calculation method and maximum boulder size method. Based on our research, compared with previous results based on a single method, an accurate debris flow peak discharge can be obtained by comparing the results of each calculation method with each other, which increases the parameter accuracy for debris flow disaster prevention and risk assessment.
- (2)
- According to the classification criterion of the debris flow scale, the debris flows in Zechawa Gully can be classified as small-scale events (with a total volume of debris flow material less than 1.0 × 10⁴ m3) and medium-scale events (with a total volume of debris flow material between 1.0 × 10⁴ m3 and 10 × 104 m3) [81]. The scale of the debris flow event on 4 August 2016 was equivalent to that of a debris flow with a 20-year return period. After the Ms 7.0 Jiuzhaigou earthquake, at least one debris flow with a scale less than that of a debris flow with a 10-year return period was triggered in September 2017, and a destructive debris flow with a scale greater than that of a debris flow with a 50-year return period was triggered in June 2019.
- (3)
- The debris flow peak discharge on 4 August 2016 was amplified by the failure of the stone masonry check dam, causing widespread damage. Due to the disaster risk caused by dam breach incidents, an integrated strategy including blocking measures and deposit stopping measures should be adopted for debris flow mitigation.
- (4)
- Based on the debris flow hazard characteristics of Zechawa Gully, optimized engineering countermeasures (including blocking measures and deposit stopping measures) with a design standard of a 50-year return period were proposed. Combined with the debris flow control principles for national parks, one satisfactorily concealed concrete check dam and one retaining wall out of view of tourists were constructed in Zechawa Gully in May 2019.
- (5)
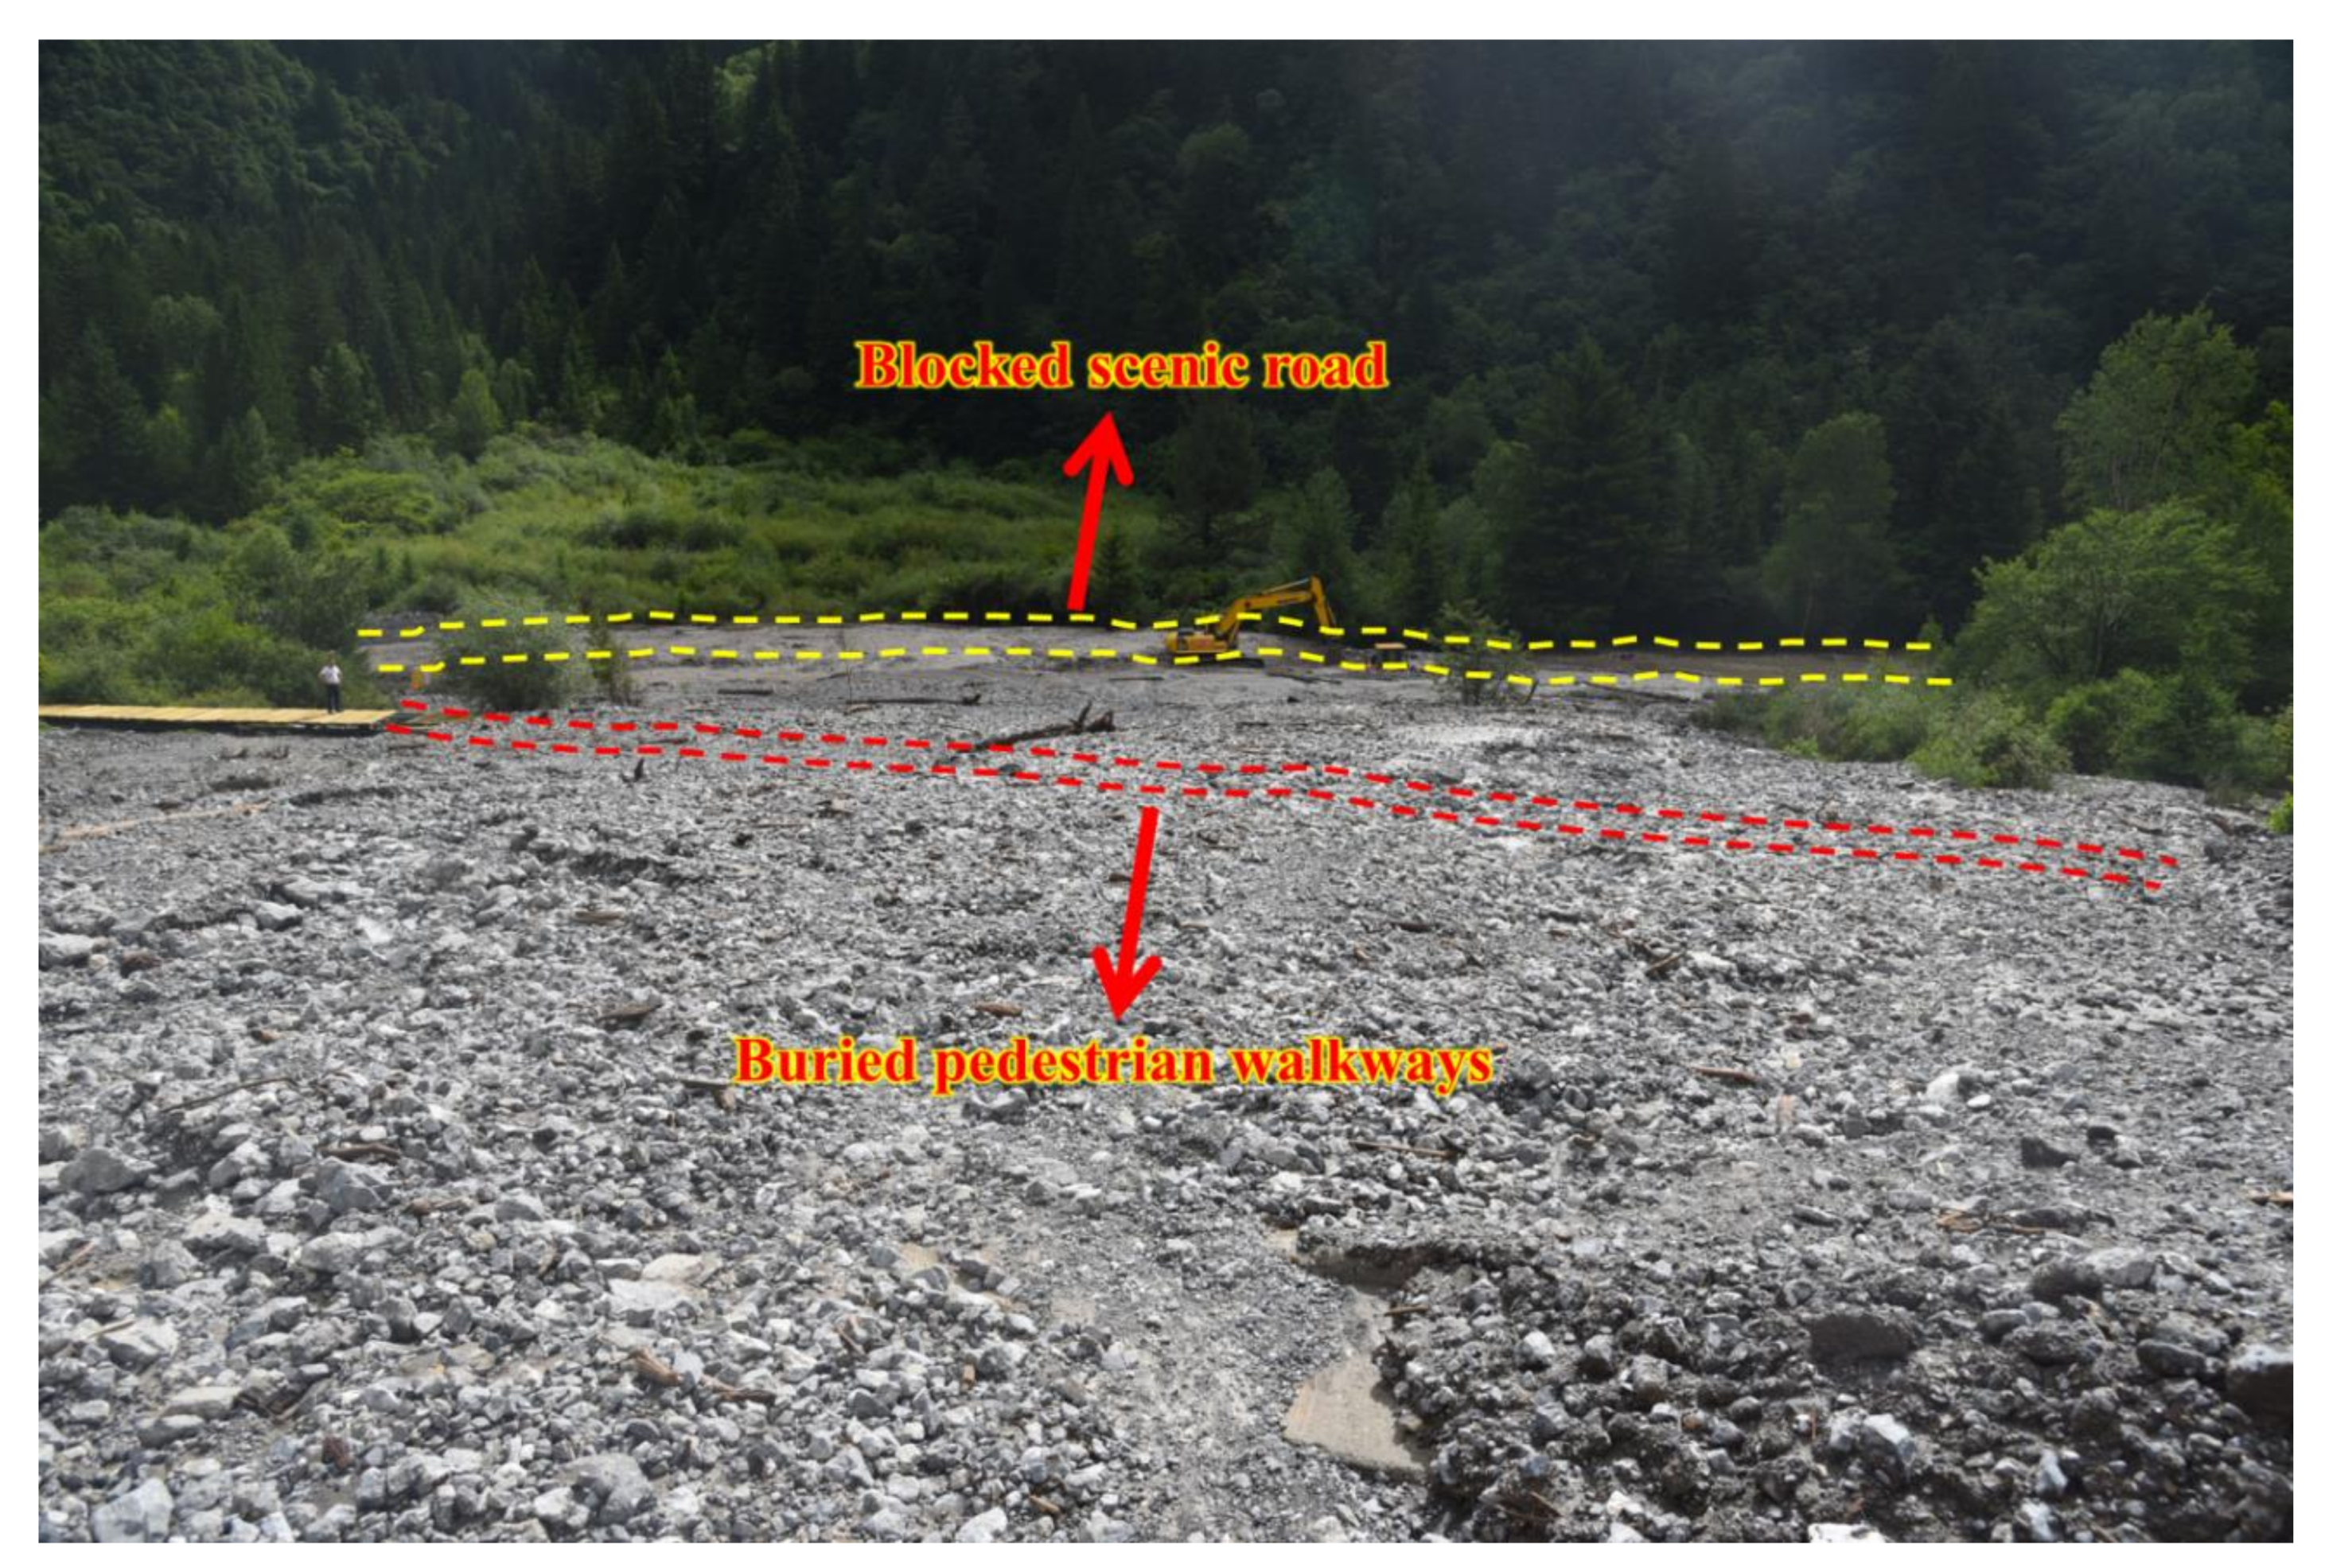
- On 21 June 2019, a post-earthquake debris flow was triggered by heavy rainfall, and the engineering countermeasure, including blocking and deposit stopping measures, were effective in mitigating the debris flow disaster even though the debris flow magnitude was greater than the design standard of the reconstructed engineering projects. More attention should be paid to the post-earthquake debris flow disaster in Zechawa Gully, and it is necessary to repair the broken retaining wall with greater design resistance and to remove the debris flow material deposited behind the retaining wall in a timely manner to prepare for upcoming post-earthquake debris flows in the near future.
Notation
| AB | Cross-sectional area of the largest boulder |
| Adf | Area of the cross-section |
| Bf | Channel width |
| Bm | Breach width |
| B0 | Debris flow width before breakage |
| C | Transported sediment concentration |
| CD | Lift coefficient of the boulder, which is dependent on the shape of largest boulder |
| C’D | Drag coefficient |
| CL | Lift drag coefficient, which is dependent on the shape of the largest boulder |
| D | Nominal diameter of the boulder |
| Ddf | Blockage coefficient |
| dI | Diameter of the boulder intermediate axis |
| dL | Diameter of the boulder large axis |
| dS | Diameter of the boulder short axis |
| F | Watershed area |
| FC | Critical force |
| FD | Drag force |
| Fr | Froude number |
| g | Acceleration due to gravity |
| H1 | 1-hour average rainfall |
| H6 | 6-hour average rainfall |
| hd | Residual height of check dam |
| hdf | Mean debris flow depth |
| hf | Mean flood depth |
| h0 | Debris flow depth before breakage |
| Idf | Longitudinal slope gradient of the channel bed |
| J | Longitudinal slope of the channel |
| K1 | Modulus coefficients corresponding to H1 under different return periods |
| K6 | Modulus coefficients corresponding to H6 under different return periods. |
| Kp | Modulus coefficient when the variation coefficient is equal to 0.23 |
| L | Main channel length |
| Lb | Deposit length of the debris flow material behind the check dam |
| MB | Boulder mass |
| MRD | Drag turning arm |
| MRL | Lift turning arm |
| m | Runoff confluence parameter |
| n | Attenuation index of the rainstorm |
| ndf | Roughness coefficient of the debris flow gully |
| nf | Roughness coefficient of a mountain stream |
| Ppeak | Peak impact pressure |
| Qdf | Debris flow peak discharge |
| Qf | Flood peak discharge |
| qf | Unit width flux |
| Rdf | Hydraulic radius of the debris flow |
| S | Rainfall intensity |
| Tdf | Duration time of the debris flow |
| t | Runoff confluence time of the rainstorm |
| t0 | Runoff confluence time of the rainstorm when ϕ equals 1. |
| Vavg | Average velocity |
| Vdf | Average velocity of the debris flow |
| Vf | Critical velocity (bed velocity) |
| Wdf | Total volume of the debris flow material |
| w | Unit stream power |
| α | Original imbrication angle of the deposited boulder |
| β | Bed slope angle |
| γdf | Density of the debris flow |
| γs | Density of the solid material |
| γw | Density of the water |
| θ | Watershed characteristic parameter |
| μ | Shape coefficient, which is dependent on the shape of the largest boulder |
| ρb | Maximum boulder density |
| ρf | Fluid density |
| ρs | Sediment density |
| τ | Bed shear stress |
| η | Runoff yield parameter, which reflects the average infiltration intensity |
| ϕ | Runoff coefficient of the flood peak, which is related to the convergence of runoff |
| φdf | Quasi-static friction angle |
| ψdf | Amplification coefficient of the debris flow peak discharge |
| κ | Influence factor that accounts for residual height |
Author Contributions
Funding
Conflicts of Interest
References
- Huggett, R. Fundamentals of Geomorphology; Routledge: London, UK, 2007. [Google Scholar] [CrossRef]
- Jakob, M.; Hungr, O. Debris-Flow Hazards and Related Phenomena; Springer: Berlin, Germany, 2005. [Google Scholar]
- Hungr, O.; Leroueil, S.; Picarelli, L. The Varnes classification of landslide types, an update. Landslides 2014, 11, 167–194. [Google Scholar] [CrossRef]
- Chen, K.-T.; Chen, X.-Q.; Hu, G.-S.; Kuo, Y.-S.; Huang, Y.-R.; Shieh, C.-L. Dimensionless assessment method of landslide dam formation caused by tributary debris flow events. Geofluids 2019. [Google Scholar] [CrossRef] [Green Version]
- Chen, K.-T.; Chen, X.-Q.; Niu, Z.-P.; Guo, X.-J. Early identification of river blocking induced by tributary debris flow based on dimensionless volume index. Landslides 2019. [Google Scholar] [CrossRef]
- Chen, K.-T.; Lin, C.-H.; Chen, X.-Q.; Hu, G.-S.; Guo, X.-J.; Shieh, C.-L. An assessment method for debris flow dam formation in Taiwan. Earth Sci. Res. J. 2018, 22, 37–43. [Google Scholar] [CrossRef]
- Ni, H.; Zheng, W.; Song, Z.; Xu, W. Catastrophic debris flows triggered by a 4 July 2013 rainfall in Shimian, SW China: Formation mechanism, disaster characteristics and the lessons learned. Landslides 2014, 11, 909–921. [Google Scholar] [CrossRef]
- Tang, C.; Zhu, J.; Ding, J.; Cui, X.F.; Chen, L.; Zhang, J.S. Catastrophic debris flows triggered by a 14 August 2010 rainfall at the epicenter of the Wenchuan earthquake. Landslides 2011, 8, 485–497. [Google Scholar] [CrossRef]
- Yu, B.; Ma, Y.; Wu, Y. Case study of a giant debris flow in the Wenjia Gully, Sichuan Province, China. Nat. Hazards 2012, 65, 835–849. [Google Scholar] [CrossRef]
- Chen, M.-L.; Liu, X.-N.; Wang, X.-K.; Zhao, T.; Zhou, J.-W. Contribution of Excessive Supply of Solid Material to a Runoff-Generated Debris Flow during Its Routing Along a Gully and Its Impact on the Downstream Village with Blockage Effects. Water 2019, 11, 169. [Google Scholar] [CrossRef] [Green Version]
- Chen, X.; Cui, P.; You, Y.; Chen, J.; Li, D. Engineering measures for debris flow hazard mitigation in the Wenchuan earthquake area. Eng. Geol. 2015, 194, 73–85. [Google Scholar] [CrossRef]
- Ni, H.; Tang, C.; Zheng, W.; Xu, R.; Tian, K.; Xu, W. An overview of formation mechanism and disaster characteristics of post-seismic debris flows triggered by subsequent rainstorms in Wenchuan earthquake extremely stricken areas. Acta Geol. Sin. 2014, 88, 1310–1328. [Google Scholar] [CrossRef]
- Ni, H.Y.; Zheng, W.M.; Tie, Y.B.; Su, P.C.; Tang, Y.Q.; Xu, R.G.; Wang, D.W.; Chen, X.Y. Formation and characteristics of post-earthquake debris flow: A case study from Wenjia gully in Mianzhu, Sichuan, SW China. Nat. Hazards 2011, 61, 317–335. [Google Scholar] [CrossRef]
- Yu, B.; Wu, Y.; Chu, S. Preliminary study of the effect of earthquakes on the rainfall threshold of debris flows. Eng. Geol. 2014, 182, 130–135. [Google Scholar] [CrossRef]
- Guo, X.; Cui, P.; Li, Y.; Zhang, J.; Ma, L.; Mahoney, W.B. Spatial features of debris flows and their rainfall thresholds in the Wenchuan earthquake-affected area. Landslides 2016, 13, 1215–1229. [Google Scholar] [CrossRef]
- Guo, X.; Cui, P.; Marchi, L.; Ge, Y. Characteristics of rainfall responsible for debris flows in Wenchuan earthquake area. Environ. Earth Sci. 2017, 76, 596. [Google Scholar] [CrossRef]
- Li, T.-T.; Huang, R.-Q.; Pei, X.-J. Variability in rainfall threshold for debris flow after Wenchuan earthquake in Gaochuan River watershed, Southwest China. Nat. Hazards 2016, 82, 1967–1980. [Google Scholar] [CrossRef]
- Ma, C.; Wang, Y.; Hu, K.; Du, C.; Yang, W. Rainfall intensity-duration threshold and erosion competence of debris flows in four areas affected by the 2008 Wenchuan earthquake. Geomorphology 2017, 282, 85–95. [Google Scholar] [CrossRef]
- Shieh, C.L.; Chen, Y.S.; Tsai, Y.J.; Wu, J.H. Variability in rainfall threshold for debris flow after the Chi-Chi earthquake in central Taiwan, China. Int. J. Sediment Res. 2009, 24, 177–188. [Google Scholar] [CrossRef]
- Zhou, W.; Tang, C. Rainfall thresholds for debris flow initiation in the Wenchuan earthquake-stricken area, Southwestern China. Landslides 2014, 11, 877–887. [Google Scholar] [CrossRef]
- Tang, C.; van Asch, T.W.J.; Chang, M.; Chen, G.Q.; Zhao, X.H.; Huang, X.C. Catastrophic debris flows on 13 August 2010 in the Qingping area, Southwestern China: The combined effects of a strong earthquake and subsequent rainstorms. Geomorphology 2012, 139–140, 559–576. [Google Scholar] [CrossRef]
- Zeng, Q.L.; Yue, Z.Q.; Yang, Z.F.; Zhang, X.J. A case study of long-term field performance of check-dams in mitigation of soil erosion in Jiangjia stream, China. Environ. Geol. 2008, 58, 897–911. [Google Scholar] [CrossRef]
- Peng, C.; Yongming, L. Debris-Flow Treatment: The Integration of Botanical and Geotechnical Methods. J. Resour. Ecol. 2013, 4, 097–104. [Google Scholar] [CrossRef]
- DeWolfe, V.G.; Santi, P.M.; Ey, J.; Gartner, J.E. Effective mitigation of debris flows at Lemon Dam, La Plata County, Colorado. Geomorphology 2008, 96, 366–377. [Google Scholar] [CrossRef]
- Piton, G.; Carladous, S.; Recking, A.; Tacnet, J.M.; Liébault, F.; Kuss, D.; Quefféléan, Y.; Marco, O. Why do we build check dams in Alpine streams? An historical perspective from the French experience. Earth Surf. Process. Landf. 2016, 42, 91–108. [Google Scholar] [CrossRef]
- Cucchiaro, S.; Cavalli, M.; Vericat, D.; Crema, S.; Llena, M.; Beinat, A.; Marchi, L.; Cazorzi, F. Geomorphic effectiveness of check dams in a debris-flow catchment using multi-temporal topographic surveys. CATENA 2019, 174, 73–83. [Google Scholar] [CrossRef]
- Cucchiaro, S.; Cazorzi, F.; Marchi, L.; Crema, S.; Beinat, A.; Cavalli, M. Multi-temporal analysis of the role of check dams in a debris-flow channel: Linking structural and functional connectivity. Geomorphology 2019. [Google Scholar] [CrossRef]
- Piton, G.; Recking, A. Design of Sediment Traps with Open Check Dams. I: Hydraulic and Deposition Processes. J. Hydraul. Eng. 2016, 142. [Google Scholar] [CrossRef]
- Bernard, M.; Boreggio, M.; Degetto, M.; Gregoretti, C. Model-based approach for design and performance evaluation of works controlling stony debris flow with an application to a case study at Rovina di Cancia (Venetian Dolomites, Northeast Italy). Sci. Total Environ. 2019. [Google Scholar] [CrossRef]
- Albaba, A.; Lambert, S.; Kneib, F.; Chareyre, B.; Nicot, F. DEM Modeling of a Flexible Barrier Impacted by a Dry Granular Flow. Rock Mech. Rock Eng. 2017, 50, 3029–3048. [Google Scholar] [CrossRef]
- Leonardi, A.; Wittel, F.K.; Mendoza, M.; Vetter, R.; Herrmann, H.J. Particle-Fluid-Structure Interaction for Debris Flow Impact on Flexible Barriers. Comput.-Aided Civ. Infrastruct. Eng. 2015, 31, 323–333. [Google Scholar] [CrossRef] [Green Version]
- Zhu, Z.-H.; Yin, J.-H.; Qin, J.-Q.; Tan, D.-Y. A new discrete element model for simulating a flexible ring net barrier under rockfall impact comparing with large-scale physical model test data. Comput. Geotech. 2019, 116, 103208. [Google Scholar] [CrossRef]
- Albaba, A.; Lambert, S.; Nicot, F.; Chareyre, B. Relation between microstructure and loading applied by a granular flow to a rigid wall using DEM modeling. Granul. Matter 2015, 17, 603–616. [Google Scholar] [CrossRef]
- Wang, G.L. Lessons learned from protective measures associated with the 2010 Zhouqu debris flow disaster in China. Nat. Hazards 2013, 69, 1835–1847. [Google Scholar] [CrossRef]
- Liu, F.Z.; Xu, Q.; Dong, X.J.; Yu, B.; Frost, J.D.; Li, H.J. Design and performance of a novel multi-function debris flow mitigation system in Wenjia Gully, Sichuan. Landslides 2017, 14, 2089–2104. [Google Scholar] [CrossRef]
- Chen, X.-Q.; Chen, J.-G.; Cui, P.; You, Y.; Hu, K.-H.; Yang, Z.-J.; Zhang, W.-F.; Li, X.-P.; Wu, Y. Assessment of prospective hazards resulting from the 2017 earthquake at the world heritage site Jiuzhaigou Valley, Sichuan, China. J. Mt. Sci. 2018, 15, 779–792. [Google Scholar] [CrossRef]
- Hu, X.; Hu, K.; Tang, J.; You, Y.; Wu, C. Assessment of debris-flow potential dangers in the Jiuzhaigou Valley following the August 8, 2017, Jiuzhaigou earthquake, Western China. Eng. Geol. 2019, 256, 57–66. [Google Scholar] [CrossRef]
- Zhao, B.; Wang, Y.S.; Luo, Y.H.; Li, J.; Zhang, X.; Shen, T. Landslides and dam damage resulting from the Jiuzhaigou earthquake (8 August 2017), Sichuan, China. R. Soc. Open Sci. 2018, 5, 171418. [Google Scholar] [CrossRef] [Green Version]
- Chen, S.F.; Wilson, C.; Deng, Q.D.; Zhao, X.L.; Zhi, L.L. Active faulting and block movement associated with large earthquakes in the Min Shan and Longmen Mountains, Northeastern Tibetan Plateau. J. Geophys. Res. Solid Earth 1994, 99, 24025–24038. [Google Scholar] [CrossRef]
- Yin, A.; Harrison, T.M. Geologic evolution of the Himalayan-Tibetan orogen. Ann. Rev. Earth Planet. Sci. 2000, 28, 211–280. [Google Scholar] [CrossRef] [Green Version]
- Zhao, D.; Qu, C.; Shan, X.; Gong, W.; Zhang, Y.; Zhang, G. InSAR and GPS derived coseismic deformation and fault model of the 2017 Ms7.0 Jiuzhaigou earthquake in the Northeast Bayanhar block. Tectonophysics 2018, 726, 86–99. [Google Scholar] [CrossRef]
- Liu, Z.; Tian, X.; Gao, R.; Wang, G.; Wu, Z.; Zhou, B.; Tan, P.; Nie, S.; Yu, G.; Zhu, G.; et al. New images of the crustal structure beneath eastern Tibet from a high-density seismic array. Earth Planet. Sci. Lett. 2017, 480, 33–41. [Google Scholar] [CrossRef]
- Ren, J.; Xu, X.; Yeats, R.S.; Zhang, S. Millennial slip rates of the Tazang fault, the Eastern termination of Kunlun fault: Implications for strain partitioning in eastern Tibet. Tectonophysics 2013, 608, 1180–1200. [Google Scholar] [CrossRef]
- Zhao, X.L.; Deng, Q.D.; Chen, S.F. Tectonic geomorphology of the Minshan uplift in Western Sichuan, Southwestern China. Seismol. Geol. 1994, 16, 429–439. (In Chinese) [Google Scholar]
- Zhou, R.; Li, Y.; Densmore, A.L.; Ellis, M.A.; He, Y.; Wang, F.; Li, X. Active tectonics of the eastern margin of the Tibet Plateau. J. Mineral. Petrol. 2006, 26, 40–51. (In Chinese) [Google Scholar] [CrossRef] [Green Version]
- Fan, X.; Scaringi, G.; Xu, Q.; Zhan, W.; Dai, L.; Li, Y.; Pei, X.; Yang, Q.; Huang, R. Coseismic landslides triggered by the 8th August 2017 M s 7.0 Jiuzhaigou earthquake (Sichuan, China): Factors controlling their spatial distribution and implications for the seismogenic blind fault identification. Landslides 2018, 15, 967–983. [Google Scholar] [CrossRef]
- Nie, Z.; Wang, D.-J.; Jia, Z.; Yu, P.; Li, L. Fault model of the 2017 Jiuzhaigou Mw 6.5 earthquake estimated from coseismic deformation observed using global positioning system and interferometric synthetic aperture radar data. Earth Planets Space 2018, 70, 55. [Google Scholar] [CrossRef] [Green Version]
- Xie, Z.; Zheng, Y.; Yao, H.; Fang, L.; Zhang, Y.; Liu, C.; Wang, M.; Shan, B.; Zhang, H.; Ren, J.; et al. Preliminary analysis on the source properties and seismogenic structure of the 2017 Ms7.0 Jiuzhaigou earthquake. Sci. China Earth Sci. 2018, 61, 339–352. [Google Scholar] [CrossRef]
- Cui, P.; Liu, S.Q.; Tang, B.X.; Chen, X.; Zhang, X. Debris Flow Study and Prevention in National Park; Science Press: Beijing, China, 2005; pp. 90–92. (In Chinese) [Google Scholar]
- Jiang, T.; Yang, J.C.; Peng, S.E.; Wang, S.F.; Zhou, Y.; Qi, Y.L.; Wei, J.G. Construction Drawing Design Report for the Control Projects of Zechawa and Xiajijie Debris Flow Disasters in Jiuzhaigou Valley; Nuclear Industry Southwest Survey and Design Institute Co., Ltd.: Chengdu, China, 2009. [Google Scholar]
- Sun, H.; You, Y.; Liu, J.-F. Experimental study on characteristics of trapping and regulating sediment with an open-type check dam in debris flow hazard mitigation. J. Mt. Sci. 2018, 15, 2001–2012. [Google Scholar] [CrossRef]
- You, Y.; Liu, J.F.; Chen, X.C. Debris flow and its characteristics of Subao River in Beichuan county after 5.12 Wenchuan earthquake. J. Mt. Sci. 2010, 28, 358–366. (In Chinese) [Google Scholar]
- Liu, J.; You, Y.; Chen, X.; Liu, J.; Chen, X. Characteristics and hazard prediction of large-scale debris flow of Xiaojia Gully in Yingxiu Town, Sichuan Province, China. Eng. Geol. 2014, 180, 55–67. [Google Scholar] [CrossRef]
- Zhou, B.F.; Li, D.J.; Luo, D.F.; Lv, R.R.; Yang, Q.X. Guide to Prevention of Debris Flow; Science Press: Beijing, China, 1991; pp. 80–95. (In Chinese) [Google Scholar]
- Tang, C.; Rengers, N.V.; van Asch, T.W.; Yang, Y.; Wang, G. Triggering conditions and depositional characteristics of a disastrous debris flow event in Zhouqu city, Gansu Province, Northwestern China. Nat. Hazards Earth Syst. Sci. 2011, 11, 2903–2912. [Google Scholar] [CrossRef] [Green Version]
- Xiong, M.Q.; Meng, X.M.; Wang, S.Y.; Guo, P.; Li, Y.J.; Chen, G.; Qing, F.; Cui, Z.J.; Zhao, Y. Effectiveness of debris flow mitigation strategies in mountainous regions. Prog. Phys. Geogr. 2016, 40, 768–793. [Google Scholar] [CrossRef]
- Costa, J.E. Paleohydraulic reconstruction of flash-flood peaks from boulder deposits in the Colorado front range. Geol. Soc. Am. Bull. 1983, 94, 986–1004. [Google Scholar] [CrossRef]
- Lanzoni, S.; Gregoretti, C.; Stancanelli, L.M. Coarse-grained debris flow dynamics on erodible beds. J. Geophys. Res. Earth Surf. 2017, 122, 592–614. [Google Scholar] [CrossRef]
- Chanson, H. The Hydraulics of Open Channel Flow: An Introduction, 2rd ed.; Elsevier Butterworth-Heinemann: Oxford, UK, 2004. [Google Scholar]
- Subramanya, K. Flow in Open Channels, 3rd ed.; Elsevier Butterworth-Heinemann: Oxford, UK, 2009. [Google Scholar]
- Ministry of Water Resources of the People’s Republic of China (MWR). Technique Guideline for Emergency Disposal of Landslide Lake; SL451-2009; Standards Press of China: Beijing, China, 2009; pp. 22–25. (In Chinese) [Google Scholar]
- Dai, R.Y.; Wang, Q. Research on the maximum discharge of dam-breaking. J. Hydraul. Eng. 1983, 2, 15–23. (In Chinese) [Google Scholar]
- Takahashi, T. Debris Flow Mechanics, Prediction and Countermeasures; Taylor & Francis Group: London, UK, 2007; pp. 45–47. [Google Scholar] [CrossRef]
- Schoklitsch, A. Der geschiebetrieb und die geschiebefracht. Wasserkraft Wasserwirtschaft 1934, 29, 37–43. [Google Scholar]
- Du, C.; Yao, L.-K.; Shakya, S.; Li, L.-G.; Sun, X.-D. Damming of large river by debris flow: Dynamic process and particle composition. J. Mt. Sci. 2014, 11, 634–643. [Google Scholar] [CrossRef]
- Helley, E.J. Field Measurement of the Initiation of Large Bed Particle Motion in Blue Creek Near Kalmath, California; US Geological Survey Professional Paper; United States Government Printing Office: Washington, DC, USA, 1969. [Google Scholar]
- Williams, G.P. Paleohydrological methods and some examples from Swedish fluvial environments: I cobble and boulder deposits. Geogr. Ann. Ser. A Phys. Geogr. 1983, 65, 227–243. [Google Scholar] [CrossRef]
- Clarke, A.O. Estimating probable maximum floods in the Upper Santa Ana Basin, Southern California, from stream boulder size. Environ. Eng. Geosci. 1996, 2, 165–182. [Google Scholar] [CrossRef]
- Zhao, Z.X.; He, J.J. Hydraulics; Tsinghua University Press: Beijing, China, 2010; pp. 176–177. (In Chinese) [Google Scholar]
- China Association of Geological Hazard Prevention (CAGHP). Specification of Design for Debris Flow Prevention; T/CAGHP 021-2018; China University of Geosciences Press: Wuhan, China, 2018; pp. 3–6. (In Chinese) [Google Scholar]
- Rickenmann, D. Hyperconcentrated Flow and Sediment Transport at Steep Slopes. J. Hydraul. Eng. 1991, 117, 1419–1439. [Google Scholar] [CrossRef]
- You, Y.; Chen, X.; Liu, J. 8.13″ extra large debris flow disaster in Wenjia gully of Qingping Township, Mianzhu, Sichuan Province. J. Catastrophol. 2011, 26, 68–72. (In Chinese) [Google Scholar]
- Cui, P.; Zhou, G.G.D.; Zhu, X.H.; Zhang, J.Q. Scale amplification of natural debris flows caused by cascading landslide dam failures. Geomorphology 2013, 182, 173–189. [Google Scholar] [CrossRef]
- Zhou, G.G.D.; Cui, P.; Chen, H.Y.; Zhu, X.H.; Tang, J.B.; Sun, Q.C. Experimental study on cascading landslide dam failures by upstream flows. Landslides 2012, 10, 633–643. [Google Scholar] [CrossRef]
- Chen, X.Q.; Chen, X.Z.; Zhang, W.F.; Chen, K.T.; Yang, D.X.; Hu, K.; Gong, X.L.; Si, G.W.; Xiong, Z. Investigation Report for the Control of Zechawa Debris Flow Disaster in Jiuzhaigou Valley, Jiuzhaigou County; Institute of Mountain Hazards and Environment, Chinese Academy of Sciences: Chengdu, China, 2017. (In Chinese) [Google Scholar]
- Cui, P.; Liu, S.; Tang, B.; Chen, X. Debris flow prevention pattern in national parks-taking the world natural heritage Jiuzhaigou as an example. Sci. China 2003, 46, 1–11. [Google Scholar] [CrossRef]
- Vagnon, F. Design of active debris flow mitigation measures: A comprehensive analysis of existing impact models. Landslides 2019. [Google Scholar] [CrossRef]
- Zhang, S.A. Comprehensive Approach to the Observation and Prevention of Debris Flows in China. Nat. Hazards 1993, 7, 1–23. [Google Scholar] [CrossRef]
- Cui, P.; Zeng, C.; Lei, Y. Experimental analysis on the impact force of viscous debris flow. Earth Surf. Process. Landf. 2015, 40, 1644–1655. [Google Scholar] [CrossRef] [Green Version]
- Vagnon, F.; Segalini, A. Debris flow impact estimation on a rigid barrier. Nat. Hazards Earth Syst. Sci. 2016, 16, 1691–1697. [Google Scholar] [CrossRef] [Green Version]
- Ministry of Land and Resources of the People’s Republic of China (MLR). Specification of Geological Investigation for Debris Flow Stabilization; DZ/T0220-2006; Standards Press of China: Beijing, China, 2006; pp. 2–3. (In Chinese) [Google Scholar]


| Zone Division | Formation Zone | Transport Zone | Deposition Zone |
|---|---|---|---|
| Elevation (m) | 4040–3620 | 3620–2600 | 2600–2439 |
| Average gully gradient (‰) | 708 | 415 | 244 |
| Gully length (m) | 470 | 1530 | 570 |
| Gully characteristics | Steep slope (>50°), bare bedrock with severe frost weathering, low vegetation coverage and abundant collapsed regions | Steep slopes, a large number of landslides and high abundance of debris flow sediments on the gully bed | Gentle topography with no collapses or landslides |
| Methods | Parameters | ||||||
|---|---|---|---|---|---|---|---|
| cross-section survey method | Adf (m2) | Rdf (m) | Idf | Vdf (m/s) | ndf | Qdf (m3/s) | |
| 6.45 | 0.75 | 0.391 | 5.16 | 0.1 | 33.29 | ||
| 9.58 | 0.85 | 0.182 | 3.83 | 0.1 | 36.69 | ||
| B0 (m) | h0 (m) | Bm (m) | hd (m) | Lb (m) | Qdf (m3/s) | ||
| dam-breaking calculation method | Equation (14) | 30.0 | 7.0 | 20.5 | 6.0 | / | 36.5 |
| Equation (15) | 30.0 | 7.0 | 20.5 | 6.0 | / | 43.6 | |
| Equation (16) | 30.0 | 7.0 | 20.5 | 6.0 | 44.0 | 36.8 | |
| Basic parameters | dL (m) | 1.3 | Bf (m) | 6.5 | ρs (kg/m3) | 2650 |
| dI (m) | 1.1 | β (degrees) | 19 | φdf (degrees) | 36.5 | |
| dS (m) | 0.7 | α (degrees) | 6 | C | 0.67 | |
| ρb (kg/m3) | 2250 | nf | 0.05 | |||
| Parameters | ||||||
| Method | Vavg(m/s) | hf(m) | Qf(m3/s) | Qdf(m3/s) | ||
| Schoklitsch [64] | / | / | 0.58 | 1.76 | ||
| Helley [66] | 4.26 | 0.22 | 6.05 | 18.33 | ||
| Williams [67] | Shear stress | 2.16 | 0.03 | 0.61 | 1.85 | |
| Stream power | 3.80 | 0.04 | 1.07 | 3.24 | ||
| Clarke [68] | 2.49 | 0.10 | 1.59 | 4.82 | ||
| Calculation Content | Parameters | Unit | Return Periods | ||
|---|---|---|---|---|---|
| 10-Year | 20-Year | 50-Year | |||
| The flood peak discharge | θ | // | 2.14 | 2.14 | 2.14 |
| m | / | 0.26 | 0.26 | 0.26 | |
| H1 | mm | 15 | 15 | 15 | |
| H6 | mm | 25 | 25 | 25 | |
| K1 | / | 1.72 | 2.10 | 2.58 | |
| K6 | / | 1.66 | 1.99 | 2.42 | |
| KP | / | 1.31 | 1.42 | 1.56 | |
| S | mm | 25.8 | 31.5 | 38.7 | |
| n | / | 0.73 | 0.74 | 0.8 | |
| η | mm/h | 4.26 | 4.62 | 5.07 | |
| t0 | h | 1.52 | 1.43 | 1.34 | |
| φ | / | 0.75 | 0.79 | 0.82 | |
| t | h | 1.66 | 1.54 | 1.43 | |
| Qf | m3/s | 6.37 | 8.58 | 11.55 | |
| The debris flow peak discharge | γdf | t/m3 | 1.8 | 1.85 | 1.9 |
| Ddf | / | 1.8 | 1.85 | 1.9 | |
| Qdf | m3/s | 22.27 | 32.73 | 48.27 | |
| Wdf | m3 | 0.88 × 10⁴ | 1.30 × 10⁴ | 1.91 × 10⁴ | |
| γdf (t/m3) | hf (m) | Rdf (m) | Idf | ndf | Fr | Ppeak (kN/m2) |
|---|---|---|---|---|---|---|
| 1.9 | 1.55 | 1.11 | 0.19 | 0.1 | 1.20 | 80.39 |
© 2020 by the authors. Licensee MDPI, Basel, Switzerland. This article is an open access article distributed under the terms and conditions of the Creative Commons Attribution (CC BY) license (http://creativecommons.org/licenses/by/4.0/).
Share and Cite
Gong, X.-L.; Chen, K.-T.; Chen, X.-Q.; You, Y.; Chen, J.-G.; Zhao, W.-Y.; Lang, J. Characteristics of a Debris Flow Disaster and Its Mitigation Countermeasures in Zechawa Gully, Jiuzhaigou Valley, China. Water 2020, 12, 1256. https://0-doi-org.brum.beds.ac.uk/10.3390/w12051256
Gong X-L, Chen K-T, Chen X-Q, You Y, Chen J-G, Zhao W-Y, Lang J. Characteristics of a Debris Flow Disaster and Its Mitigation Countermeasures in Zechawa Gully, Jiuzhaigou Valley, China. Water. 2020; 12(5):1256. https://0-doi-org.brum.beds.ac.uk/10.3390/w12051256
Chicago/Turabian StyleGong, Xing-Long, Kun-Ting Chen, Xiao-Qing Chen, Yong You, Jian-Gang Chen, Wan-Yu Zhao, and Jie Lang. 2020. "Characteristics of a Debris Flow Disaster and Its Mitigation Countermeasures in Zechawa Gully, Jiuzhaigou Valley, China" Water 12, no. 5: 1256. https://0-doi-org.brum.beds.ac.uk/10.3390/w12051256