Establishing a Smart Farm-Scale Piggery Wastewater Treatment System with the Internet of Things (IoT) Applications


1
Department of Animal Science and Technology, National Taiwan University, Taipei 10673, Taiwan
2
Bioenergy Research Center, College of Bioresources and Agriculture, National Taiwan University, Taipei 10617, Taiwan
*
Author to whom correspondence should be addressed.
Water 2020, 12(6), 1654; https://0-doi-org.brum.beds.ac.uk/10.3390/w12061654
Submission received: 7 May 2020
/
Revised: 4 June 2020
/
Accepted: 4 June 2020
/
Published: 9 June 2020
(This article belongs to the Special Issue Innovative Technologies for Wastewater and Water Treatment)
Abstract
:The conventional piggery wastewater treatment system is mainly a manual operation system which may be well managed by experienced technicians. However, the pig farmers must simultaneously manage their pig production as well as their on-farm wastewater treatment facility. For this study, Internet of Things (IoT) applications were introduced on a 1000-pig farm to establish a smart piggery wastewater treatment system, which was upgraded from a self-developed fully automatic wastewater treatment system. Results showed that the removal efficiency of biochemical oxygen demand (BOD), chemical oxygen demand (COD), and suspended solids (SS) of the piggery wastewater based on the sensor data before and after water quality sensor calibration were 89%, 94%, and 93%, and 94%, 86%, and 96%, respectively. Moreover, the removal efficiency of BOD, COD, and SS of the piggery wastewater based on the analytical chemical data before and after water quality sensor calibration were 93%, 89%, and 97%, and 94%, 86%, and 96%, respectively. Experimental results showed that overall removal efficiency of BOD, COD, and SS of the piggery wastewater after water quality sensor calibration were 94%, 86–87%, and 96%, respectively. Results revealed that the farm-scale smart piggery wastewater treatment system was feasible to be applied and extended to more commercial pig farms for establishing sustainable pig farming.
1. Introduction
To ensure world food security by 2050, livestock food, e.g., meat, egg, and milk, production must be increased by 70% in 10 years. The approach of decreasing the number of livestock farms, increasing farm-scale, and mitigating environmental impact is necessary [1]. Thus, a concept of precision livestock farming (PLF) is introduced and carried out gradually. The primary concept of PLF is providing an on-line monitoring and management system according to animal welfare guidelines and promoting livestock production efficiency [1]. Besides the online monitoring and management system of PLF, the livestock wastewater treatment system with automation has been developed since 1995 in Taiwan [2]. Piggery wastewater, i.e., a mixture of manure, urine, and clean water, must be well treated to meet the effluent limit of environmental protection agency (EPA) in Taiwan. The key facility of the piggery wastewater treatment system is a farm-scale sequencing batch reactor (SBR) controlled by a traditional timer or programmable logic controller (PLC) [2,3,4]. The full-scale demonstration sites include 500–2000 heads pig farms, a 200-head dairy farm, and the experimental livestock farm of National Taiwan University (NTU).
A Swedish research team has applied instrumentation control and automation (ICA) for a biological wastewater treatment plant. Experimental results showed that the wastewater treatment system can promote 10–30% nutrient removal efficiency and even 20–50% nutrient removal efficiency in the next 10 to 20 years due to ICA installation [5]. The ICA system has also been applied to sewage treatment control, drinking water treatment, and water resource distribution control for more than 40 years. in London, United Kingdom [6]. The ICA monitoring system mainly consists of a computer (data collection and calculation from sensors), sensor instrument, actuator, and so on. The sensor is applied to monitoring the flow rate, sludge blanket level, sludge settling velocity, respiration rate of activated sludge, suspended solids (SS), short-term biochemical oxygen demand (BOD), ammonium, nitrate, and phosphate. Some nutrients, e.g., nitrogen and phosphorus, online in situ sensors include ion-selective electrodes (ISE) and ultraviolet (UV) probes for determining ammonium, nitrate, and nitrite ions, respectively. Besides, several optical sensors based on luminescence techniques had been applied to online monitoring of dissolved oxygen (DO) instead of traditional membrane sensors. There is still a huge potential in using sensor networks. They consist of a group of sensors with a communications infrastructure with the purpose to monitor variables at diverse locations. An actuator is a component of a machine that is responsible for moving and controlling a mechanism or system by gas pressure, oil pressure, or electrical movement.
An Italian research team has applied a full-scale SBR system to treat piggery wastewater. The chemical oxygen demand (COD) removal efficiency of the Magreta plant achieved more than 90% [7]. The SBR system was also applied to treat slaughterhouse wastewater for more than one year of operation. Experimental results showed that the BOD, COD, and SS, and ammonium-nitrogen of the influent and effluent were 478, 780, 148, and 54.8 mg/L and 13.6, 50.1, 50, and 3.02 mg/L, respectively [8]. Moreover, The SBR system was also applied to treat duck house wastewater [9]. Experimental results showed that removal efficiency of COD in untreated duck house wastewater was 98.4%, 98.4%, 87.8%, and 72.5% for the different hydraulic retention times (HRTs) of 5, 3, 1, and 0.5 days, respectively. Besides, the removal efficiency of BOD in untreated duck house wastewater was 99.6%, 99.3%, 90.4%, and 58.0%, respectively. The pilot-scale SBR system was effective and deemed capable to be applied to treat duck house wastewater.
Some research has applied supervisory control and data acquisition (SCADA) with a PLC of an automatic sewage treatment system. The SCADA/PLC sewage treatment system can promote treatment efficiency and lower manpower requirements. The commonly used automation tool includes PLC, human–machine interface (HMI), distributed control system (DCS), SCADA, laboratory information management system (LIMS), programmable automatic controller (PAC), and manufacturing execution system (MES) [10].
The Internet of Things (IoT) is composed to make wastewater management safer and more efficient. The principle of IoT is to connect physical objects and spaces to the internet to monitor and utilize them at a full scale more effectively. The IoT has been applied to the remote monitoring system of pig motion behavior and piggery environment in China [11]. Besides, a smart sewer asset information model (SSAIM) had been developed in the United Kingdom by applying the IoT applications for the real-time prediction of flooding [12]. Some IoT applications have been applied to support smart and sustainable livestock production [13,14] and smart wastewater monitoring and control systems [15,16,17]. A wastewater facility installs smart sensors at various points in its water management system (https://blog.temboo.com/iot-and-wastewater-treatment-plants/). These sensors collect data on water quality and other environmental conditions. Those data can be sent back to a web application that synthesizes the information into actionable insights.
The objective of this study was to construct a farm-scale demonstration site of self-designed smart piggery wastewater treatment facility with remote monitoring and control through IoT applications. Hopefully, the achievements of this study can promote piggery wastewater treatment efficiency, lower manpower needs, and upgrade the livestock industry, as well as reduce the environmental impact of livestock farming.
2. Materials and Methods
2.1. Design of a Piggery Wastewater Treatment System on a Selected Pig Farm
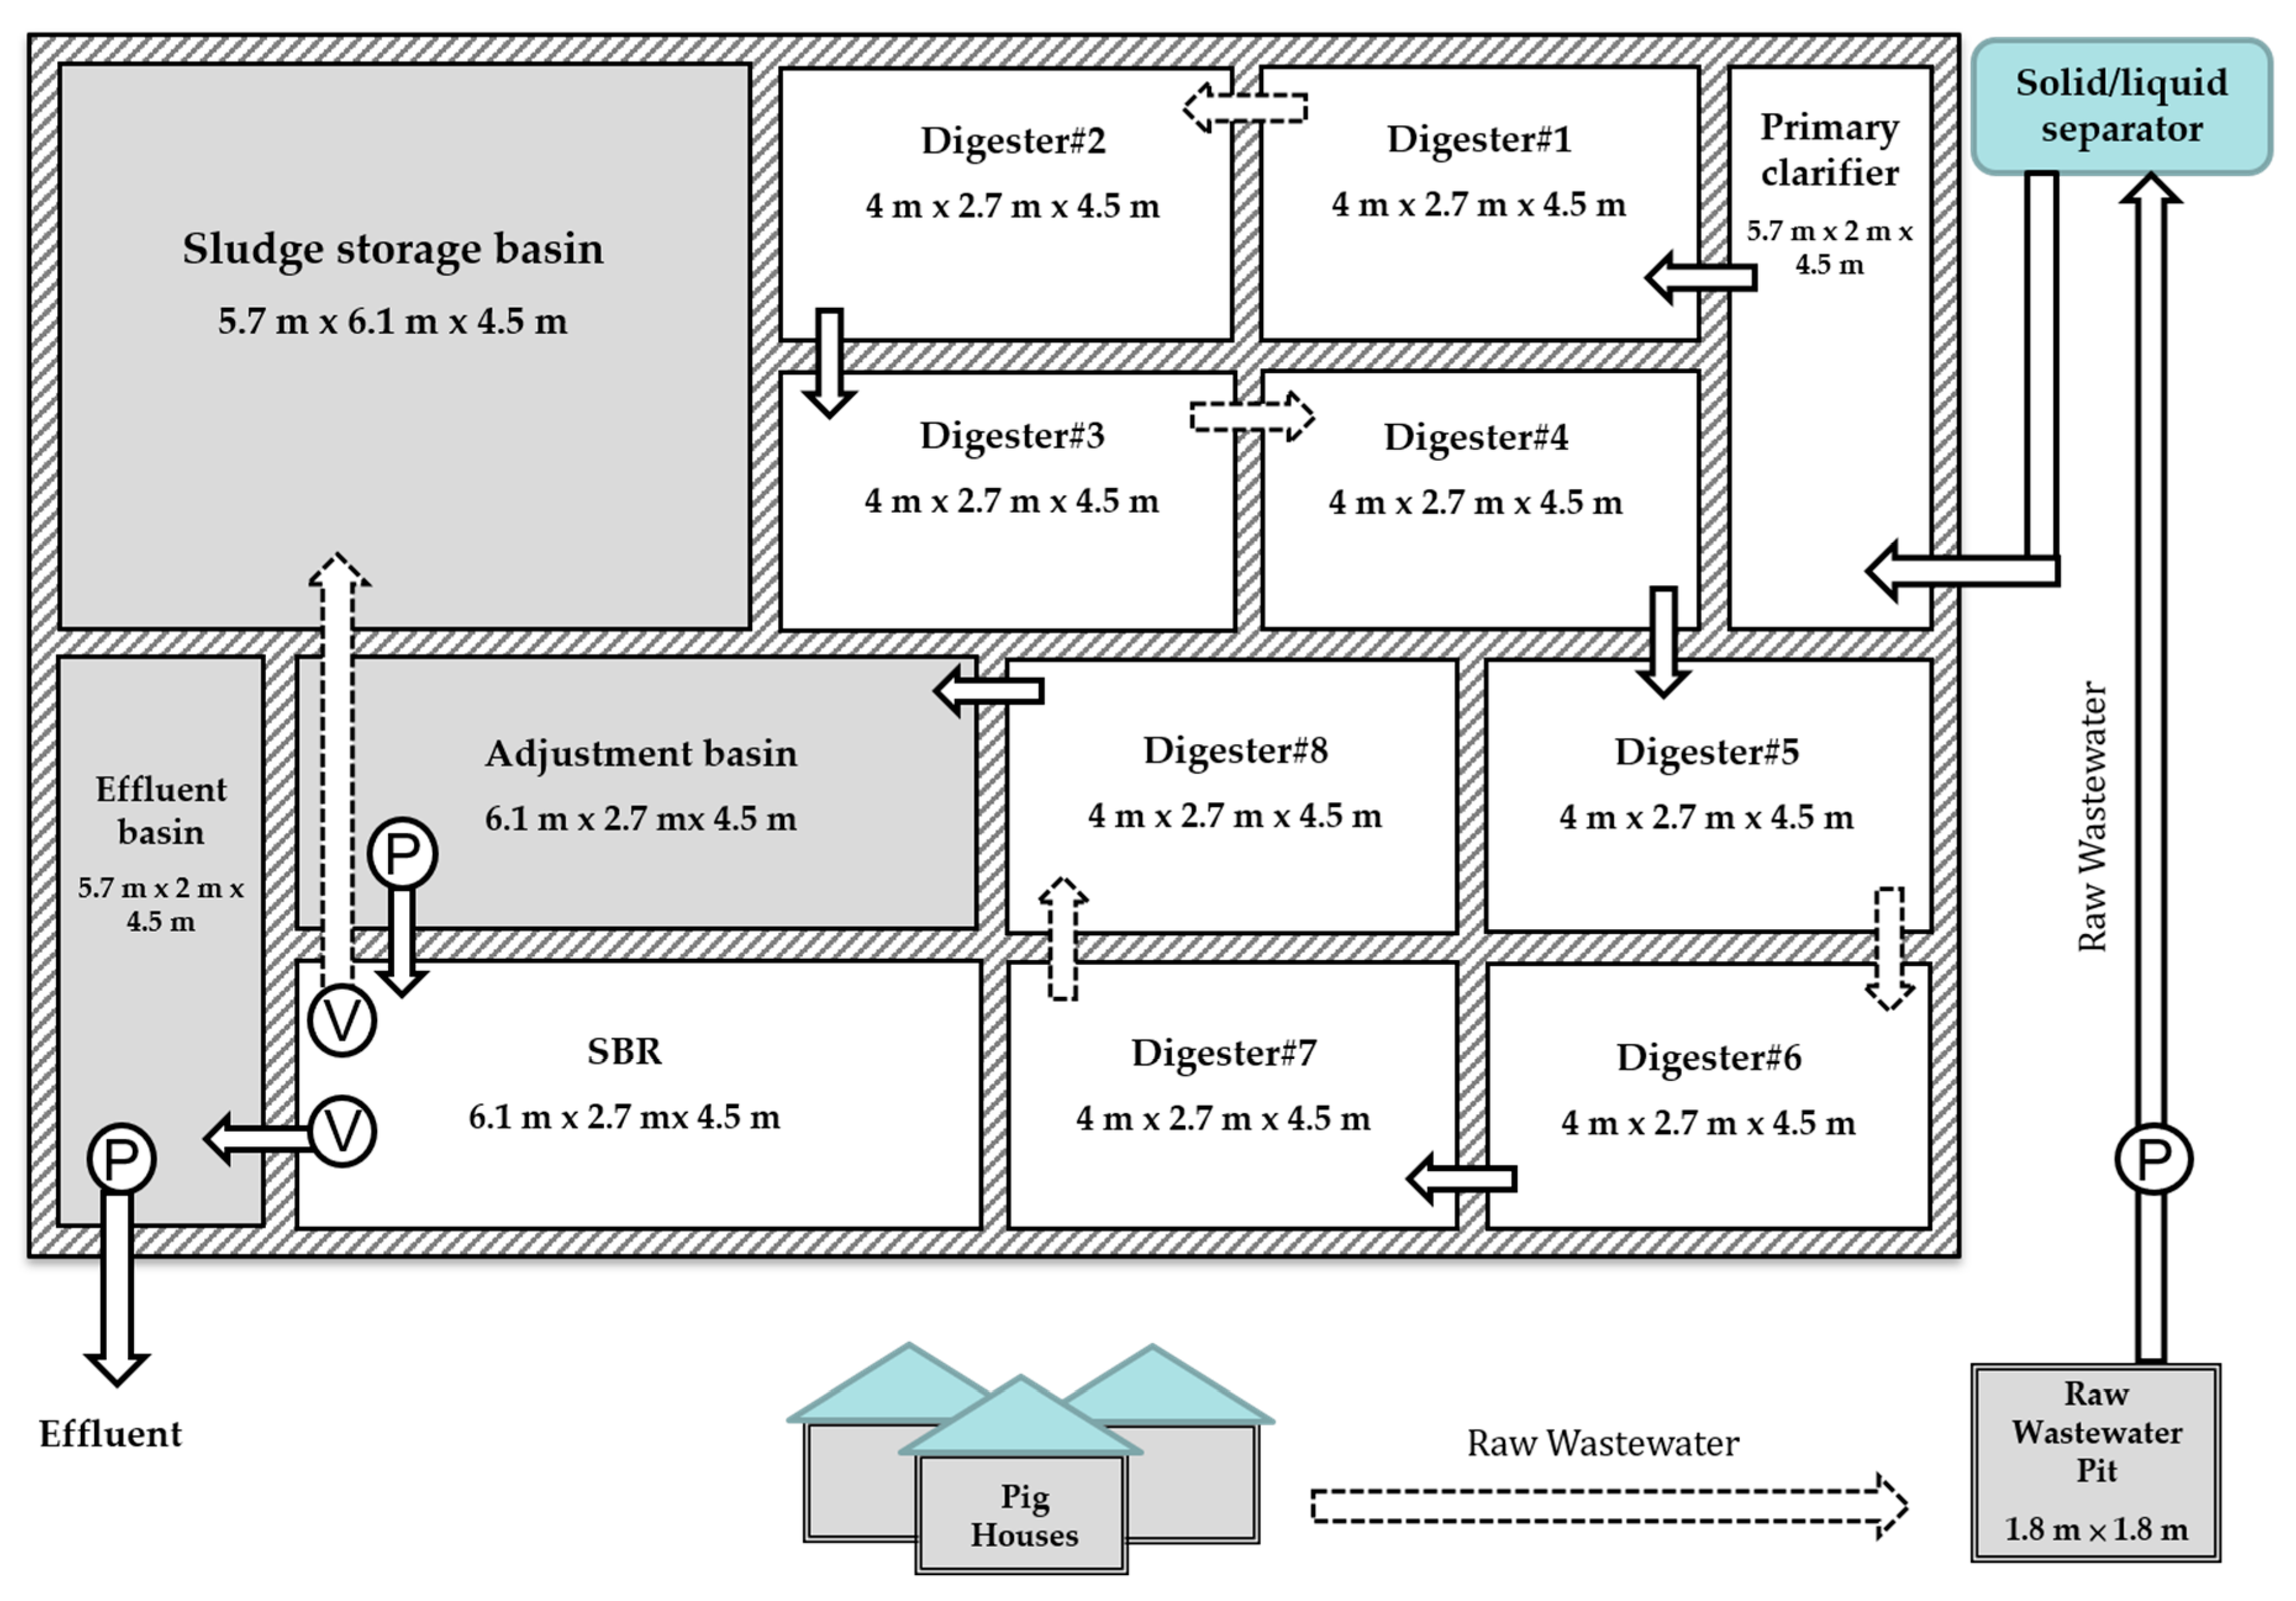
The selected commercial pig farm, about 1000 pigs on the farm, was located in I-Lan County, Taiwan (available online: https://www.facebook.com/iyangranch/; accessed on 29 May 2020). The estimated daily wastewater was 30 m3/day (30 L/pig/day × 1000 pigs ×10−3 m3/L), but the actual daily wastewater was about 48 m3/day (i.e., most rainwater was mixed with raw wastewater on the farm). A newly designed and constructed wastewater treatment system was constituted of raw wastewater pig, primary clarifier, anaerobic digesters, adjustment basin, sequencing batch reactor (SBR), effluent basin, and sludge storage basin. Some basins were constructed underground (length × width × water depth) such as raw wastewater pit (1.8 m × 1.8 m × 4 m), adjustment basin (6.1 m × 2.7 m × 4.5 m), effluent basin (5.7 m × 2 m × 4.5 m), and sludge storage basin (5.7 m × 6.1 m × 4.5 m). The others were constructed above ground (length × width × water depth), about 5 m in height, such as primary clarifier (5.7 m × 2 m × 4.5 m), anaerobic digesters (4 m × 2.7 m × 4.5 m for each digester), and SBR (6.1 m × 2.7 m × 4.5 m). A flowchart of the newly constructed wastewater treatment system is shown in Figure 1. The appearance of the wastewater treatment system and PLC panel box with a human–machine interface (HMI) are shown in Figure 2 and Figure 3, respectively. The hydraulic retention time (HRT) of the raw wastewater pit, primary clarifier, digesters, adjustment basin, SBR, and sludge storage basin was 0.3, 1.1, 8.1, 1.5, 1.5, and 3.3 days, respectively. The SBR was operated by a 5-HP root blower under an alternative aeration process to ensure energy saving of aeration as well as ammonium removal enhancement of the treatment process [2,3,4,9].
2.2. Automatic Control Mode of Piggery Wastewater Treatment System
The daily cleaning periods of pig pens were at 09:00–11:00 and 14:00–16:30. Daily piggery wastewater volume was 48 m3/day, and the available volume of the SBR was 74 m3 (i.e., 6.1 m × 2.7 m × 4.5 m; L × W × water depth). The daily discharging volume of effluent was 48 m3 in 15 min by a 4” poly vinyl chloride (PVC) motor-operated valve. Thus, the same volume of influent, 48 m3, was pumped into the SBR daily from the adjustment basin. The process of the whole piggery wastewater system was controlled by a programmable logic controller (PLC) with an HMI as follows: Pig houses → Raw wastewater pit (water level controlled with a water pump) → Solid/liquid separator → Primary clarifier (overflow) → Anaerobic digester #1 (overflow) → Anaerobic digester #2 (overflow) → Anaerobic digester #3 (overflow) → Anaerobic digester #4 (overflow) → Anaerobic digester #5 (overflow) → Anaerobic digester #6 (overflow) → Anaerobic digester #7 (overflow) → Anaerobic digester #8 (overflow) → Adjustment basin (PLC controlled with a water pump) → SBR → Effluent basin → Effluent discharge. The effluent was discharged twice a day from the effluent basin. Thus, the influent was introduced constantly into the system. Moreover, the SBR operation mode is shown in Table 1.
2.3. Smart Piggery Wastewater Treatment System with the Internet of Things (IoT) Applications
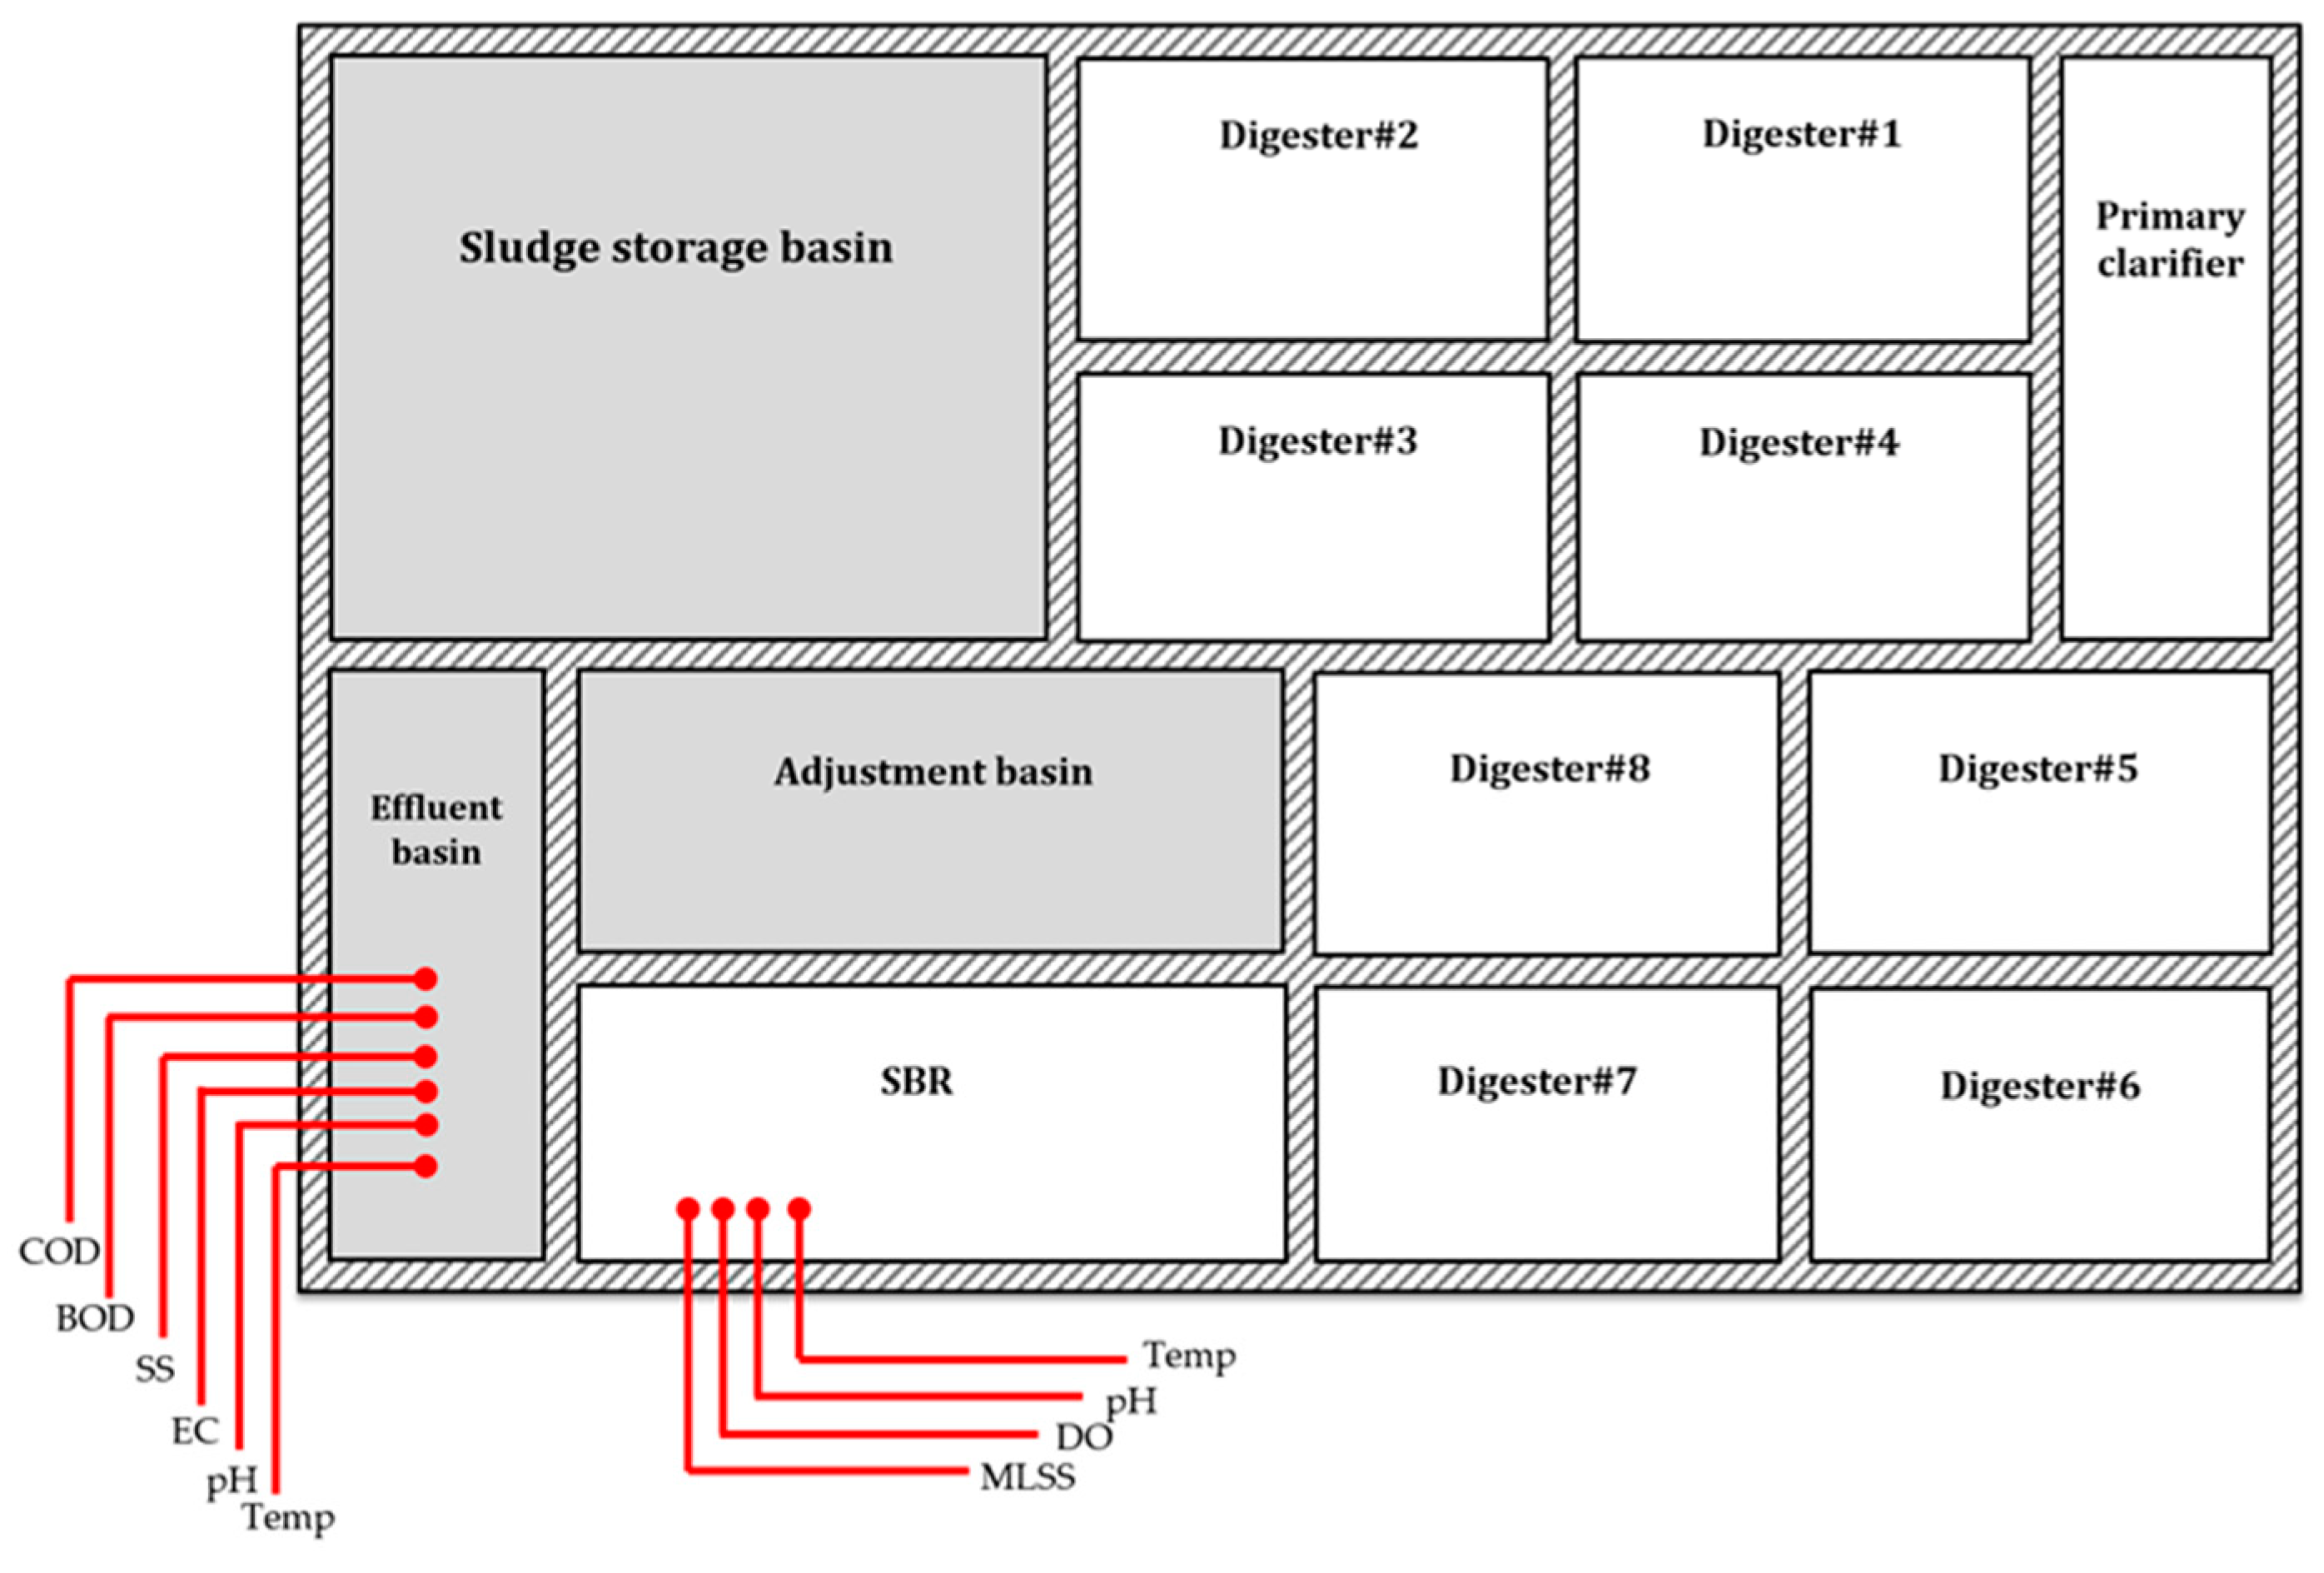
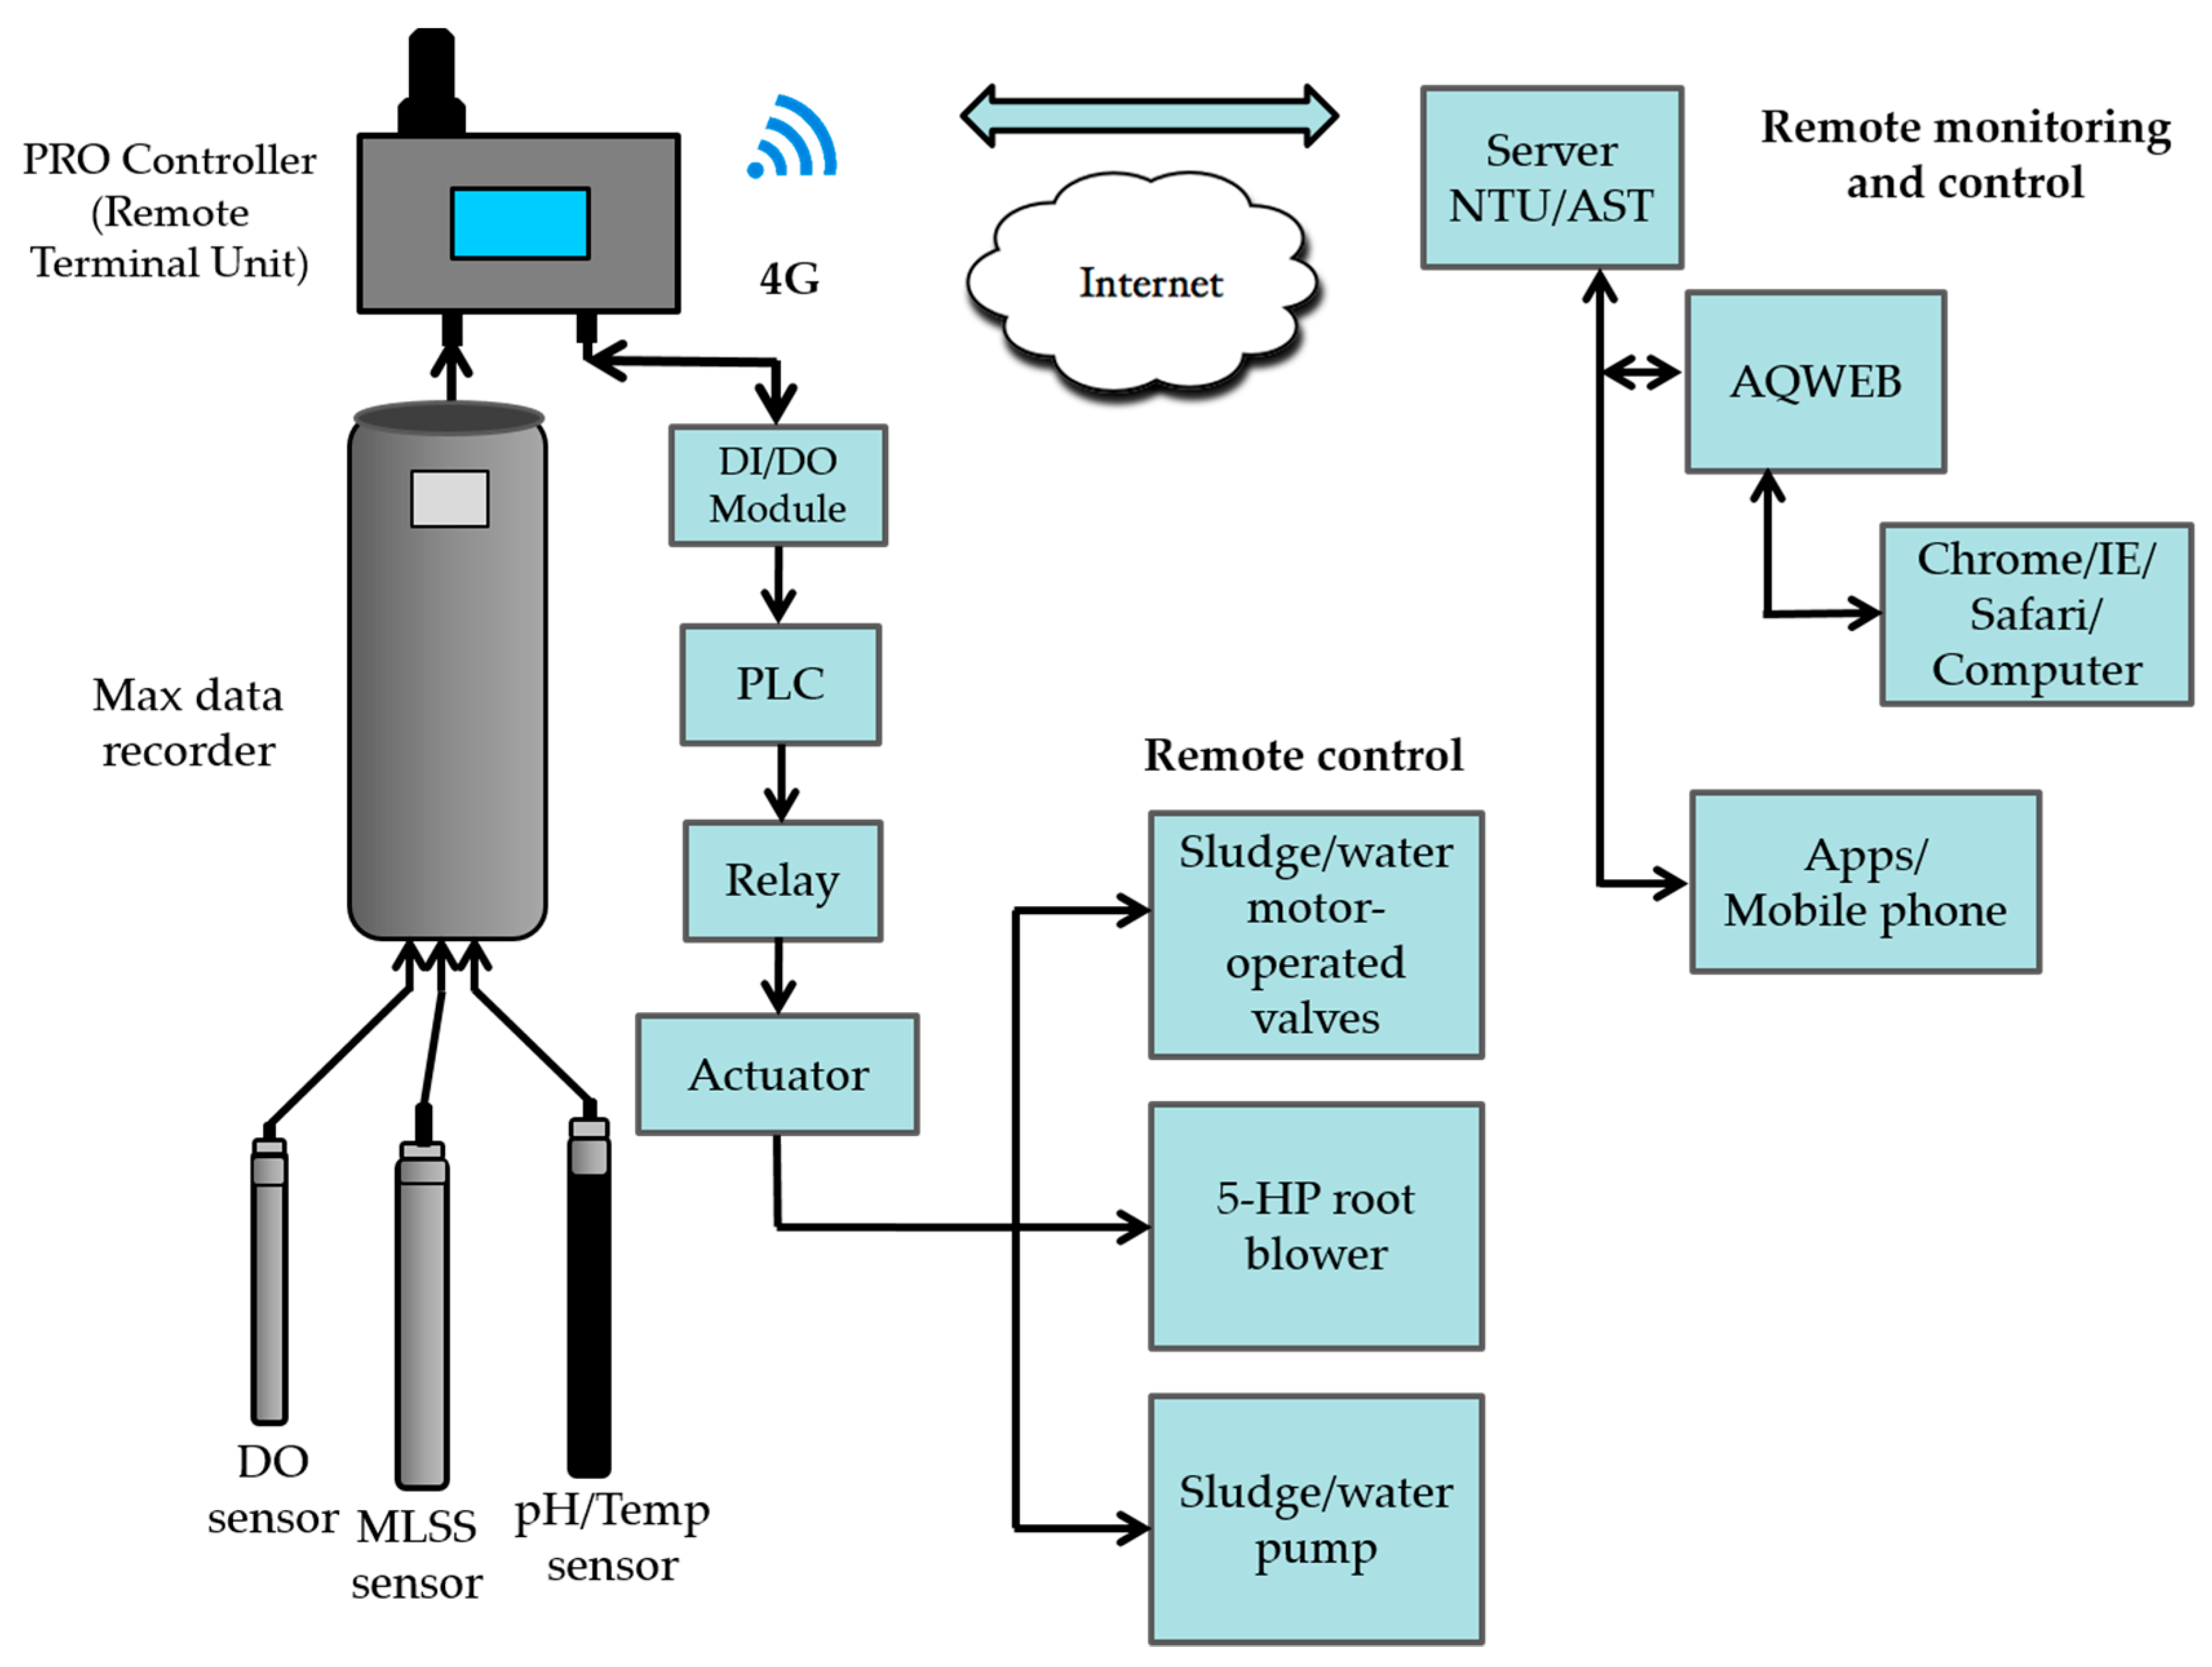
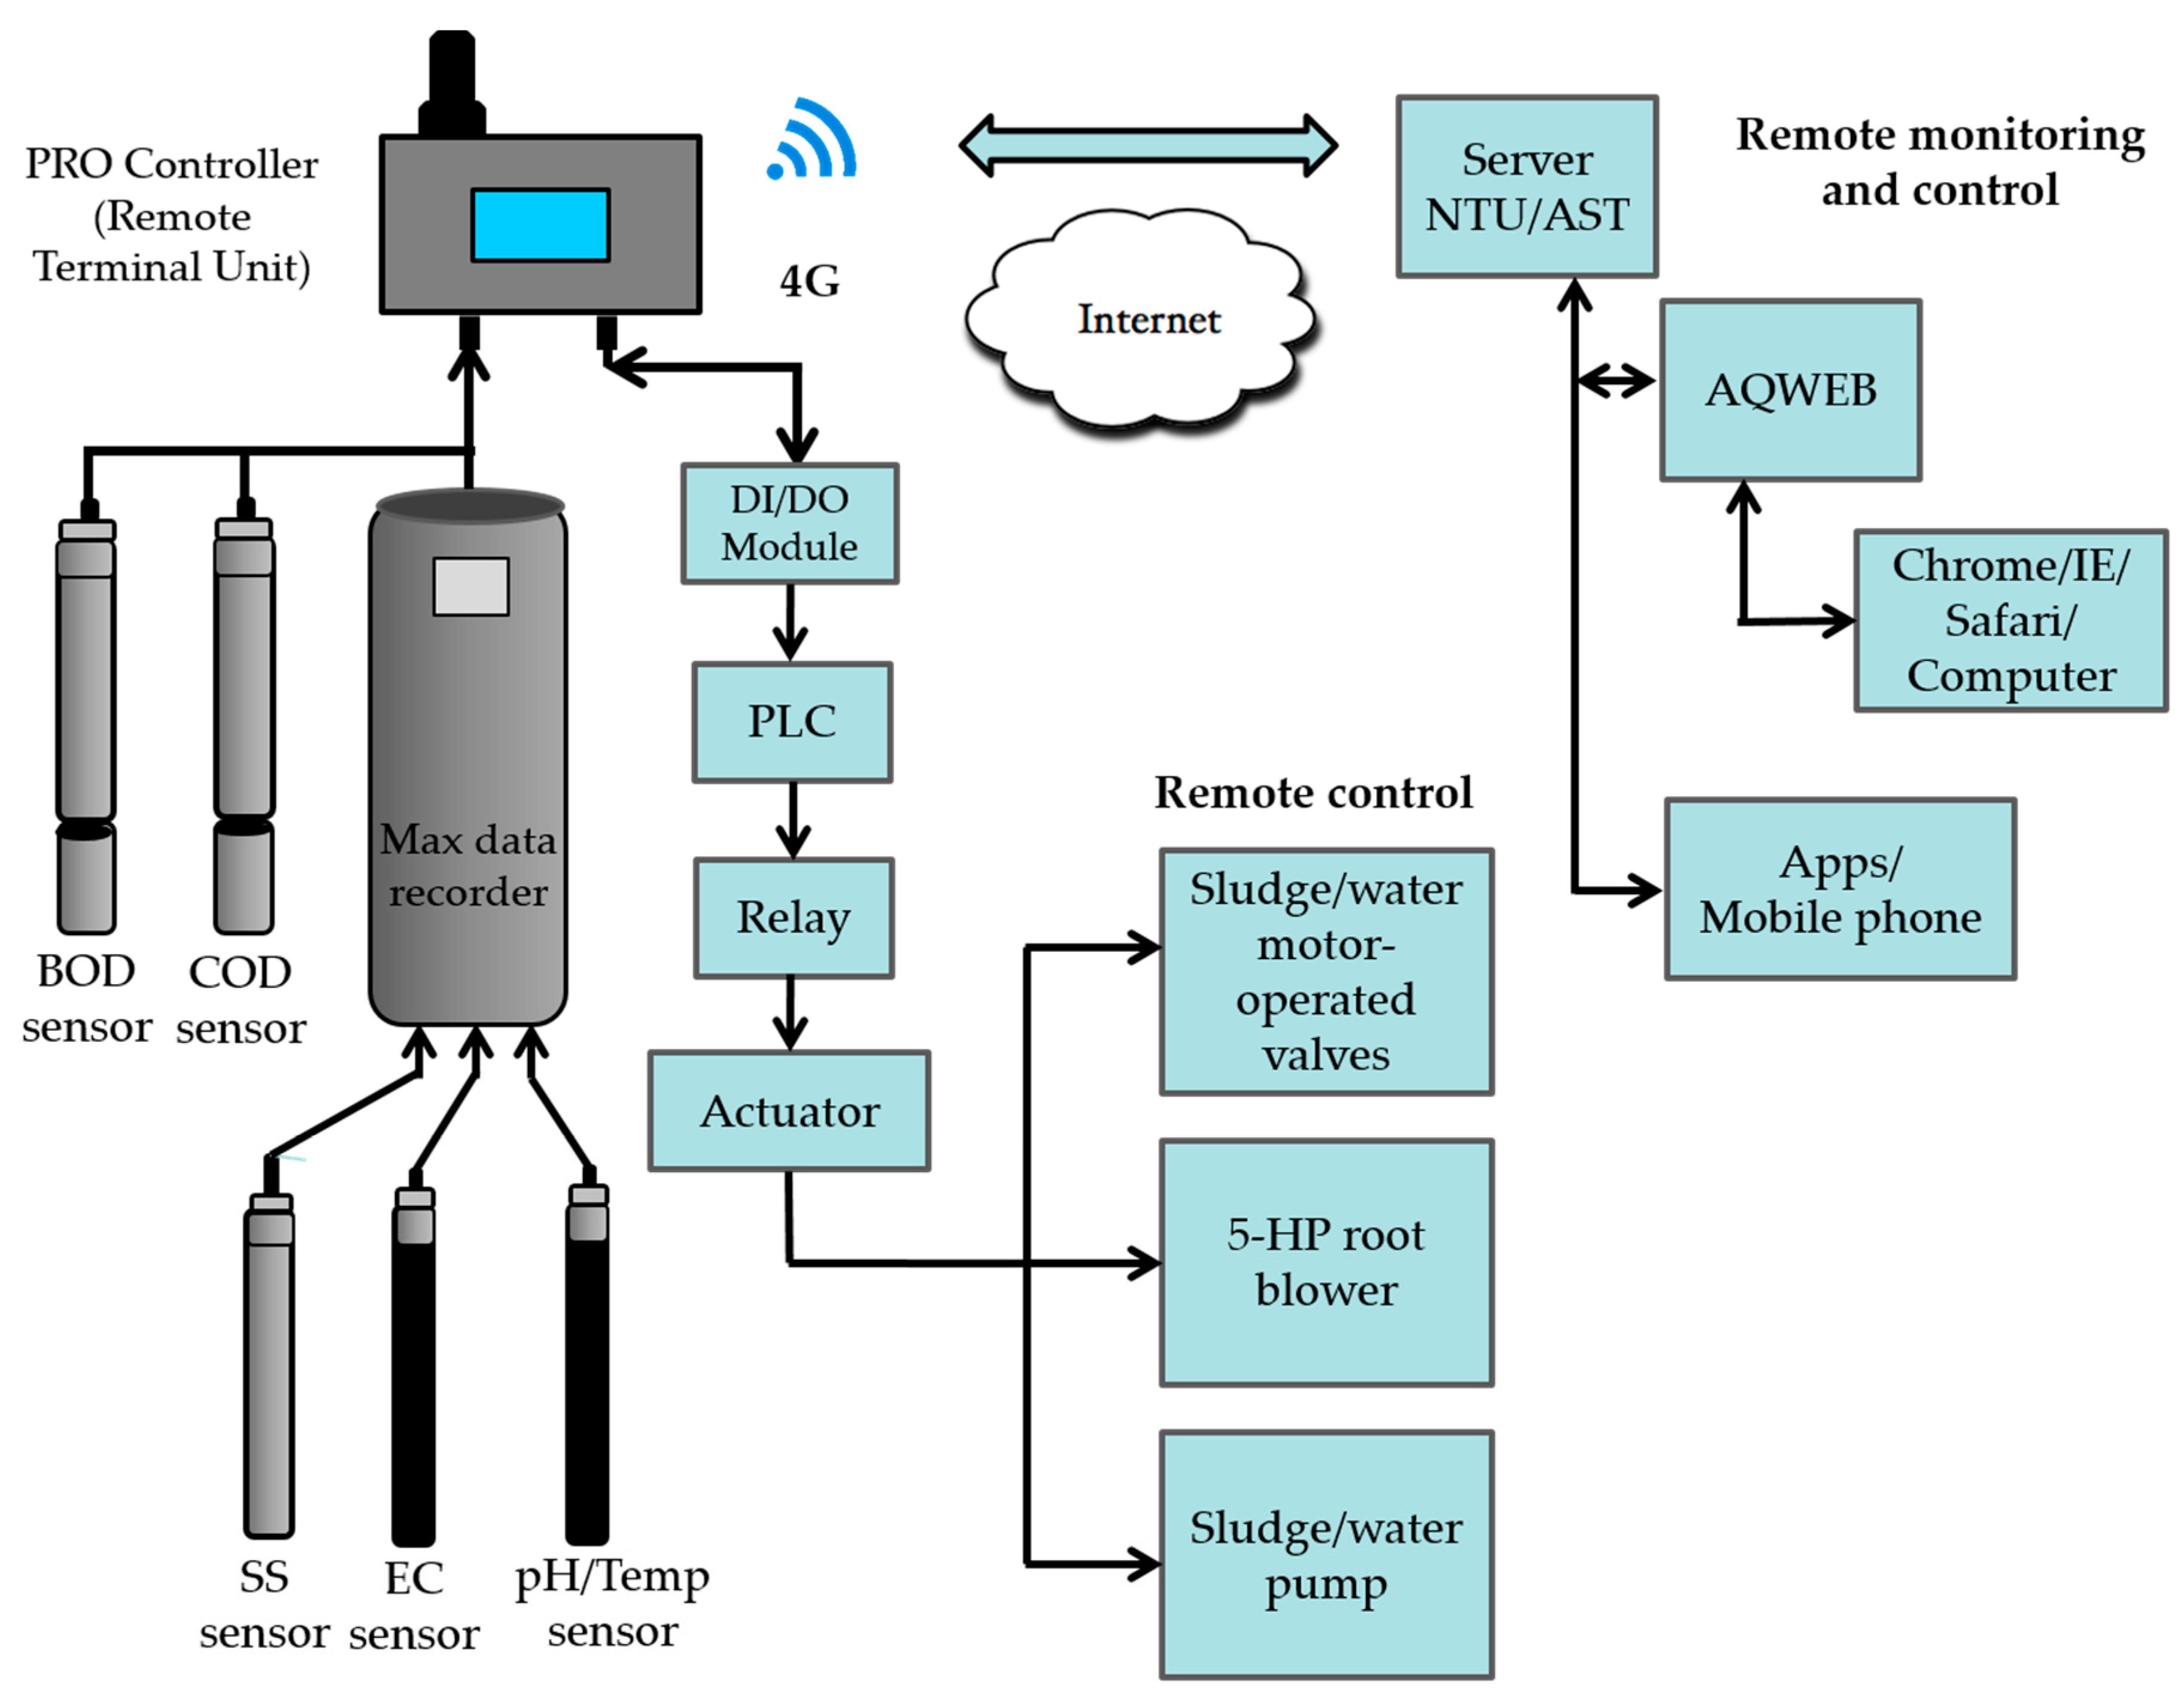
Several water quality sensors were installed in the SBR and effluent basin including BOD (0–500 mg/L, SMR46-3, AQUAS Inc., Taipei, Taiwan), COD (0–2500 mg/L, SMR44-3, AQUAS Inc., Taipei, Taiwan), SS (0–20,000 mg/L, SMR12-2, AQUAS Inc., Taipei, Taiwan), mixed liquid suspended solids (MLSS) (SMR12-2, AQUAS Inc., Taipei, Taiwan), electrical conductivity (EC) (0–5 mS/cm, SMR07-6, AQUAS Inc., Taipei, Taiwan), water temperature (Temp.) (SMR04, AQUAS Inc., Taipei, Taiwan), DO (0–20 mg/L, SMR09, AQUAS Inc., Taipei, Taiwan), and pH (SMR04, AQUAS Inc., Taipei, Taiwan). The water quality sensors, i.e., DO, SS, MLSS, and pH/Temp., were installed inside of the multi-parameter recorder (MAX series data recorder, AQUAS Inc., Taipei, Taiwan) (Figure 4).
The multi-parameter recorder and the BOD/COD sensors were then connected to a wireless controller and data logger (PRO Controller, AQUAS Inc., Taipei, Taiwan) through an RS485 Modbus remote terminal unit (RTU), and all data of the sensors were transmitted by the wireless controller and data logger to a remote server placed in the research office of Dept. of Animal Science and Technology, National University (AST/NTU) through either cable or wireless internet. The wireless controller and data logger were solar-powered for data collection, communication, logging, alarming, control, and analysis applications (Figure 5 and Figure 6).
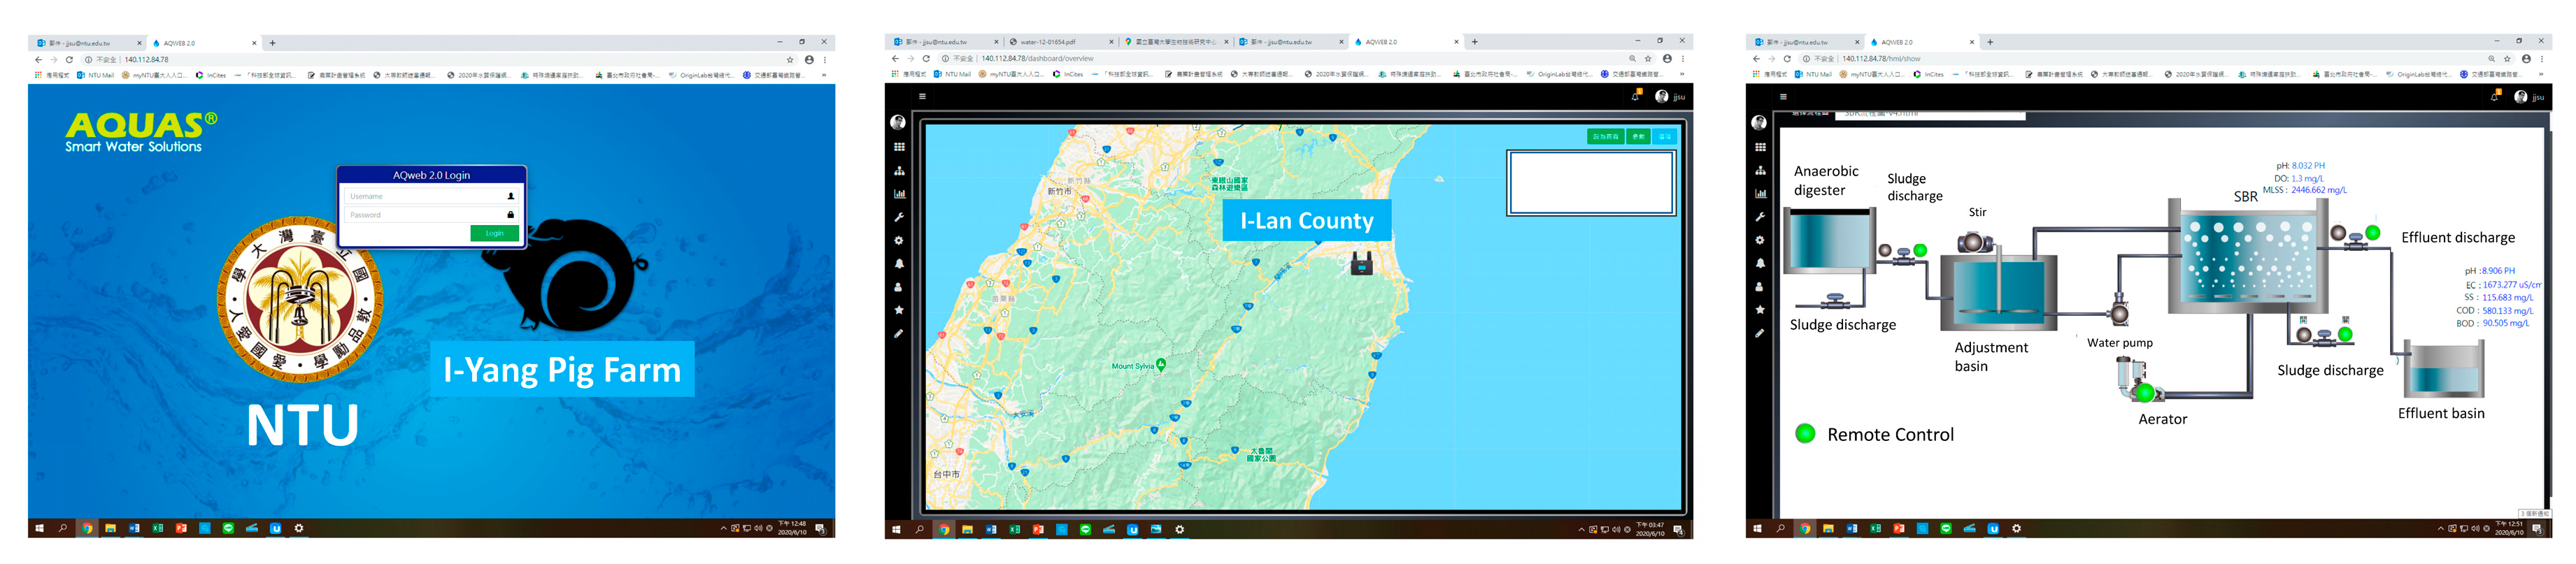
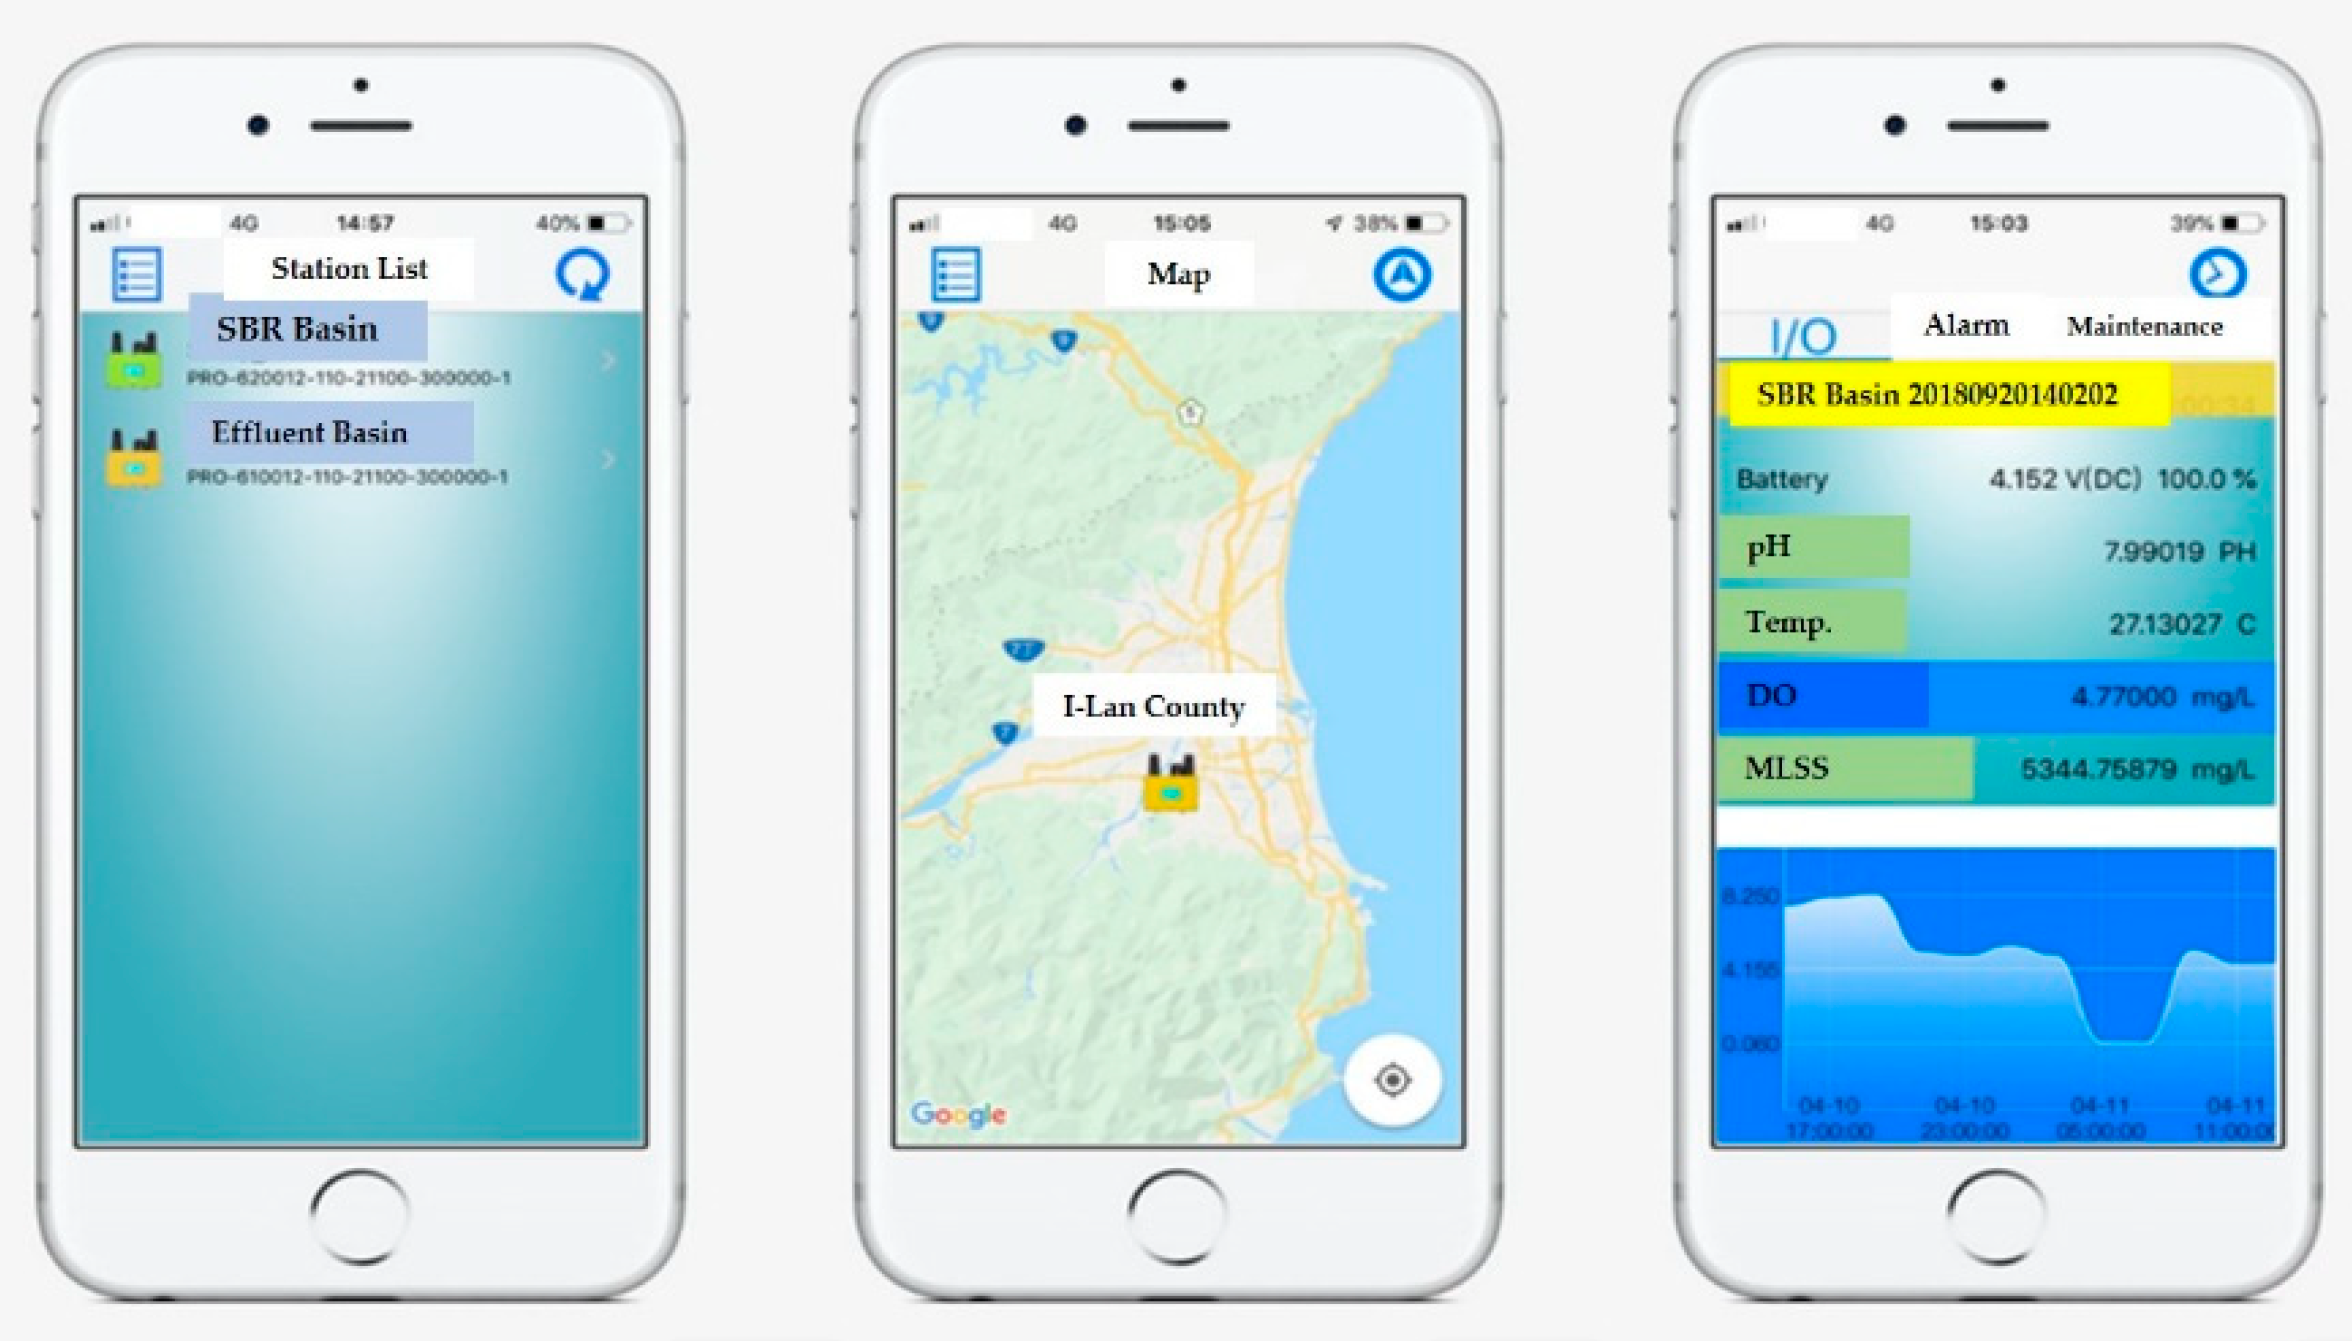
All data can be analyzed and piloted through the webserver software of AQWEB (AQUAS Inc., Taipei, Taiwan) (available online: http://140.112.84.78; accessed on 27 May 2020). All related researchers can monitor and remote-control the data and operation through browsers of office computers or mobile phones such as internet explorer (IE), Safari, and apps of android or iOS (Figure 7 and Figure 8). The flowchart of the whole wastewater treatment system can be seen in the AQWEB software, and the manager can intervene in the routine operation of wastewater treatment from a remote office. For remote control of in situ machines, digital signals were transmitted to the PLC through a digital input/digital output (DI/DO) module. The operation conditions were feedbacked to the PLC and then transmitted to the remote server also through DI/DO module. All machines were operated under the PLC control with the relay and actuator. All sensor data were collected from 21 March 2019 to 20 April 2020.
2.4. Calibration of Water Quality Sensors
The DO, pH, temperature, and EC sensors were calibrated by a senior technician of the AQUAS Inc. followed by their instrumental computer program and compared with the data of the portable DO, pH, temperature, and EC meters on site. However, the sensibility of the BOD, COD, and SS sensors were calibrated based on the chemical analyzed data of the same wastewater samples. For the SS sensor, the analytical chemical data of the same wastewater samples were very close to the sensor data. Thus, only the sensibility of the BOD and COD sensors was calibrated by the chemical analyzed data of the same wastewater samples. Calibration curves of BOD and COD were prepared by plotting the analytical chemical data against the sensor data of the same wastewater samples. The calibration curves of the COD (y = 1.57x − 149.31, R2 = 0.9401) and BOD (y = 0.24x + 29.10, R2 = 0.9797) were established based on four sets of the effluent data before sensor calibration in Table 2. The y-axis was analytic chemical data, and the x-axis was the sensor data. The BOD and COD sensors were calibrated based on the calibration curves and the related wastewater samples with special devices in the laboratory of AQUAS Inc.
2.5. Analysis of Water Quality
Wastewater samples were analyzed for COD, BOD, and SS using standard methods [18]. Wastewater samples were filtered and the filtrates were analyzed for anions and cations by ion chromatography (or ion-exchange chromatography) (Metrohn ion analysis; Metrohn AG, Herisau, Switzerland) [9]. Electrical conductivity and the pH of water samples were determined by a pH/conductivity meter (ExStik EC500, EXTECH Instrument, FLIR Commercial Systems, Goleta, CA, USA). Dissolved oxygen of water samples was determined by a DO meter (WalkLAB, Trans Instruments PTE, Ltd., Singapore).
2.6. Statistical Analysis
One-way ANOVA analysis was performed using Origin 9.1 software (OriginLab, Northampton, MA, USA) to compare the results using Tukey’s test with a significance level of 0.05.
3. Results
3.1. Operation of the Smart Piggery Wastewater Treatment System
3.1.1. The Efficiency of Piggery Wastewater Treatment Based on the Analytical Chemical Data
The BOD, COD, SS, pH, and EC of the raw piggery wastewater were 1127 ± 178 mg/L, 4077 ± 21 mg/L, 3676 ± 166 mg/L, 7.3 ± 0.3, and 2597 ± 614 μS/cm, respectively (Table 3). After solid/liquid separation, the BOD, COD, SS, pH, and EC of the piggery wastewater were 492 ± 112 mg/L, 858 ± 242 mg/L, 978 ± 18 mg/L, 7.0 ± 0.6, and 2498 ± 540 μS/cm, respectively. Moreover, the BOD, COD, SS, pH, and EC of the effluent were 70 ± 17 mg/L, 523 ± 121 mg/L, 140 ± 34 mg/L, 8.0 ± 0.4, and 2411 ± 579 μS/cm, respectively, when the average MLSS of the SBR system was 2013 ± 1040 mg/L. Thus, the overall removal efficiencies of the BOD, COD, and SS of the piggery wastewater based on only the analytical chemical data were 94%, 87%, and 96%, respectively (Table 3). For characterizations of EC in the effluent, the analytical data of the cations and anions in the effluent are shown in Table 4. Results showed that there was no significant difference among the concentrations of the same cations or anions (p > 0.05).
3.1.2. The Efficiency of Piggery Wastewater Treatment Based on the Water Quality Sensors
For the SBR system, the DO, MLSS, and pH of sensor data before and after sensor calibration were 2.50 ± 0.01 mg/L, 1089 ± 530 mg/L, 8.03 ± 0.73 and 2.00 ± 0.68 mg/L, 2760 ± 653 mg/L, 7.73 ± 0.73, respectively (Table 5). However, the MLSS and pH of analytical data before and after sensor calibration were 885 ± 56 mg/L, and 7.76 ± 0.28, and 2891 ± 211 mg/L and 7.84 ± 0.19, respectively (Table 5). Statistical analysis results of MLSS showed that there was a significant difference between the sensor data and analytical chemical data before sensor calibration (p < 0.05). However, the statistical analysis results of MLSS showed that there was no significant difference between the sensor data and analytical chemical data after sensor calibration (p > 0.05).
For the data of effluent, the BOD, COD, and SS of sensor data and analytical data before sensor calibration were 128 ± 73 mg/L, 245 ± 183 mg/L, and 228 ± 206 mg/L, and 79 ± 24 mg/L, 448 ± 187 mg/L, and 121 ± 52 mg/L, respectively (Table 2). However, the BOD, COD, and SS of sensor data and analytical data after sensor calibration were 69 ± 9 mg/L, 575 ± 46 mg/L, and 146 ± 16 mg/L, and 66 ± 16 mg/L, 563 ± 25 mg/L, and 149 ± 15 mg/L, respectively (Table 2). Statistical analysis results of BOD, COD, SS, and EC showed that there was a significant difference between the sensor data and analytical chemical data before sensor calibration (p < 0.05). However, the statistical analysis results of BOD, COD, SS, and EC showed that there was no significant difference between the sensor data and analytical chemical data after sensor calibration (p > 0.05).
The removal efficiencies of BOD, COD, and SS of the piggery wastewater based on the sensor data before and after water quality sensor calibration were 89%, 94%, and 93%, and 94%, 86%, and 96%, respectively (Table 6). Moreover, the removal efficiencies of BOD, COD, and SS of the piggery wastewater based on the analytical chemical data before and after water quality sensor calibration were 93%, 89%, and 97%, and 94%, 86%, and 96%, respectively (Table 7). The reduced COD removal efficiency in Table 7 was due to the differences in the uncorrected sensor data and chemically analyzed data before sensor calibration. Experimental results showed that overall removal efficiency of BOD, COD, and SS of the piggery wastewater after water quality sensor calibration were 94%, 86–87%, and 96%, respectively (Table 3, Table 6, and Table 7). Therefore, results revealed that the feasibility of applying smart piggery wastewater treatment systems for in situ wastewater treatment on commercial pig farms.
3.2. Promotion of the Novel Piggery Wastewater Treatment System
3.2.1. Set-Up Remote Monitoring Alarm and Feedback Control
The AQWEB system was developed by applying supervisory control and data acquisition (SCADA) in coordination with a PLC of an automatic sewage treatment system. The alarm limit values of all water quality indexes were set up before regular operation; that is, the SS alarm will be turned on and transmitted to the manager by email or short message of the mobile phone when the effluent SS sensor data were higher than the SS limit values simultaneously. And the sludge pump inside the effluent basin will be turned on to clean up the sediment of the effluent basin in the meantime.
The MLSS limit values of the SBR could be used to control daily discharge volumes of anaerobic sludge from anaerobic digesters to maintain the optimal concentration of activated sludge in the SBR system. Remote control commands interrupting the on-site manual operation process also were designed in the AQWEB system for the whole wastewater treatment process.
3.2.2. Reducing Daily Wastewater Volume, Increasing Hydraulic Retention Time (HRT), and Maintaining Mesophilic Conditions of Wastewater Treatment Basins
The average rainwater volume of I-Lan County was about 67–515 mm/month in 2019 (https://www.cwb.gov.tw/V8/C/D/DailyPrecipitation.html; accessed on 29 May 2020). Thus, the pig farmer stops pumping raw wastewater into the wastewater treatment system when it is in typhoon invasion day. The system cannot calculate the water balance and mass balance; however, it will be connected with the data of the extra water flowmeters installed before the raw wastewater pit for measuring the volumes of wastewater and rainwater. So far, the system only controls the constant influent volume and measures the volume of effluent.
Besides, for the promotion of the SBR operation, separation of rainwater and wastewater on-farm was a key issue to increase the HRT of anaerobic digesters and SBR. Thus, the construction of separate and individual drainage pipelines for rainwater and piggery wastewater can promote the efficiency of the smart piggery wastewater treatment system. Some wastewater heating systems were introduced and installed inside the anaerobic digesters through hot water recirculation tubing for heating the wastewater inside the digesters in winter to keep stable biogas production under mesophilic conditions.
3.3. The Advantages and Disadvantages of the Smart Piggery Wastewater Treatment System
The traditional piggery wastewater treatment system applied the plug flow model for the digesters and activated sludge basins after solid/liquid separation of raw wastewater. The return sludge process has to be manually operated to keep the optimal operation of an activated sludge system. However, most pig farmers lack professional knowledge to manage their wastewater treatment system properly. In contrast, the smart piggery wastewater treatment system has advantages such as labor-saving, accurate operation, being capable of remote monitoring/control, high efficiency, and controlling pollution problems by the administration or government. However, it has some disadvantages such as higher maintenance cost of electrical parts including water quality sensors, corrosion problems of electrical parts on-farm, the difficulty of self-maintaining the whole smart system by the farm owners, being highly dependent on the system dealers, highly electricity-dependent operation, highly computer-dependent operation (need to prevent an invasion of computer virus infection), and so on. To achieve the balance between economic feasibility and technical feasibility of the new system, small- and medium-scale pig farms need to establish a fully automatic piggery wastewater system, i.e., no water quality sensors installed as well as the AQWEB. However, large-scale pig farms need to establish a smart wastewater treatment system.
4. Conclusions
The on-farm results of this study showed high removal efficiency of BOD, COD, and SS of the piggery wastewater by the smart piggery wastewater treatment system on a 1000-head pig farm. Experimental results showed that overall removal efficiency of BOD, COD, and SS of the piggery wastewater after water quality sensor calibration were 94%, 86–87%, and 96%, respectively. The data of calibrated water quality sensors were close to the data of chemical analysis; thus, the smart system seemed to be able to extend to more large-scale commercial pig farms. However, more behavior data of the system will be collected and analyzed continuously for advanced improvement. Moreover, to promise global food security and mitigate environmental impact, promotion of the smart or automatic piggery wastewater treatment system may help pig farming to promote their environment-friendly image and the substantial value of sustainable pig farming.
Author Contributions
Investigation, J.-J.S. and H.-C.C.; writing—original draft preparation, J.-J.S.; writing—review and editing, J.-J.S.; supervision, J.-J.S.; funding acquisition, S.-T.D. All authors have read and agreed to the published version of the manuscript.
Funding
This work was funded by grants (No. MOST 108-2321-B-002-027) awarded from the Ministry of Science and Technology (MOST), Executive Yuan, Taiwan.
Acknowledgments
The assistance provided by Wen-Teng Hsu (the owner of the I-Yang Pig Farm) and Chien-Lung Chen (the PLC programmer) are greatly acknowledged.
Conflicts of Interest
The authors declare no conflict of interest.
References
- Berckmans, D. General introduction to precision livestock farming. Anim. Front. 2017, 7, 6–11. [Google Scholar] [CrossRef]
- Su, J.J.; Kung, C.M.; Lin, J.; Lian, W.C.; Wu, J.F. Utilization of sequencing batch reactor for in situ piggery wastewater treatment. J. Environ. Sci. Heal. 1997, 32, 391–405. [Google Scholar]
- Su, J.J.; Lian, W.C.; Wu, J.F. Studies on piggery wastewater treatment by a full-scale sequencing batch reactor after anaerobic fermentation. J. Agric. Assoc. China 1999, 188, 47–59. [Google Scholar]
- Su, J.J.; Chang, Y.C.; Huang, S.M. Ammonium reduction from piggery wastewater using immobilized ammonium-reducing bacteria with a full-scale sequencing batch reactor on farm. Water Sci. Technol. 2014, 69, 840–846. [Google Scholar] [CrossRef] [PubMed]
- Olsson, G. Automation development in water and wastewater systems. Environ. Eng. Res. 2007, 12, 197–200. [Google Scholar] [CrossRef]
- Olsson, G.; Carlsson, B.; Comas, J.; Copp, J.; Gernaey, K.V.; Ingildsen, P.; Jeppsson, U.; Kim, C.; Rieger, L.; Rodríguez-Roda, I.; et al. Instrumentation, control, and automation in wastewater—From London 1973 to Narbonne 2013. In Proceedings of the 11th IWA Conference on Instrumentation, Control, and Automation (ICA 2013), Narbonne, France, 18–20 September 2013; pp. 1–16. [Google Scholar]
- Bortone, G. Integrated anaerobic and aerobic biological treatment for intensive swine production. Bioresour. Technol. 2009, 100, 5424–5430. [Google Scholar] [CrossRef] [PubMed]
- Jian, T.; Zhang, X. Bioprocessing for slaughterhouse wastewater and its computerized control and supervisory system. Resour. Conserv. Recycl. 1999, 27, 145–149. [Google Scholar] [CrossRef]
- Su, J.J.; Huang, J.F.; Wang, Y.L.; Hong, Y.Y. Treatment of duck house wastewater by a pilot-scale sequencing batch reactor system for sustainable duck production. Poult. Sci. 2018, 97, 3870–3877. [Google Scholar] [CrossRef] [PubMed]
- Sangitrao, R.R. Automation of sewage treatment plant using PLC & SCADA. Int. J. Adv. Res. Electr. Electr. Instr. Eng. 2016, 5, 8627–8637. [Google Scholar]
- Duan, Y.; Ma, L.; Liu, G. Remote monitoring system of pig motion behavior and piggery environment based on Internet of Things. Trans. Chin. Soc. Agri. Eng. 2015, 31, 216–221. [Google Scholar]
- Edmondson, V.; Cerny, M.; Lim, M.; Gledson, B.; Lockley, S.; Woodward, J. A smart sewer asset information model to enable an ‘Internet of Things’ for operational wastewater management. Automat. Constr. 2018, 91, 193–205. [Google Scholar] [CrossRef]
- Memon, M.H.; Kumar, W.; Memon, A.R.; Chowdhry, B.S.; Adamir, M.; Kumar, P. Internet of Things (IoT) enabled smart animal farm. In Proceedings of the 3rd International Conference on Computing for Sustainable Global Development, New Delhi, India, 16–18 March 2016. [Google Scholar]
- Gheorghe, D. IoT application to sustainable animal production. Annals of the University of Oradea, Fascicle. Ecotoxicol. Anim. Husb. Food Sci. Technol. 2017, 16, 103–111. [Google Scholar]
- Sendhil Kumar, K.S.; Siva Shanmugam, G.; Rayavel, P.; RuchiKushwaha. Smart environmental waste water monitoring system and analysis using big data. Int. J. Innov. Technol. Explor. Eng. 2019, 8, 1310–1314. [Google Scholar]
- Wang, S.; Zhang, Z.; Ye, Z.; Wang, X.; Lin, X.; Chen, S. Application of environmental Internet of Things on water quality management of urban scenic river. Int. J. Sust. Dev. World Ecol. 2013, 20, 216–222. [Google Scholar] [CrossRef]
- Turcu, C.; Turcu, C.; Gaitan, V. An Internet of Things oriented approach for water utility monitoring and control. pp. 175–180. Available online: https://arxiv.org/ftp/arxiv/papers/1811/1811.12807.pdf (accessed on 5 May 2020).
- APHA. Standard Methods for the Examination of Water and Wastewater; American Public Health Association (APHA): Washington, DC, USA, 1995; pp. 5-3–5-6, 5-12–5-16, 2-53–2-58. [Google Scholar]
Figure 1.
Design of the piggery wastewater treatment on the farm. The areas with grey color were the underground basins, and the white areas were the vertical basins above ground. P: water pump; V: motor-operated valve.
Figure 1.
Design of the piggery wastewater treatment on the farm. The areas with grey color were the underground basins, and the white areas were the vertical basins above ground. P: water pump; V: motor-operated valve.

Figure 2.
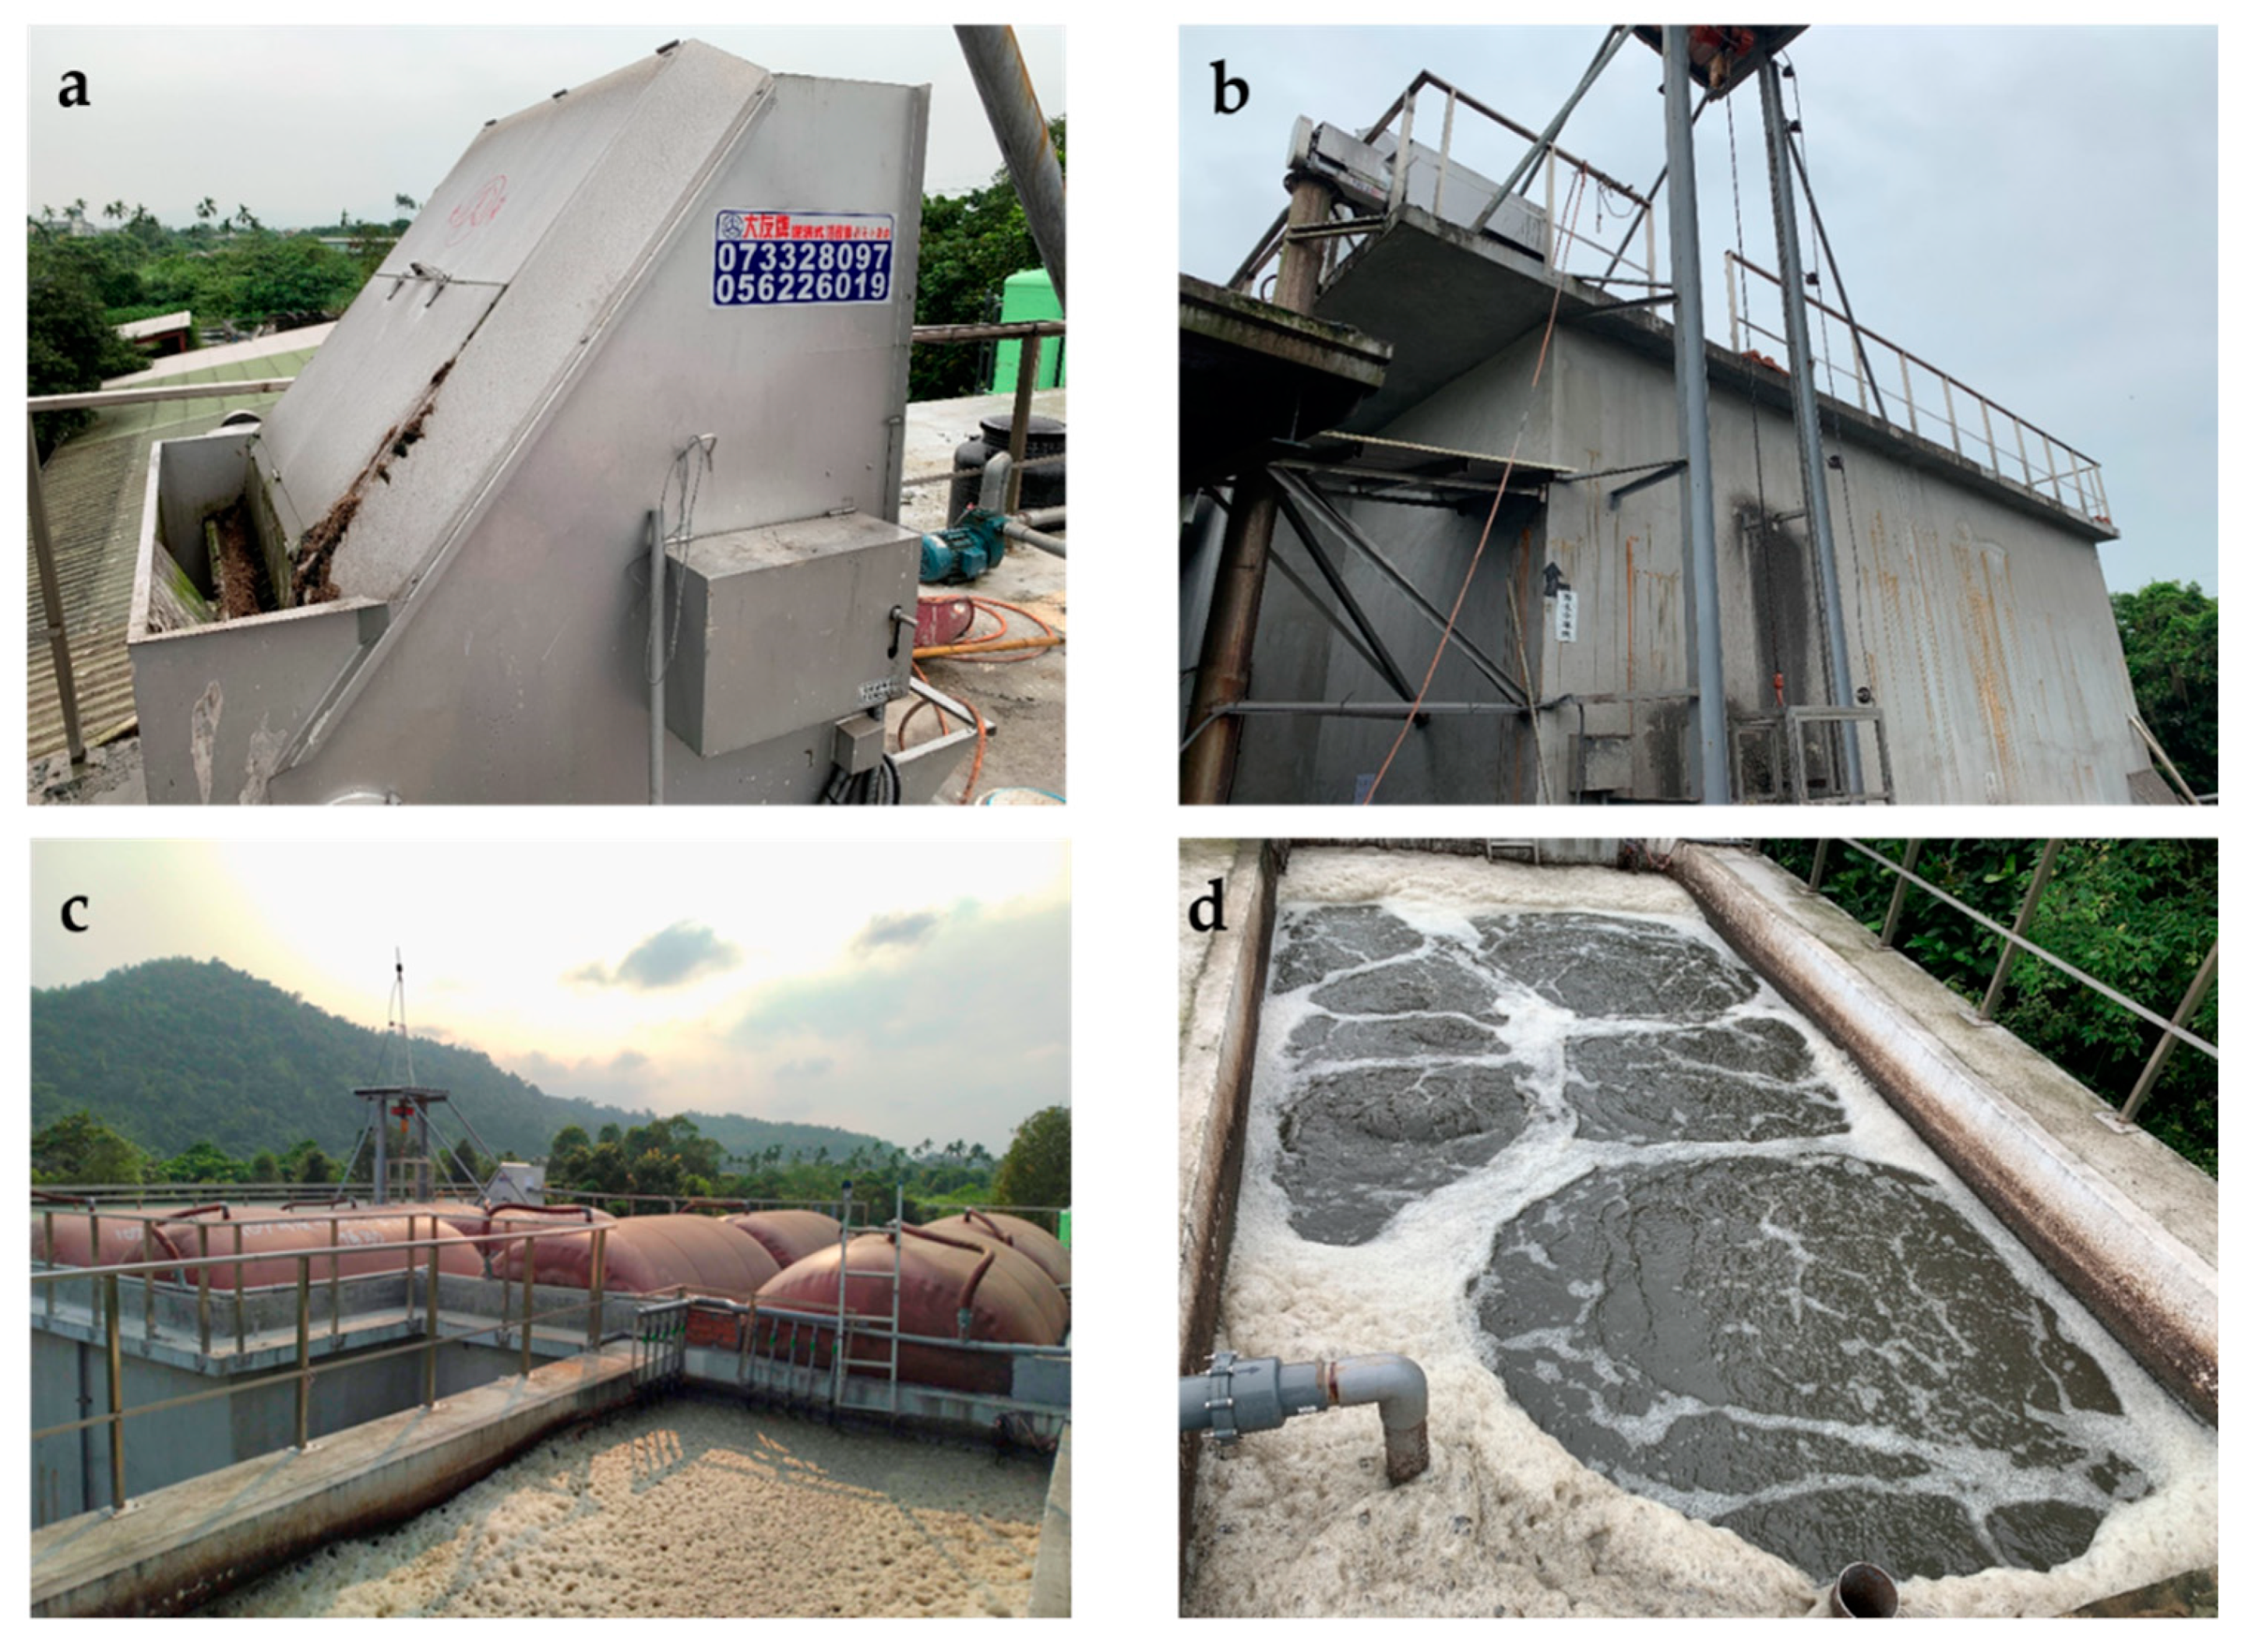
The appearance of the newly designed and constructed piggery wastewater treatment system. From left to right and up to down, they were solid/liquid separator (a), wastewater basins (b), anaerobic digesters (covered with brick-red plastic cover on the top of the digesters for collecting biogas) (c), primary clarifier (c), and sequencing batch reactor (SBR) (d).
Figure 2.
The appearance of the newly designed and constructed piggery wastewater treatment system. From left to right and up to down, they were solid/liquid separator (a), wastewater basins (b), anaerobic digesters (covered with brick-red plastic cover on the top of the digesters for collecting biogas) (c), primary clarifier (c), and sequencing batch reactor (SBR) (d).

Figure 3.
The human–machine interface (HMI) (yellow panel) of the programmable logic controller (PLC) for automatic SBR operation control.
Figure 3.
The human–machine interface (HMI) (yellow panel) of the programmable logic controller (PLC) for automatic SBR operation control.

Figure 4.
The installation location of the water quality sensors in the wastewater basins.

Figure 5.
The diagram of smart monitoring and control in the SBR basin.

Figure 6.
The diagram of smart monitoring and control in the effluent basin.

Figure 7.
The appearance of the home page (left), location map (middle), and operaton flowchart (right) of AQWEB software login page for this study.
Figure 7.
The appearance of the home page (left), location map (middle), and operaton flowchart (right) of AQWEB software login page for this study.

Figure 8.
The appearance of the AQWEB software app.


Table 1.
The operation mode of the SBR system on site.
| Operation Sequence | Beginning Time (h:min) | End Time (h:min) | Time (min) |
|---|---|---|---|
| Pumping influent | 09:58 | 10:48 | 50 |
| SBR/aeration on | 10:50 | 14:20 | 210 |
| SBR/aeration off | 14:21 | 15:40 | 80 |
| SBR/aeration on | 15:41 | 20:10 | 270 |
| SBR/aeration off | 20:11 | 21:29 | 78 |
| Effluent discharge | 21:30 | 21:55 | 25 |
| Pumping influent | 21:58 | 22:48 | 50 |
| SBR/aeration on | 22:50 | 02:20 | 210 |
| SBR/aeration off | 02:21 | 03:40 | 80 |
| SBR/aeration on | 03:41 | 08:10 | 270 |
| SBR/aeration off | 08:11 | 09:28 | 78 |
| Sludge discharge | 09:29 | 1 | |
| Effluent discharge | 09:30 | 09:55 | 25 |
Table 2.
Comparison of the effluent water quality indexes before/after calibration of water quality sensors.
Table 2.
Comparison of the effluent water quality indexes before/after calibration of water quality sensors.
| Indexes | Sensor Data | Analytical Data | p-Value |
|---|---|---|---|
| Data before calibration (n = 5897) | |||
| pH | 8.74 ± 2.45 | 8.13 ± 0.43 | |
| EC (μS/cm) | 2767 ± 403 | 2194 ± 476 | <0.05 |
| BOD (mg/L) | 128 ± 73 | 79 ± 24 | <0.05 |
| COD (mg/L) | 245 ± 183 | 448 ± 187 | <0.05 |
| SS (mg/L) | 228 ± 206 | 121 ± 52 | <0.05 |
| Data after calibration (n = 9648) | |||
| pH | 8.24 ± 0.46 | 7.81 ± 0.33 | |
| EC (μS/cm) | 2456 ± 479 | 2634 ± 635 | NS |
| BOD (mg/L) | 69 ± 9 | 66 ± 16 | NS |
| COD (mg/L) | 575 ± 46 | 563 ± 25 | NS |
| SS (mg/L) | 146 ± 16 | 149 ± 15 | NS |
Data presented as mean ± SD. NS: not significant. n = sample size.
Table 3.
Overall analytical chemical data of the wastewater quality indexes in water samples (n = 201).
Table 3.
Overall analytical chemical data of the wastewater quality indexes in water samples (n = 201).
| Water Samples | pH | EC (μS/cm) | MLSS (mg/L) | BOD (mg/L) | COD (mg/L) | SS (mg/L) |
|---|---|---|---|---|---|---|
| Raw wastewater | 7.3 ± 0.3 | 2597 ± 614 | NA | 1127 ± 178 | 4077 ± 21 | 3676 ± 166 |
| Pre-separated wastewater | 7.0 ± 0.6 | 2498 ± 540 | NA | 492 ± 112 | 858 ± 242 | 978 ± 18 |
| SBR | 7.8 ± 0.3 | 2007 ± 189 | 2013 ± 1040 | 153 ± 21 | 689 ± 176 | NA |
| Effluent | 8.0 ± 0.4 | 2411 ± 579 | NA | 70 ± 17 | 523 ± 121 | 140 ± 34 |
| Removal (%) | 94 | 87 | 96 |
Data presented as mean ± SD. n = sample size. NA: not available.
Table 4.
Comparison of the electrical conductivity (EC) and concentrations of ions in different effluent samples (n = 32).
Table 4.
Comparison of the electrical conductivity (EC) and concentrations of ions in different effluent samples (n = 32).
| Indexes | Analytical Data of Water Samples | |
|---|---|---|
| Before Sensor Calibration | After Sensor Calibration | |
| EC (μS/cm) | 2625 ± 691 | 2477 ± 633 |
| SO42− (mg/L) | 322 ± 61 | 336 ± 55 |
| PO43− (mg/L) | 125 ± 40 | 112 ± 47 |
| NO3− (mg/L) | 66 ± 24 | 62 ± 20 |
| NO2− (mg/L) | 96 ± 57 | 100 ± 52 |
| Cl− (mg/L) | 62 ± 39 | 60 ± 22 |
| Na+ (mg/L) | 251 ± 27 | 235 ± 21 |
| NH4+ (mg/L) | 122 ± 17 | 114 ± 12 |
| Ca2+ (mg/L) | 703 ± 18 | 715 ± 26 |
| K+ (mg/L) | 276 ± 10 | 260 ± 22 |
| Mg2+ (mg/L) | 109 ± 7 | 101 ± 6 |
Data presented as mean ± SD. n = sample size.
Table 5.
Comparison of the wastewater quality indexes in the SBR before/after calibration of water quality sensors.
Table 5.
Comparison of the wastewater quality indexes in the SBR before/after calibration of water quality sensors.
| Indexes | Sensor Data | Analytical Data | p-Value |
|---|---|---|---|
| Data before calibration (n = 8273) | |||
| pH | 8.03 ± 0.73 | 7.76 ± 0.28 | |
| Water Temp. (°C) | 24.92 ± 0.01 | - | |
| DO (mg/L) | 2.5 ± 0.01 | - | |
| BOD (mg/L) | NA | 161 ± 23 | |
| COD (mg/L) | NA | 583 ± 149 | |
| MLSS (mg/L) | 1089 ± 530 | 885 ± 56 | <0.05 |
| Data after calibration (n = 9873) | |||
| pH | 7.73 ± 0.73 | 7.84 ± 0.19 | |
| Water Temp. (°C) | 25.77 ± 2.07 | - | |
| DO (mg/L) | 2.00 ± 0.68 | - | |
| BOD (mg/L) | NA | 146 ± 18 | |
| COD (mg/L) | NA | 771 ± 156 | |
| MLSS (mg/L) | 2760 ± 653 | 2891 ± 211 | NS |
Data presented as mean ± SD. n = sample size, NA: not available. NS: not significant.
Table 6.
Removal efficiency of BOD, COD, and SS of the piggery wastewater based on the sensor data.
| Samples. | pH | EC (μS/cm) | MLSS (mg/L) | BOD (mg/L) | COD (mg/L) | SS (mg/L) |
|---|---|---|---|---|---|---|
| Analytical data (n = 144) | ||||||
| Raw wastewater | 7.3 ± 0.3 | 2597 ± 614 | NA | 1127 ± 178 | 4077 ± 21 | 3676 ± 166 |
| SBR | 7.8 ± 0.3 | 2007 ± 189 | 2013 ± 1040 | 153 ± 21 | 689 ± 176 | NA |
| Sensor data before sensor calibration (n = 14170) | ||||||
| SBR | 8.0 ± 0.7 | NA | 1089 ± 530 | NA | NA | NA |
| Effluent | 8.7 ± 2.5 | 2766 ± 403 | 128 ± 73 | 245 ± 183 | 228 ± 206 | |
| Removal (%) | 89 | 94 | 93 | |||
| Sensor data after sensor calibration (n = 19521) | ||||||
| SBR | 7.73 ± 0.73 | NA | 2759 ± 652 | NA | NA | NA |
| Effluent | 8.2 ± 0.5 | 2456 ± 479 | 69 ± 9 | 575 ± 46 | 146 ± 16 | |
| Removal (%) | 94 | 86 | 96 | |||
Data presented as mean ± SD. NA: not available. n = sample size.
Table 7.
Removal efficiency of BOD, COD, and SS of the piggery wastewater based on the analytical data.
Table 7.
Removal efficiency of BOD, COD, and SS of the piggery wastewater based on the analytical data.
| Samples | pH | EC (μS/cm) | MLSS (mg/L) | BOD (mg/L) | COD (mg/L) | SS (mg/L) |
|---|---|---|---|---|---|---|
| Analytical data (n = 144) | ||||||
| Raw wastewater | 7.3 ± 0.3 | 2597 ± 614 | NA | 1127 ± 178 | 4077 ± 21 | 3676 ± 166 |
| SBR | 7.8 ± 0.3 | 2007 ± 189 | 2013 ± 1040 | 153 ± 21 | 689 ± 176 | NA |
| Analytical data before sensor calibration (n = 42) | ||||||
| SBR | 7.8 ± 0.3 | 1979 ± 159 | 865 ± 56 | 161 ± 23 | 583 ± 149 | NA |
| Effluent | 8.1 ± 0.4 | 2194 ± 476 | NA | 79 ± 24 | 448 ± 187 | 121 ± 52 |
| Removal (%) | 93 | 89 | 97 | |||
| Analytical data after sensor calibration (n = 66) | ||||||
| SBR | 7.8 ± 0.2 | 2064 ± 257 | 2891 ± 211 | 146 ± 18 | 771 ± 156 | NA |
| Effluent | 7.8 ± 0.3 | 2634 ± 635 | NA | 66 ± 16 | 563 ± 24 | 149 ± 15 |
| Removal (%) | 94 | 86 | 96 | |||
Data presented as mean ± SD. NA: not available. n = sample size.
© 2020 by the authors. Licensee MDPI, Basel, Switzerland. This article is an open access article distributed under the terms and conditions of the Creative Commons Attribution (CC BY) license (http://creativecommons.org/licenses/by/4.0/).
Share and Cite
MDPI and ACS Style
Su, J.-J.; Ding, S.-T.; Chung, H.-C. Establishing a Smart Farm-Scale Piggery Wastewater Treatment System with the Internet of Things (IoT) Applications. Water 2020, 12, 1654. https://0-doi-org.brum.beds.ac.uk/10.3390/w12061654
AMA Style
Su J-J, Ding S-T, Chung H-C. Establishing a Smart Farm-Scale Piggery Wastewater Treatment System with the Internet of Things (IoT) Applications. Water. 2020; 12(6):1654. https://0-doi-org.brum.beds.ac.uk/10.3390/w12061654
Chicago/Turabian StyleSu, Jung-Jeng, Shih-Torng Ding, and Hsin-Cheng Chung. 2020. "Establishing a Smart Farm-Scale Piggery Wastewater Treatment System with the Internet of Things (IoT) Applications" Water 12, no. 6: 1654. https://0-doi-org.brum.beds.ac.uk/10.3390/w12061654
Note that from the first issue of 2016, this journal uses article numbers instead of page numbers. See further details here.