Assessment of the Urban Water Security in a Severe Water Stress Area–Application to Palestinian Cities


Laboratoire de Génie Civil et Géo–Environnement (LGCgE), Lille University, 5900 Lille, France
*
Author to whom correspondence should be addressed.
Water 2020, 12(7), 2060; https://0-doi-org.brum.beds.ac.uk/10.3390/w12072060
Submission received: 7 June 2020
/
Revised: 13 July 2020
/
Accepted: 17 July 2020
/
Published: 20 July 2020
(This article belongs to the Section Urban Water Management)
Abstract
:This paper presents an assessment of the urban water security in a severe water stress area using a semi-quantitative risk-based approach. Water security indicators are selected according to the recommendations of international institutions, the literature review and the opinion of a panel of water experts. Selected indicators cover three fields: water resources, water services and water governance. The field of water resources is described by indicators related to the water resources availability, annual precipitation and the ratio of treated water, while the water services field is described by indicators related to the water service coverage, water losses and the continuity of water supply. Water governance includes three indicators: role and responsibility, access to water information and stakeholder engagement. Water security assessment is conducted in three stages: (i) data collection for five Palestinian cities in the West Bank of Jordan, (ii) determination of the risk score for each indicator using collected data and an expert’s opinion, (iii) determination of the global water security score and water security index using the matrix risk assessment and the wise weight assessment ratio analysis (SWARA) methods. Results show that water risk is ranked as extreme for all cities. Risk related to water resources is a major contributor to global risk, followed by water governance.
1. Introduction
This paper presents an assessment of water security in major Palestinian cities. This issue is of major concern to the Palestinian population because of the severe water stress in this area, the complex geopolitical situation and the degraded water infrastructure and services [1,2,3,4,5,6]. Since this situation could become more critical, both local and national Palestinian authorities have to work together to establish strategies to ensure a safe water supply for the population, which is mainly concentrated in the cities. This research contributes to this goal through the development and use of a scientific approach for the assessment of water security in major Palestinian cities. It also contributes to scientific efforts for establishing knowledge in the field of water security through the assessment of water security in urban areas subjected to high water security challenges.
In the past two decades, water security received important attention from policymakers, international institutions and scholars. According to the UN human rights, water supply must be sufficient and continuous [7]. The World Health Organization (WHO) considers that between 50 and 100 L of water per person per day are required to ensure basic human requirements and health concerns [8].
According to [9], water security refers to the “availability of an acceptable quantity and quality of water to meet the society needs in terms of health, livelihoods, ecosystems and economic activity production with acceptable level of water-related risks to people, environments and economies”. The Global Water Partnership associates water security to the availability of enough water for the social and economic development and for the ecosystems [10]. It proposed a holistic approach for water security through improved water management, including water supply for social and economic activity, water-related risks mitigation and water conflict prevention. For the OECD, water security is about learning and establishing strategies to live with an acceptable level of water risk [11]. It requires identification of the water–related risks in terms of likelihood and socio-economic impact together with establishing risk management strategies to reduce water hazards, as well as the vulnerability and exposure of water infrastructures. Hall and Borgomeo [12] highlighted the role of the risk approach in the assessment of the investment efficiency in reducing water–related risks. Other scholars also highlighted the multiple components of water security, in particular water supply to users and the environment, water conflict prevention and mitigation of risks related to flood, drought and pollution [13].
Different scientific approaches were proposed for the water security assessment, including the identification of water security indicators and the elaboration of frameworks for the management of water security. Vörösmarty et al. [14] proposed a global water security framework based on twenty-three indicators related to bio-physical issues. Human dimension was little considered in this framework. Mason and Calow [15] selected a set of indicators for the water security assessment, including resources stress, variability and risk, basic human needs, productivity, environment and governance. Gain et al. [16] established a multi–criteria framework for a global assessment of water security. This framework is based on the indicators of the UN 2030 Agenda for Sustainable Development [17], which focuses on water availability, accessibility to services, safety, quality and management. Van Ginkel et al. [18] used a framework based on the pressure-state-impact-response framework for the analysis of water security in ten cities. The water security index was determined using 56 indicators including environmental and socio-economic pressures, water quality, water infrastructures, water supply, sanitation, flood protection, planning, operational management and institutional organization [19].
The matrix risk assessment method was recommended by the WHO and IWA [8,20] for the water security assessment. According to this method, the risk level of an event is defined according to the probability of its occurrence (likelihood) and consequences (severity). The risk matrix provides the risk levels for the combinations of the likelihood and severity values [11,21,22].
Some scholars focused on the analysis of urban water security. Hoekstra et al. [23] reported that urban water security is different from the general water security concept by its application to an urban area, which has specific features, such as high population density, dependence on external water resources, complex and sometimes fragmented water governance. Jensen and Wu [24] used the security index for the assessment of urban water security. They proposed a method based on indicators related to water availability, access to water, water-related risks and water management capacity. The application of this method to Singapore and Hong Kong showed the dynamic feature of the water security issue, as well as the capacity of this method for both early identification of the water security changes and the assessment of the impact of policy-makers’ strategies on water security. Aboelnga et al. [19] proposed a methodology for establishing an operational urban water security approach including six steps: understanding the operational urban water system, defining water security, figuring out an operational definition, establishing a water security framework based on the local context and international recommendations, presenting the framework for decision–making and, finally, measuring the water security index.
The deterioration of water resources and water services in the Palestinian territory together with the concentration of the Palestinian population in cities [1,2,5,25] requires the establishment of a scientific-based strategy for the water security assessment in the Palestinian urban area. This paper proposes a contribution to this objective through (i) the combination of risk assessment tools of water security in an urban area, (ii) establishing a set of indicators for water security in Palestinian cities according to the literature review and the opinions of a panel of experts, (ii) collecting relevant water security data for five major Palestinian cities, (iii) risk analysis of collected data using a semi-quantitative approach [26,27,28,29] and the wise weight assessment ratio analysis (SWARA) [30] and, finally, (iv) the determination of the water security score and index for selected Palestinian cities.
2. Materials and Methods
2.1. Overview
This research aims at the assessment of water security in Palestinian cities in the West Bank of Jordan [9,10,11]. It is conducted using a semi-quantitative approach [26,27,28,29], which includes the following steps: selection of the water security indicators according to the water security challenges in the Palestinian territories, determination of the security score and weight for each indicator and, finally, determination of the water security score and index for selected cities.
Since the assessment of the water security is based on the consideration of a multitude of criteria and indicators, it requires the use of multi criteria decision making (MCDM) methods. These methods provide capacities to determine the value, degree of importance and the priority order for a number of alternatives and to select the best alternative [31,32,33,34]. According to recent papers [32,35,36] and the use of experts’ judgment in this work, the risk matrix analysis method [8,13,22,36,37], as well as the wise weight assessment ratio analysis (SWARA) [30] were used in this research. The list of indicators was determined following the literature review [14,15,23,24,38,39] and the opinions of a panel of experts in the water sector in Palestine.
2.2. Water Security Indicators
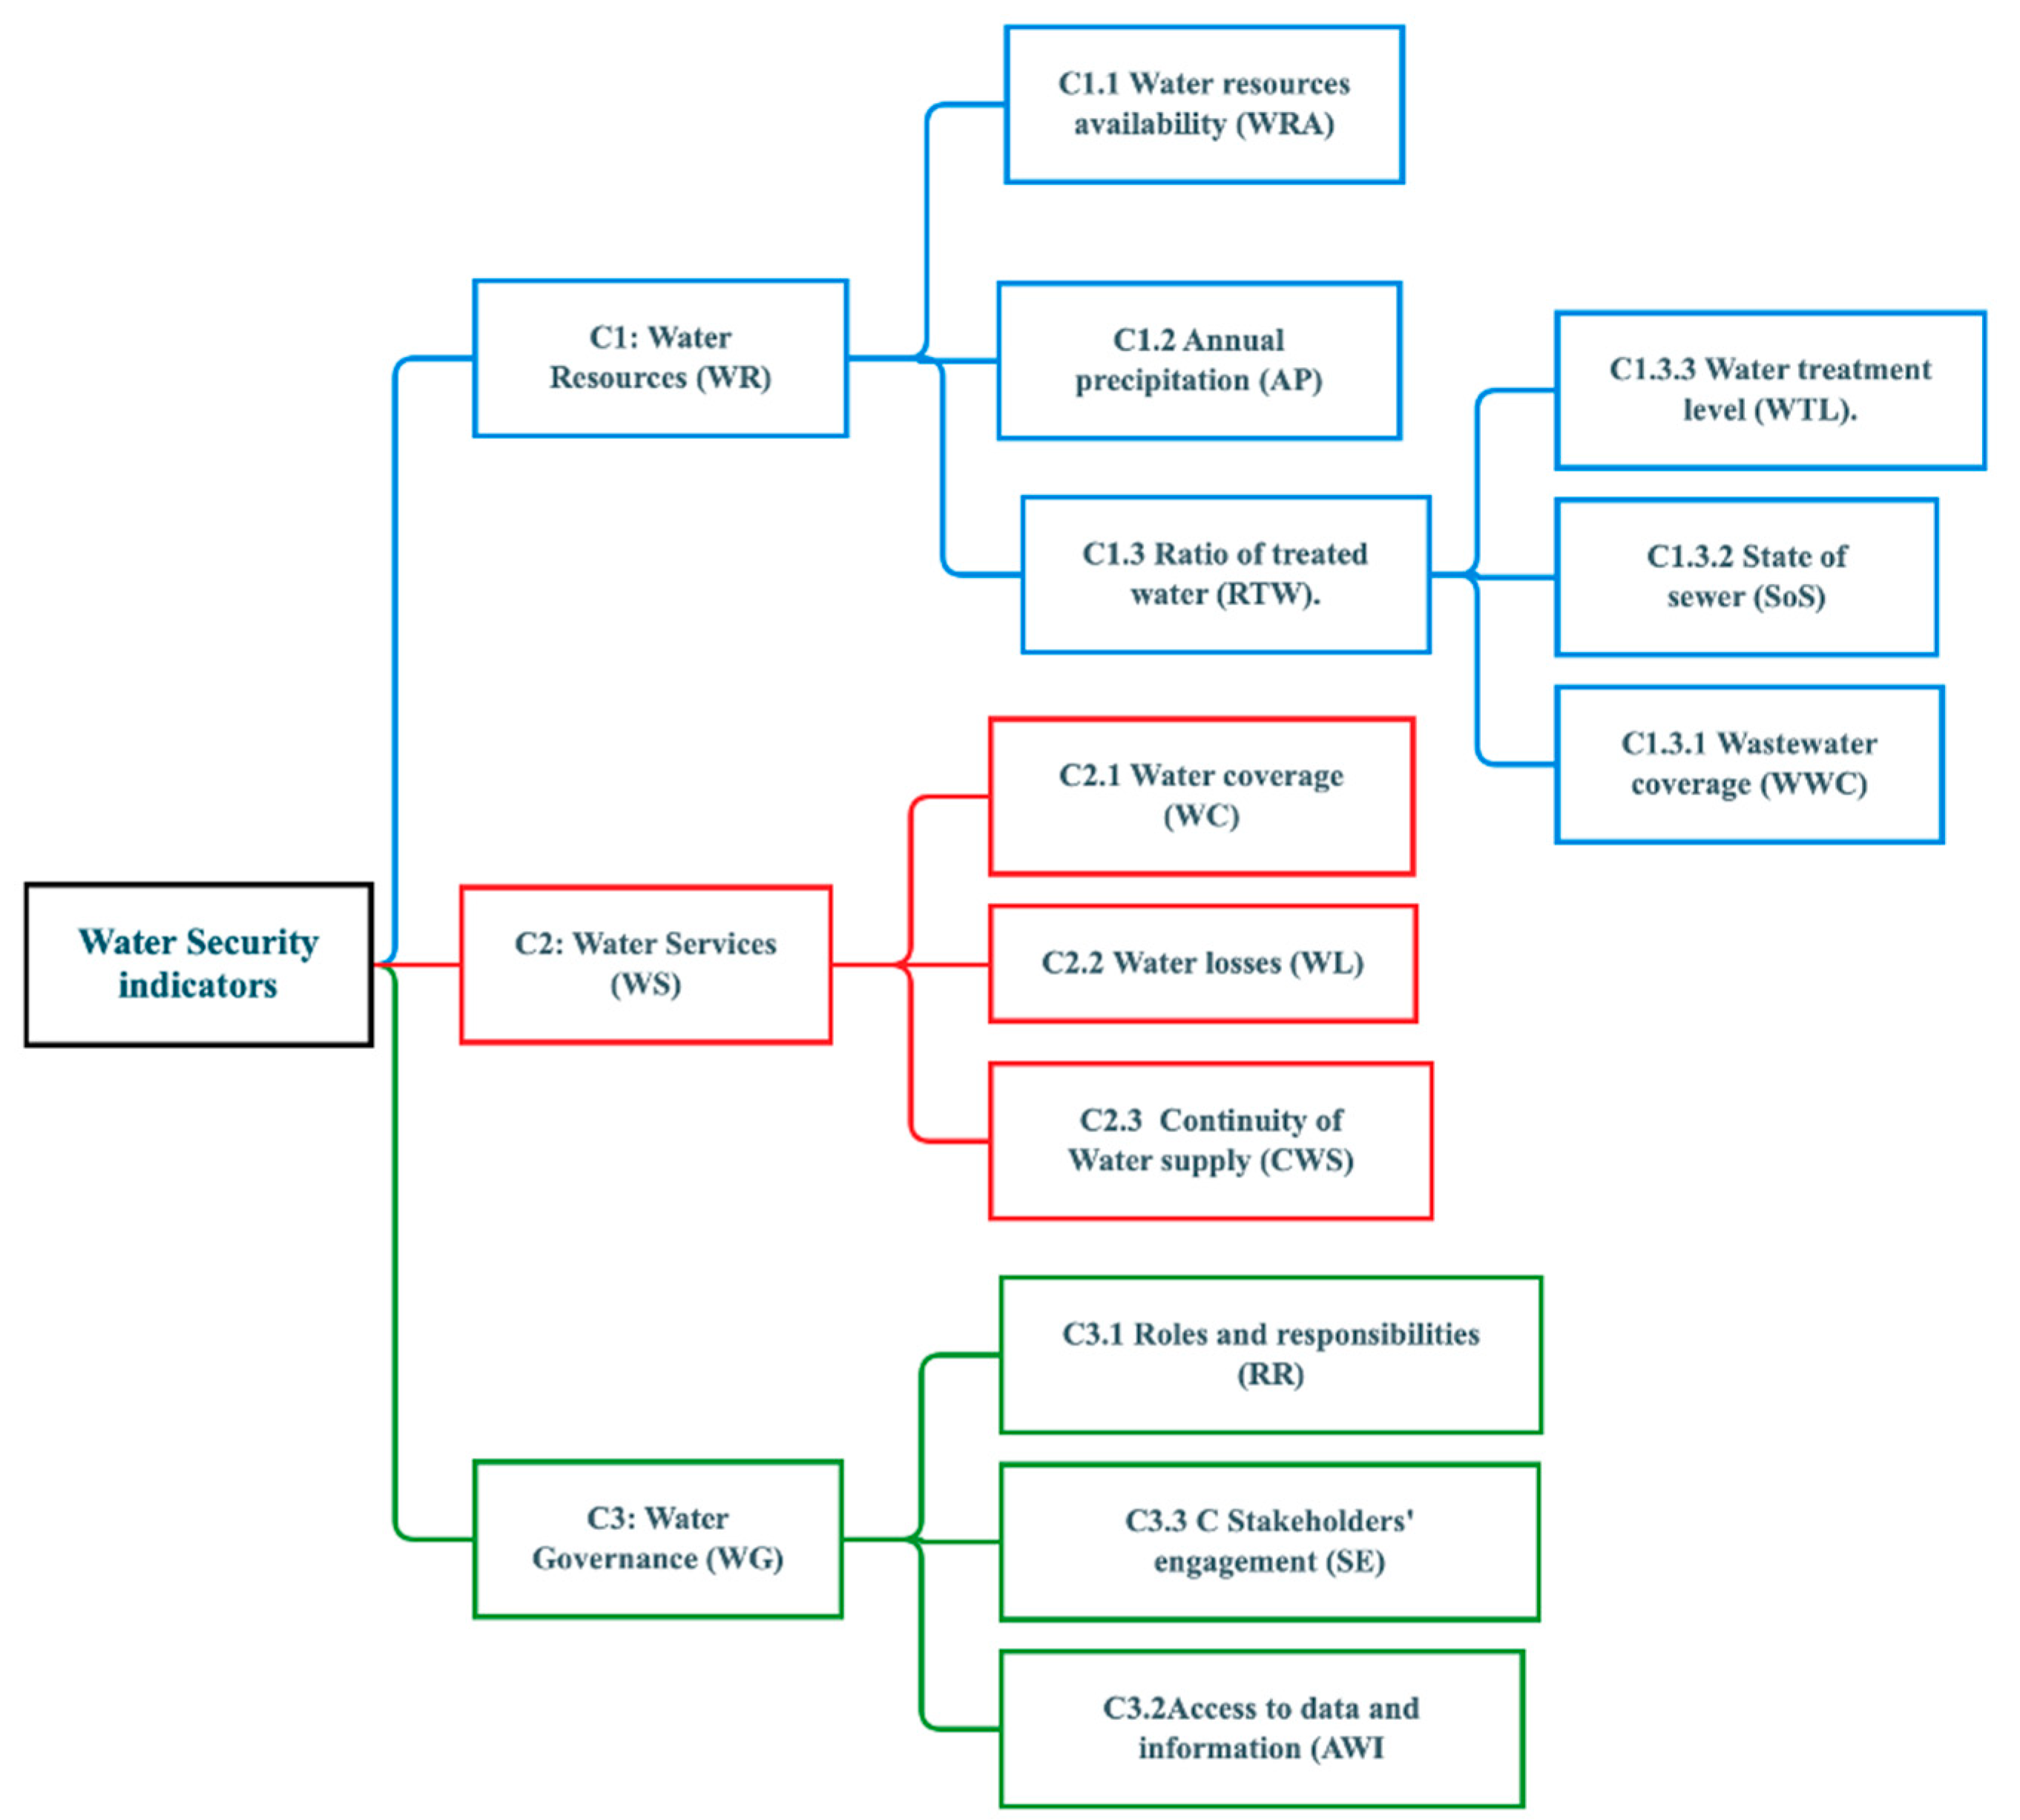
Figure 1 summarizes the architecture of the set of indicators used in the assessment of water security in Palestinian cities. This system was established according to the literature review, the recommendations of international institutions [2,40,41] and discussions with a panel of 25 experts in the Palestinian water sector. The water security indicators were classified into three categories: water resources (WR), water services (WS) and water governance (WG).
The water resource category was selected according to the recommendations of the IWA [41], the OECD [11] and Ginkel et al. [18]. It includes indicators that impact the availability and quality of the water resources, such as the water resources availability (WRA) [41], annual precipitation (AP) [11,41] and the ratio of treated wastewater (RTW). The water resources availability (WRA) measures the yearly percentage of the volume of water used to water availability, including natural water resources and imported water. It was selected according to the recommendations of the IWA [41]. The annual precipitation (AP) measures the cumulated annual rainfall. It is recommended by the OECD [11,40]. The ratio of treated wastewater (RTW) refers to the percentage of the volume of treated wastewater to the volume of wastewater generated by the city. It is recommended by [41]. This indicator depends on three sub-indicators: wastewater coverage (WWC), state of the sewage system (SoS) and the wastewater treatment level (WTL). WWC measures the percentage of the population connected to the sanitation system. SoS and WTL are qualitative indicators that describe the state of the sewage system and the wastewater treatment capacity, respectively.
The water services category describes the quality of the water services to citizens. It includes the water service coverage (WC) [41], water losses (WL) [41] and the continuity of the water supply (CWS) [41]. WC measures the percentage of the population connected to the drinking water service, while WL refers to the percentage of water losses in the water distribution system. The continuity of the water supply (CWS) indicates the annual percentage of the total time of the water supply service to the population.
Indicators for the water governance were determined following the OECD recommendations [40]. They include the following indicators: roles and responsibilities (RR), access to the water information (AWI) and stakeholder engagement (SE). The first indicator refers to the existence of regulations and practices that clearly define the role and responsibility of water stakeholders in the water governance. AWI refers to the existence of an information system about the main water indicators and the ease of access to this system. Finally, stakeholder engagement (SE) measures the degree of engagement of water stakeholders in the water governance system.
2.3. Use of the Semi-Quantitative Approach
A semi-quantitative approach is used for the assessment of the water security risk. The evaluation of the risk score (RS) of an event on a given system is based on the use of the likelihood score (LS) and severity score (SS) of this event. The former is related to the probability of occurrence of the event, while the latter refers to the impact of this event on the system. The risk score is determined according to the following expression: RS = LS × SS
Five levels are used for both the severity and likelihood scores [36,42]. Table 1 and Table 2 provide these scores, as well as their related levels.
The determination of the water risk level and the security index is based on the severity score and likelihood score. Table 3 and Table 4 show the scoring system. It includes 4 values for the water security level (WSL) and 4 values for the water security index (WSI), which correspond successively to low risk with WSI = 4, medium risk with WSI = 3, high risk with WSI = 2 and extreme risk with WSI = 1.
Since the water security assessment is based on a multi-criteria analysis, it requires the determination of criteria weights. The wise weight assessment ratio analysis (SWARA) method is used for this determination [30]. Its application includes two steps. In the first step, the indicators are ranked according to experts’ opinions. The total score of the indicator sj is determined by the equation:
where Ai designates the score given by expert i, while n is the number of experts.
The weights of the indicators are then determined according to the following expressions:
where kj, qj and wj are intermediary parameters used in the calculation.
3. Results and Discussion
3.1. Overview
This study focuses on five Palestinian cities, namely Jenin, Tulkarm, Ramallah, Jericho and Hebron, which were selected for both their demographic importance and geographic recovery of the West Bank of Jordan (Table 5). Data were collected for five years from the Palestinian water authorities, as well as from the cities. The determination of the water security scores is based on the literature review, national and international reports and a panel of 25 Palestinian water experts. The panel of experts includes 4 experts from governmental organizations, 4 from non-governmental organization (NGO), 3 policy-makers, 4 from municipalities and 10 academics.
The following sections first present data collection and analysis for the water security categories (water resources, water services and water governance) and then the determination of the global water index.
3.2. Water Resources
Assessment of the security of water resources is based on three indicators: water resources availability (WRA), annual precipitation (AP) and the ratio of treated water (RTW).
Table 6 provides data collected for the water resources availability (WRA) for the period 2013–2017. It shows that this ratio is close to 100%, which means that the situation of the five cities is critical because they consume the totality of the water provided by both natural resources and imported water. According to these data and experts’ opinion, the severity score for these cites is classified as “catastrophic, SS = 5”, while the likelihood level is classified as “almost certain, LS = 5” (Table 7).
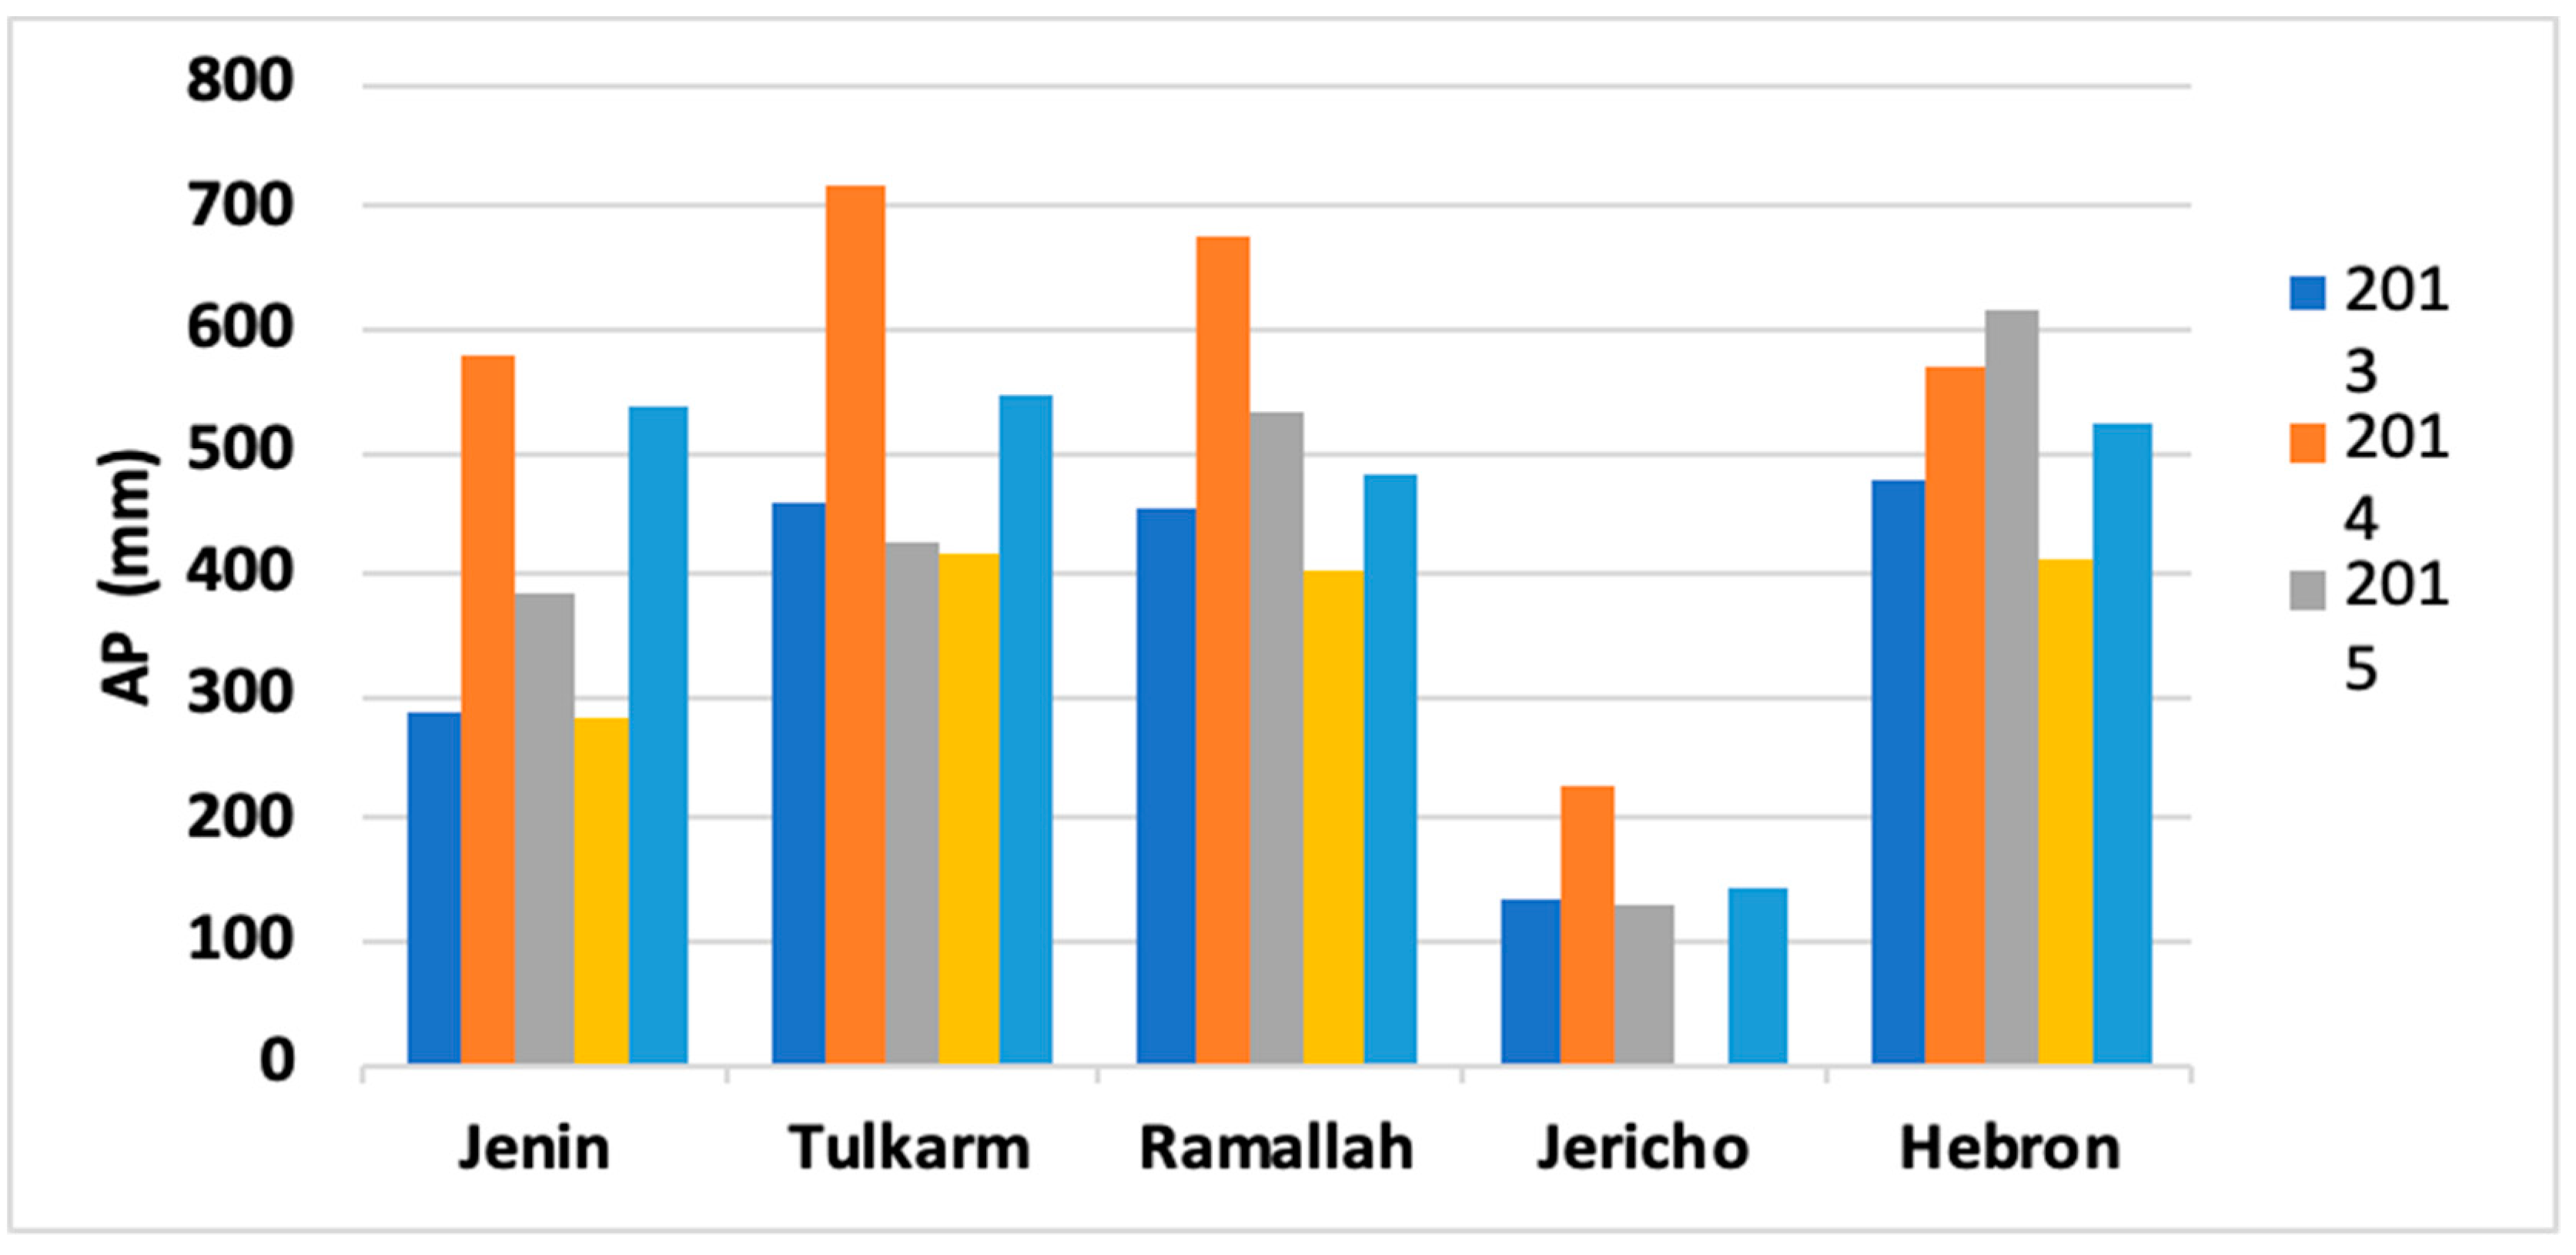
Figure 2 illustrates the variation of the annual water precipitation (AP) in the period 2013–2017. It shows very low annual precipitation in Jerico with an average value of about 159 mm. For the other cities, we observe important annual variation, with a maximum of 720 mm in Tulkarm in 2014 and a minimum of 283 mm in Jenin in 2016. According to these data and experts’ opinion, the severity of the risk is classified as “catastrophic, SS = 5” for Jericho and “moderate, SS = 3” for the other cities. The likelihood score is classified as “almost certain, LS = 5” for all the cities (Table 7).
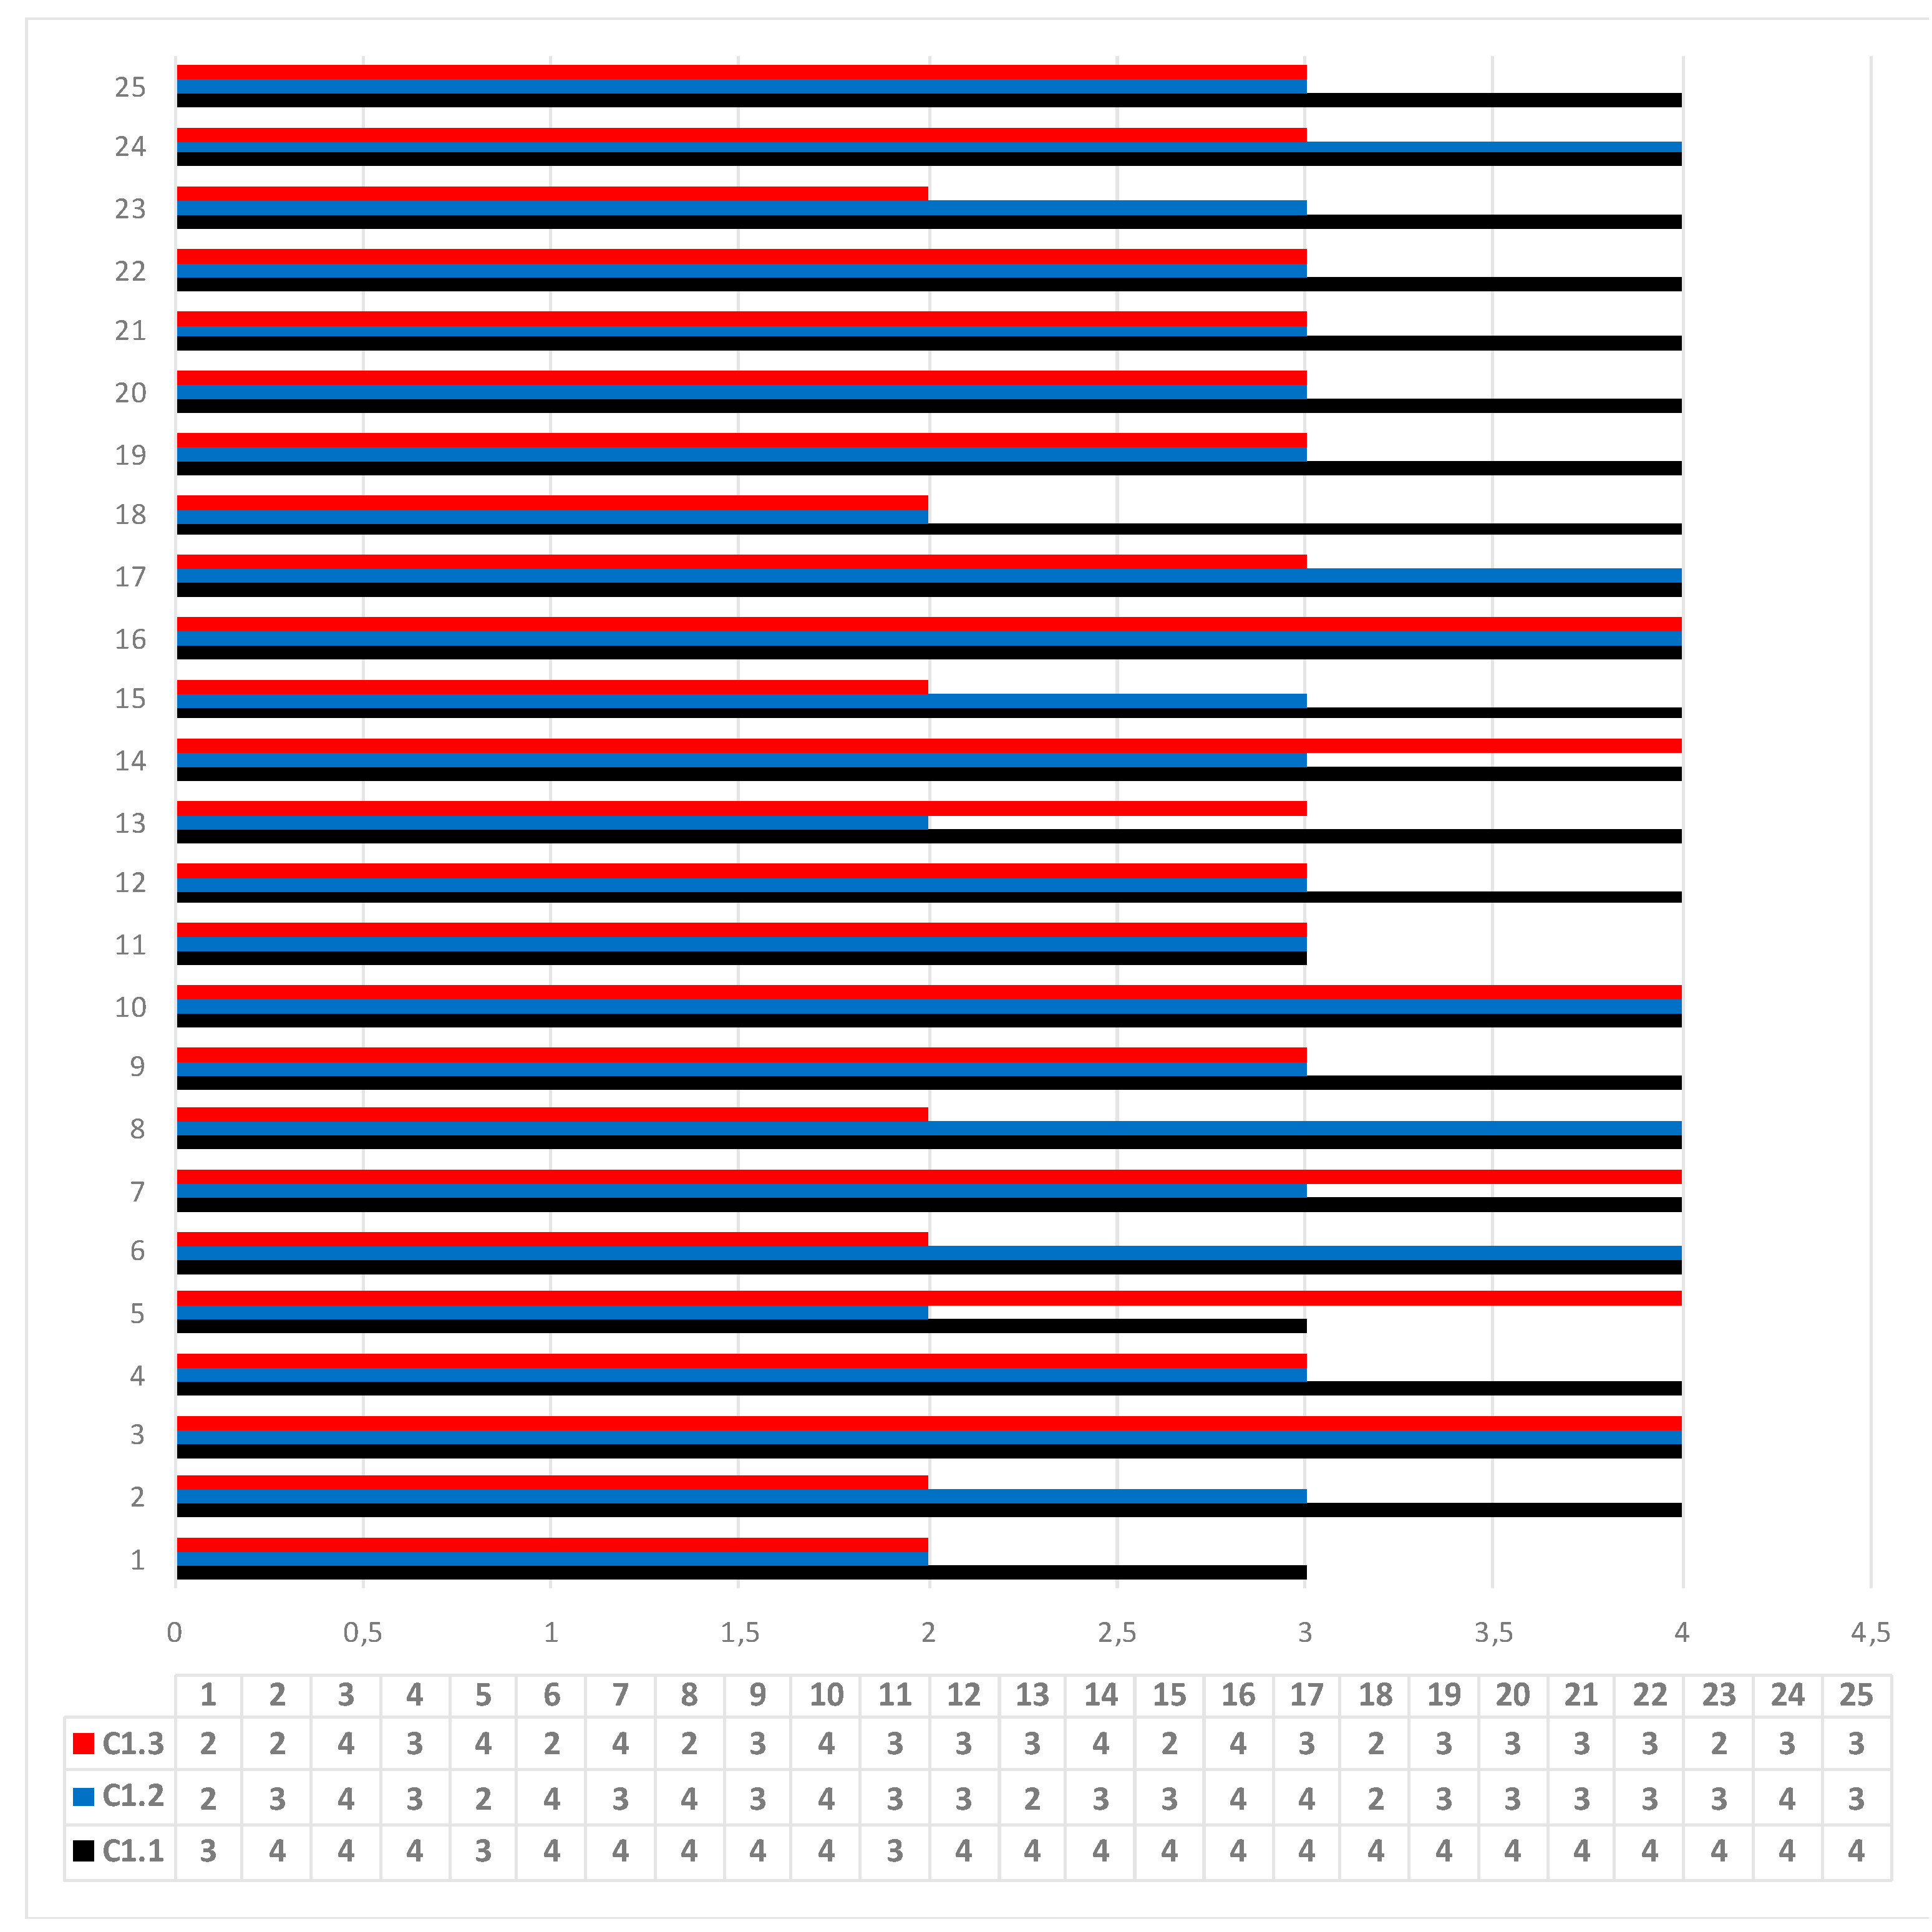
Figure 3 and Table 8 summarize the experts’ opinion about the importance of the water resources indicators and the weights of these indicators, as determined by the SWARA method. According to experts’ opinion, the water resources availability (WRA) is ranked first with a high weight w = 0.405, while the annual precipitation (AP) is ranked second with w = 0.324, the ratio of treated water (RTW) is considered as less important with w = 0.271.
The ratio of treated water (RTW) depends on three sub-indicators: wastewater coverage (WWC), the state of the sewage system (SoS) and water treatment level (WTL). Table 9 shows the values of the ratio of wastewater coverage. The situation in Jerico is very bad with WWC = 8% in 2017. Despite the improvement of this indicator in 2014 and 2015, it degraded in 2016 and 2017 due to the extension of the city. For other cities, WWC varies between 70% and 87% in 2017.
Table 10 shows the qualitative evaluation of the state of SoS and WTL by the water authorities and water experts. SoS is classified as very good in Jericho due to the young age of the sanitation system, while the state of this system is classified as bad and very bad in Jenin and Tulkarm, respectively, due to aging, leakage, insufficient diameters and a lack of maintenance. Concerning the water treatment level (WTL), Tulkarm and Hebron do not have any treatment facility, while Jenin, Ramallah and Jericho have a good treatment system.
According to data presented in Table 9 and Table 10, water authority and experts’ opinions, the severity and likelihood scores were established for WWC, SoS and WTL. Table 11 provides the values for these indicators. For the wastewater coverage (WWC), the risk is extreme for Jericho and Hebron, high for Tulkarm and for other cities. The risk for the sewage system (SoS) is extreme for Jenin and Tulkarm, high for Ramallah and Hebron and low for Jericho. The risk for the water treatment level (WTL) is extreme for Hebron and Tulkarm and high for other cities.
Table 12 summarizes the experts’ opinion about the importance and weights of the sub-indicators related to the ratio of treated water (RTW). Wastewater coverage (WWC) is ranked first, with w = 0.38, while the water treatment level (WTL) is ranked second with w = 0.33. The state of sewage system (SoS) is considered as less important with w = 0.29.
The risk score of the ratio of treated water (RTW) is determined from Table 11 and Table 12. The obtained results are given in Table 13. The risk is classified extreme for Tulkarm and Hebron and high for Jenin, Ramallah and Jericho.
The global risk score for the water resources (WR) was determined from the risk score of the indicators WRA, AP and RTW (Table 7 and Table 13) and the weights of these indicators (Table 8). Table 14 provides the obtained results. It shows that the risk of the water resources is extreme for the five cities.
3.3. Water Services Indicators
Three indicators are used for the assessment of the water services risk: water coverage (WC), water losses (WL) and the continuity of water supply (CWS). Table 15 provides data about water coverage. We observe that this indicator is excellent for Ramallah and Tulkarm and very good for Jericho (WC = 89%) and Hebron (WC = 86%).
Table 16 provides data concerning water losses (WL). It is very high in Jenin and Tulkarm (40% and 44%), high in Ramallah and Hebron (23 and 30%) and acceptable in Jericho (14%). Table 17 shows data about the continuity of water supply (CWS). This indicator is excellent for Tulkarm, bad for Ramallah (54%) and Jerihco (62%) and very bad for Hebron (3%) and Jenin (17%).
According to data presented in Table 15, Table 16 and Table 17, water authority and experts’ opinion, the severity and likelihood scores were established for water coverage (WC), water losses (WL) and the continuity of water supply (CWS). The risk is low to medium for water coverage. It is high to extreme for water losses. The risk of the continuity of water supply is high in Jerico, low in Tulkarm and extreme in the other cities.
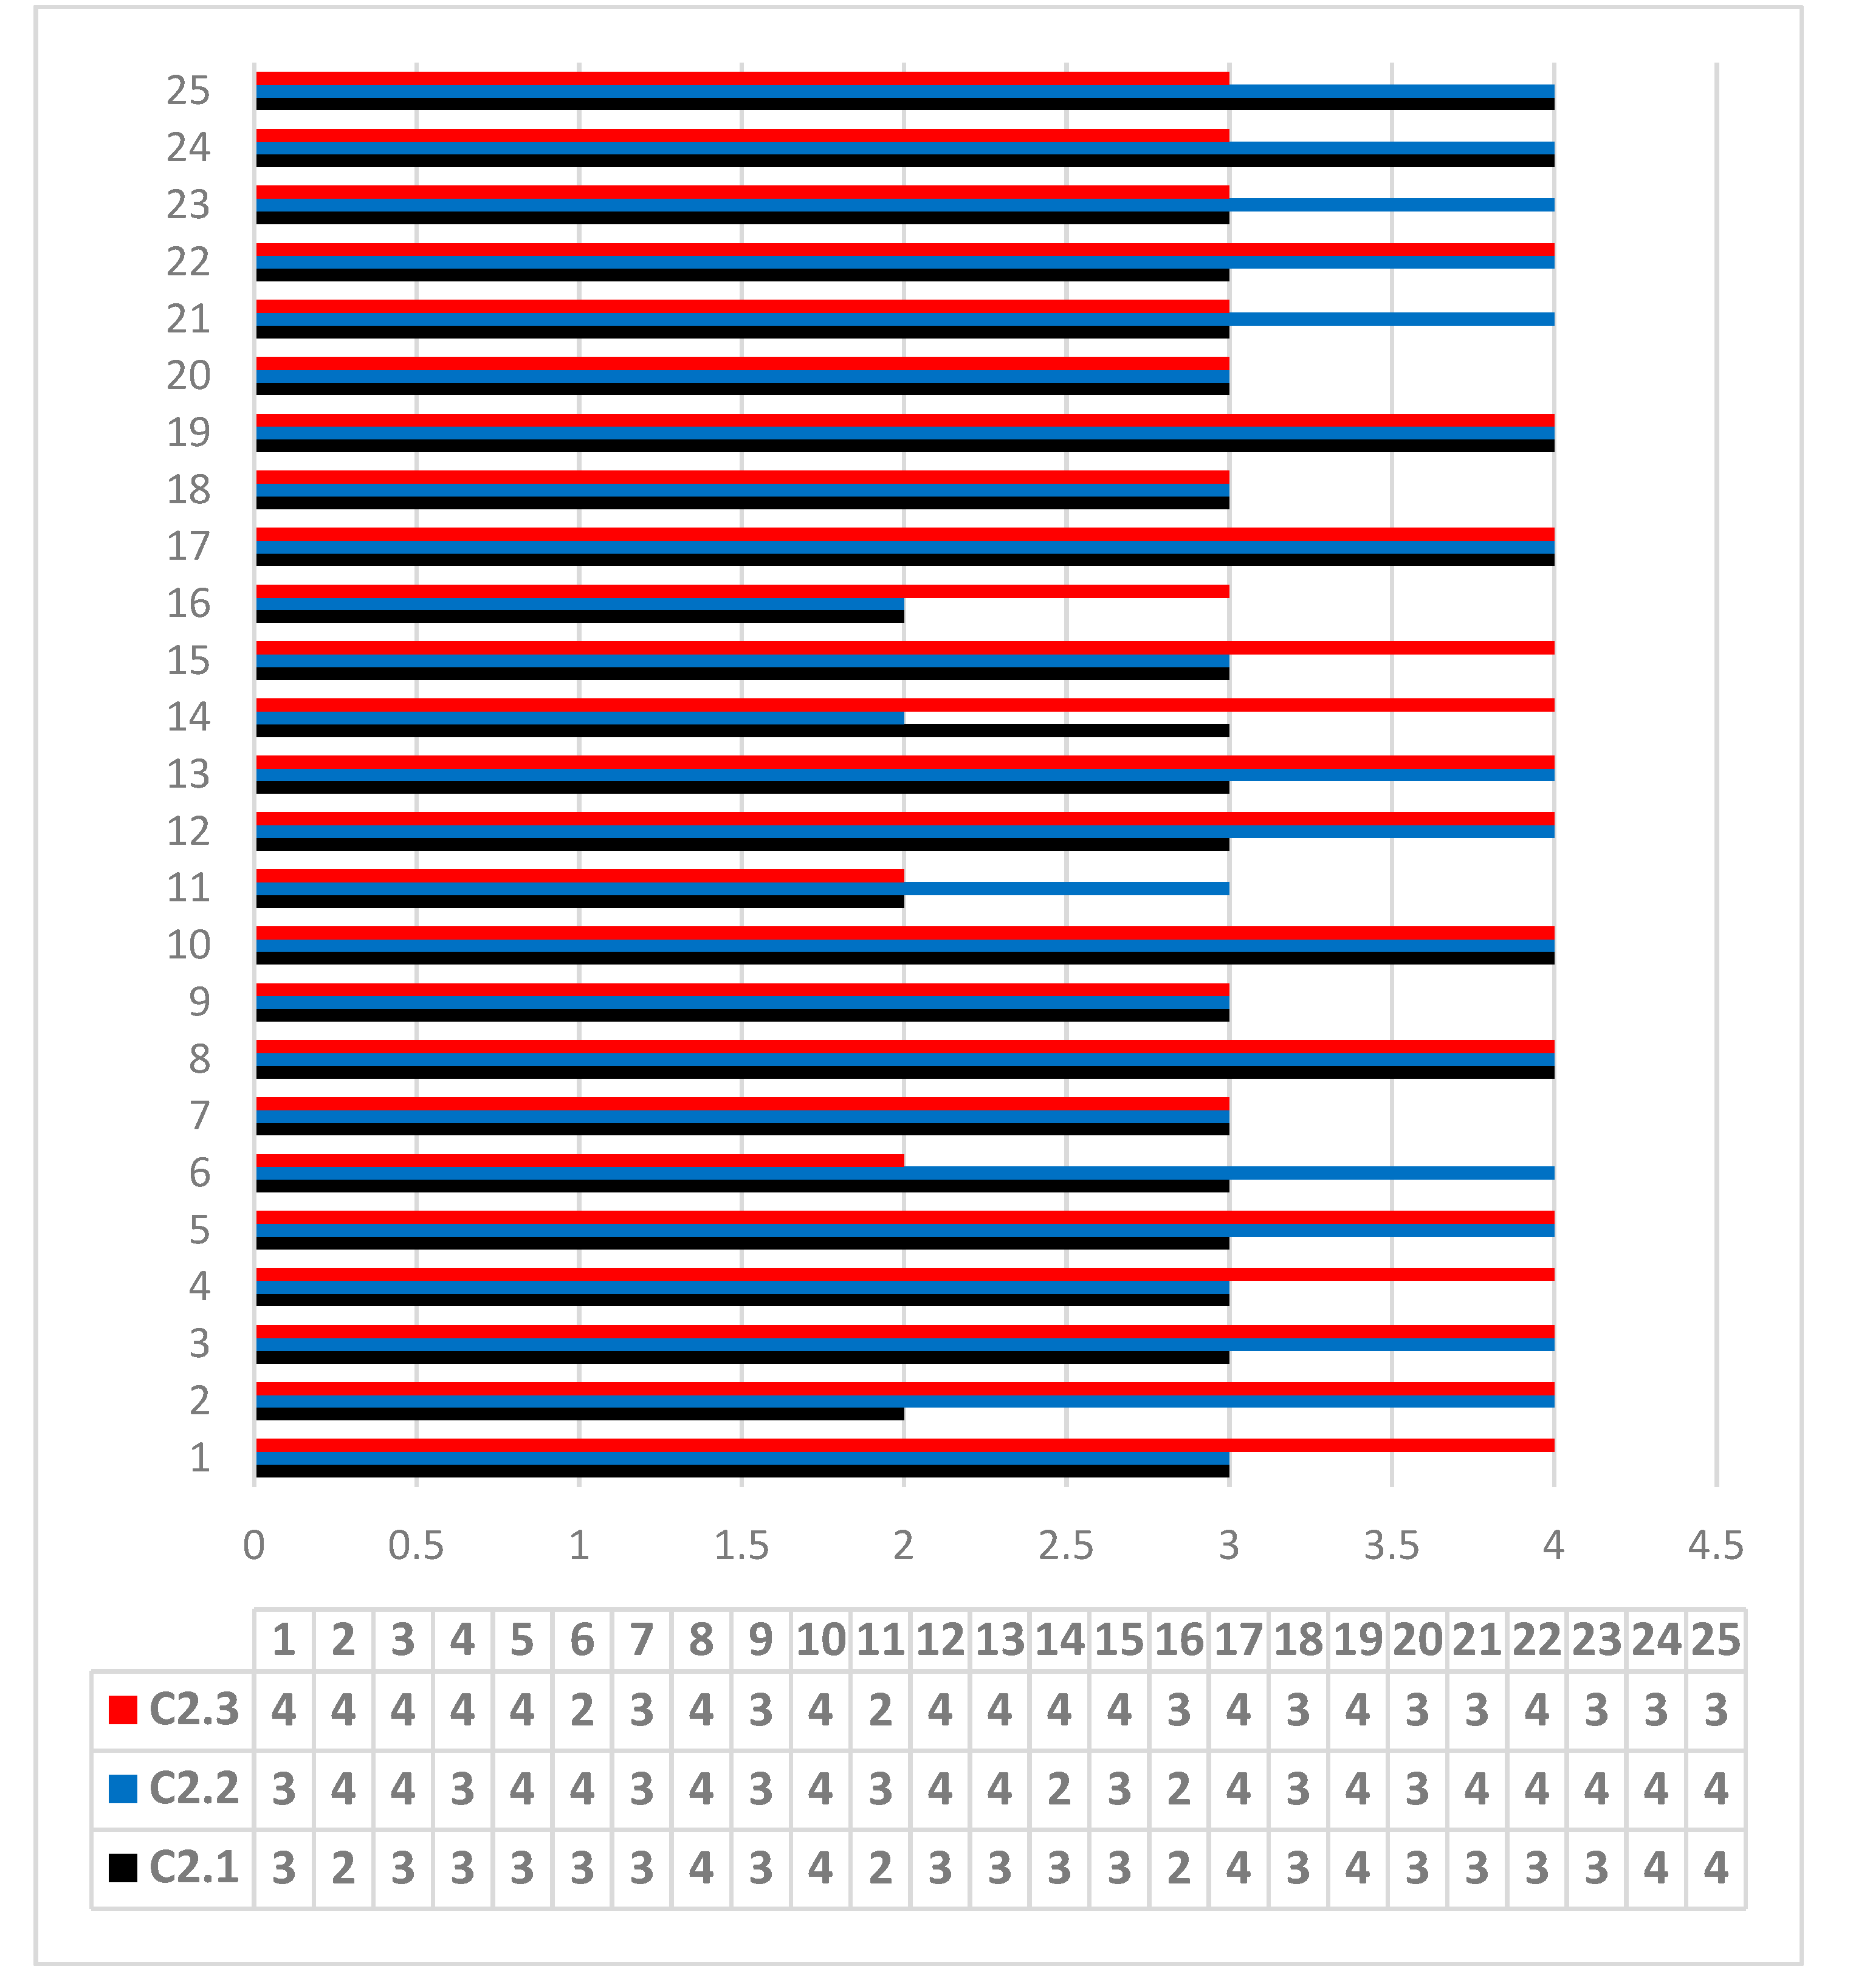
Figure 4 shows the experts’ opinion concerning the importance of the water services indicators. The continuity of water supply (CWS) is ranked first with w = 0.385, followed by the ratio of water losses (WL) with w = 0.334 and the ratio of water coverage (WC) with w = 0.281.
The risk score for water services is determined from the risk score of different indicators (Table 18) and the weights of these indicators (Table 19). Table 20 provides the obtained results. It shows that this risk is extreme for Jenin and Hebron, high for Ramallah and Jericho and medium for Tulkarm.
3.4. Water Governance Indicators
According to the Palestinian water law [3], water governance is shared between the Palestinian Water Authority (PWA) and the Water Sector Regulatory Council (WSRC). The former (PWA) is the main water regulator with responsibilities for regulation, planning, management, monitoring and cooperation with international agencies and donors. The latter (WSRC) was established in 2014 as a financially and administratively independent institution, which reports directly to the Palestinian cabinet of ministers. It has a role of monitoring the water services operations, including production, transportation, distribution, consumption and wastewater. However, according to experts’ opinion, the separation in the roles of these two institutions is not yet clear because of the deficiency in the application of the water law. Access to water data and information about the water system is still very difficult because these data are fragmented in many institutions and bodies, which do not cooperate in data collection and sharing. A comprehensive water information system is still missing. Consequently, both the civil society and water operators meet difficulties to access reliable water data. The Palestinian water system suffers from strong centralization. According to the experts’ opinion, water stakeholders, such as local authorities, water providers and civil society, are not really engaged in the water system evaluation and decision-making. Table 21 summarizes the experts’ opinion about the Palestinian water governance. The severity and likelihood scores for water governance were determined according to this table and experts’ opinions. Table 22 summarizes the experts’ opinion. The risk is extreme for water information access (AWI) and high for both roles and responsibilities (RR) and stakeholder engagement (SE).
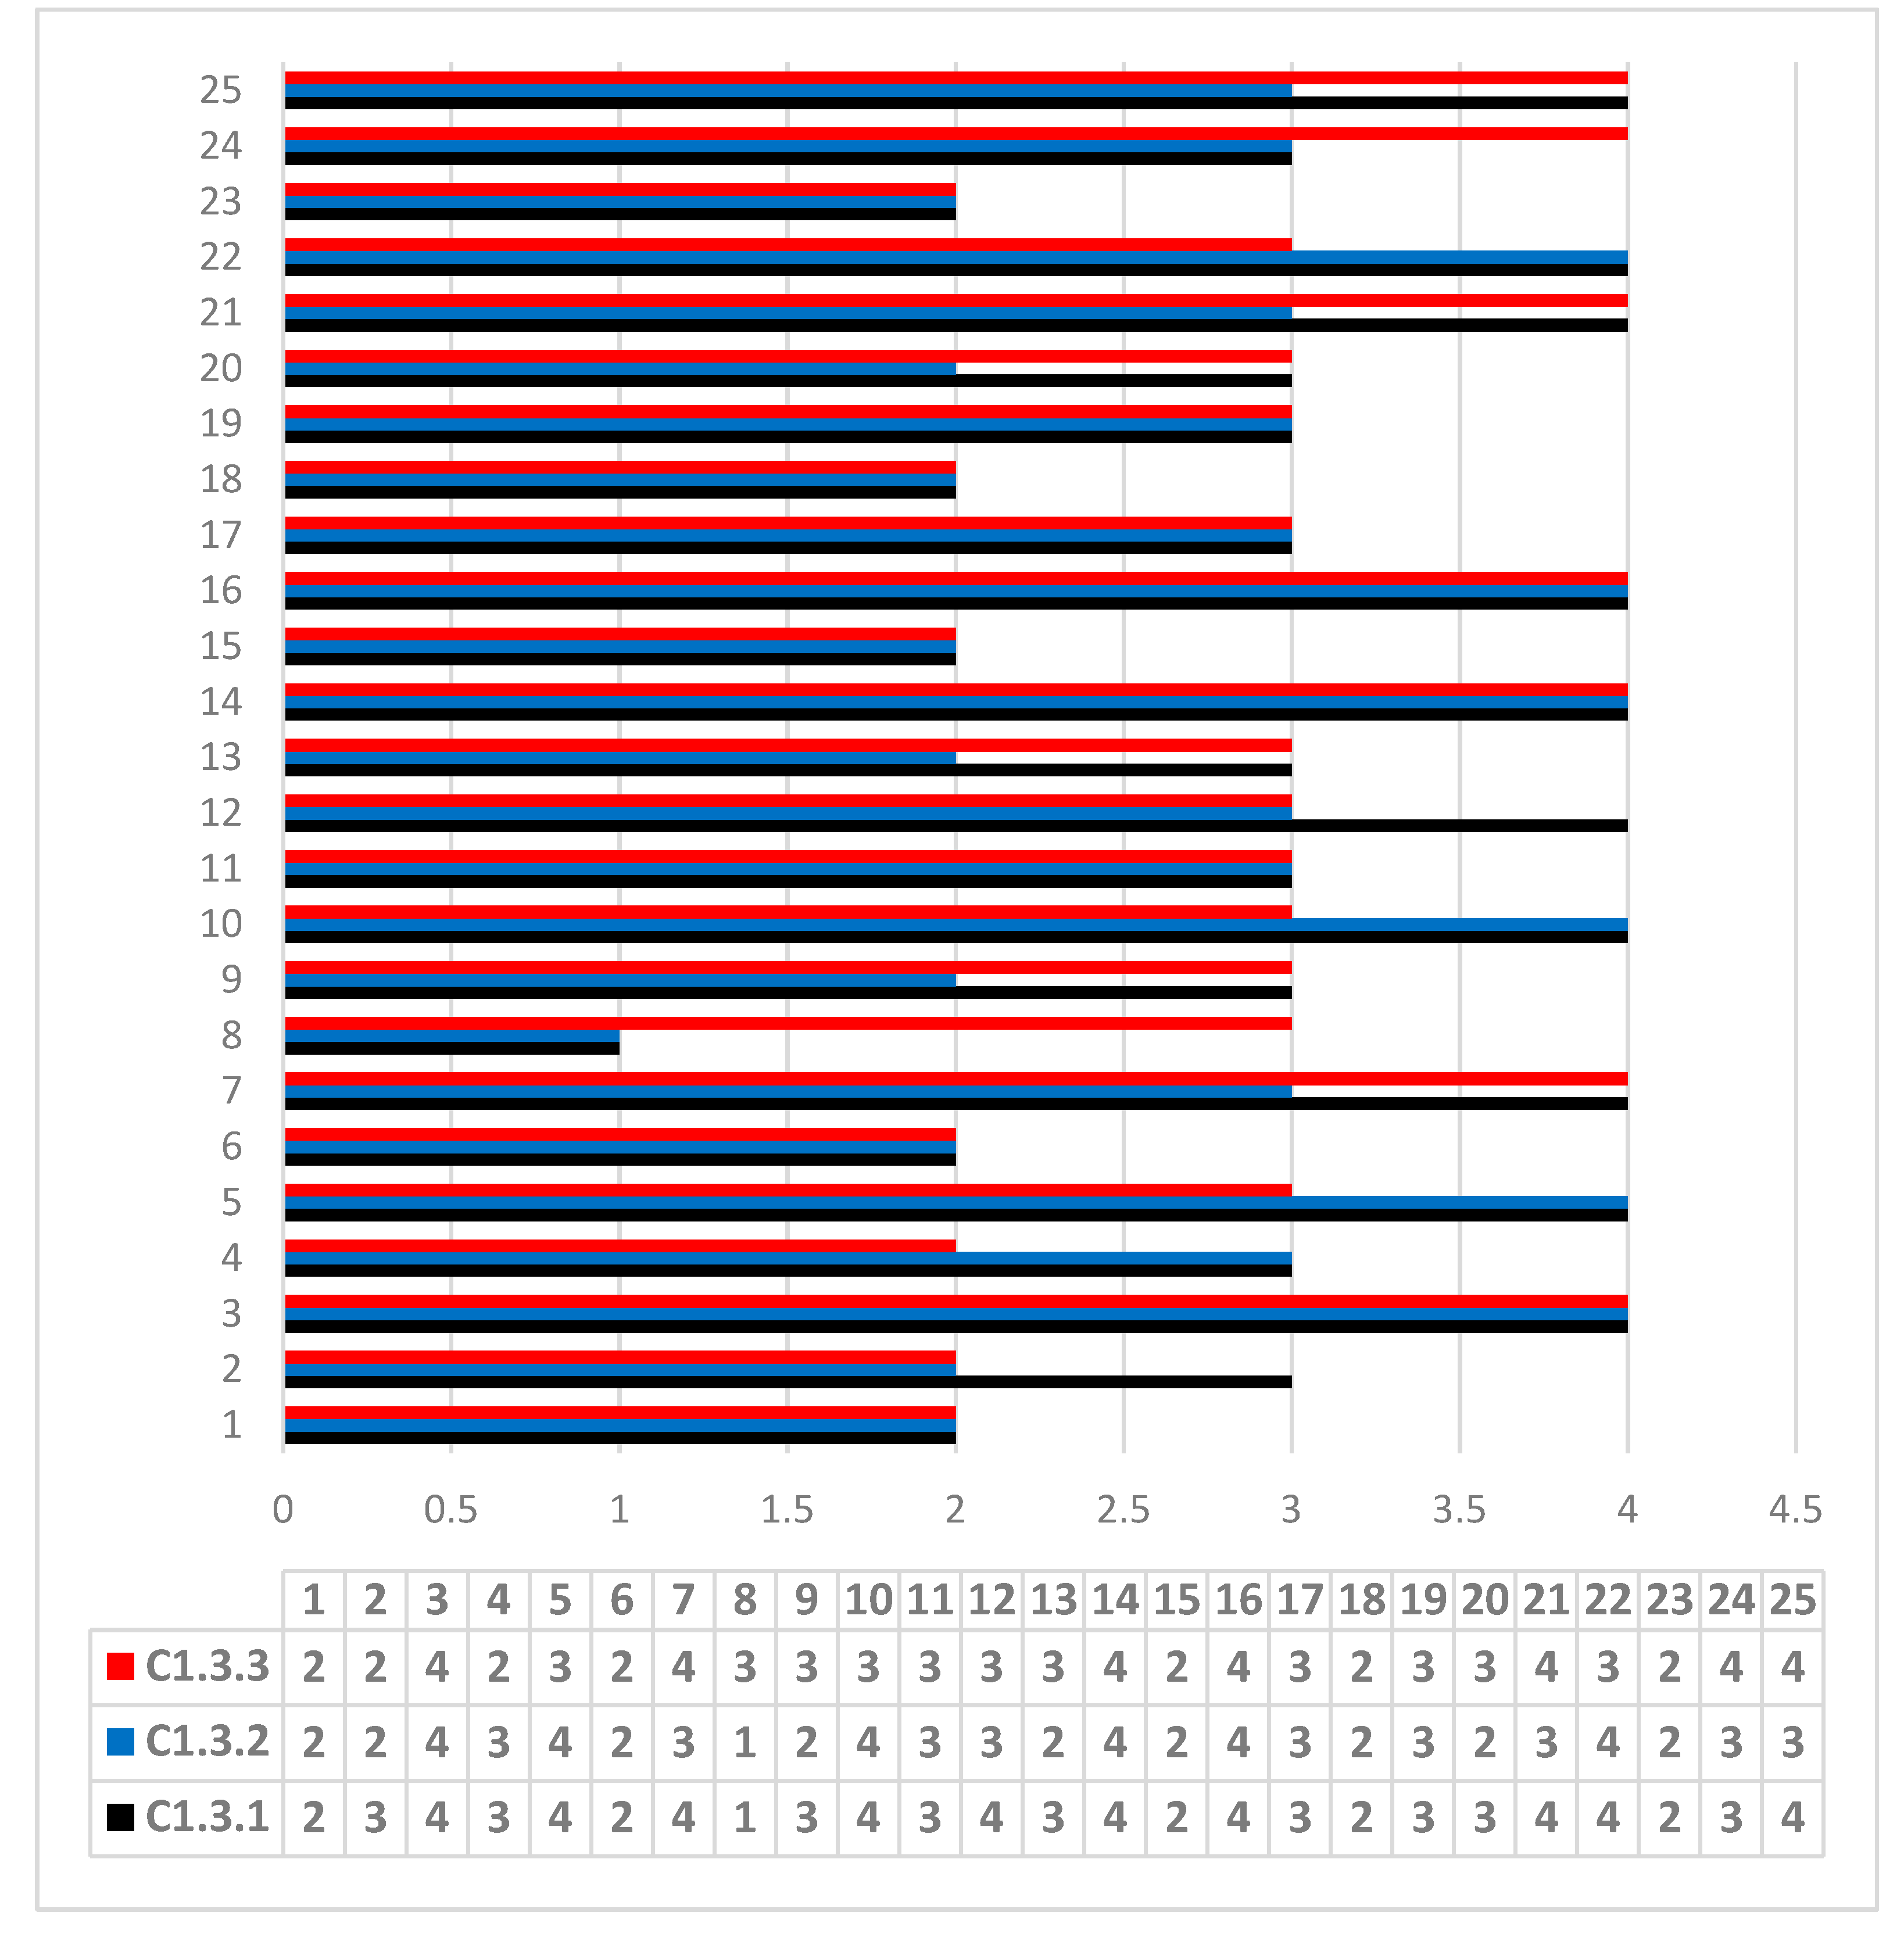
Figure 5 and Table 23 show the experts’ opinion concerning the importance of the water governance indicators. The indicator roles and responsibilities (RR) is considered as the most important (w = 0.39), which shows the necessity to take action for the clarification of the responsibilities in the water sector. Stakeholder engagement (SE) is also considered as important (w = 0.33); this opinion is related to the low engagement of water stakeholders in water governance. Authorities should reinforce water governance through decentralization and engagement of both the private sector and the civil society in water governance. Access to water information (AWI) is considered as less important with w = 0.28. The risk score for water governance is determined from Table 22 and Table 23. It is equal to 16, which indicates that this risk is classified as extreme.
3.5. Determination of the Water Security Index
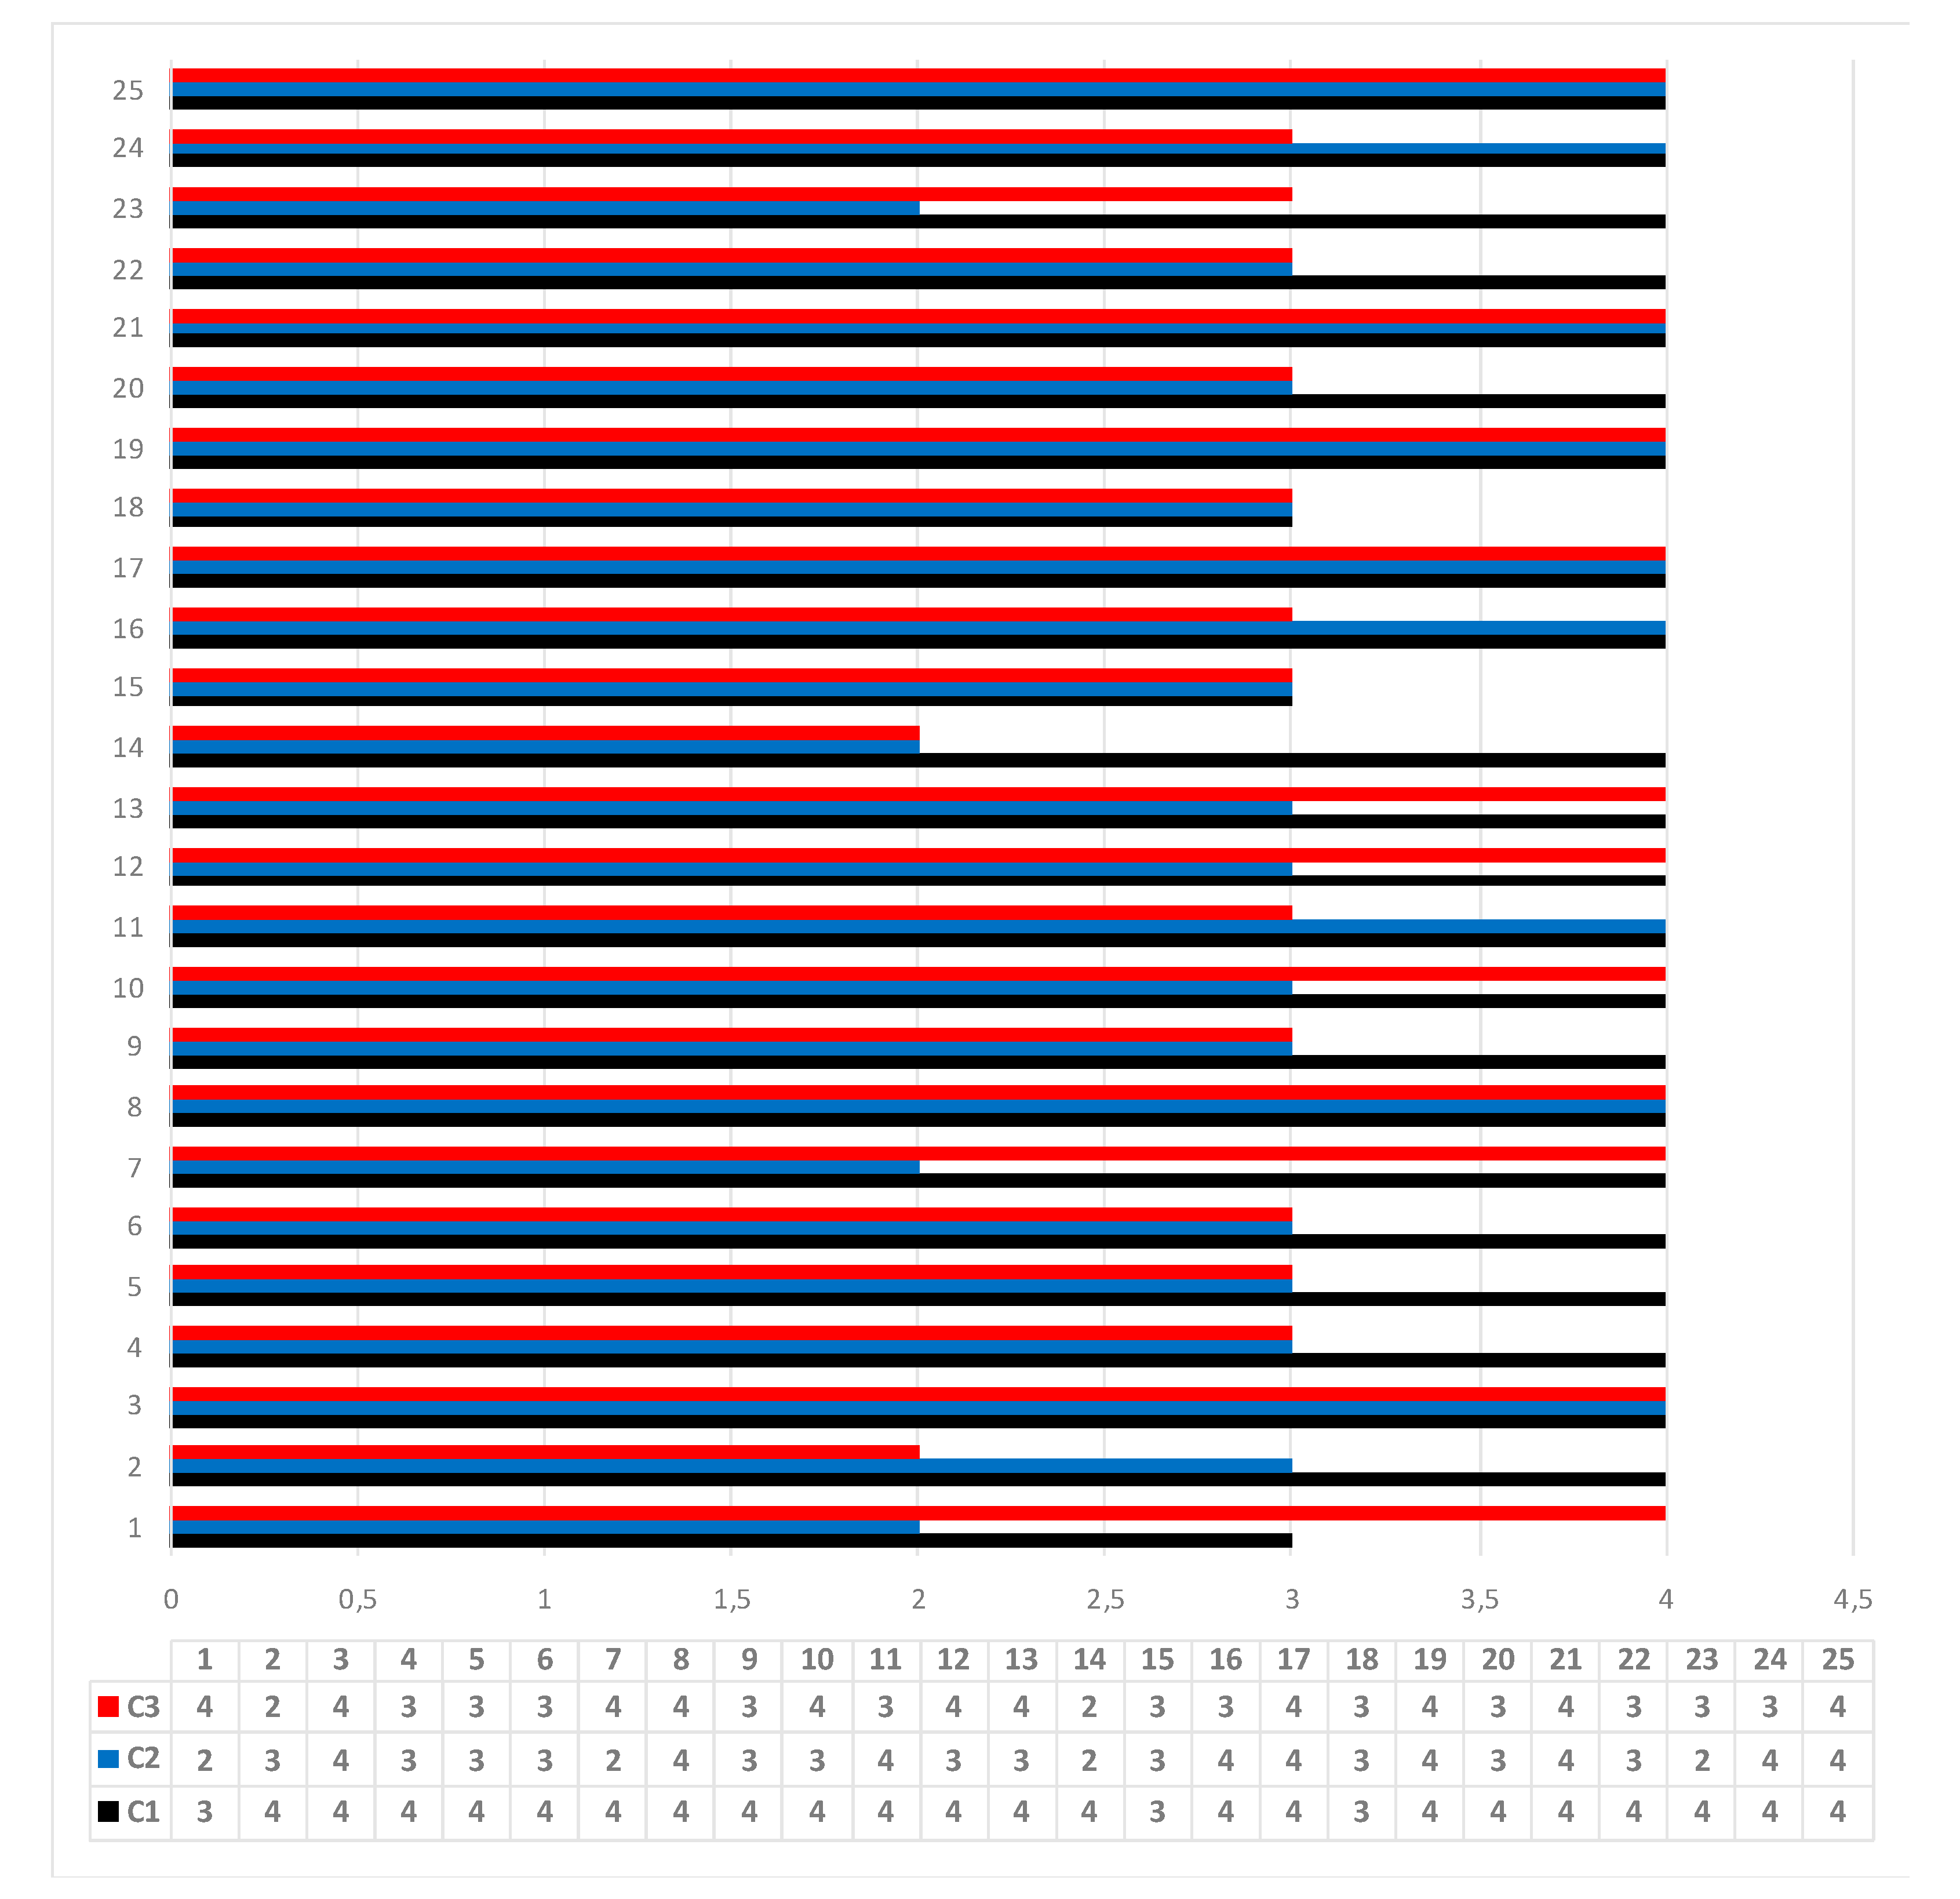
Figure 6 and Table 24 show the experts’ opinion concerning the importance of the categories of water resources (WR), water services (WS) and water governance (WG) indicators. The category water resources is ranked first with w = 0.39, followed by water governance with w = 0.33 and water services with w = 0.28.
The global risk score is determined from the scores of water resources (Table 14), water services (Table 20) and water governance (risk score = 16) and the correspondent weights in Table 24. Table 25 provides the details of the calculation of this score. It shows that the risk is ranked high for Tulkarm and extreme for the four other cities. It could be observed that the risk related to water resources is the major contributor to global risk, followed by water governance.
4. Conclusions
This paper presented a scientific data-based contribution for the assessment of water security in Palestinian cities, which are subject to a high water stress, degradation in water infrastructures and governance difficulties. This analysis could also be relevant for other territories subject to similar conditions. The interest of this contribution lies in the methodology used for addressing the urban security issue in Palestinian cities. This approach was based on a combination of risk analysis tools, the determination of relevant water security indicators from the literature review and experts’ opinions, the collection of data related to water resources, water services and water governance, the analysis of collected data using the risk matrix and SWARA methods. It allowed the authors to determine the water security score and index for five Palestinian cities.
Results show an extreme risk for water resource in Palestine because of the extreme risk of the water resources availability and the high to extreme risk of annual precipitation and the ratio of treated wastewater. This result shows that the Palestinian authorities should engage urgent actions for the protection of water resources, the increase in wastewater treatment capacity and the reduction in water consumption.
Water governance risk is ranked as extreme. Palestinian authorities should reduce this risk through a clear definition and separation of water responsibilities, a decentralization of water governance to reinforce the engagement of local authorities and other water stakeholders and, finally, the construction of a comprehensive water information system with easy access to water stakeholders.
Finally, the risk of water services is ranked high to extreme because of the high water losses and high distribution in the continuity of water services. Urgent actions are required to reduce water losses through renovation and maintenance of the water distribution system. Actions are also required to increase the capacity and efficiency of the water distribution system to improve the continuity of water services.
Author Contributions
S.J., I.S. and J.E.K. conceived of the research idea, S.J. and I.S. established the research methodology, S.J. collected data; S.J. and I.S. conducted data analysis and discussed results. All the authors contributed to the final manuscript. All authors have read and agreed to the published version of the manuscript.
Funding
This research did not benefit from specific funding support.
Conflicts of Interest
All authors declare no conflicts of interest.
References
- World Bank. Assessment of Restrictions on Palestinian Water Sector Development. Available online: http://documents.worldbank.org/curated/en/775491468139782240/pdf/476570SR0P11511nsReport18Apr2009111.pdf (accessed on 22 April 2020).
- United Nations Development Programme (UNDP). Climate Change Adaptation Strategy and Programme of Action for The Palestinian Authority. Available online: http://eprints.lse.ac.uk/30777 (accessed on 22 April 2020).
- PWA. Palestinian Water Law (2014). Available online: http://www.pwa.ps/userfiles/server/law/Water Law new 2014.pdf (accessed on 22 April 2020).
- Water Sector Regulatory Council. Bridge to Sustainability Water and Wastewater Service Providers in Palestine Facts and Prospects-2015 Report. Available online: https://www.wsrc.ps/cached_uploads/download/english-wsrc-report-1499181826.pdf (accessed on 22 April 2020).
- World Bank Group. Toward Water Security for Palestinians; World Bank Group: Washington, DC, USA, 2018. [Google Scholar]
- Petrovic, E.K.; Marques, B.; Perkins, N.; Marriage, G. Phenomenology in Spatial Design Disciplines: Could it Offer a Bridge to Sustainability. In Advancements in the Philosophy of Design. Design Research Foundations; Vermaas, P., Vial, S., Eds.; Springer: Cham, Switzerland, 2018; pp. 285–316. Available online: https://0-doi-org.brum.beds.ac.uk/10.1007/978-3-319-73302-9_14 (accessed on 22 April 2020).
- UNESCO. The United Nations World Water Development Report 2019: Leaving No One Behind; UNESCO: Paris, France, 2019. [Google Scholar]
- World Health Organization & International Water Association. Water Quality: Guidelines, Standards and Healt—Assessment of Risk and Risk Management for Water-Related Infectious Diseases.; WHO & IWA Publishing: London, UK, 2001; pp. 257–288. [Google Scholar]
- Grey, D.; Sadoff, C.W. Sink or Swim? Water security for growth and development. Hydrol. Res. 2007, 9, 545–571. [Google Scholar] [CrossRef]
- GWP Perspectives Paper. Increasing Water Security: A Development Imperative. Available online: https://www.gwp.org/globalassets/global/toolbox/publications/perspective-papers/02-increasing-water-security-a-development-imperative-2012.pdf (accessed on 22 April 2020).
- OECD. Water Security for Better Lives: A Summar for Better Lives; Organisation for Economic Co-operation and Development: France, Paris, 2013. [Google Scholar]
- Hall, J.; Borgomeo, E. Risk-based principles for defining and managing water security. Philos. Trans. R. Soc. A Math. Phys. Eng. Sci. 2013, 371, 20120407. [Google Scholar] [CrossRef] [PubMed] [Green Version]
- van Beek, E.; Arriens, W.L. Water Security: Putting the Concept into Practice. Available online: https://www.gwp.org/globalassets/global/toolbox/references/towards-water-security.-a-framework-for-action.-mobilising-political-will-to-act-gwp-2000.pdf (accessed on 22 April 2020).
- Vörösmarty, C.J.; McIntyre, P.B.; Gessner, M.O.; Dudgeon, D.; Prusevich, A.; Green, P.; Glidden, S.; Bunn, S.E.; A Sullivan, C.; Liermann, C.R.; et al. Global threats to human water security and river biodiversity. Nature 2010, 467, 555–561. [Google Scholar] [CrossRef] [PubMed]
- Mason, N.; Calow, R. Water Security: From Abstract Concept to Meaningful Metrics. Available online: https://www.odi.org/sites/odi.org.uk/files/odi-assets/publications-opinion-files/7866.pdf (accessed on 22 April 2020).
- Gain, A.K.; Giupponi, C.; Wada, Y. Measuring global water security towards sustainable development goals. Environ. Res. Lett. 2016, 11, 124015. [Google Scholar] [CrossRef]
- Johnston, R. Arsenic and the 2030 Agenda for Sustainable Development. In Arsenic in the Environment-Proceedings; Informa UK Limited: London, UK, 2016; pp. 12–14. [Google Scholar]
- Van Ginkel, K.C.H.; Hoekstra, A.; Buurman, J.; Hogeboom, R. Urban Water Security Dashboard: Systems Approach to Characterizing the Water Security of Cities. J. Water Resour. Plan. Manag. 2018, 144, 04018075. [Google Scholar] [CrossRef] [Green Version]
- Aboelnga, H.T.; Ribbe, L.; Frechen, F.-B.; Saghir, J. Urban Water Security: Definition and Assessment Framework. Resources 2019, 8, 178. [Google Scholar] [CrossRef] [Green Version]
- World Health Organization. Guidelines for Drinking-Water Quality, 4th ed.; World Health Organization: Geneva, Switzerland, 2017; ISBN 978-92-4-154995-0. [Google Scholar]
- Levine, E. Improving risk matrices: The advantages of logarithmically scaled axes. J. Risk Res. 2012, 15, 209–222. [Google Scholar] [CrossRef]
- Flage, R.; Røed, W. A reflection on some practices in the use of risk matrices. In Proceedings of the 11th International Probabilistic Safety Assessment and Management Conference and the Annual European Safety and Reliability Conference 2012, PSAM11 and ESREL 2012, Helsinki, Finland, 25–29 June 2012; pp. 881–891. [Google Scholar]
- Hoekstra, A.; Buurman, J.; Van Ginkel, K.C.H. Urban water security: A review. Environ. Res. Lett. 2018, 13, 053002. [Google Scholar] [CrossRef] [Green Version]
- Jensen, O.; Wu, H. Urban water security indicators: Development and pilot. Environ. Sci. Policy 2018, 83, 33–45. [Google Scholar] [CrossRef]
- Palestinian Water Authority. National Water and Wastewater Strategy for Palestine: Toward Building a Palestinian State from Water Perspective; Palestinian Water Authority: Ramallah, Palestine, 2013; pp. 1–135. [Google Scholar]
- Radu, L. Qualitative, Semi-Quantitative and, Quantitative Methods for Risk Assessment: Case of the Financial Audit. Available online: https://www.researchgate.net/publication/46532735 (accessed on 22 April 2020).
- Purdy, G. ISO 31000: 2009-Setting a New Standard for Risk Management. Risk Anal. 2010, 30, 881–886. [Google Scholar] [CrossRef]
- Rovins, J.; Wilson, T.; Hayes, J.; Jensen, S.; Dohaney, J.; Mitchell, J.; Johnston, D.; Davies, A. Risk Assessment Handbook, GNS Science Miscellaneous Series; Highfield International: Dubai, UAE, 2015; p. 84. ISBN 978-0-908349-35-7. [Google Scholar]
- Božek, F.; Bumbova, A.; Bakos, E.; Bozek, A.; Dvořák, J. Semi-quantitative risk assessment of groundwater resources for emergency water supply. J. Risk Res. 2014, 18, 505–520. [Google Scholar] [CrossRef]
- Keršulienė, V.; Zavadskas, E.K.; Turskis, Z. Selection of rational dispute resolution method by applying new step-wise weight assessment ratio analysis (Swara). J. Bus. Econ. Manag. 2010, 11, 243–258. [Google Scholar] [CrossRef]
- Mardani, A.; Nilashi, M.; Zakuan, N.; Loganathan, N.; Soheilirad, S.; Saman, M.Z.M.; Ibrahim, O. A systematic review and meta-Analysis of SWARA and WASPAS methods: Theory and applications with recent fuzzy developments. Appl. Soft Comput. 2017, 57, 265–292. [Google Scholar] [CrossRef] [Green Version]
- Hajiagha, S.H.R.; Hashemi, S.S.; Mohammadi, Y.; Zavadskas, K.; Zavadskas, E.K. Fuzzy belief structure based VIKOR method: An application for ranking delay causes of tehran metro system by FMEA criteria. Transport 2016, 31, 108–118. [Google Scholar] [CrossRef] [Green Version]
- Zolfani, S.H.; Yazdani, M.; Zavadskas, E.K. An extended stepwise weight assessment ratio analysis (SWARA) method for improving criteria prioritization process. Soft Comput. 2018, 22, 7399–7405. [Google Scholar] [CrossRef]
- Yazdani, M.; Zolfani, S.H.; Zavadskas, E.K. New integration of MCDM methods and QFD in The selection of green suppliers. J. Bus. Econ. Manag. 2016, 17, 1097–1113. [Google Scholar] [CrossRef] [Green Version]
- Lee, S.; Panahi, M.; Pourghasemi, H.R.; Dou, J.; Alizadeh, M.; Shirzadi, A.; Khosravi, K.; Melesse, A.M.; Yekrangnia, M.; Rezaie, F.; et al. SEVUCAS: A Novel GIS-Based Machine Learning Software for Seismic Vulnerability Assessment. Appl. Sci. 2019, 9, 3495. [Google Scholar] [CrossRef] [Green Version]
- Shapiro, A.; Koissi, M. Risk Assessment Applications of Fuzzy Logic; Casualty Actuarial Society, Canadian Institute of Actuaries, Society of Actuaries: Ottawa, ON, Canada, 2015. [Google Scholar]
- Luo, T.; Wu, C.; Duan, L. Fishbone diagram and risk matrix analysis method and its application in safety assessment of natural gas spherical tank. J. Clean. Prod. 2018, 174, 296–304. [Google Scholar] [CrossRef]
- Alegre, H.; Baptista, J.; Cabrera, E.; Cubillo, F.; Duarte, P.; Hirner, W.; Merkel, W.; Parena, R. Performance Indicators for Water Supply Services: Third Edition. Water Intell. Online 2016, 15. [Google Scholar] [CrossRef]
- Howlett, M.; Cuenca, J.S. The use of indicators in environmental policy appraisal: Lessons from the design and evolution of water security policy measures. J. Environ. Policy Plan. 2016, 19, 229–243. [Google Scholar] [CrossRef]
- OECD. Implementing the OECD Principles on Water Governance. In OECD Studies on Water; Organisation for Economic Co-operation and Development: France, Paris, 2018. [Google Scholar]
- World Health Organization & International Water Association. Performance Indicators for Water Supply Services, 3th ed.; WHO & IWA Publishing: London, UK, 2017; ISBN 9781780406336. [Google Scholar]
- Wu, W.; Cheng, G.; Hu, H.; Zhou, Q. Risk analysis of corrosion failures of equipment in refining and petrochemical plants based on fuzzy set theory. Eng. Fail. Anal. 2013, 32, 23–34. [Google Scholar] [CrossRef]
Figure 1.
Set of indicators used in the assessment of water security in Palestinian cites.

Figure 2.
Annual precipitation (AP) in the period 2013–2015.

Figure 3.
Experts’ opinion concerning the importance of water resources indicators: water resources availability (WRA), annual precipitation (AP) and ratio of treated wastewater (RTW).
Figure 3.
Experts’ opinion concerning the importance of water resources indicators: water resources availability (WRA), annual precipitation (AP) and ratio of treated wastewater (RTW).

Figure 4.
Experts’ opinion concerning the importance of the water services indicators: C2.1 water coverage (WC), C2.2 water losses (WL), C2.3 continuity of water supply (CWS).
Figure 4.
Experts’ opinion concerning the importance of the water services indicators: C2.1 water coverage (WC), C2.2 water losses (WL), C2.3 continuity of water supply (CWS).

Figure 5.
Experts’ opinion about the importance of water governance indicators: C3.1: roles and responsibilities (RR), C3.2: access to water information (AWI), C3.3: stakeholder engagement (SE).
Figure 5.
Experts’ opinion about the importance of water governance indicators: C3.1: roles and responsibilities (RR), C3.2: access to water information (AWI), C3.3: stakeholder engagement (SE).

Figure 6.
Experts’ opinion concerning the importance of the categories of indicators C1: water resources, C2: water services and C3: water governance.
Figure 6.
Experts’ opinion concerning the importance of the categories of indicators C1: water resources, C2: water services and C3: water governance.


Table 1.
Likelihood score (LS) and associated occurrence level.
| Likelihood Score | Occurrence Probability |
|---|---|
| 1 | Rare |
| 2 | Unlikely |
| 3 | Moderate |
| 4 | Likely |
| 5 | Almost certain |
Table 2.
Severity score (SS) and associated impact level.
| Severity Score | Impact Level |
|---|---|
| 1 | Insignificant |
| 2 | Minor |
| 3 | Moderate |
| 4 | Major |
| 5 | Catastrophic |
Table 3.
Determination of the water security score.
| Risk Score | Severity | ||||||
|---|---|---|---|---|---|---|---|
| Insignificant | Minor | Moderate | Major | Catastrophic | |||
| 1 | 2 | 3 | 4 | 5 | |||
| Likelihood | Rare | 1 | 1 | 2 | 3 | 4 | 5 |
| Unlikely | 2 | 2 | 4 | 6 | 8 | 10 | |
| Moderate | 3 | 3 | 6 | 9 | 12 | 15 | |
| Likely | 4 | 4 | 8 | 12 | 16 | 20 | |
| Almost Certain | 5 | 5 | 10 | 15 | 20 | 25 | |
| Risk score | 1–5 | 6–9 | 10–15 | 16–25 | |||
| Risk level | Low | Medium | High | Extreme | |||
Table 4.
Determination of the water security index (WSI).
| Risk Score (RS) | Risk Level (RL) | Water Security Index (WSI) | Water Security Level (WSL) |
|---|---|---|---|
| 1 ≤ RS < 6 | Low | 4 | Good |
| 6 ≤ RS < 10 | Medium | 3 | Challenging |
| 10 ≤ RS < 16 | High | 2 | Poor |
| RS ≥ 16 | Extreme | 1 | Alarming |
Table 5.
Area and population of cities used in this research.
| City | Area (km2) | Population (in thousands) | Localization in the West Bank of Jordan |
|---|---|---|---|
| Jenin | 583 | 314 | North |
| Tulkarm | 246 | 157 | North |
| Ramallah | 855 | 280 | Center |
| Jericho | 593 | 50 | Center |
| Hebron | 997 | 711 | South |
Table 6.
Water resources availability (WRA) (%).
| Year/City | 2013 | 2014 | 2015 | 2016 | 2017 |
|---|---|---|---|---|---|
| Jenin | 100 | 100 | 100 | 100 | |
| Tulkarm | 99.9 | 99.9 | 99.90 | 99.94 | 99.9 |
| Ramallah | 100 | 100 | 100 | ||
| Jericho | 99.8 | 99.8 | 99.8 | 100 | 100 |
| Hebron | 100 | 100 | 100 | 100 | 100 |
Table 7.
Risk score (RS) for the water resources availability (WRA) and the annual precipitation (AP).
Table 7.
Risk score (RS) for the water resources availability (WRA) and the annual precipitation (AP).
| Indicator | WRA | AP | ||||
|---|---|---|---|---|---|---|
| City | SS | LS | RS | SS | LS | RS |
| Jenin | 4 | 5 | 25 | 3 | 5 | 15 |
| Tulkarm | 5 | 5 | 25 | 3 | 5 | 15 |
| Ramallah | 5 | 5 | 25 | 3 | 5 | 15 |
| Jericho | 5 | 5 | 25 | 5 | 5 | 25 |
| Hebron | 5 | 5 | 25 | 3 | 5 | 15 |
Table 8.
Determination of weights of water resources indicators.
| Category | C1.1 (WRA) | C1.2 (AP) | C1.3 (RTW) |
|---|---|---|---|
| ∑ points | 97 | 78 | 74 |
| Weight (SWARA method) | 0.405 | 0.324 | 0.271 |
Table 9.
Wastewater coverage (WWC) for the period 2013–2017 (%).
| City | 2013 | 2014 | 2015 | 2016 | 2017 |
|---|---|---|---|---|---|
| Jenin | 78 | 78 | 81 | 82 | |
| Tulkarm | 80 | 82 | 85 | 75 | 77 |
| Ramallah | 87 | ||||
| Jericho | 0 | 27 | 55 | 19 | 8 |
| Hebron | 56 | 66 | 66 | 70 | 70 |
Table 10.
State of the sewage system (SoS) and wastewater treatment level (WTL).
| City | State of Sewage System (SoS) | Treatment Level (WTL) |
|---|---|---|
| Jenin | Bad | Good |
| Tulkarm | Very bad | Absence |
| Ramallah | Acceptable | Good |
| Jericho | Very good | Good |
| Hebron | Acceptable | Absence |
Table 11.
Risk score (RS) for the wastewater coverage (WWC), water treatment level (WTL) and the state of sewage system (SoS).
Table 11.
Risk score (RS) for the wastewater coverage (WWC), water treatment level (WTL) and the state of sewage system (SoS).
| Indicator | WWC | SoS | WTL | ||||||
|---|---|---|---|---|---|---|---|---|---|
| City | SS | LS | RS | SS | LS | RS | SS | LS | RS |
| Jenin | 2 | 5 | 10 | 4 | 5 | 20 | 2 | 5 | 10 |
| Tulkarm | 3 | 5 | 15 | 5 | 5 | 25 | 5 | 5 | 25 |
| Ramallah | 2 | 5 | 10 | 3 | 5 | 15 | 2 | 5 | 10 |
| Jericho | 5 | 5 | 25 | 1 | 1 | 1 | 2 | 5 | 10 |
| Hebron | 4 | 5 | 20 | 3 | 5 | 15 | 5 | 5 | 25 |
Table 12.
Determination of weights of the wastewater coverage (WWC), wastewater treatment level (WTL) and the state of sewage system (SoS).
Table 12.
Determination of weights of the wastewater coverage (WWC), wastewater treatment level (WTL) and the state of sewage system (SoS).
| Category | C1.3.1 (WWC) | C1.3.2 (SoS) | C1.3.3 (WTL) |
|---|---|---|---|
| ∑ points | 78 | 70 | 75 |
| Weight (SWARA method) | 0.38 | 0.29 | 0.33 |
| City | Risk Score |
|---|---|
| Jenin | 13 |
| Tulkarm | 21 |
| Ramallah | 11 |
| Jericho | 13 |
| Hebron | 20 |
| City | Risk Score |
|---|---|
| Jenin | 19 |
| Tulkarm | 21 |
| Ramallah | 22 |
| Jericho | 22 |
| Hebron | 20 |
Table 15.
Water coverage (WC) (year 2017).
| City | WC (%) |
|---|---|
| Jenin | 92 |
| Tulkarm | 98 |
| Ramallah | 100 |
| Jericho | 89 |
| Hebron | 86 |
Table 16.
Water losses (WL) (%).
| City | 2015 | 2016 | 2017 |
|---|---|---|---|
| Jenin | 49 | 49 | 44 |
| Tulkarm | 38 | 39 | 40 |
| Ramallah | 28 | 25 | 23 |
| Jericho | 27 | 19 | 13 |
| Hebron | 30 | 30 | 30 |
Table 17.
Continuity of the water supply (CWS) in 2017.
| City | CWS (%) |
|---|---|
| Jenin | 17 |
| Tulkarm | 100 |
| Ramallah | 54 |
| Jericho | 62 |
| Hebron | 3 |
Table 18.
Risk score (RS) for water coverage (WC), water losses (WL) and the continuity of the water supply (CWS).
Table 18.
Risk score (RS) for water coverage (WC), water losses (WL) and the continuity of the water supply (CWS).
| Indicator | WC | WL | CWS | ||||||
|---|---|---|---|---|---|---|---|---|---|
| City | SS | LS | RS | SS | LS | RS | SS | LS | RS |
| Jenin | 2 | 5 | 10 | 5 | 5 | 25 | 5 | 5 | 25 |
| Tulkarm | 1 | 1 | 1 | 4 | 5 | 20 | 1 | 1 | 1 |
| Ramallah | 1 | 1 | 1 | 3 | 5 | 15 | 4 | 5 | 20 |
| Jericho | 3 | 5 | 15 | 2 | 5 | 10 | 3 | 5 | 15 |
| Hebron | 3 | 5 | 15 | 3 | 5 | 15 | 5 | 5 | 25 |
Table 19.
Determination of weights of water services indicators.
| Category | C2.1 (WC) | C2.2 (WL) | C2.3 (CWS) |
|---|---|---|---|
| ∑ points | 78 | 88 | 87 |
| Weight (SWARA method) | 0.281 | 0.334 | 0.385 |
Table 20.
Risk score for the water services (WS).
| City | Risk Score |
|---|---|
| Jenin | 21 |
| Tulkarm | 8 |
| Ramallah | 13 |
| Jericho | 13 |
| Hebron | 18 |
Table 21.
Water governance indicators.
| Indicator | Qualitative Value |
|---|---|
| Roles and responsibilities (RR) | Unclear because of implementation deficiency |
| Access to water information (AWI) | Difficult because of data fragmentation |
| Stakeholder engagement (SE) | Weak |
Table 22.
Security and likelihood scores for roles and responsibilities (RR), access to water information (AWI) and stakeholder engagement (SE) indicators.
Table 22.
Security and likelihood scores for roles and responsibilities (RR), access to water information (AWI) and stakeholder engagement (SE) indicators.
| Indicator | S. Score | Likelihood | Risk Score |
|---|---|---|---|
| Roles and responsibilities | 3 | 5 | 15 |
| Access to information | 4 | 5 | 20 |
| Stakeholder engagement | 3 | 5 | 15 |
Table 23.
Determination of weights of water governance indicators.
| Category | C3.1 (RR) | C3.2 (AWI) | C3.3 (SE) |
|---|---|---|---|
| ∑ points | 78 | 70 | 75 |
| Weight (SWARA method) | 0.39 | 0.28 | 0.33 |
Table 24.
Determination of weights of water resources (WR), water services (WS) and water governance (WG) indicators.
Table 24.
Determination of weights of water resources (WR), water services (WS) and water governance (WG) indicators.
| Category | C1 (WR) | C2 (WS) | C3 (WG) |
|---|---|---|---|
| ∑ points | 97 | 80 | 84 |
| Weight (SWARA method) | 0.39 | 0.28 | 0.33 |
Table 25.
Global water security score and security index (determined from Table 4, Table 14, Table 20 and Table 24).
| Risk Driver | Water Resources | Water Services | Water Governance | Global Risk Score | Security Index | Security Level |
|---|---|---|---|---|---|---|
| Weight | 0.39 | 0.28 | 0.33 | |||
| Jenin | 19 | 21 | 16 | 19 | 1 | Alarming |
| Tulkarm | 21 | 8 | 16 | 16 | 1 | Alarming |
| Ramallah | 22 | 13 | 16 | 16 | 1 | Alarming |
| Jericho | 22 | 13 | 16 | 18 | 1 | Alarming |
| Hebron | 20 | 18 | 16 | 19 | 1 | Alarming |
© 2020 by the authors. Licensee MDPI, Basel, Switzerland. This article is an open access article distributed under the terms and conditions of the Creative Commons Attribution (CC BY) license (http://creativecommons.org/licenses/by/4.0/).
Share and Cite
MDPI and ACS Style
Jabari, S.; Shahrour, I.; El Khattabi, J. Assessment of the Urban Water Security in a Severe Water Stress Area–Application to Palestinian Cities. Water 2020, 12, 2060. https://0-doi-org.brum.beds.ac.uk/10.3390/w12072060
AMA Style
Jabari S, Shahrour I, El Khattabi J. Assessment of the Urban Water Security in a Severe Water Stress Area–Application to Palestinian Cities. Water. 2020; 12(7):2060. https://0-doi-org.brum.beds.ac.uk/10.3390/w12072060
Chicago/Turabian StyleJabari, Samah, Isam Shahrour, and Jamal El Khattabi. 2020. "Assessment of the Urban Water Security in a Severe Water Stress Area–Application to Palestinian Cities" Water 12, no. 7: 2060. https://0-doi-org.brum.beds.ac.uk/10.3390/w12072060
Note that from the first issue of 2016, this journal uses article numbers instead of page numbers. See further details here.