Article

Comparison of Uranium Isotopes and Classical Geochemical Tracers in Karst Aquifer of Ljubljanica River catchment (Slovenia)

1
Department of Environmental Sciences, Jožef Stefan Institute, Jamova 39, SI-1000 Ljubljana, Slovenia
2
Jožef Stefan International Postgraduate School, Jamova 39, SI-1000 Ljubljana, Slovenia
3
School of Environmental Sciences, University of Nova Gorica, Glavni trg 8, SI-5271 Vipava, Slovenia
4
Karst Research Institute, Slovenian Academy of Sciences and Arts, Titov trg 2, SI-6230 Postojna, Slovenia
5
Slovenian National Building and Civil Engineering Institute, Dimičeva 12, SI-1000 Ljubljana, Slovenia
6
Faculty of Civil and Geodetic Engineering, University of Ljubljana, Jamova 2, SI-1000 Ljubljana, Slovenia
*
Author to whom correspondence should be addressed.
Submission received: 17 June 2020 / Revised: 16 July 2020 / Accepted: 17 July 2020 / Published: 21 July 2020
(This article belongs to the Section Hydrology)

Abstract

:
The karst aquifer of the Ljubljanica River catchment, which has numerous springs and sinks, presents an interesting environment for studying hydrogeological processes. This study aims to explore the behavior of U isotopes and to evaluate their use as tracers of hydrogeochemical processes as an alternative to classical geochemical tracers (i.e., physicochemical parameters, elemental ratios, and alkalinity) involved in water–rock interactions and water flow in this karst water system. Basic hydrochemical parameters, as well as the spatiotemporal variations of total U concentrations, 234U/238U activity ratios, and δ238U values, were monitored in water samples from springs and sinks under different hydrological conditions. The bedrock as the source of dissolved and detrital U was also analyzed. Multi-collector inductively couple plasma-mass spectrometry results reveal variations of the 234U/238U activity ratios, which are consistently negatively correlated with the discharge at most analyzed sites. Large 238U/235U isotope fractionation occurred during bedrock weathering, and the large variability of the measured δ238U values is seemingly unrelated to the lithological characteristics of the bedrock or discharge. Our results confirm that 234U/238U activity ratios in water can be used as a tracer for studying changes in groundwater flows and the mixing of waters of different origins under different hydrological conditions.

1. Introduction

Around 13%–14% of Earth’s land surface is characterized by karst features, which most commonly develop in carbonate rocks [1], and ~10% of the world’s population relies on karst aquifers for its drinking water supply [2]. Karst groundwater is highly vulnerable because it circulates through a low-permeability matrix with primary intergranular and fracture porosity, as well as through dissolution channels, conduits which allow groundwater flows that are several orders of magnitude faster than those in the matrix [3]. Karst aquifers show spatially variable rapid infiltration, and their water flow is controlled by heterogeneous permeability. This makes them critically dependent upon hydrological conditions and climate change [4,5]. Although the characterization of water circulation in karst systems is challenging, it is essential for sustainable water management in these areas.
Environmental tracers are commonly used in hydrogeology to investigate the recharge, groundwater flow, and water–rock interactions in karst aquifers [6]. However, because flow paths are complex, classical hydrogeological approaches are sometimes not enough to properly investigate the groundwater hydrodynamics [7]. The use of geochemical and physicochemical parameters in combination with uranium (U) isotopic composition could significantly improve the understanding of complex karst hydrodynamics.
The use of the U isotopic composition has been proven to be very valuable for studying different physicochemical processes in estuarine water [8], seawater [9,10], and continental surface water and groundwater [11,12,13,14]. U isotopes in continental waters can be investigated as a tracing or dating tool for a broad spectrum of hydrological and geological processes [15,16]. U commonly occurs in two oxidation states, U(IV) and U(VI). Under reducing conditions, U exists in the U(IV) oxidation state mainly in the form of insoluble complexes with hydroxides and is very immobile. However, the solubility of U(IV) can increase via complexation with fluoride at low pH or with hydroxyl ions. In oxygenated surface waters, U mainly occurs in the form of the uranyl ion UO22+. It often forms complexes with carbonate and phosphate under near-neutral conditions and with sulphate, chloride, and fluoride at pH < 4. U in the U(VI) oxidation state is highly soluble and mobile [11,17]. In aqueous solutions, the U concentration is controlled by classical thermodynamic parameters such as temperature, pressure, solution composition (pH, redox potential, ionic strength, and occurrence of complex forming ligands), and kinetics of mineral dissolution and sorption processes.
Thorium (Th) is a highly insoluble and immobile element that mostly exists in the Th(IV) oxidation state. The mobility and solubility of Th can be significantly increased only via complexation with organic acids. In natural waters, Th is considered to be a highly particle reactive element and cannot be transported in solutions over a long distance [11,16]. In karst springs, lakes, and rivers, Th normally occurs in siliciclastic detrital material such as clay minerals [18,19]. Regardless of the different solubilities of U and Th, carbonate precipitated from water may also contain some coprecipitated U and detrital Th trapped in the calcite matrix [11,20]. This is relevant in dating applications, where the difference in U and Th concentrations and the U isotopes in rocks are used for correcting the age of carbonate minerals for the effects of detrital contamination [18,19]; these can also be exploited to study water–rock interactions and sources of water mineralization in hydrogeological studies [21,22].
Natural U consists of three long-lived isotopes: 238U (t1/2 = 4.5 billion years), 234U (t1/2 = 245,000 years), and 235U (t1/2 = 0.7 billion years). 238U and 235U are the two parent isotopes of the 238U- and 235U-series decay chains, and the 234U isotope is the longest-lived daughter of all intermediate nuclides of the 238U-series decay chain [15,16]. In a closed system, U-series isotopes (238U and 234U) are in secular radioactive equilibrium and their activities are equal. However, during water–rock interactions, physical and chemical processes can preferentially remove different U isotopes from the system. The secular radioactive equilibrium is then disturbed and the activity ratios of U isotopes are altered [23]. Isotope fractionation effects could be associated with adsorption changes in U isotope speciation or redox chemistry, including microbially mediated U reduction [10].
Percent variations in 234U/238U activity ratios have been reported in natural terrestrial environments [24,25,26]. Natural waters are generally enriched in 234U, and the 234U/238U activity ratios can deviate from the equilibrium by more than 10%. The preferential dissolution of 234U is mainly caused by preferential leaching owing to crystal lattice instability after alpha emission during 238U decay. It can also be caused by the recoil ejection of the 234Th nucleus into the water via the alpha recoil effect or by the etching of alpha recoil tracks [23,25,27].
Variations in 238U/235U ratios are in the permil-level range and have been documented only recently [9,28,29]. The natural variability of more than 0.03% in the 238U/235U ratio for a range of natural materials has been primarily associated with the variable solubility of U in different redox states and with nuclear field shift effects [30,31]. Analyses of U isotopes’ disequilibrium and concentration in surface water and groundwater have been used to provide a signature of a particular groundwater type that can be related to its area of origin, to identify the mixing of waters of different origins, and to provide information about through-flow speeds and directions [11,20,32,33].
The presence and behavior of natural U isotopes in ancient and recent marine environments has been studied widely [9,10,28,31]. However, not much is known about freshwater draining areas with a predominantly carbonate lithology. In such hydrogeological settings, these isotopes have much lower concentrations of 0.02–21.4 µg/L (mean: 0.3 µg/L) [12,13,34], which is analytically challenging. Recently, multi-collector inductively coupled plasma mass spectrometry (MC-ICP-MS) has been used to improve precision because it affords high absolute sensitivity and simultaneous detection of ions compared with quadrupole-based ICP-MS and achieves a higher sample throughput compared with thermal ionization mass spectrometry (TIMS). Therefore, MC-ICP-MS has become one of the preferred tools for precise measurements of U and Th isotopic ratios for low-abundance isotopes and mass-limited samples [35,36]. However, a careful sample preparation procedure is needed prior to mass spectrometry analysis to separate U and Th isotopes from the sample matrix, reduce other possible interferences, improve the detection limit, increase the sensitivity, and enhance the accuracy of the result, especially for low concentrations.
The use of U isotopes has several benefits over traditional geochemical techniques. Uranium is an abundant trace element in natural waters in areas with a predominantly carbonate lithology [8,11,17], therefore it can be used as an additional tracer to gain more knowledge and understanding of complex karst hydrodynamics. Its isotopic composition varies in such an environment because of the U several processes that cause isotope fractionation effects [9,23,24,25,26,27,28,29]. Additionally, isotope ratios can be easily measured at high levels of precision and accuracy, which is important for U isotope measurements in karstic waters where U concentrations are low [34,35,36].
The present study aimed to provide a baseline for U isotopes under the diverse hydrological conditions in the karst aquifer of the Ljubljanica river catchment (Slovenia) and to explore the potential of using U concentrations and isotope compositions in springs and streams as alternative tracers to classical ones (i.e., elemental ratios, physicochemical parameters, and alkalinity) to analyze the sources of water and solutes and water mixing under different flow regimes in this complex groundwater system. We analyzed U and Th concentrations and U isotope ratios in bedrock from different lithological units as well as the spatial and seasonal variability of U concentrations and isotope compositions in karst springs and sinking streams in the central and northern part of the Ljubljanica catchment to obtain additional information on water sources that could not be determined using classical geochemical approaches.

2. Materials and Methods
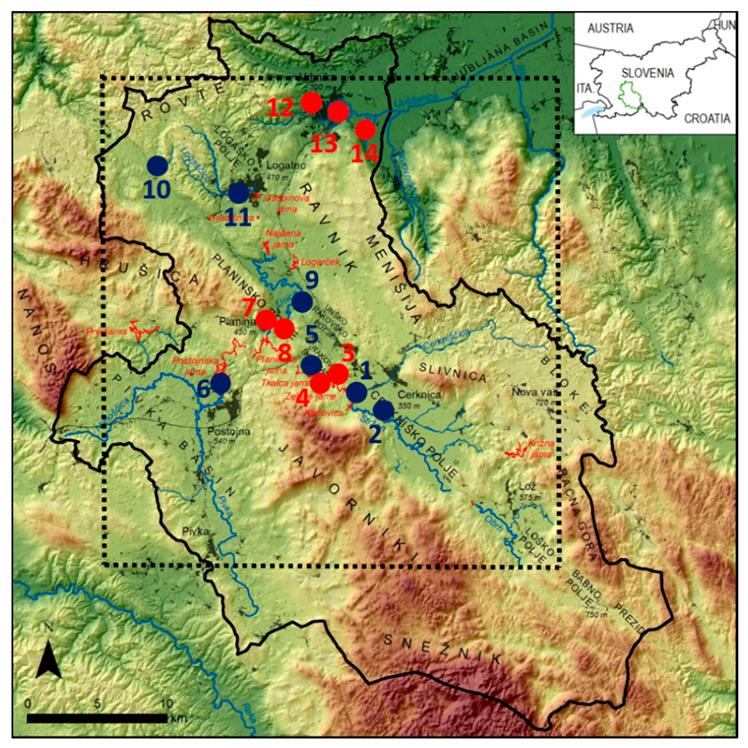
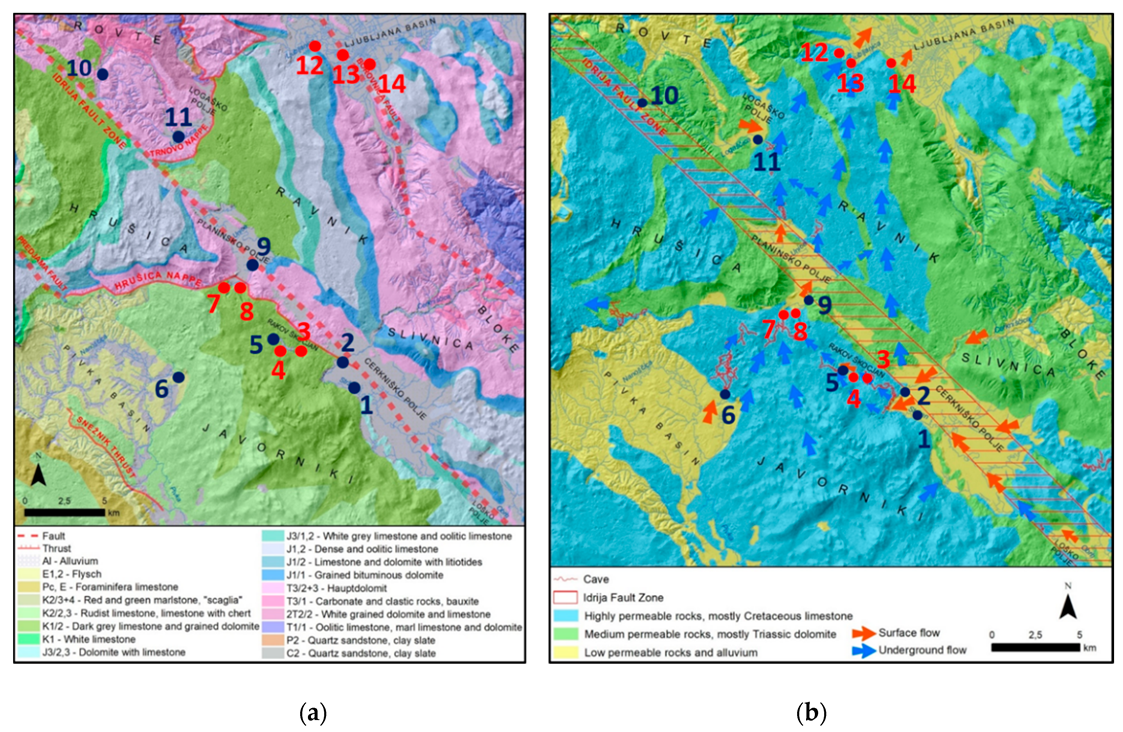
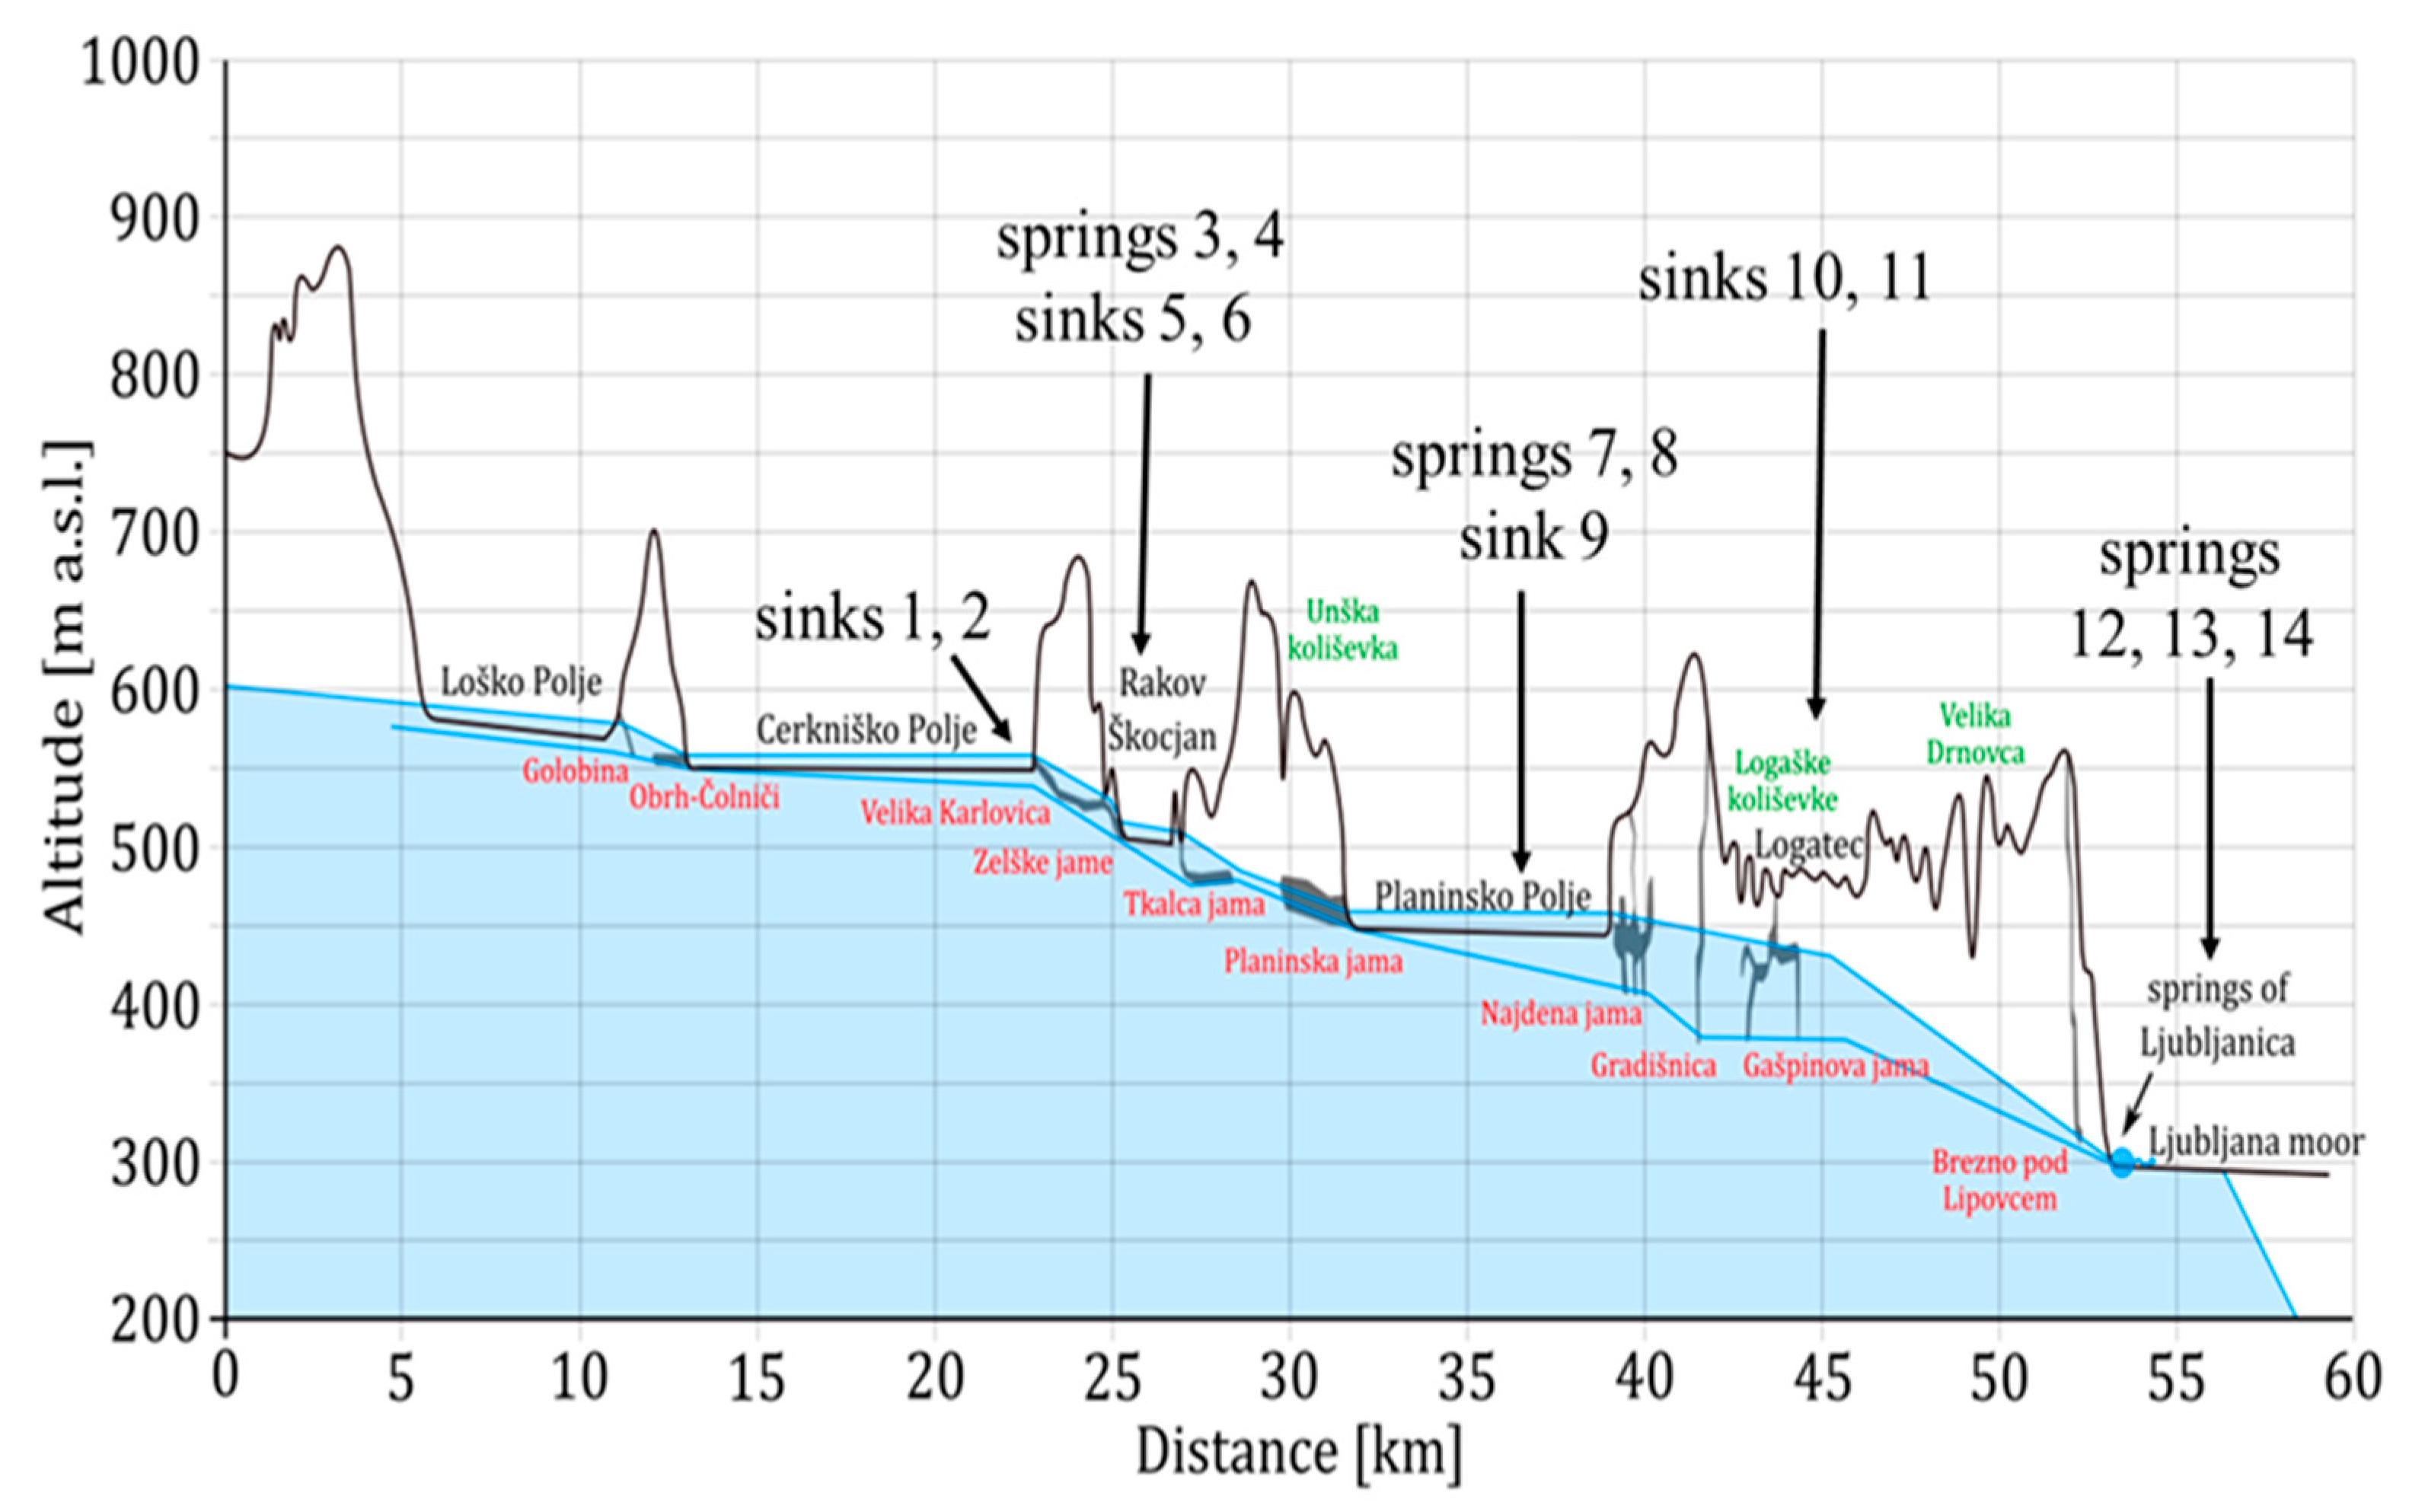
2.1. Study Area

The study area has been described in detail by Rusjan et al. [37] Briefly, the karst aquifer of the Ljubljanica River catchment is located in central and southern Slovenia and covers an area of ~1200 km2 (Figure 1). The average altitude gradually decreases from ~1800 m a.s.l. in the south to ~300 m a.s.l. in the northern part of the aquifer with the main Ljubljanica springs. The mean annual precipitation correspondingly decreases from >2000 mm to ~1400 mm, respectively. The catchment comprises a densely vegetated karst surface and a series of karst poljes including the periodically flooded Cerkniško and Planinsko poljes (Figure 1 and Figure 2). The prevailing land use types are forest and semi-natural areas, with no intensive agriculture or urbanization.
The Ljubljanica River catchment mainly consists of karstified Mesozoic limestone and dolomite (Figure 2, [40,41]), and poljes are covered with Quaternary alluvial sediments. In the western and north-western part of the aquifer at Pivka basin (site 6), north of Planinsko polje (site 9), and in the sub-catchments of the Hotenjka and Logaščica rivers (sites 10 and 11), some shales, marls, and quartz sandstone can be found. The depth of the unsaturated zone can reach up to several hundred meters, and the carbonate rocks are more than 1000 m thick [42]. The neo-tectonic strike-slip Idrija fault zone stretches across the study area in the Dinaric direction (north-west to south-east). Along the fault system, a chain of four poljes with several short sinking streams has developed.
The two poljes investigated in the study are the Cerkniško polje at an altitude of ~550 m a.s.l. and the Planinsko polje at an altitude of ~450 m a.s.l. (Figure 1, Figure 2 and Figure 3 and Table 1) Cerkniško polje, the larger of the two, represents the first (highest) level of the studied system and is bordered on the north by Upper Triassic dolomite (“Hauptdolomite”) and Jurassic limestone and on the south mainly by Cretaceous limestone with some dolomite (Figure 2). The south-eastern part of Cerkniško polje is regularly covered by an intermittent lake, which is at least partly present during most of the year. The two main sinking streams here are Stržen (sampling site 1), which mainly drains the Cretaceous limestone area with some dolomite of the Javorniki plateau south of the Cerkniško polje, and Cerkniščica (site 2), which mainly drains the late Triassic and Jurassic dolomite with some limestone at the north and north-eastern sides of the Cerkniško polje. The groundwater flows from the Cerkniško polje partly toward the north-west to the Rak stream and Planinsko polje (second and third level of the study area, respectively). It also flows partly to the north through a mixed limestone and dolomite massif with some minor occurrences of siliciclastic sediments in the western part toward the main Ljubljanica springs (sites 12 and 13) and the spring of the short tributary of Ljubljanica River (Bistra, site 14) at the southern edge of Ljubljana Basin at an altitude of ~300 m a.s.l.
At the second level (Figure 3), at ~510–520 m a.s.l., the Rak stream with its two main springs Mali most (site 3) and Kotliči (site 4) collects water from the Cerkniško polje and Javorniki plateau (Figure 1 and Figure 2) and sinks at Veliki most (site 5). At a similar altitude, ~6.8 km west-northwest from the sink at site 5, the Pivka River sinks into the Postojna cave (site 6). The river Pivka and its tributaries drain the Eocene flysch area in the west and Cretaceous limestone south-west and south of the polje and flow for a few kilometers across the Pivško basin that is covered with alluvial stream sediments.
Planinsko polje at ~450 m a.s.l. represents the third level of the study area. The sinking river Unica has two main springs: The Unica Spring (site 7), which emerges from the large Planina cave system that is connected to the Postojna cave and Malenščica (site 8) ~800 m east-northeast from site 7. The water of the Malenščica spring emerges from one main and some smaller intermittent orifices at elevations between 448 and 470 m a.s.l. The Unica River (site 9) was sampled ~300 m downstream of the confluence with Malenščica stream. The total discharge of the Unica River is 1–100 m3 s−1, with an average of 21 m3 s−1 [43].
The sinking rivers Hotenjka (site 10, 545 m a.s.l.) and Logaščica (site 11, 475 m a.s.l.) drain the area with mixed lithology, which is dominated by Triassic dolomite with some limestone and some marls, shales, and quartz sandstone in the western part of the Ljubljanica catchment (Figure 2).
The main springs of the Ljubljanica River emerge along the contact of non-carbonate and carbonate rocks at the southwestern border of the Ljubljana Basin (Ljubljana Marshes [42,44]) at ~300 m a.s.l. The two main springs are Močilnik (site 12) and Retovje (site 13). In this area, the Bistra karst spring (site 14), a tributary of Ljubljanica River, was also sampled.
The underground connections and hydrogeology of the Ljubljanica aquifer have been studied extensively [42,45,46,47,48]; however, they are difficult to describe because the flow directions change with the groundwater level and discharge [47]. Rusjan et al. [37] estimated the mean transit time (MTT) and the fraction of young water in the Ljubljanica aquifer for the 2016–2017 period based on the isotopic composition of karst water and precipitation. The MTT ranged from ~4 months at sites 3 and 6 up to 9 months at site 8. Further, the mean fraction of young water for the entire catchment was 0.28; in other words, ~28% of the water in the catchment was younger than 2.3 months.

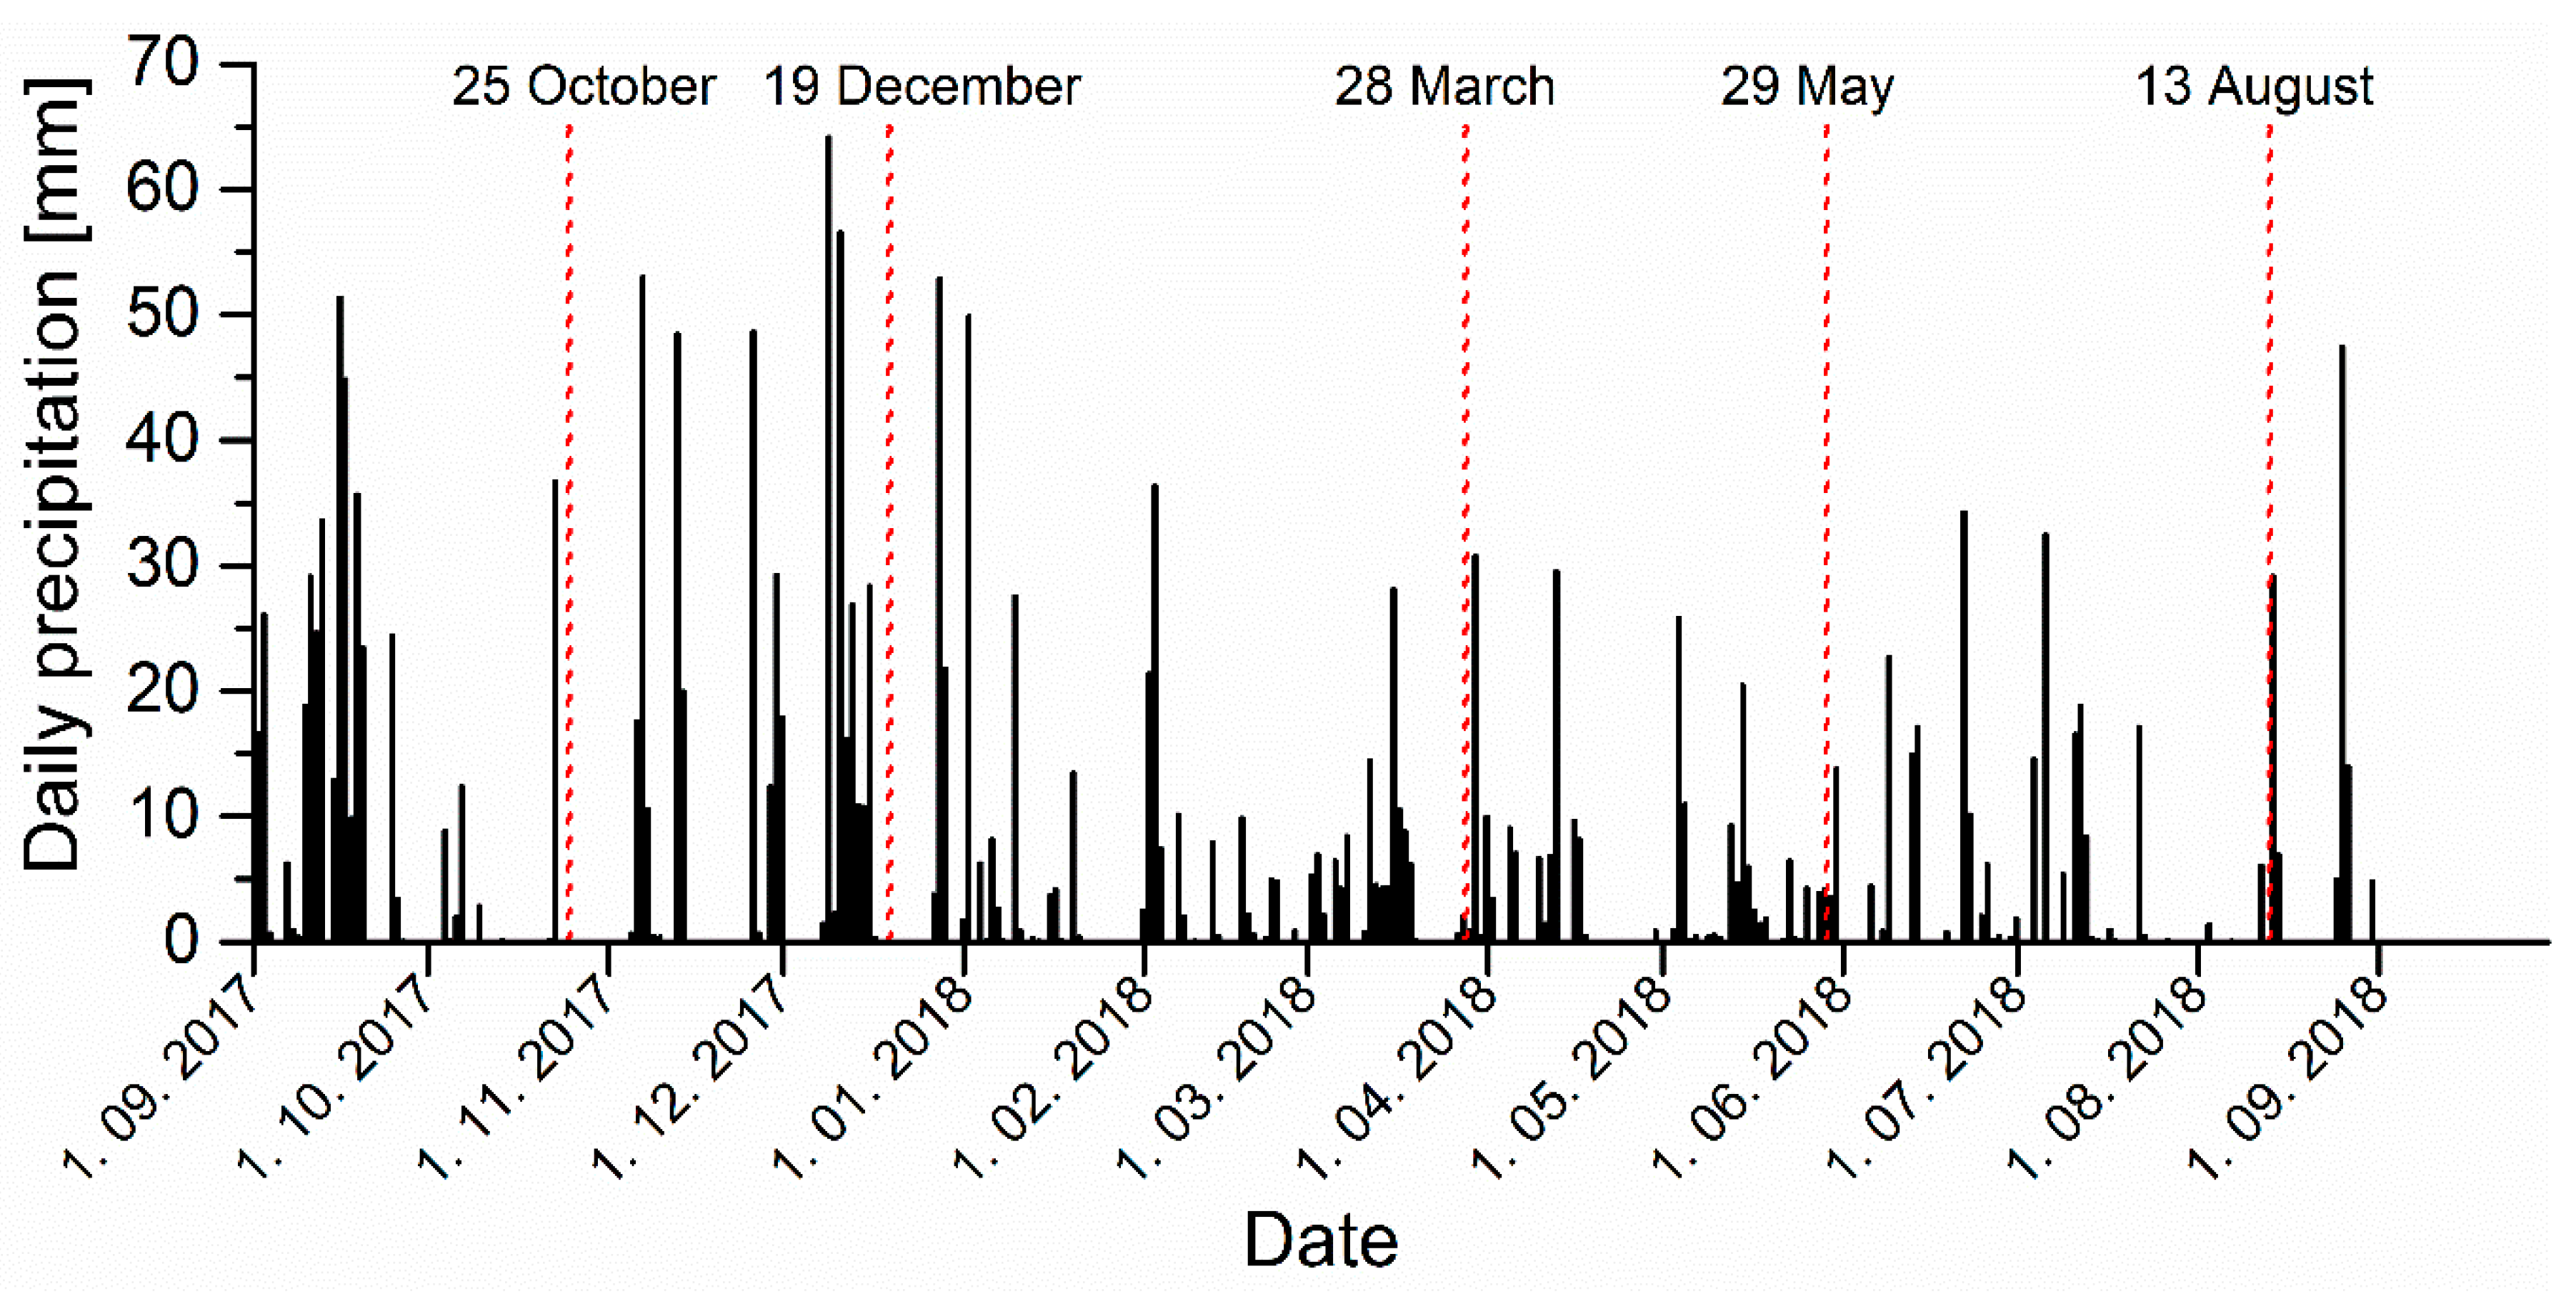
2.2. Sampling and Sample Preparation

Water samples were collected at 14 sites: seven main springs and seven sinking streams or sinks (where accessible). All main springs and tributaries were analyzed (Figure 1 and Figure 2).
Sampling was performed in five campaigns: in October 2017 at nearly average water level (discharge), in December 2017 and March 2018 at high discharge, and in May and August 2018 at low discharge. Figure 4 shows the daily precipitation in the sampling period at Postojna, a regular monitoring station of the hydrometeorological network of the Slovenian Environment Agency. The station is located ~2 km north of the sampling site 6.
Water samples at three sites were collected only four times: sites 1 and 2 were flooded in October 2017 because of the intermittent character of Cerknica Lake and because the Logaščica stream (site 5) dried out in August 2018.
The water temperature (T) and pH were measured in the field using the Hydrolab MS5 probe. The conductivity and redox potential were measured using the Ultrameter II 6 PFC (Myron Company). Discharge data were obtained from the Slovenian Environment Agency’s regular hydrological monitoring program.
The water samples were stored in prewashed high-density polyethylene (HDPE) bottles. Samples for analyzing the alkalinity (two 60-mL aliquots) were filtered on-site through 0.2-µm membrane filters (Sartorius Minisart 16534K) and stored in 30-mL HDPE bottles. Samples for metal analyses were filtered on-site too, through 0.45-µm pore size filters (Minisart 16555K) and acidified with concentrated supra-pure HNO3 (Merck). All water samples were stored in the refrigerator at 4 °C until analysis. Another 1 L sample was collected at each sampling site for the analysis of U isotopes. These samples were vacuum-filtered through 0.45-µm pore size Millipore filters and acidified with concentrated supra-pure HNO3 to pH 2 in the laboratory within 12 h after sampling.
Bedrock samples were manually obtained at randomly selected outcrops of prevailing rock types in the catchment areas of respective streams near sampling sites 1, 3, 4, 5, 6, 7, 8, 12, and 14. The samples were oven-dried (60 °C), crushed in brass mortar to a rock size below ~5 cm, further crushed with a gyratory crusher (Retsch BB50) and sieved below 1 mm, and finally milled in a vibrating disk mill (Siebtechnik) and sieved below 125 µm for X-ray fluorescence (XRF) and X-ray diffraction (XRD) analyses.

2.3. Physiochemical and Chemical Sample Analyses

2.3.1. Rock Samples

Elemental analysis of rock samples was performed on melted disks by XRF (Thermo Scientific ARL Perform’X Sequential XRF, 60 kV, 40 mA) with OXAS software. The disks were prepared by mixing ignited pulverized sample and Fluxana powder (FX-X50-2, Lithium tetraborate 50%/Lithium metaborate 50%) in 1:10 ratio to decrease the melting temperature. The mixture was melted in the furnace (Claisse, The Bee Electric Fusion). To avoid gluing the melt in the platinum vessel, a few drops of LiBr were added to the sample-Fluxana mixture. UniQuant 5 software was used for raw data treatment. The calculated analytical errors were <0.1% for Ca; <6% for Mg, Al, and Si; and <15% for Na and K.
Mineralogical analysis was performed on pulverized samples with X-ray diffraction (XRD; Empyrean PANalytical X-Ray Diffractometer, Cu X-Ray source) in 0.013° steps from angles of 4°–70° under clean room conditions. Mineral and standard-less Rietveld refinement analysis were performed using X’Pert Highscore plus 4.1 software on XRD data.
The share of the (non)carbonate fraction was determined by calcimetry (OFITE calcimeter, OFI Testing Equipment Inc., USA) with an analytical error of <5%.

2.3.2. Water Samples and Thermodynamic Modelling

The total alkalinity was measured by Gran titration [49] with a precision of ±1% within 24 h after sample collection.
Major elements (Ca, Mg, K, Na, Si, and Al) were determined by an Agilent 7900x ICP-MS (Agilent Technologies, Tokyo, Japan). For the calibration, single standard solutions of 1000 mg/L obtained from Merck (Darmstadt, Germany) were used. Rh (Merck) was used as an internal standard. For the accuracy check, two surface water reference materials, SLRS-5 (National Research Council Canada, Ottawa, ON, Canada) and SPS-SW1 (Spectrapure Standards, Manglerud, Norway), were analyzed multiple times during the measurements. The recoveries of all elements varied between 97% to 102%, and the repeatability was better than 5%.
Thermodynamic computations (PHREEQC) were used to calculate the HCO3 concentration and saturation indices of calcite (SIcalcite) from the pH, total alkalinity, and temperature as inputs [50]. Th Pearson correlation coefficients between measured parameters were calculated using the Origin 9 Pro program.

2.4. U and Th Sample Analysis

All chemical procedures and measurements were performed under clean room conditions. Chemical reagents and acids were prepared with deionized water (>18 MΩ cm, Millipore Milli-Q-Plus) and with clean laboratory equipment which was soaked overnight in 10% HNO3. The analytical procedures used for U and Th isotopes in water and solid samples have been reported previously [51,52,53] and are briefly described below.
In carbonate rock samples, the determination of U and Th isotopes was performed. After the samples were ground to a fine powder, an aliquot of 1 g of carbonate powder was precisely weighed. To extract mainly the carbonate-associated U and Th fractions from the residual phase, a soft leaching procedure was applied [51]. Dissolution was performed in a centrifuge tube where 15 mL of 1 M NaAc in 25% HAc (pH 4) was added. The samples were then shaken for 2 h at room temperature. After shaking, the samples were centrifuged and filtered through 0.45-µm pore size Millipore filters and washed two times with an additional 5 mL of deionized water. The dissolved residue was then dried down on a hotplate and re-dissolved in 5 mL of 3 M HNO3 to be prepared for column chromatography.
To test the removal of non-carbonate fraction contamination in carbonate leach samples, the total dissolution of the samples was performed [52]. The samples were digested with two dissolution techniques, by mineral acids and by lithium borate fusion, owing to the difficulties faced in achieving good recovery for Th with acid digestion. For sample digestion by mineral acids, 1 g of carbonate powder and 10 mL of HNO3 were added in a Teflon beaker. The mixture was then placed on a hot plate at 110 °C. After the HNO3 evaporated, a mixture of 10 mL of HNO3, 10 mL of HF, and 10 mL of HClO4 was added at 200 °C to dissolve the sample. The last step was repeated at least two times to ensure complete dissolution. The dissolved residue was dissolved in 5 mL of 3 M HNO3 to be prepared for U column chromatography. For sample digestion with lithium borate fusion, 1 g of precisely weighed carbonate samples and ~4 g of lithium borates were added in a platinum crucible. Fusion was performed in a Claisse LeoNeo furnace at 1050 °C for 23 min. After fusion, the glass was poured in 80 mL of stirred deionized water in a Teflon beaker. The content was then transferred to a glass beaker and washed with the additional 20 mL of deionized water. The glass beaker with the fused sample was stirred and heated to 125 °C, and 10 mL of concentrated HNO3 was added to dissolve the lithium borate glass. After the glass was dissolved, the beaker was left on the hot plate with continuous stirring until the solution volume was reduced to 50 mL. This resulted in a 2–3 M HNO3 solution. Then, the solution was cooled to 90 °C and 1 mL of 0.2 M polyethylene glycol solution (PEG) was added dropwise to remove silicates. Stirring was continued for another 1 h, after which the beaker was covered and left overnight to allow the precipitate to form and settle. The remaining solution was filtered before loading to the column for Th separation.
U and Th were separated by the combination of two extraction chromatographic resins, uranium and tetravalent actinide (UTEVA) and tetravalent actinide (TEVA) resin, both of which were precleaned by soaking overnight in 6 M HNO3 and then washed several times with deionized water. Columns were preconditioned by adding 2 mL of UTEVA resin to the column and by washing with 10 mL of deionized water, 5 mL of 1 M HNO3, and 10 mL of 3 M HNO3. Leached samples prepared in 3 M HNO3 were transferred onto an arranged tandem setup, where the preconditioned TEVA column was at the top and the preconditioned UTEVA column was at the bottom. Th was retained on the TEVA separation column and U was retained on the UTEVA separation column. The columns were then washed with 30 mL of 3 M HNO3. After washing, the columns were separated and treated independently. U separation on the UTEVA resin was performed in the same way as was done for the water samples described below. Th was eluted from the TEVA resin to a clean glass beaker with the consecutive addition of 20 mL of 9 M HCl and 5 mL of 6 M HCl. The eluate was evaporated to dryness and cleaned three times with a mixture of HNO3 and H2O2. U and Th in the total digestion samples were separated independently, with U on the UTEVA column and Th on the TEVA column, by the same procedure as that described above.
For the determination of U isotopes in water samples, U was coprecipitated with Fe(OH)3 [53]. In an aliquot containing 350 mL of water, 1 mL of FeCl3 solution (5 mg/mL) was added and the pH was increased to 9 by adding a concentrated ammonia solution. The precipitate was separated by centrifugation and washed with deionized water to neutral pH. The U separation procedure was based on using UTEVA extraction chromatographic resin, which was precleaned by soaking overnight in 6 M HNO3 and then washed several times with deionized water. The samples were dissolved in 5 mL of 3 M HNO3 after U preconcentration and transferred onto a preconditioned UTEVA column. This was prepared by adding 2 mL of UTEVA resin to the column and washing with 10 mL of deionized water, 5 mL of 1 M HNO3, and 10 mL of 3 M HNO3. After the sample was loaded, the column was washed with 20 mL of 3 M HNO3, 5 mL of 9 M HCl, and 25 mL of 5 M HCl with 0.5 M oxalate. U isotopes were eluted with 15 mL of 1 M HCl in a clean beaker, and the eluate was evaporated to dryness. To destroy any possible organic residue that might co-elute from the resin, the dry residue was digested three times with a mixture of HNO3 and H2O2 before measurements.

2.4.1. U and Th Concentration Measurements

U and Th concentrations were measured to determine the concentration of selected elements in unknown samples and to assess the concentration in diluted sample fractions for selecting appropriate dilution factors for the MC-ICP-MS measurements of isotope ratios. We also measured the concentration to assess impurity levels in blank samples, which were treated the same way as samples.
The exact U concentrations in water samples were determined by triple-quadrupole inductively coupled plasma mass spectrometry (ICP-QQQ). Aliquots of 5 mL U water samples were measured in 2% HNO3 using an Agilent 8800 Triple Quadrupole ICP-MS (Agilent Technologies, CA, USA) by following a measurement protocol that differed slightly from that described elsewhere [54]. U standard solutions and samples were introduced into the ICP under wet plasma conditions and in no-gas mode. Interference correction and external calibration were performed using the U standard reference material SRM-3164 (National Institute of Standards & Technology, Gaithersburg, MD, USA).
After the dissolution of carbonate rock samples, U and Th concentrations were measured by using ICP-QQQ.

2.4.2. U Isotope Measurements

U isotope ratios were measured using a Nu plasma II (Nu Instruments Ltd., Wrexham, UK) MC-ICP-MS with the high-efficiency Aridus IITM (Cetac Technologies, Omaha, NE, USA) sample introduction system. The instrument setup is described in greater detail in Rovan et al. [55]. The instrument mass bias was corrected with an external standard-sample bracketing method. The measured U isotope ratios were calibrated against the corresponding U isotopic standard IRMM-184 (European Commission - JRC, Institute of Reference Materials and Measurements, Belgium) that had been measured before and after the sample measurement. The standards and samples were diluted with 2% HNO3 to obtain a constant concentration for isotopic measurements. The measurements were corrected for instrumental biases and chemical blanks, where the uncertainty was estimated by following the procedure described in Rovan et al. [55] The total process blanks for U isotope ratios ranged from 0.08 ng to 0.28 ng. The procedural blanks were negligible compared to the amount of U analyzed in samples. U isotope ratios are determined relative to the IRMM-184 standard and are presented in the delta notation (Equation (1)):
δ 238 U   in   = [ ( U 238 / U 235 ) s a m p l e ( ( U 238 / U 235 ) ) s t a n d a r d 1 ] × 1000 ,
and recalculated to the δ238UCRM-112a values to assure comparability with previously published data [56].
U isotope ratios are also presented as 234U/238U activity ratios (Equation (2)), which are calculated from the corrected isotope ratios by using the decay constants (λ234 and λ238) reported in Cheng et al. [57]:
234 U / 238 U   activity   ratio = λ 234 λ 238 × ( U 234 U 238 ) c o r r e c t e d .
The reported uncertainties are derived from the acquired data and are shown as 2s, where s is the standard deviation.
The long-term analytical precision was assessed by measurements of the U isotopic standard (IRMM-184) at 5 ng/mL concentration over a period of 15 months. The mean values of 235U/238U and 234U/238U are (7.2622 ± 0.0049) × 10−3 and (5.314 ± 0.017) × 10−5, respectively. The measured values are in agreement with certified reference values [56]. The quality of the results was expressed in terms of the expanded uncertainty, where the main source of uncertainty is the uncertainty of the certified standard.

3. Results

3.1. Bedrock Composition of Ljubljanica River Catchment

Table S1 shows the results of all chemical, mineralogical, and isotopic analyses of samples, and Table 2 lists essential data on the chemical and mineral compositions.
Apart from the sample collected at site 14 (which contained dolomite with some calcite), all samples contained limestone with low-Mg calcite as the predominant mineral. The share of non-carbonate mineral fraction ranged from <1 wt% in dolomite (site 14) to 7.2 wt% for limestone collected at site 8 (Table 2). In all samples, traces of quartz and some unidentified clay minerals were detected.
The total U concentrations in the bedrock samples (Table S1, Figure 5) varied in the bulk samples from 1.02 to 4.88 µg g−1, in the leached fraction (representing operationally defined carbonate fraction) from 0.74 to 3.42 µg g−1, and in the residual fraction (non-carbonate, detrital phase) from 0.28 to 2.37 µg g−1 of the total sample mass. The residual fraction was calculated as the difference between the bulk concentration and the leached fraction. The Th concentrations in rocks are much lower compared to the U concentrations; they range from 16.7 to 349 ng g−1 in bulk samples, from 6.7 to 178 ng g−1 in leached samples, and from 1.16 to 173 ng g−1 of the total sample mass in residual fraction. The activity ratio of 234U/238U varied from 0.96 to 1.03 in bulk rocks, from 1.01 to 1.04 in carbonate fraction, and from 0.84 to 1.02 in non-carbonate residue. The δ238U values ranged between −0.59‰ and 0.15‰ in bulk samples, −0.99‰ and −0.51‰ in carbonate fraction, and −3.46‰ and 0.73‰ in non-carbonate fraction.

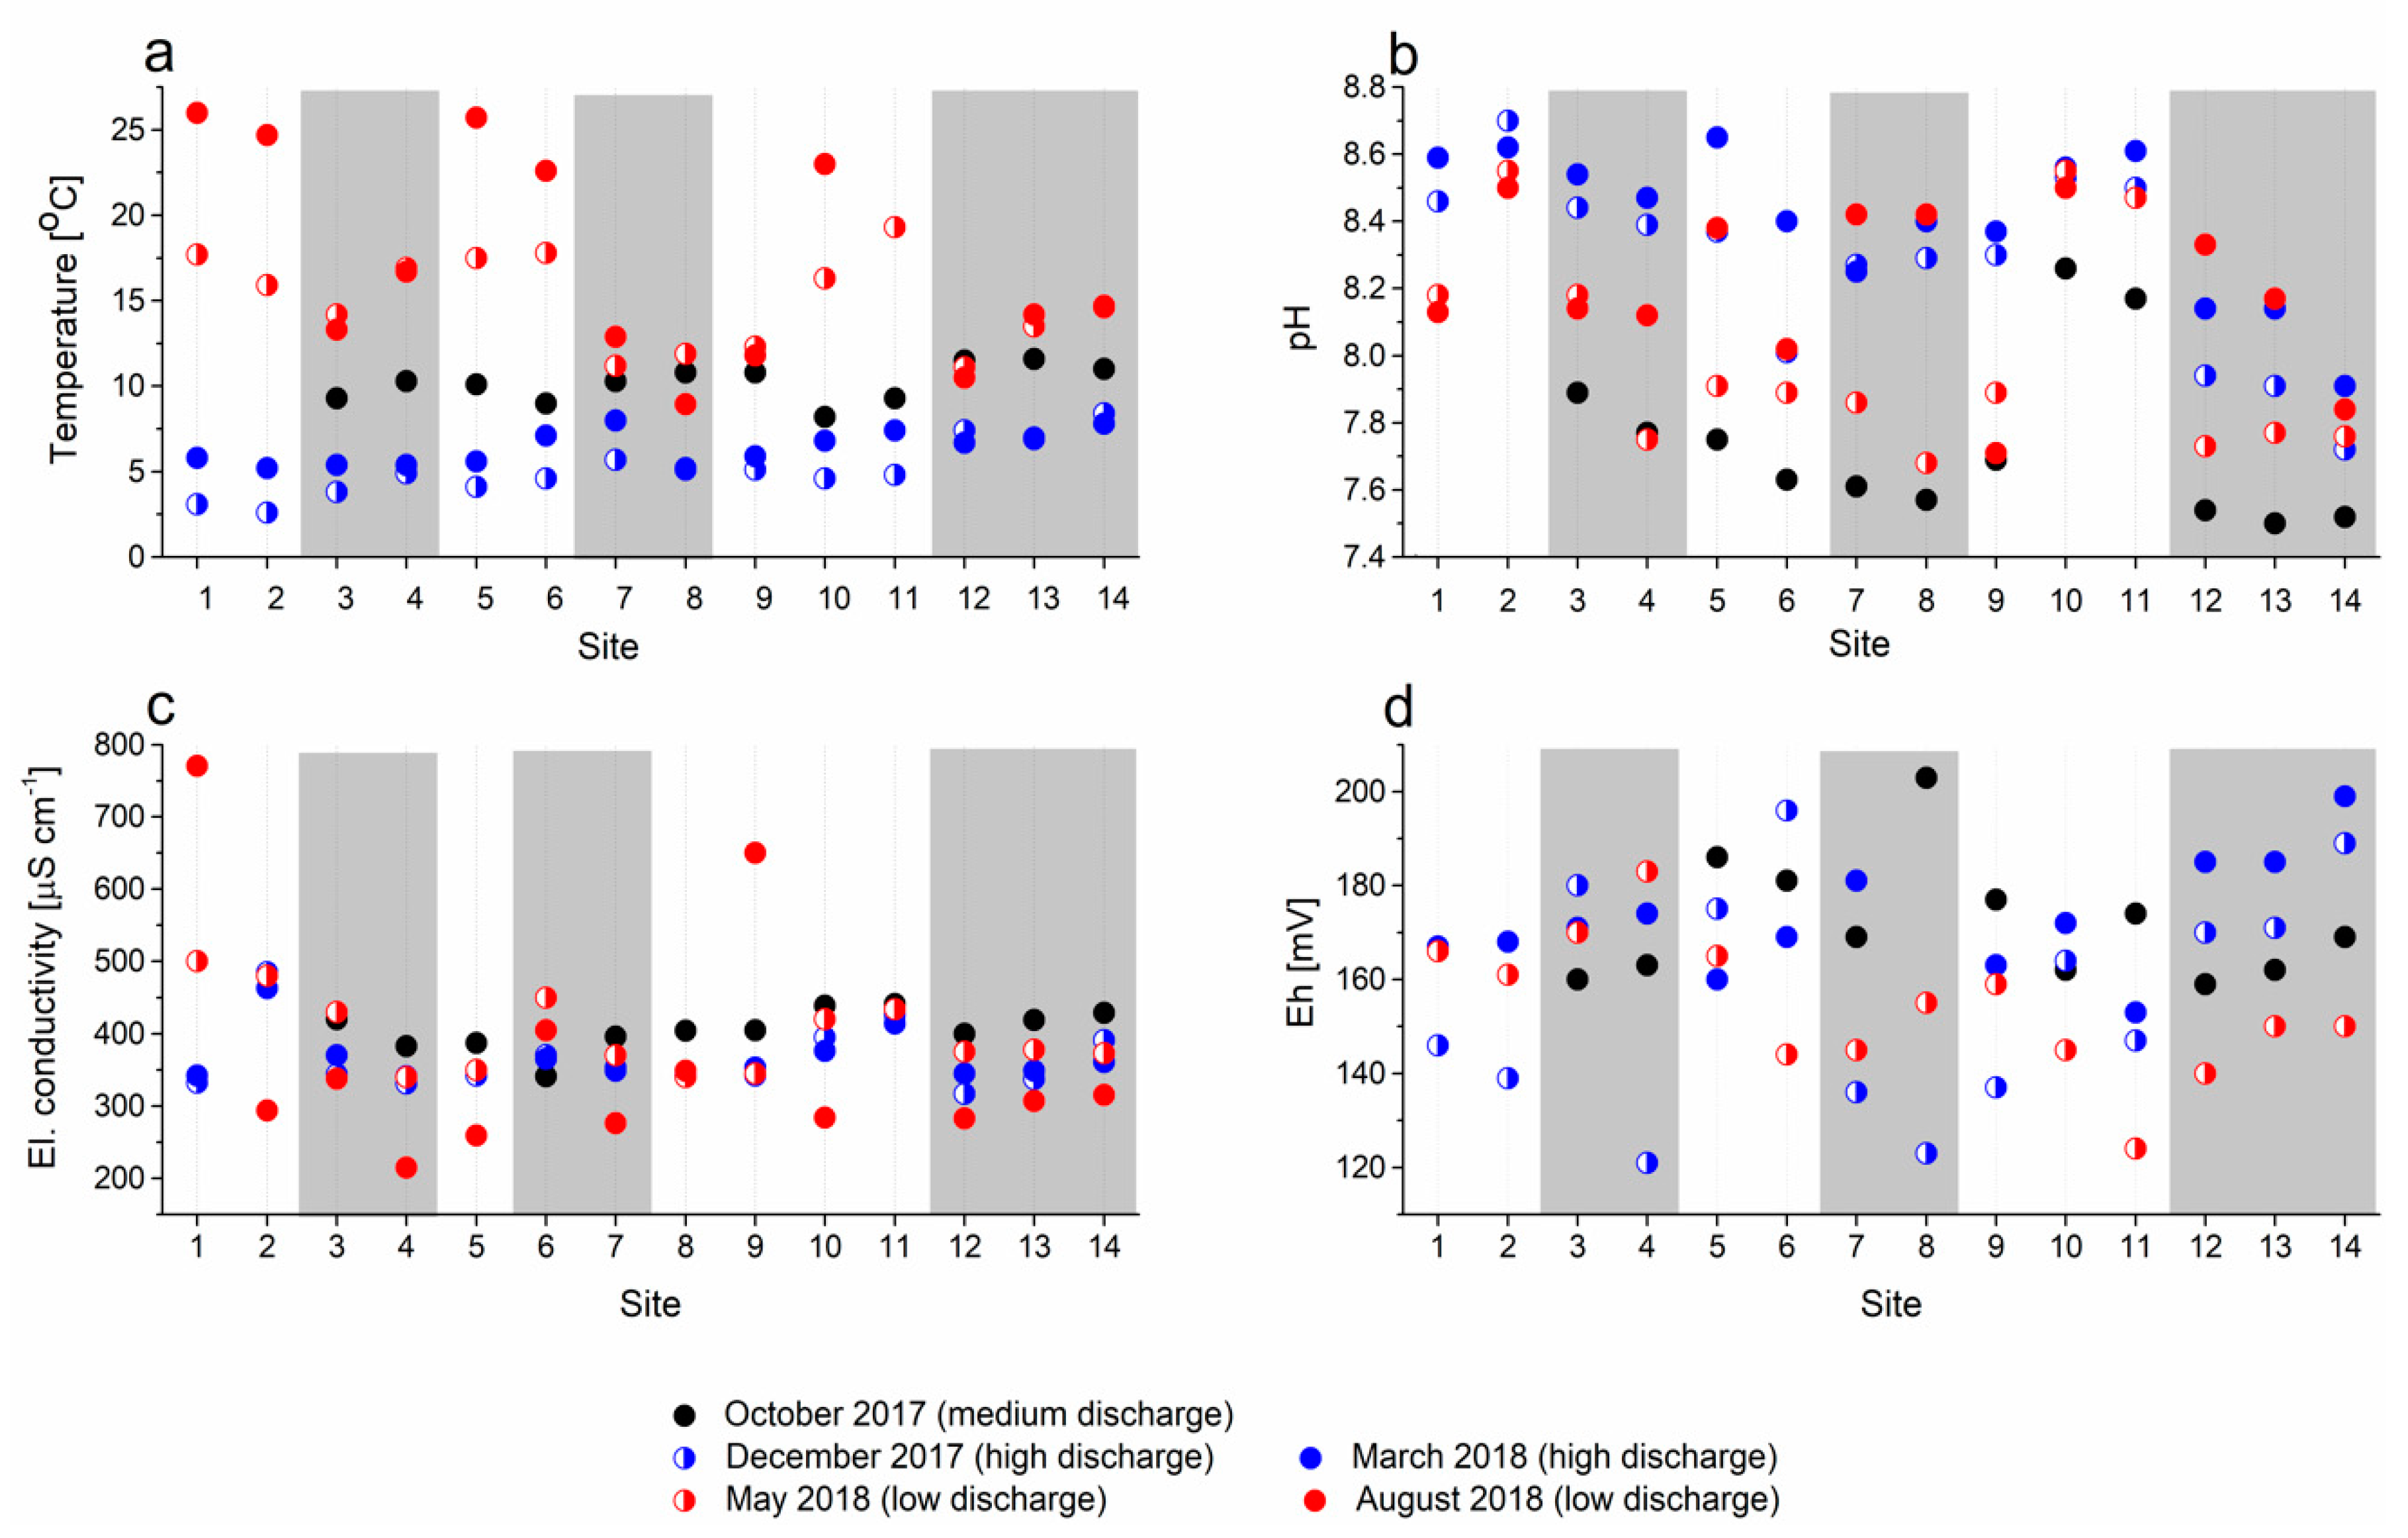
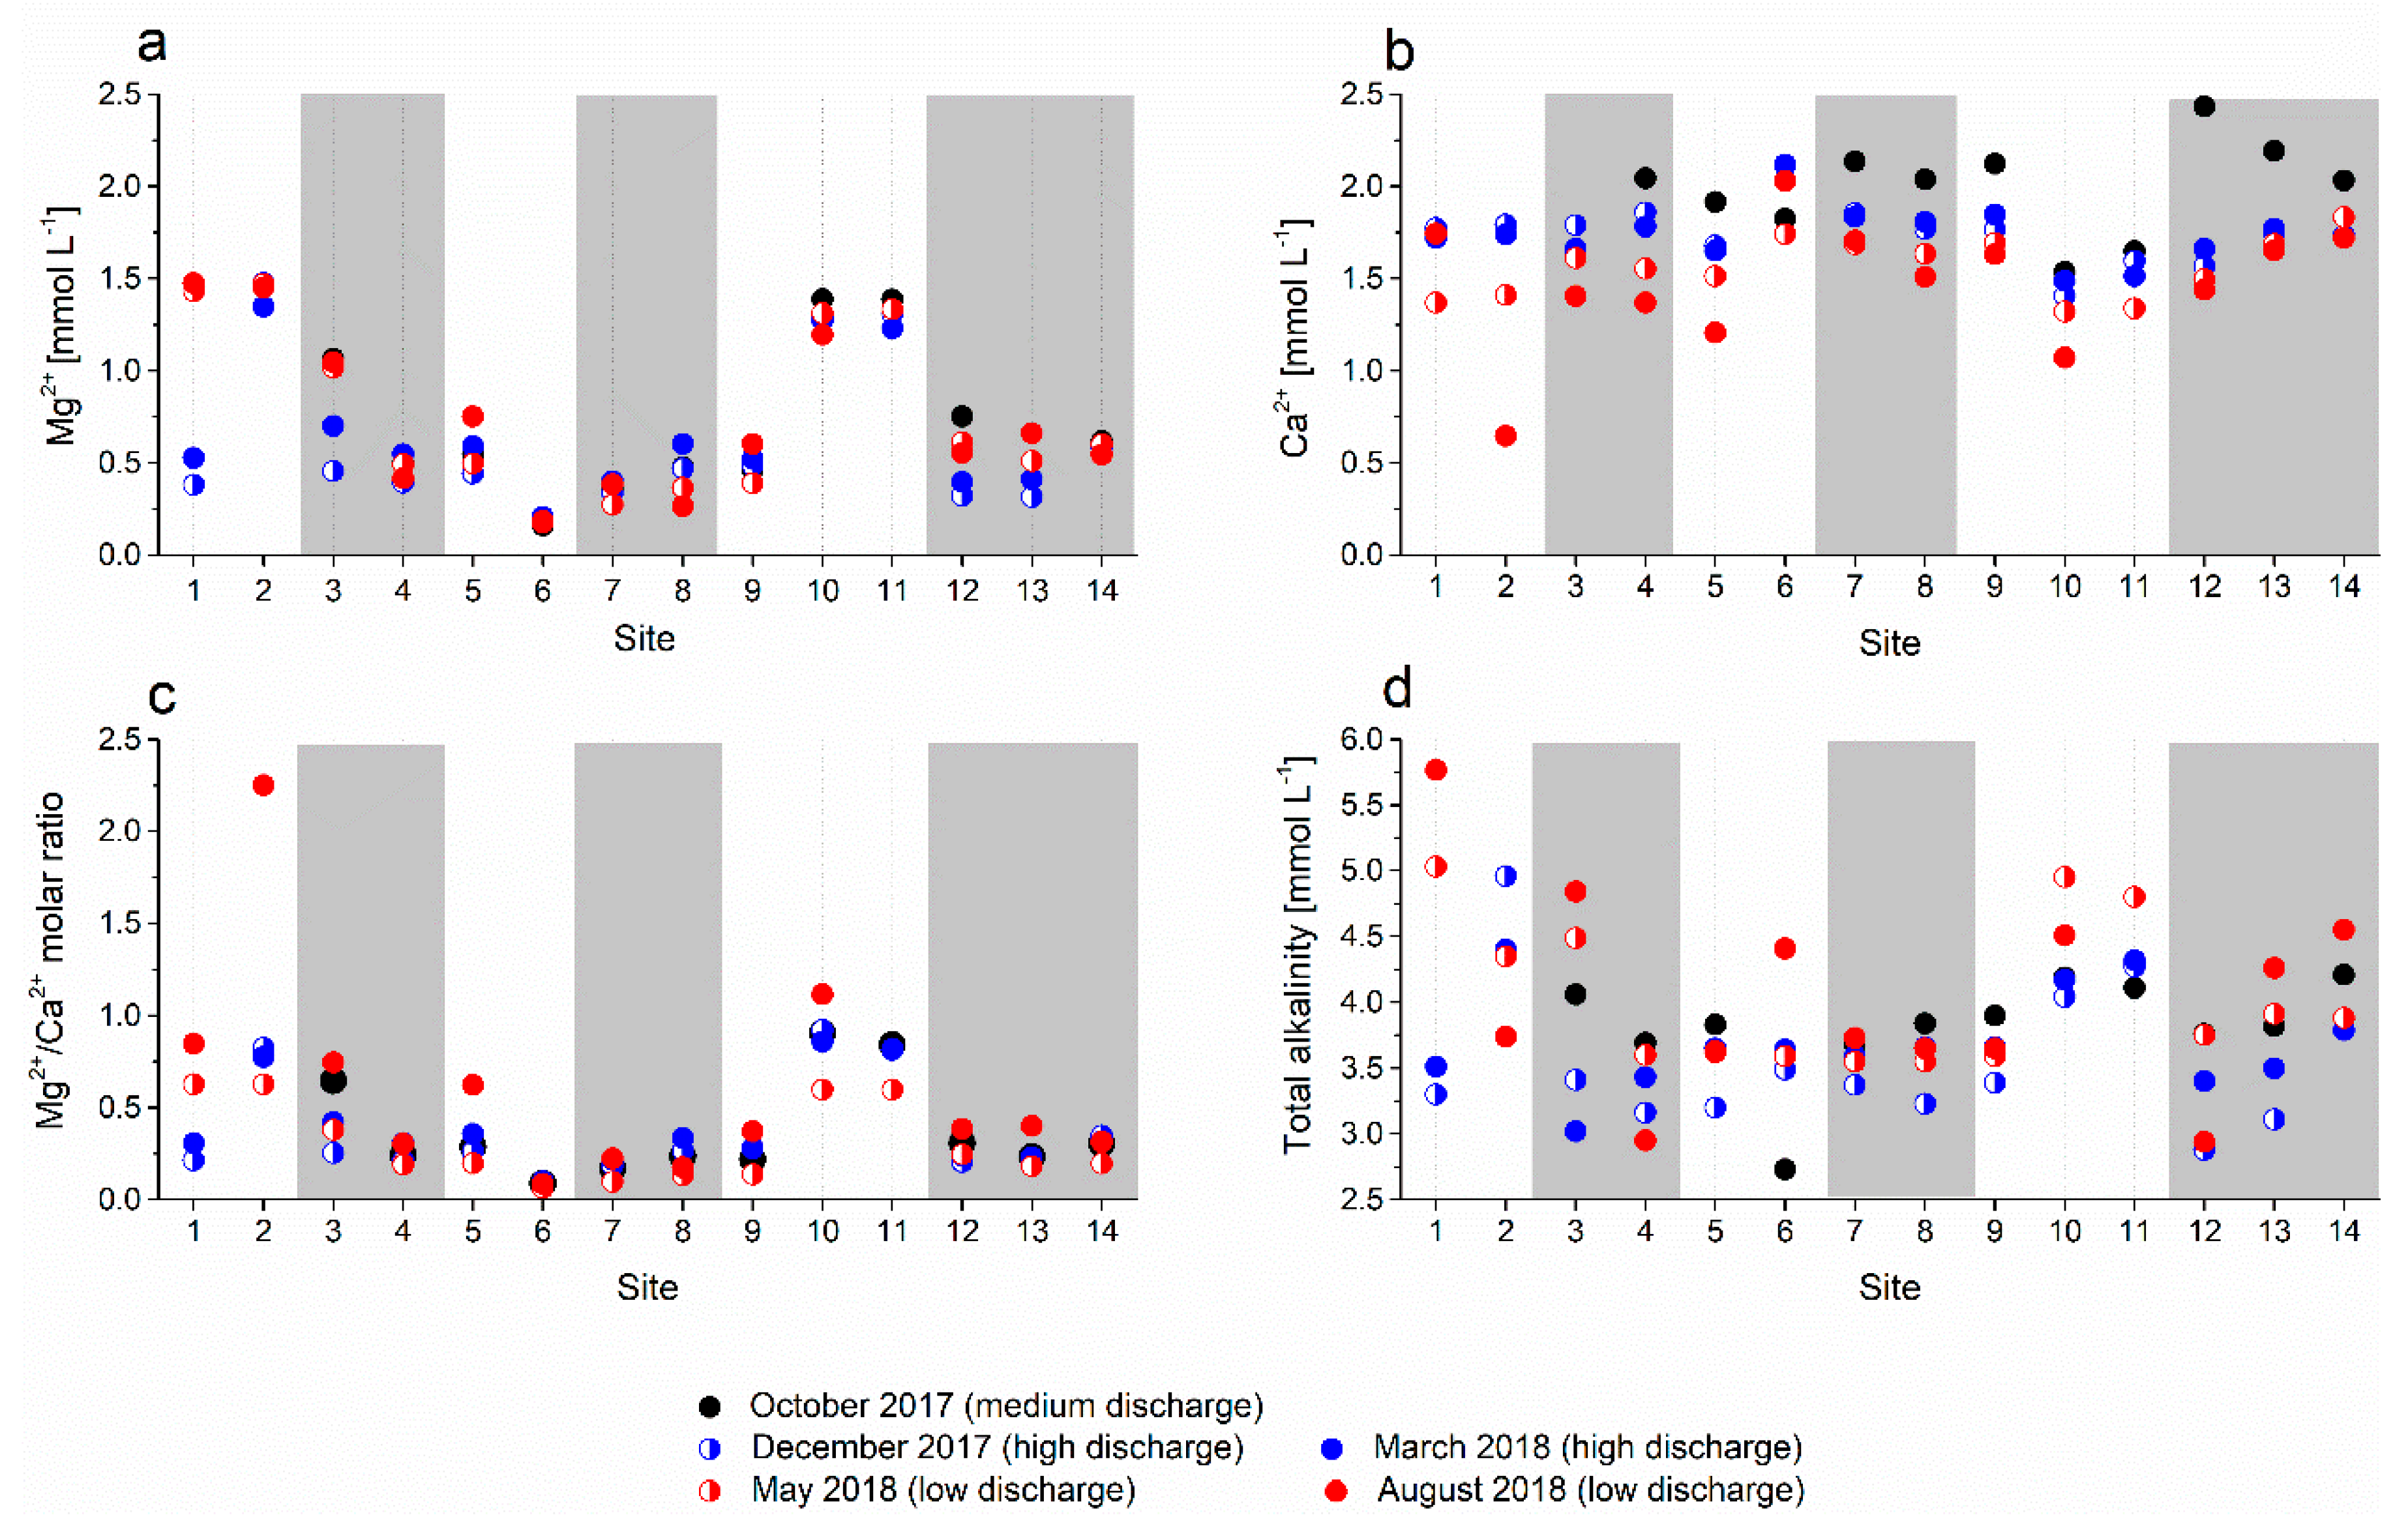
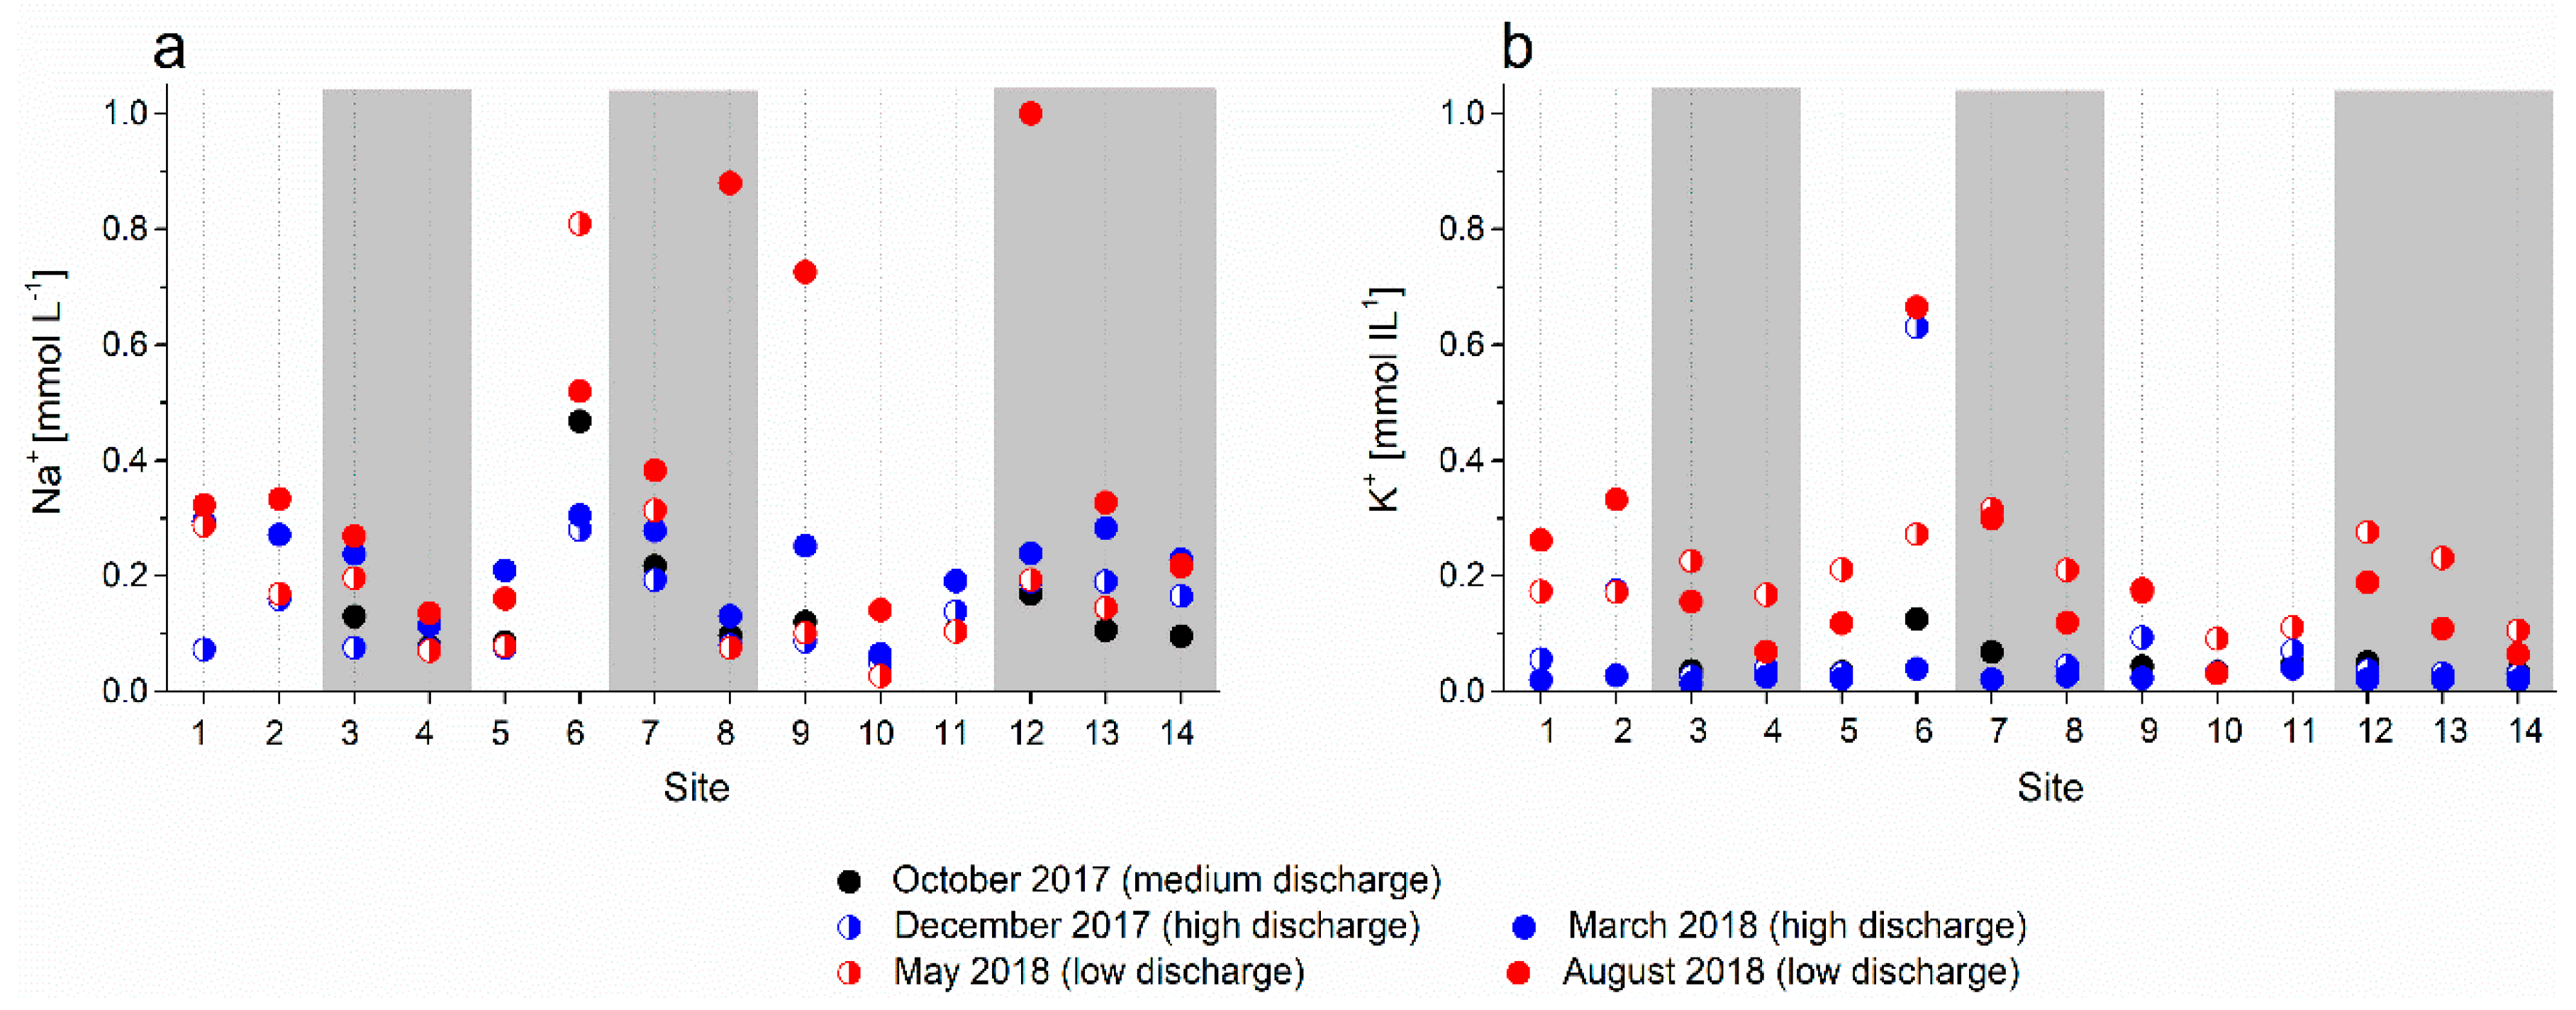
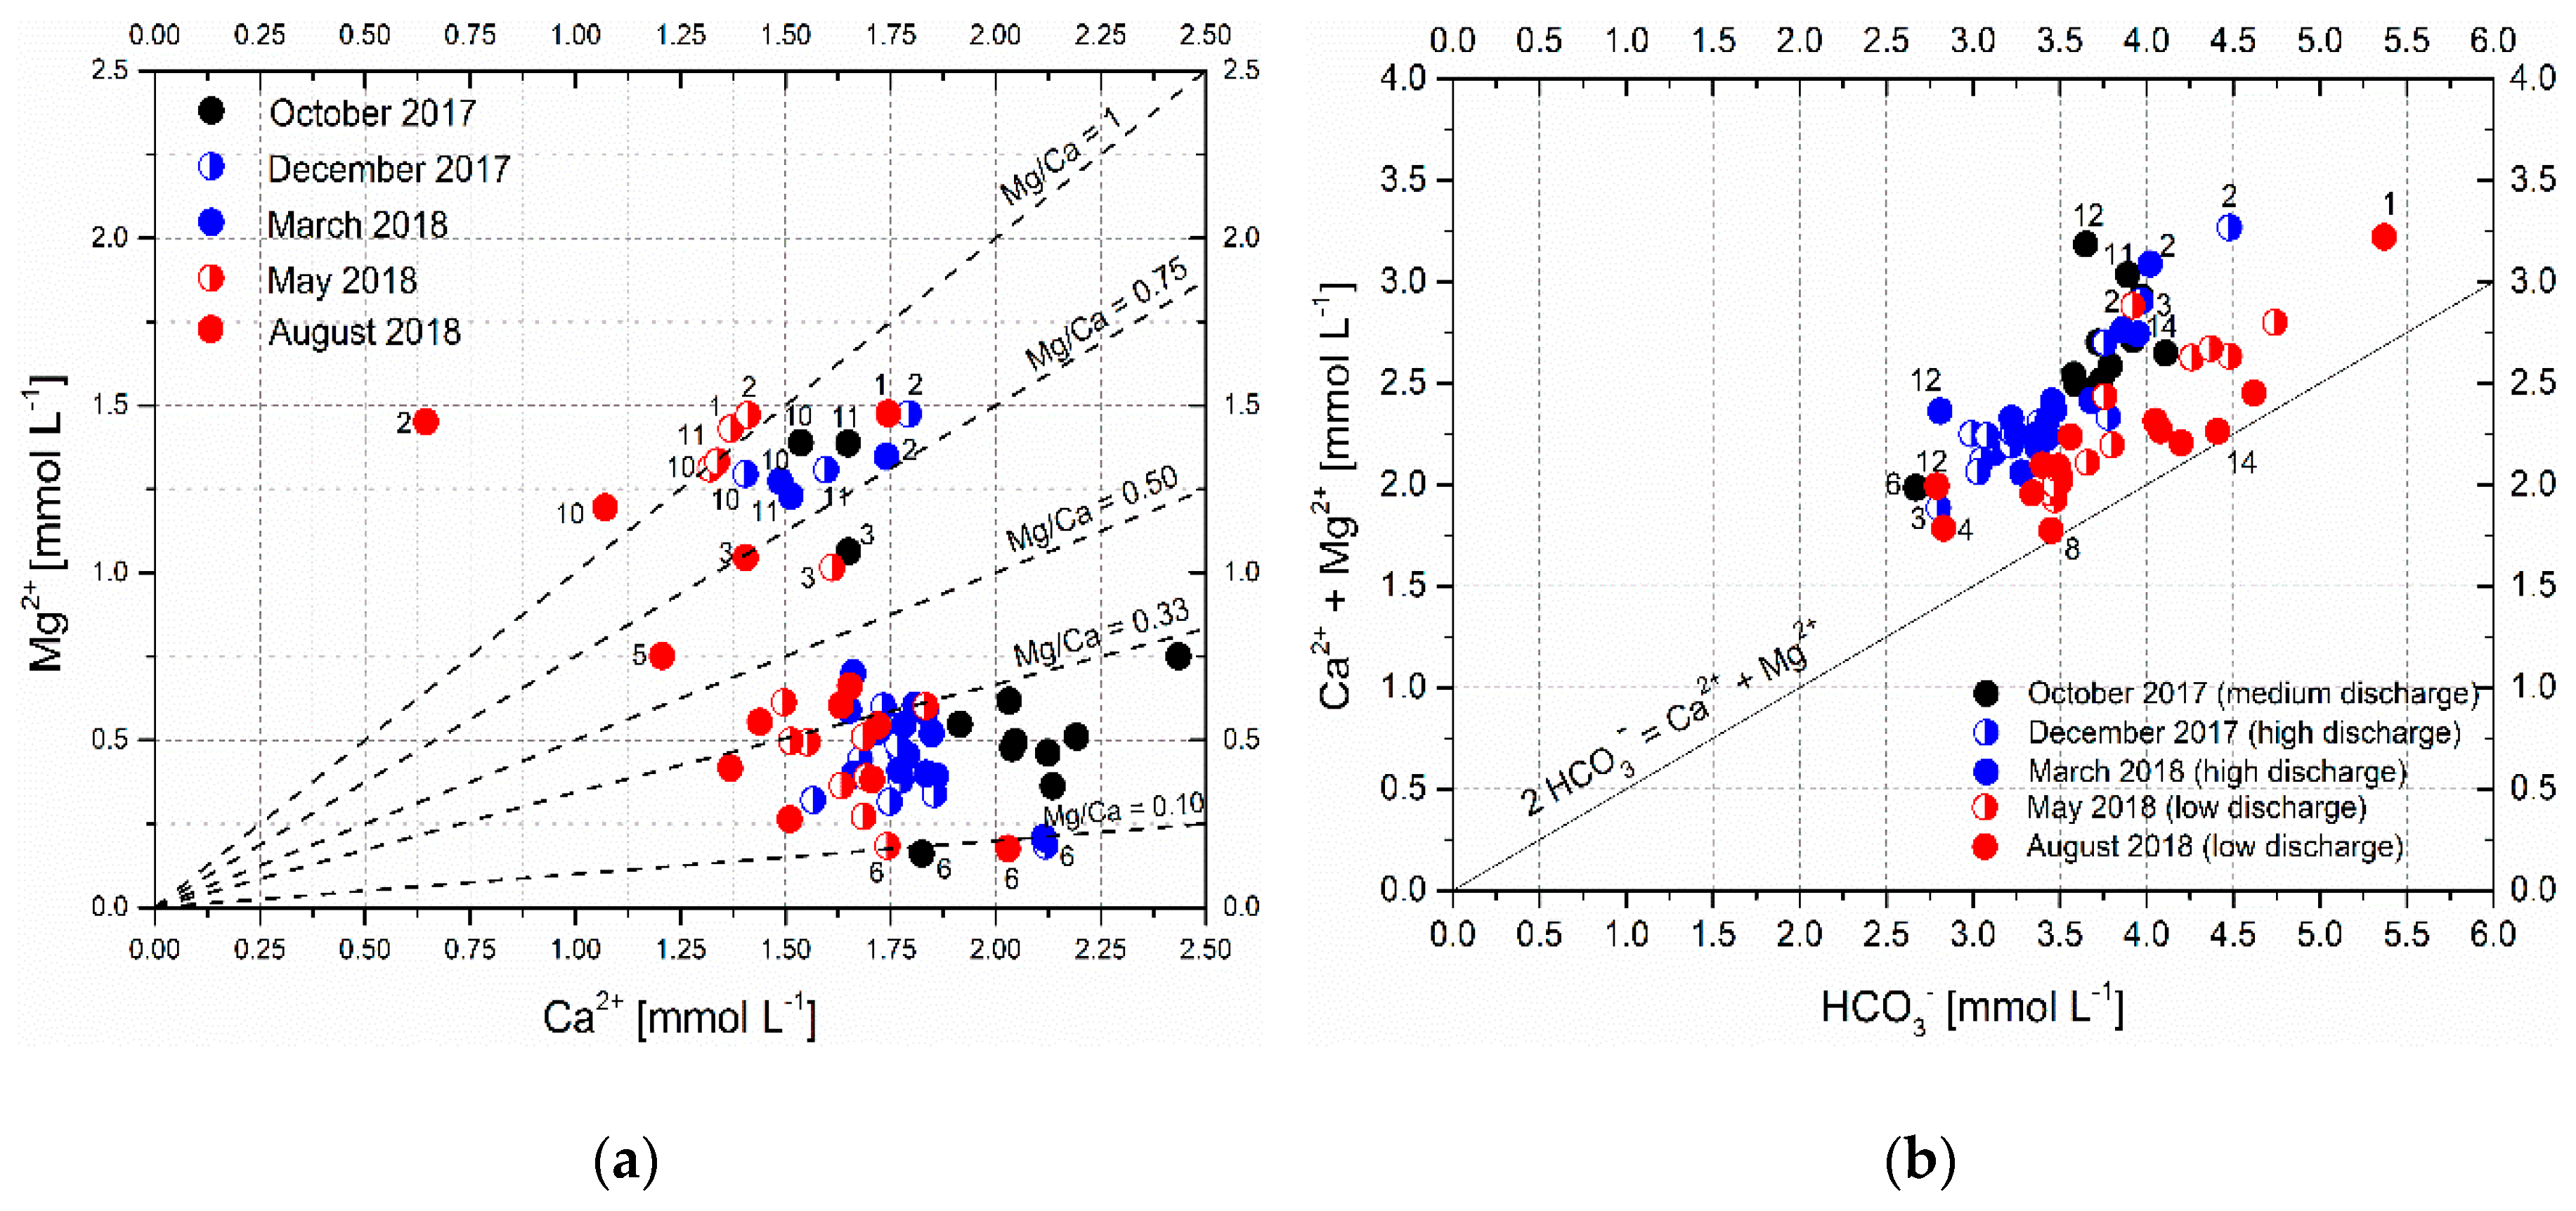
3.2. Water Composition of Ljubljanica River Catchment

Table 3 lists the means and ranges of the values of the measured physicochemical parameters and main ion concentrations in the sampled water for five seasonal sampling campaigns from October 2017 to August 2018, and Table S1 lists all measured values. Figure 6 and Figure 7 show the seasonal variability of the measured physicochemical parameters and main ion concentrations in the sampled springs and sinking streams.
The temperature variability at individual sampling sites during the entire sampling period ranged from 4.8 °C (site 12) to 10.4 °C (site 3) for springs and from 14.5 °C (site 11) to 22.9 °C (site 1) for sinking streams (Figure 6a). The water temperature gradually increased downstream with decreasing altitude at medium and high discharge (from October 2017 to March 2018); by contrast, surface streams warmed up rapidly and reached temperatures of up to 26 °C at low discharge and higher ambient temperature (sinks at sites 1 and 5, August 2018).
The average pH values of water (Figure 6b) generally decreased downstream; however, the differences between the seasons and at different discharges at each site were rather unsystematic, amounting to up to 0.9 units. At most sites, the lowest pH values were measured in the autumn at moderate discharge; however, no measurements were performed at that time at sites 1 and 2 because they were flooded. Consistently higher and seasonally much less variable values were measured in the sinking streams at sites 2, 10, and 11.
The electrical conductivity (Figure 6c) was relatively stable in most springs, except in August 2018, when some relatively low values were measured at very low water levels. By contrast, extremely high values were measured at the same time in sinking streams at sites 1 and 9.
The redox potential (Figure 6d) expressed in mV vs. Ag/AgCl 3.5 M KCl electrode varied rather randomly in a relatively narrow range of values and was always positive; specifically, oxidizing conditions prevailed in the water at all springs and sinks throughout the sampling period. No measurements were performed in August 2018 because the redox probe was malfunctioning.
The Mg2+ concentration (Figure 7a) varied significantly among sites but did not change much seasonally and/or with varying discharge, except at site 1, where elevated Mg2+ concentrations were recorded in May 2018 and August 2018 at low discharge. The Mg2+ concentrations were conspicuously elevated in sinking streams at sites 2, 10, and 11. The Ca2+ concentrations (Figure 7b) were less variable; only in August 2018, an extremely low value was recorded in the sinking stream at site 2. The Mg2+/Ca2+ ratios (Figure 7c) mainly followed the spatial variability of the Mg2+ content with higher values in sinking streams at sites 2, 10, and 11. In August 2018, the peak values coincided with low Ca2+ concentrations at respective sites.
The total alkalinity of water showed a spatial pattern resembling that of Mg2+ concentrations in the cool period at high discharge (Figure 7d, blue symbols). In the summer, at low discharge (August 2018), the alkalinities scattered and reached annual maximum values at some sites (sites 1, 6, 11, and 14) and annual minimum values at others (sites 2 and 4).
The sampled water was supersaturated with respect to calcite in all five sampling periods irrespective of the discharge (SIcalcite > 0, Table 3). The highest values of the calcite saturation index (defined as the log of the ratio between ion activity product and solubility product) were determined in August 2018 at the lowest discharge and highest temperature, and the lowest values were determined in October 2017 at moderate discharge. The most saturated water with respect to calcite was seen in the sinking streams at sites 1, 2, 10, and 11 (Table 3).
The Na+ and K+ concentrations in the analyzed water (Figure 8) had similar values at most sites of up to 0.5 mmol L−1; these two elements show a spatial pattern that differs from those of Mg2+ and Ca2+, with higher concentrations in the headwaters at Cerkniško polje (sites 1 and 2), in the sinking stream at site 6, and in the hydraulically connected central spring at site 7 and the lowest concentrations in the sinking streams at sites 10 and 11. The concentrations were the highest at low discharge. The K+ concentrations were low (or even below the limit of detection, Table 3) at most sites at medium and high discharge and higher but less scattered than those for Na+ at low discharge in spring and summer 2018; the peak values were reached in the sinking stream at site 6, as in the case of Na+.

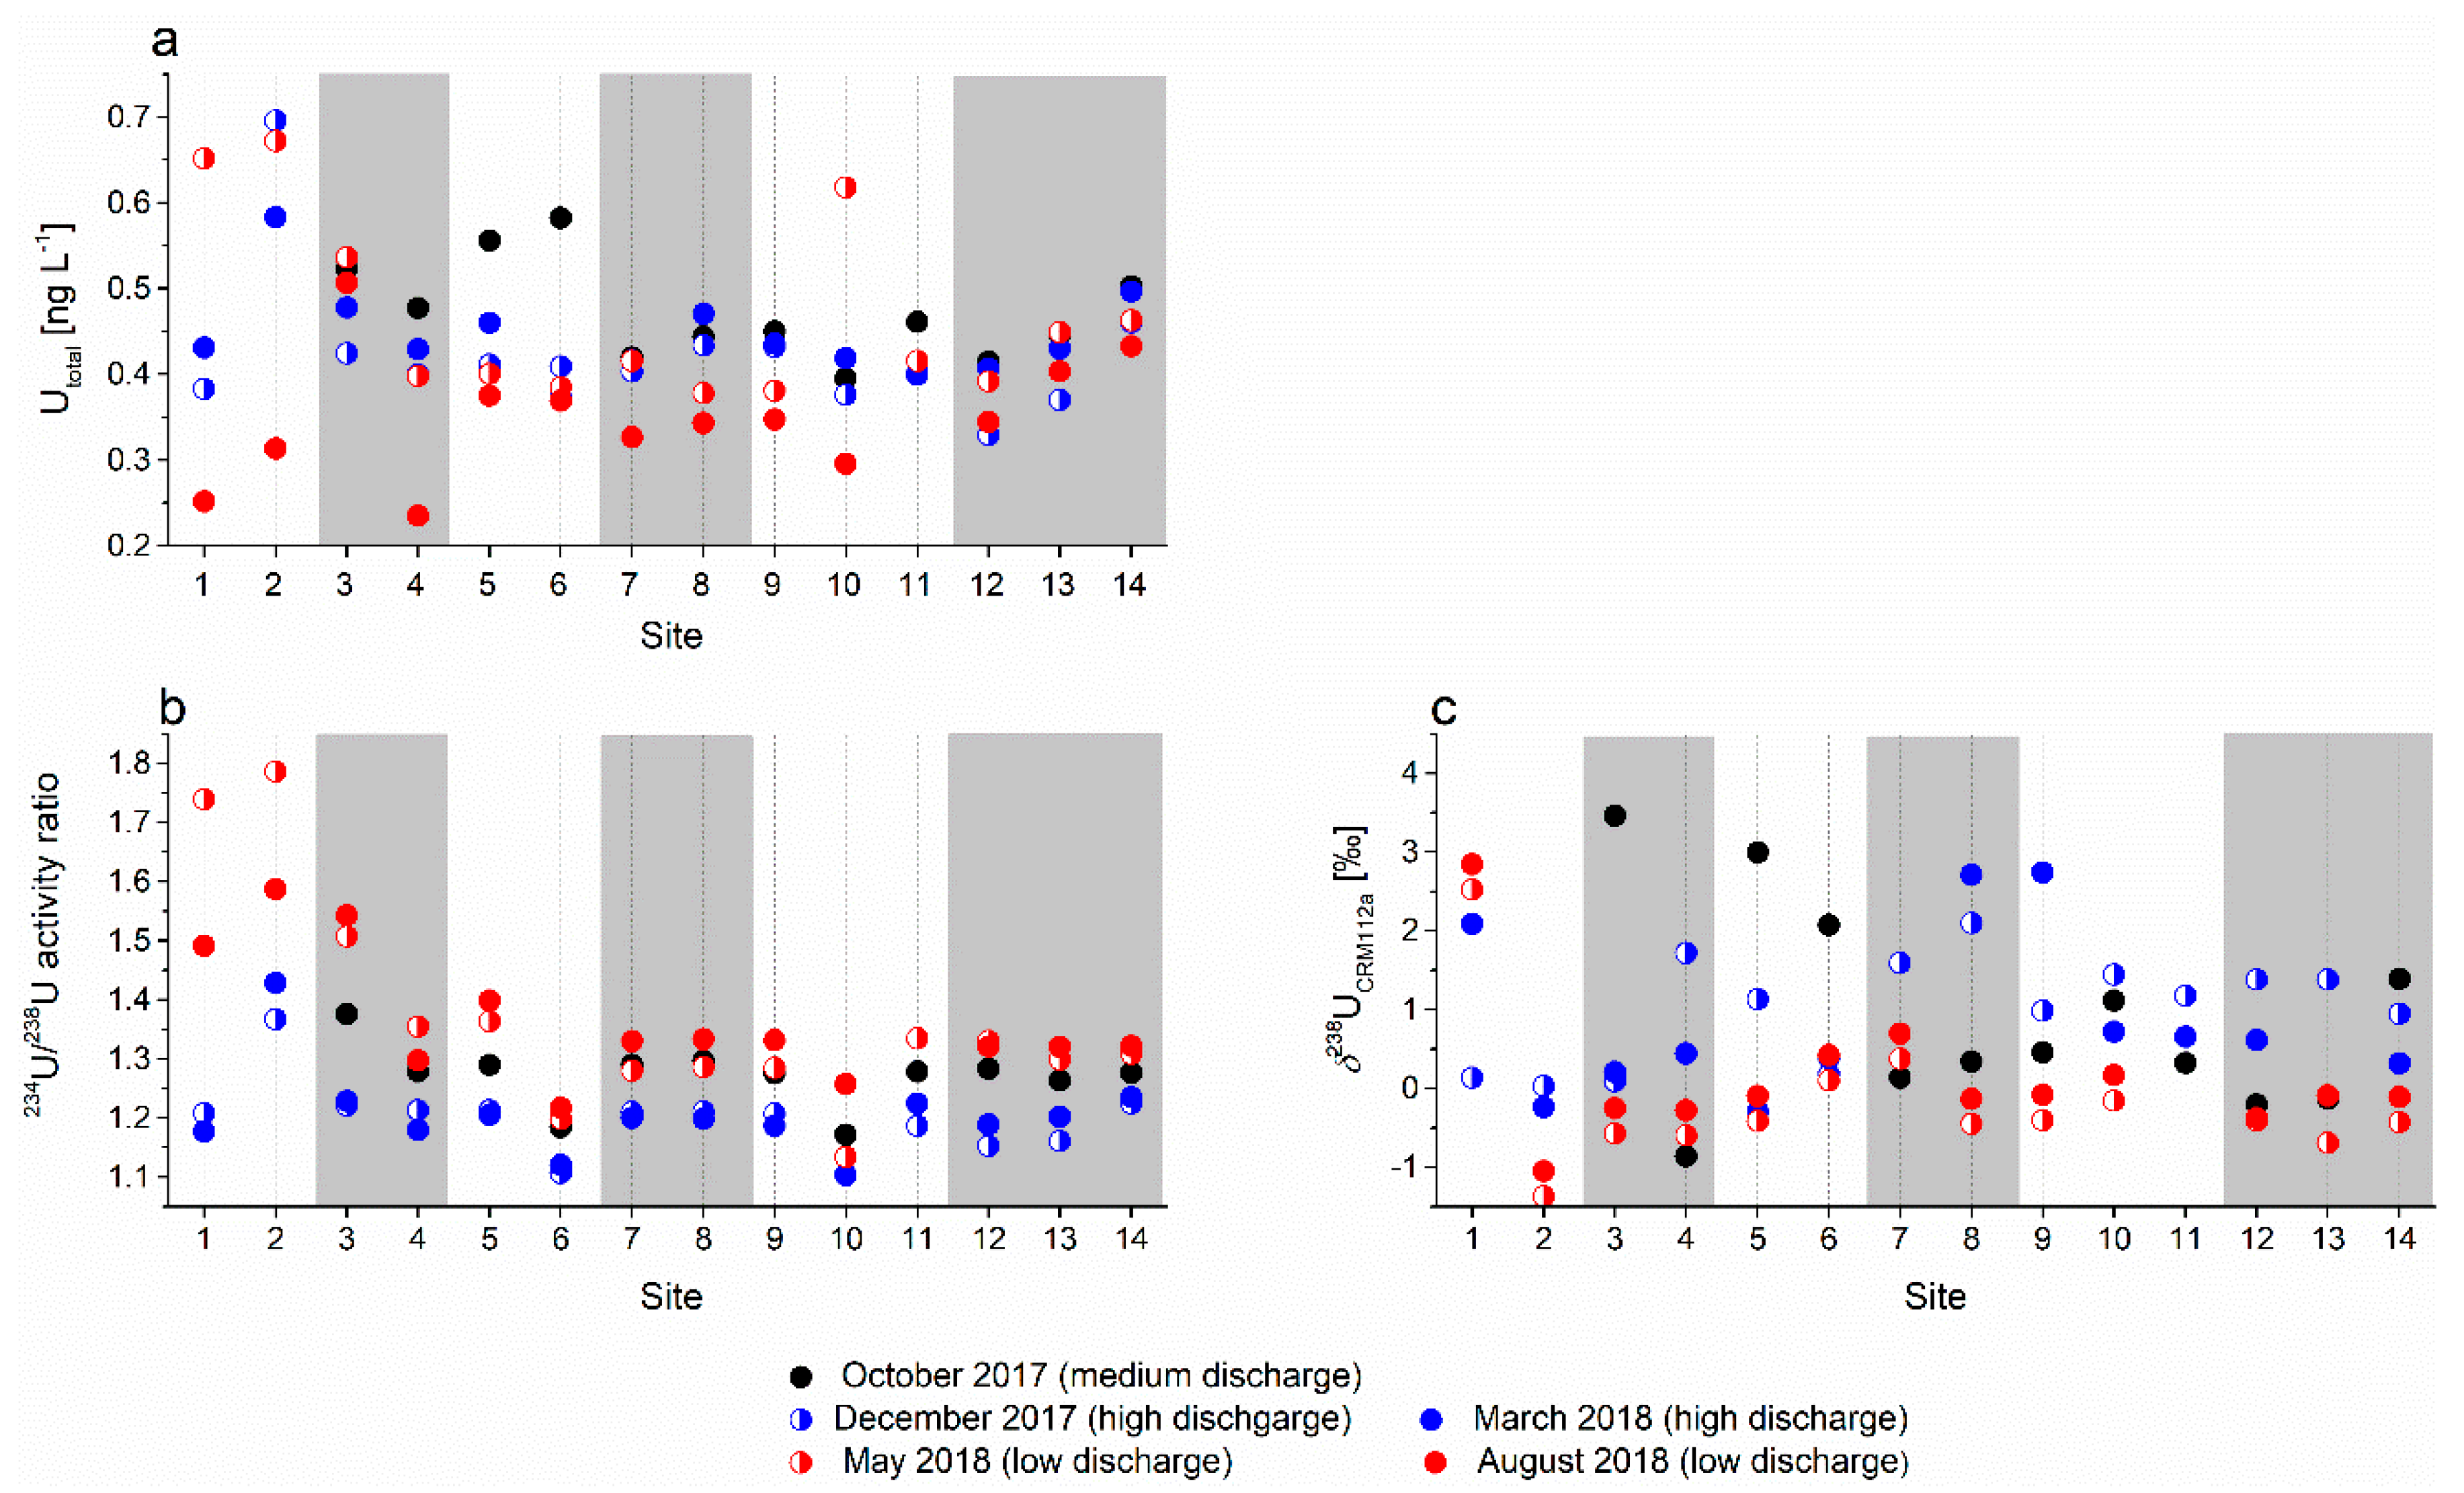
Concentration and Isotopic Composition of U in Water

The total U concentrations in water varied spatially and seasonally (Figure 9, Table S1). They ranged from 0.24 to 0.70 ng mL−1 (Figure 9a). In most cases, the concentrations were the lowest at the lowest discharge (August 2018), except at springs 3 and 12–14; by contrast, the concentrations were scattered (more so in sinking streams than in springs) during seasons with medium to high discharge.
The activity ratios of 234U/238U in water (Figure 9c) were consistently higher than the secular equilibrium value of 1.00 and varied seasonally, ranging from 1.17 to 1.38 in October 2017, 1.10 to 1.36 in December 2017, 1.10 to 1.42 in March 2018, 1.13 to 1.78 in May 2018, and 1.16 to 1.58 in August 2018. The mean and ranges of values decreased both spatially in the downstream direction and seasonally with increasing discharge.
The δ238U values in water samples ranged from −0.86‰ to 3.46‰ in October 2017, 0.03‰ to 2.10‰ in December 2017, −0.293‰ to 2.74‰ in March 2018, −0.34‰ to 4.24‰ in May 2018, and −1.37‰ to 2.52‰ in August 2018. The activity ratios of 234U/238U in water samples show a general spatial pattern similar to that of the U concentrations. Except at sites 1, 4, and 7, the lowest δ238U values were seen during periods of low discharge; at most sites, δ238U values were scattered at moderate and high discharge, especially in the headwater and area section of the analyzed catchment.
Both δ238U isotope ratios and 234U/238U activity ratios show a slightly similar pattern downstream; specifically, they show decreased seasonal variability and preferential enrichment of the lighter U isotope.

4. Discussion

4.1. Bedrock Weathering

The karst aquifer of the Ljubljanica River is predominantly composed of limestone and dolomite; therefore, the dissolution of the carbonate bedrock can be considered as the governing influence on the groundwater chemistry. The carbonate dissolution in CO2-rich karst water proceeds as
CaCO3 + CO2 + H2O ↔ Ca2+ + 2 HCO3
for calcite and
Ca0.5Mg0.5(CO3) + CO2 + H2O ↔ Ca2+ + Mg2+ + 2 HCO3
for dolomite. Consequently, the sum concentration of dissolved Ca2+ and Mg2+ equals two times the HCO3 concentration assuming that all dissolved Ca and Mg are derived from carbonate dissolution. The ratio between the two elements depends upon the relative contributions of limestone (calcite) and dolomite weathering, and the deviation of the (Mg2+ + Ca2+) concentration from 2 × HCO3 concentration indicates the contribution of silicate weathering to the dissolved load of water. Both parameters are commonly used to reconstruct the source areas of groundwater in individual springs and streams.
Figure 10 shows the Mg2+ vs. Ca2+ plot of analyzed springs and streams in the Ljubljanica River catchment and the correlation between the concentrations of (Mg2+ + Ca2+) and HCO3. The line Mg2+/Ca2+ = 1 in Figure 10a represents the dissolution of pure dolomite, and the line Mg2+/Ca2+ = 0.33 reflects the weathering of equal amounts of limestone and dolomite; dissolution of pure limestone produces the water solution that is plotted at or below the line Mg2+/Ca2+ = 0.1 [58].
Generally, most samples in Figure 10a are plotted between the lines Mg2+/Ca2+ = 0.1 and 0.5, indicating the dissolution of a mixture of limestone and dolomite; this corresponds to the dominant lithology of the Ljubljanica River catchment. The sinking stream at site 6 (Pivka River) that is plotted at or below the line Mg2+/Ca2+ = 0.1 drains an area with flysch and limestone bedrock.
Samples from sinking streams plotted above the line Mg2+/Ca2+ = 1 (sites 2 and 10 in August 2018) contained more Mg2+ than could be supplied by the dissolution of pure dolomite, and samples at sites 1, 2, 10, and 11 in May 2018 were very close to, or at, the pure dolomite dissolution line. These streams drain areas composed predominantly of dolomite (Figure 2, [40,41]). Some Mg2+ can also be supplied by the weathering of silicate minerals accumulated in the flood sediments at Cerkniško polje (streams at sites 1 and 2) and in the sub-catchment of the Hotenjka (site 10) and Logaščica (site 11) streams, as shown in Figure 10b, where almost all samples are plotted above the carbonate dissolution line. Another plausible explanation of the increased Mg2+/Ca2+ ratio in summer months is the precipitation of low-Mg calcite from supersaturated water, which preferentially removes Ca2+ from the solution and thus increases the Mg2+/Ca2+ ratio in the residual water [59,60,61]. Considering the high supersaturation of these streams with respect to calcite (Table 3), calcite precipitation is possible, especially when the water temperature is high and both water evaporation from streams and enhanced degassing of CO2 occur. Occasional occurrence of carbonate incrustations on leaves or rocks around the sinks in summer months supports this assumption. At increased discharge and lower temperature, the water samples from sites 2, 10, and 11 plotted between the Mg2+/Ca2+ = 0.75 and 1 lines and the water sample from site 1 plotted between the Mg2+/Ca2+ = 0.2 and 0.3 lines (Table S1). This indicates that with increasing discharge, these streams receive an increasing amount of water from the limestone-rich part of the aquifer. The stream at site 1 that crosses the southern part of Cerkniško polje predominantly receives water from the south from the limestone-dominated Javorniki plateau at medium and high discharge.
The spring of the Rak stream (site 3) plotted between the Mg2+/Ca2+ = 0.75 and 0.5 lines at low and medium discharge and between the Mg2+/Ca2+ = 0.5 and 0.33 lines at high discharge. It is hydraulically connected to the Cerkniško polje with sinking streams at sites 1 and 2 [42,47]; however, with increasing discharge, it also obtains an increasing fraction of water from Javorniki plateau (Figure 2). The Rak stream at site 5 is located close to its sink a few hundreds of meters downstream from the confluence with Kotliči spring (site 4, with Mg2+/Ca2+ratio of 0.21–0.31, Table S1); it had a Mg2+/Ca2+ ratio of 0.62 in August 2018 and a ratio of 0.26–0.36 in other seasons. Therefore, it is closer to the Kotliči spring than to the Rak spring. Considering the extremely low discharge during the sampling campaign in August, when water was sinking in numerous smaller pools, CaCO3 precipitation owing to CO2 degassing and evaporation is the most probable cause of this increase in the Mg2+/Ca2+ ratio at this site.
The springs of the Unica river in Planina cave (site 7, Mg2+/Ca2+ = 0.16–0.24) and Malenščica (site 8, Mg2+/Ca2+ = 0.17–0.33) at Planinsko polje in the central part of the Ljubljanica river catchment have Mg2+/Ca2+ ratios that vary in a relatively narrow range of values. Despite their proximity, they obviously receive water from different sources, which also show other dissolved elements such as Na+ or K+ (Figure 8). The spring at site 7 is hydraulically connected with the Pivka river (sink at site 6, Mg2+/Ca2+ = 0.09–0.11, [5,42,47]). However, in terms of the Mg2+/Ca2+ ratio, the water composition is closer to that of the water from the Rak stream and Javorniki plateau (sites 4 and 5), indicating that water from this direction prevails in these springs through most of the year.
At the northern edge of the Ljubljanica aquifer, the main Ljubljanica springs at sites 12 and 13 and the tributary at site 14 discharge well-homogenized water from the central part of the catchment [37]. However, the contribution of sinking streams at sites 10 and 11 can be detected occasionally in the springs at sites 12 and 13 (Mg2+/Ca2+ = 0.2–0.4). By contrast, in the tributary at site 14, the Mg2+/Ca2+ ratio remains rather constant (0.30–0.33) and is representative of the integral composition of the aquifer with similar abundances of dolomite and limestone. The increased Mg2+/Ca2+ values in spring at site 14 agree with tracer experiments, which showed a hydraulic connection through dolomite-containing formations between sinks at Cerkniško polje and this spring [62].
For all analyzed water samples, the sum of Mg2+ and Ca2+ concentrations was larger than 2 × HCO3 concentration (Figure 10b), indicating that the weathering of silicates (e.g., clay minerals, feldspars) also contributes some solutes to the groundwater in the Ljubljanica aquifer throughout the year. This contribution was the smallest in the summer (August 2018) and increased with increasing discharge. The largest contribution was found in samples taken from October 2017 to March 2018, which is consistent with the fact that in areas with thick soil and large bioproduction, such as the mainly forested karst catchments of central and southern Slovenia, silicate weathering rates and, consequently, mineralization of water increases in humid conditions owing to the higher weathering capacity of clastic rocks in comparison to that of carbonate rocks [63]. The sites with apparently the smallest contribution of silicate weathering at low discharge were the sinking stream at site 6 and springs at sites 7 and 8. At medium discharge, the least contribution of silicate weathering was observed at site 6 and in the spring at site 14; by contrast, at high discharge, the least silicate-derived mineralization was seen in the springs at sites 3 and 14. Interestingly, the sinking stream at site 6 (Pivka river) with abundant flysch in the headwater region and siliciclastic sediments in Pivka basin (Figure 2) seems to have the smallest dissolved load fraction originating from silicate weathering. Other water samples listed as those with a minor fraction of silicate-derived solutes were collected at springs draining carbonate rocks with no notable occurrences of siliciclastic rocks in their sub-catchments. By contrast, the largest contribution of silicate weathering was observed at high discharge in sinking streams at sites 1 and 2 at Cerkniško polje and in the spring at site 12. While silicates are relatively abundant at Cerkniško polje, where the sinks of the two streams are located, the spring at site 12 at the northern edge of Ljubljanica aquifer emerges from the limestone area with no notable occurrences of silicate minerals in the immediate proximity. Some Upper Cretaceous marls (“Scalia”) occur in the catchment area between the sink of the Unica river (site 9) and the spring at site 12 [40], which could contribute to the silicate weathering affecting the mineralization of the spring water; however, this can only be speculated from the available data.
In principle, the discharge strongly influences the solute concentrations and physicochemical parameters of spring and river water. However, in the Ljubljanica river catchment, most measured parameters seem to be only weakly correlated with the discharge, or the correlations change from positive to negative at certain points.
Table 4 shows the Pearson correlation coefficients calculated for each parameter at sites where discharge data were available based on water analyses from all five seasonal sampling campaigns. The conductivity, as a measure of total dissolved ions in water, showed no or only poor correlation with the discharge, and the correlations, where they existed, were positive at some sites and negative at others. Ravbar et al. [64] showed that in complex karst aquifers, the electrical conductivity and, with it, the concentrations of individual solutes may show rather peculiar behavior at variable discharge, i.e., it may increase and decrease irrespective of the amount of water. This is explained by the fact that with an increasing water level, the catchment expands and incorporates groundwater from other parts of the aquifer with different lithologies and different hydraulic heads. Consequently, the origin, amount, and hydrochemical composition of water at the same spring may vary rather irregularly depending on the local hydrological conditions in the entire catchment area. This study used classical geochemical tracers (elemental concentrations, physicochemical parameters); therefore, we could only substantiate the existing knowledge about the Ljubljanica aquifer’s behavior [5,42,47].

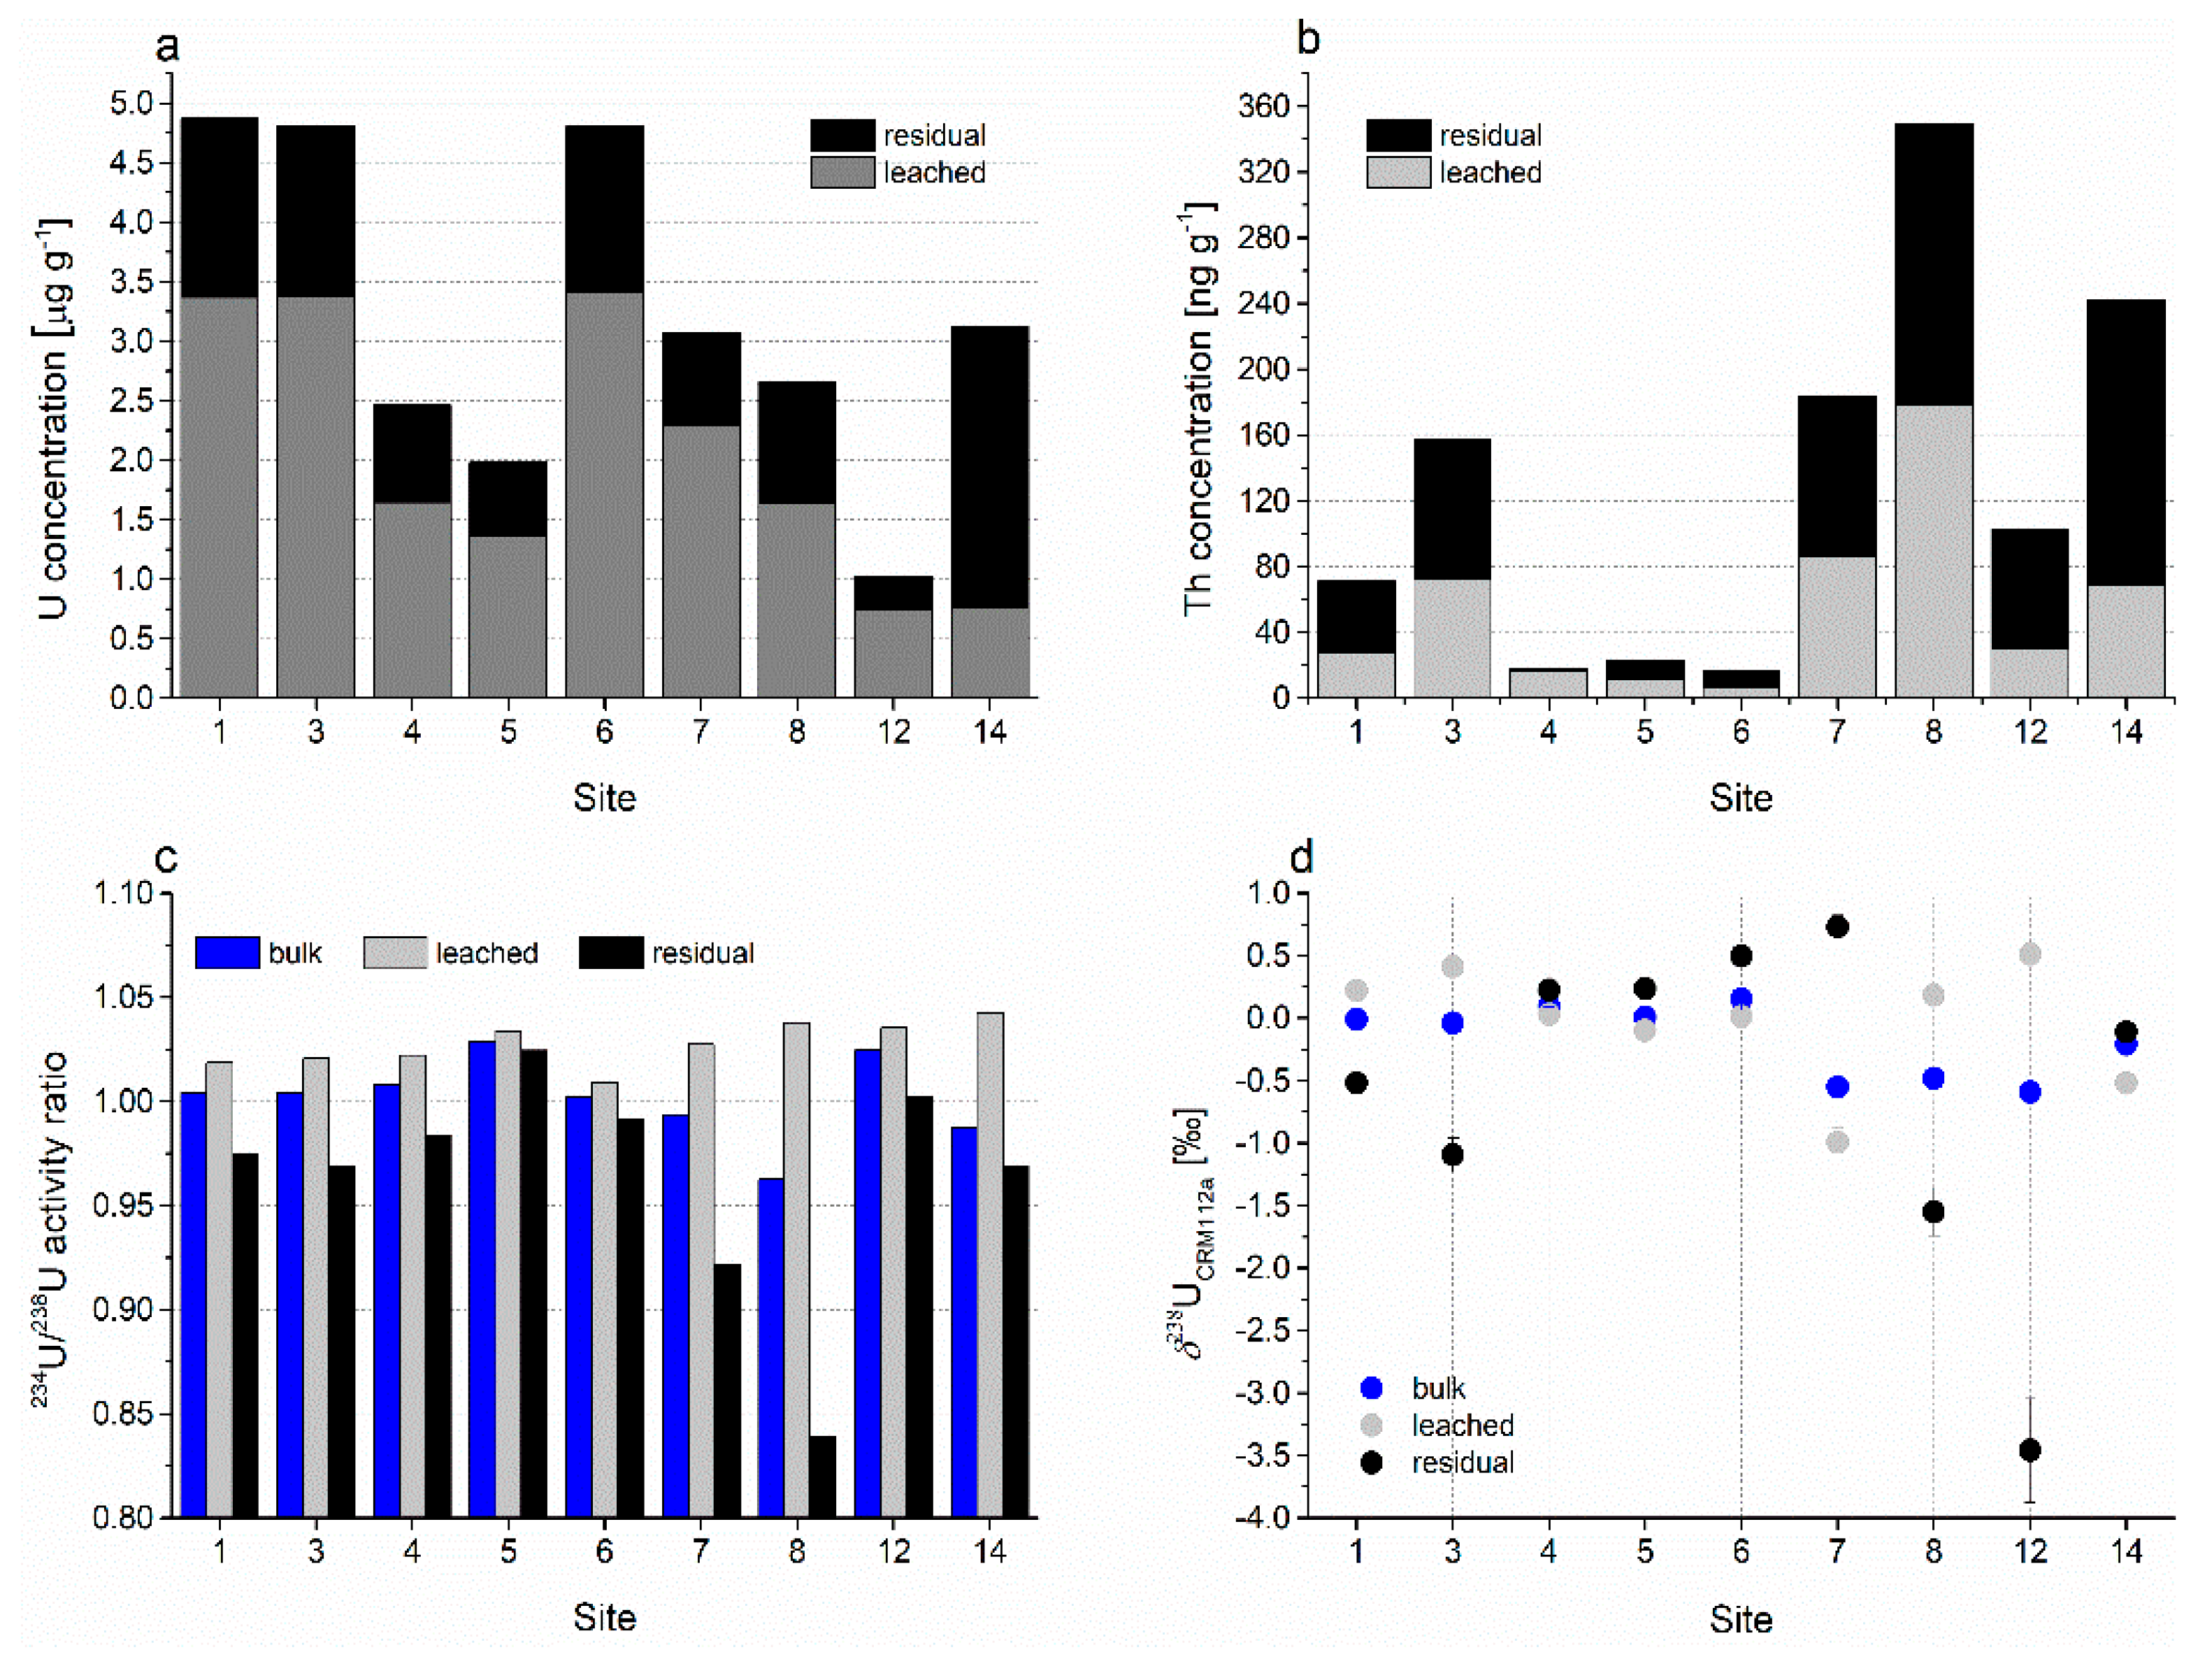
4.2. U and Th Isotopes in Bedrock

The analyzed rock samples from sites 1–5, 7, and 8 were Lower Cretaceous limestone. The sample from site 6 represented Upper Cretaceous limestone; that from site 12, Jurassic limestone; and that from site 14, Upper Triassic dolomite (“Hauptdolomit”) (Figure 2). Although samples from sites 1–5, 7, and 8 belonged to the same lithostratigraphic unit, their total U concentrations varied significantly from 1.99 to 4.88 μg g−1 (Figure 5a). Jurassic limestone (site 12) had the lowest U concentration, whereas Triassic dolomite showed a similar range of values to Cretaceous limestone. Nevertheless, all measured U concentrations were within the typical range of values for carbonate rocks [65,66,67].
The U leached phase fraction was similar between sampling sites that belonged to the same lithostratigraphic unit (Figure 5a). The Cretaceous limestone samples had 61%–75% of the total U in the carbonate fraction and the Jurassic limestone sample, 72%. The dolomite sample (site 14) seemingly had the carbonate U fraction (24%). In our case, the carbonate fraction of the analyzed rock is defined as a leached fraction that is soluble in 1 M NaAc in 25% HAc, which was used as a soft leaching procedure to extract mainly the carbonate-associated U and Th fraction from a residual phase. The residual fraction of U in the analyzed rocks is the difference between the bulk sample and the leached fraction. In most samples, the non-carbonate U fraction was less than 30% of the total U. The exception was the dolomite sample (site 14), with virtually much higher non-carbonate U fraction, which is consistent with the fact that the weak acid preferentially extracted calcite whereas dolomite dissolution was incomplete; thus, the dolomite partly remained in the unleached fraction [68]. Therefore, the “carbonate fraction” of U in dolomite is most probably largely underestimated. In limestone samples, the residual fraction contained detrital minerals (traces of quartz, clay minerals) and only traces of dolomite. Considering the abundance of the detrital phase, which accounted for ~1–8 wt% (Table 2) of the total sample mass, the non-carbonate fraction of the bedrock is obviously strongly enriched in U.
The thorium (Th) concentrations in rock samples from the Ljubljanica aquifer were generally lower than the U concentrations (Figure 5b). In addition, the Th concentrations in bulk samples were mostly higher than those in leached samples, and the difference, that is, enrichment of residual fraction in Th, was much more obvious than that for the U concentrations. Kelepertsis et al. [69] reported that Th in carbonate rocks is mainly associated with the non-detrital (i.e., carbonate) fraction, which is clearly not the case in our study area except for one Lower Cretaceous limestone (site 4). By contrast, Zhang et al. [70] associated Th in carbonate mostly with the clay fraction. The bulk Th concentration was very low in rock samples from sites 4, 5, and 6, which also have a relatively small fraction of the detrital phase (Figure 5b, Table 2). At other sites, the Th levels were much higher; this could be attributed to the increased content of detrital minerals and their enrichment in Th. A conspicuous case is the rock sample from the site 14, which had by far the lowest fraction of non-carbonate minerals (<1%, Table 2) but one of the highest Th concentrations. Obviously, as with the U content, the variability of Th levels in bedrock is high not only among different lithostratigraphic units but also within the same unit (i.e., samples of Upper Cretaceous limestone with variable U and Th contents).
The bulk samples of sedimentary carbonate rocks generally have 234U/238U activity ratios lower than 1 owing to alpha recoil effects. In a water–mineral system, 234U is preferentially released from the solid phase to the water and the secular equilibrium of the 234U/238U activity ratio is disturbed. Consequently, the 234U/238U activity ratio is higher in water and lower in the mineral phases [23,25,27]. To confirm this, we calculated the 234U/238U activity ratio of the residual samples in the leaching experiment from the difference between the 234U/238U activity ratio for bulk and leached samples in consideration of the U mass balance. Here, we observed an even more conspicuous deviation in the 234U/238U activity ratios in residual samples than that reported for natural water [11,25,71]. The leached samples (Figure 5c) showed noticeably higher 234U/238U activity ratios than their corresponding bulk samples for most sampling sites, except at sites 5 (Lower Cretaceous) and 6 (Upper Cretaceous limestone), where the activity ratio for bulk and leached samples can be considered the same (difference was within measurement uncertainty). In addition, samples from sites 5 and 6 have one of the highest contributions of 234U/238U activity ratio for the U detrital phase. For the leached samples, where only the carbonate phase and some loosely bound U from clay minerals [69] were supposed to be present, the 234U/238U activity ratios for all samples were above 1 but lower than the activity ratio in river water or groundwater [11,24]. This was in agreement with the values specific to carbonate minerals [33,71,72]. Bulk samples with a 234U/238U activity ratio lower than 1 are considered to result from the loss of 234U because of the weathering process [25,72]. For the residual fraction of rock samples, the 234U/238U activity ratio at sites 7 and 8 (Lower Cretaceous limestone) is significantly lower (<<1) than the leached (carbonate) fraction of samples. This agrees with the U concentrations at these locations, where the non-carbonate fraction is also among the lowest ones. The dolomite sample (site 14) cannot be distinguished from the limestone samples in terms of the bulk U and Th concentrations, and the apparently large residual (non-carbonate) fraction is most probably the result of incomplete dissolution of dolomite during the leaching process.
The δ238U values (Figure 5d, Table S1) reflect 238U/235U variations relative to the U isotope ratios of the CRM-112a reference material. As mentioned before, carbonate rock samples from the Ljubljanica River catchment have highly variable U isotope compositions. Our study found δ238U values of −1.0‰–1.0‰; these are similar to those of previous studies of carbonate materials [15], [72] and references therein. The negative or near-zero δ238U values of leached rock samples agree with the δ238U values reported in [72], where various carbonate reference materials were tested. Stirling et al. [28] reported that the light U isotope composition may be the result of preferential leaching of isotopically light lattice-bound 235U over 238U from the minerals by percolating waters. In our study, carbonate rocks contained only minor fractions of siliciclastic materials. Therefore, the δ238U values are in a similar range for bulk and leached samples. In addition, the variability of the δ238U values of bulk, leached, and residual fractions was the smallest in samples from sites 4, 5, and 6; furthermore, these samples showed the lowest Th concentration, which is related to the smaller fraction of detrital Th-bearing minerals. The exception is sampling site 12, where the δ238U value of the residual phase was extremely low (−3.46 ‰). In this sample, the bulk U concentration as well as U concentrations in the leached and residual fraction were the lowest, and the contribution of the calculated detrital phase in the sample was small. Therefore, the δ238U value differed greatly from the other results. Some studies further reported that carbonates can be isotopically enriched in 238U, thereby yielding more positive δ238U values (up to 1.0‰) [15] and references therein, [28], which is also in agreement with our results.

4.3. U Isotopes in Water

Because the karstic aquifer of Ljubljanica is very complex, the U isotopic composition of ground and surface water can show many different behaviors in such a system. The total U concentration in water (Figure 9a) was similar or lower compared to some other carbonate aquifers [12,73] and was highly variable in the headwater part of the aquifer (Cerkniško polje—sites 1 and 2, sinking stream Rak (site 5) and river Pivka (site 6)) and in the tributary at site 10 from Logaško polje. In springs, the emerging water was obviously homogenized; therefore, less variability was recorded. The average U concentrations showed a decreasing trend downstream; however, this trend was not consistent for all sites and all seasons.
The 234U/238U isotopic composition is supposed to change during water–rock interactions and is mostly influenced by the alpha recoil effect [20,33,74]. Riotte et al. [74] and Riotte and Charbaux [75] reported that 234U/238U activity ratios close to 1 are characteristic of groundwater in crystalline aquifers, whereas higher activity ratios (up to 3.6 [73]) are associated with carbonate host rocks and karst areas. However, the 234U/238U activity ratios in all cases were reported to be negatively correlated with the discharge. This may happen because of the capacity of the bedrock to store water in aquifers connected with surface waters for prolonged periods of time (from days to tens of thousands of years); therefore, the 234U/238U ratios vary depending on the residence time of the groundwater recharging the streams [74,75,76].
The differences in the 234U/238U ratio between water and bedrock are reported to be mostly dependent upon the rock type and its permeability [11]. Therefore, the deviation in the 234U/238U activity ratios in surface waters might indicate U disequilibrium as a potential tracer of the lithology of the aquifer and the contribution of waters with long residence time to the spring or surface water. However, in the case of the Ljubljanica river catchment, no apparent correlation was seen between the lithology and the 234U/238U ratio of groundwater.
The 234U/238U activity ratios in water varied by ~6%–20% between low- and high-flow conditions (Figure 9b). In contrast to other parameters (alkali and earth alkali metals, alkalinity including total dissolved U concentration), the 234U/238U activity ratio was strongly negatively correlated with the discharge at most sampling sites (Table 4, Figure S1); therefore, it seems to be the best available geochemical tracer of sources of water in the analyzed catchment.
The difference between 234U/238U activity ratios at high and low discharge was the largest in the headwater area of Cerkniško polje in the sinking streams at sites 1 (1.21–1.73) and 2 (1.36–1.58), followed by the hydraulically connected spring of the Rak stream (site 3) (1.22–1.54); at other sampling sites, the seasonal variability was generally around or under 0.2. The highest 234U/238U activity ratios were recorded for the headwater streams at sites 1 and 2 at low discharge (May 2018, August 2018). At high discharge, the 234U/238U ratio in the sinking stream at site 1 was similar to that in the spring at site 4, and it was recharged mainly from the Javorniki plateau [47]; this connection was already established in tracing experiments. In the sinking stream at site 2, the 234U/238U values were the highest not only at a low water level but also during high discharge (Figure 9b); therefore, this tributary can be traced in downstream springs under any hydrological conditions. The stream at site 2 drains the area north of Cerkniško polje that is composed of Triassic dolomite; this is the same lithological formation that is also abundant in the sub-catchment of the spring at site 14, which shows elevated 234U/238U ratios under high-flow conditions compared to nearby springs (sites 12 and 13). Despite the proximity to the springs at sites 12 and 13, the spring at site 14 obviously received more water from the central part of the aquifer that is dominated by limestone [62]. The laboratory leaching experiment with pulverized rock samples showed that the “Hauptdolomite” did not have higher 234U/238U ratios than other rock samples; however, the physical conditions in the field, such as grain size, porosity type, and rock permeability can significantly affect the leaching of U from the bedrock. Therefore, the 234U/238U activity ratio should be used with caution when interpreting the weathering processes [75].
In the Rak creek, at high and medium discharge, the 234U/238U activity ratio in the sinking stream at site 5 matched the discharge-weighted sum of 234U/238U ratios of the two springs (sites 3 and 4) contributing to the stream; the same applied to the springs at sites 7 and 8, yielding the sinking stream Unica (site 9). At low water level, when the discharge of the streams is also affected by the evaporation, the balance does not match, that is, the calculated 234U/238U activities ratios of the sinking streams deviate from the measured ones beyond the analytical uncertainty. In the springs of the central part of the aquifer, the mixing of groundwater representing the sinking stream at site 6 (Pivka river), Cerkniško polje, and Javorniki plateau (springs at sites 3 and 4 and sink at site 5) could also be traced to the springs of Unica (site 7) and Malenščica (site 8). However, the 234U/238Uactivity balance could not be estimated because the 234U/238U activity ratio of the drip water in the aquifer was not estimated. Therefore, one important contributing source cannot be considered in the calculation.
The tributary at site 10 had lower 234U/238U activity ratios compared to those at the Unica river and resembled those of the Pivka river (site 6). However, it cannot be traced to the main Ljubljanica springs because of its generally small discharge that represents only a minor or almost negligible contribution to the discharge of these springs. The 234U/238U activity ratios of the tributary at site 11 cannot be distinguished from the water deriving from the Javorniki plateau and the Unica River. The 234U/238U ratio could thus be used as a tracer of the origin of water only in the first, second, and third levels of the catchment but not for the main springs at the edge of the Ljubljana basin.
Schaffhauser et al. [77] implied that with increasing water transit time through the aquifer, the 234U enrichment of the water would be increased because of a longer flow path and/or longer contact of water with the aquifer. This is consistent with the negative correlation between 234U/238U activity and discharge (Figure S1). In the case of the karst aquifer of the Ljubljanica River catchment, the 234U enrichment decreased downstream (Figure 9b, Table S1). However, no correlation was found between the mean transit time (MTT) of water (as estimated by Rusjan et al. [37]) and the 234U/238U ratios or U concentration in water. The MTT was the longest at ~9 months in the central part of the aquifer for the flow section Rak creek (site 5)—Malenščica spring (site 8); however, the range of 234U/238U ratios in the water at these sites was rather small and the values were lower compared to those of the headwater tributaries. Along the entire downstream flow direction for sites (7, 8) → 9 → (12, 13, and 14), the range of 234U/238U ratios was rather similar whereas the MTT decreased from ~9 to 6–7 months. This also implies good homogenization of water, which was previously confirmed from the stable isotopes of water [37]. By contrast, the poor correlation between the transit time and the 234U/238U activity ratio can be explained by the fact that the recoil effect can be hampered because the redox condition was not reducing enough to allow the formation of reduced U(IV), which facilitates the emission of 234U into the solution [74,75,76].
The river Pivka (site 6) had the shortest transit time (0.34 year) and a relatively large influence of surface discharge because of a relatively long surface flow path, and it exhibited the narrowest range of 234U/238U activity ratio values (1.1–1.2 for discharge varying across several orders of magnitude from 0.02 to 15.32 m3s−1). In contrast to some other geochemical tracers (e.g., Na+, K+, Mg2+), its 234U/238U activity ratio could not be traced downstream toward the spring at site 7 at any time despite the short distance between sites 6 and 7 and the proven hydraulic connection, which is only occasionally interrupted [37,47]. The narrow range of 234U/238U values can be attributed to the different lithology of the Pivka sub-catchment, which consists of limestone, flysch, and stream deposits at the Pivka basin, in contrast to other sub-catchments, which are dominated by carbonate rocks. The mobilization of U from siliciclastic rocks is reported to be much slower compared to the rapid dissolution of carbonate in CO2-rich karst water and to be less dependent upon the discharge; therefore, the lower 234U/238U values in the stream at site 6 are not surprising [11,20,78,79]. This could also be explained as an effect of the partial oxidation of U(IV) bound to silicate or oxide minerals during weathering, where the alpha recoil effect cannot play such a role [11,20].
δ238U in water varied greatly and far exceeded the range of published δ238U values for river water (on average, −0.34‰ [9,31,80]). For the isotope composition of dissolved U in rivers, the authors hypothesized a smaller range of values than in the source rocks of the continental crust [9,10,28,31,80]. Weyer et al. [10] explained this by the relatively quantitative mobilization of 235U and 238U during weathering and the conservative behavior of U during transport in rivers [10]. U isotope fractionation of up to 1‰ has thus far been reported only for bacterial reduction processes or uptake by biota [15,81,82]. Therefore, the expected isotope fractionation of U during the dissolution of carbonate rocks should be small, and δ238U values in spring and river water should resemble those of the bedrock.
Apart from the sinking stream at site 1, lower δ238U values were associated with low discharge and higher ones, with large discharge; at medium discharge, the measured values scattered rather randomly. The spatial pattern is generally supposed to be consistent with that of the 234U/238U activity ratio; however, this was obviously not the case (Figure 9c). The relatively large variability of δ238U values in the carbonate and non-carbonate fraction of bedrock (Figure 5d) suggests that the partial dissolution of different U pools in the bedrock and the partially variable hydraulic connections at low, medium, and high discharge could be a reason for this scattered δ238U pattern in the spring and stream water in different seasons. Although the δ238U values measured in different fractions of bedrock cannot be taken as respective end members for certain locations as the U budget in the water was accumulated before the water reached that site, their variability could explain differences in δ238U values under different flow conditions generated by U isotope fractionation during incomplete dissolution and incongruent weathering of U [80]. Nevertheless, the inconsistency of the spatial and temporal patterns of δ238U values shows that in such a complex karst aquifer, the δ238U values of water may be influenced by various processes which mask the U fingerprint of the bedrock in the source area.

5. Conclusions

This study showed that classical geochemical tracers of the origin of water (physicochemical parameters, elemental ratios, and alkalinity) in the Ljubljanica River catchment reflect the chemical composition of bedrock and provides some information about the groundwater flow and mixing of water in different parts of the aquifer. The variability of Mg2+/Ca2+ ratios, Na+ and K+ concentrations reflect the variable contributions of weathering of carbonate (limestone and dolomite) and silicate bedrock to the total dissolved loads in the spring and river water, and can explain the groundwater mixing in particular in the upper part of the aquifer. However, the complexity of the karst aquifer, which expands with the increasing water level, results in rather peculiar behavior of the physicochemical parameters and elemental composition of water, which show no straightforward relation to the discharge. Therefore, the interpretation of groundwater flow and mixing in the catchment based on classical geochemical tracers only remains rather uncertain.
U isotopes were used as a non-traditional isotope system to support traditional geochemical and isotopic tracers in an investigation of the origin and flow paths of groundwater. The variability of U concentrations and 234U/238U activity ratios in water was the largest in tributaries that drain areas containing siliciclastic rocks and where dolomite was equally or more abundant than limestone. The 234U/238U activity ratio of water was strongly correlated with the discharge, similar to the contribution of silicate weathering to the groundwater mineralization. The 234U/238U activity ratio was shown to be a useful tracer of groundwater flow and was complementary to general hydrochemical and isotopic parameters [37,42,47] mainly in the headwater region and central part of the studied aquifer. By contrast, in the lower area, the homogenization of the water made the identification of water sources impossible. Similar limitations for the interpretation of flow directions and mixing of water were also encountered previously when using other geochemical tracers. The δ238U values varied in an unexpectedly large range, which cannot be explained within the scope of this study.
Uranium isotopes, in particular the 234U/238U activity ratio, showed considerable potential as a geochemical tracer of groundwater in karst aquifers, but in the present study, they could not outperform the combination of classical geochemical tracers or dyes used in previous studies. Not many studies have been performed so far, but the 234U/238U activity ratio showed by far the best correlation with the discharge of all analyzed tracers. Therefore, they shall remain in the focus as a potential tool in hydrogeological studies in spite of the relatively high costs of U isotope analyses.
The investigated catchment is evidently very complex. To better elucidate the origin of solutes, changing flow paths, and groundwater mixing under changing hydrological conditions, more detailed chemical and isotopic fingerprinting of the bedrock and observation of groundwater chemical and isotopic compositions under different flow conditions over a longer period remains necessary. Moreover, new non-traditional isotope tracers should be tested in the future.

Supplementary Materials

The following are available online at https://0-www-mdpi-com.brum.beds.ac.uk/2073-4441/12/7/2064/s1. Table S1: The physico-chemical parameters, major ion concentrations, and U isotopic compositions related to the sampled water and carbonate rocks for each sampling period, Figure S1: The 234U/238U activity ratio with water discharge for each individual location.

Author Contributions

Conceptualization, L.R., S.L., and M.P.; methodology and analyses, L.R., M.Š., T.Z., T.K., and B.H.; field work: T.K., L.R., M.P., S.R., and S.L.; writing—original draft preparation, L.R.; writing—review and editing, S.L., M.Š., T.K., T.Z., M.P., and S.R.; visualization, L.R., S.L., and M.P.; supervision, M.Š.; funding acquisition, S.L. and S.R. All authors have read and agreed to the published version of the manuscript.

Funding

This research was funded by the Slovenian Research Agency (Research programmes P1-0143 and P2-0075-2, Research projects J1-9179 and J2-7322, and the Young Researcher’s program).

Acknowledgments

The authors thank Stojan Žigon for assisting with the laboratory and field work.

Conflicts of Interest

The authors declare no conflict of interest. The funders had no role in the design of the study; in the collection, analyses, or interpretation of data; in the writing of the manuscript, or in the decision to publish the results.

References

  1. Chen, Z.; Auler, A.S.; Bakalowicz, M.; Drew, D.; Griger, F.; Hartmann, J.; Jiang, G.; Moosdorf, N.; Richts, A.; Stevanovic, Z.; et al. The World Karst Aquifer Mapping project: Concept, mapping procedure and map of Europe. Hydrogeol. J. 2017, 25, 771–785. [Google Scholar] [CrossRef] [Green Version]
  2. Stevanović, Z. Global distribution and use of water from karst aquifers. Geol. Soc. Lond. Spec. Publ. 2018, 466, 217–236. [Google Scholar] [CrossRef]
  3. Hartmann, A.; Goldscheider, N.; Wagener, T.; Lange, J.; Weiler, M. Karst water resources in a changing world: Review of hydrological modeling approaches. Rev. Geophys. 2014, 52, 218–242. [Google Scholar] [CrossRef]
  4. White, W.B. Karst hydrology: Recent developments and open questions. Eng. Geol. 2002, 65, 85–105. [Google Scholar] [CrossRef]
  5. Ravbar, N.; Petrič, M.; Kogovšek, J. The characteristics of groundwater flow in karst aquifers during long lasting low flow conditions, example from SW Slovenia. In Advances in Research in Karst Media. Environmental Earth Sciences; Andreo, B., Carrasco, F., Durán, J., LaMoreaux, J., Eds.; Springer: Berlin/Heidelberg, Germany, 2010; pp. 131–136. [Google Scholar] [CrossRef]
  6. Sappa, G.; Vitale, S.; Ferranti, F. Identifying karst aquifer recharge areas using environmental isotopes: A case study in Central Italy. Geosciences 2018, 8, 351. [Google Scholar] [CrossRef] [Green Version]
  7. Calligaris, C.; Mezga, K.; Slejko, F.; Urbanc, J.; Zini, L. Groundwater characterization by means of conservative (δ18O and δ2H) and non-conservative (87Sr/86Sr) isotopic values: The classical karst region aquifer case (Italy–Slovenia). Geosciences 2018, 8, 321. [Google Scholar] [CrossRef] [Green Version]
  8. Porcelli, D.; Swarzenski, P.W. The behavior of U- and Th-series nuclides in the estuarine environment. Rev. Mineral. Geochem. 2003, 52, 577–606. [Google Scholar] [CrossRef]
  9. Tissot, F.L.H.; Dauphas, N. Uranium isotopic compositions of the crust and ocean: Age corrections, U budget and global extent of modern anoxia. Geochim. Cosmochim. Acta 2015, 167, 113–143. [Google Scholar] [CrossRef] [Green Version]
  10. Weyer, S.; Anbar, A.D.; Gerdes, A.; Gordon, G.W.; Algeo, T.J.; Boyle, E.A. Natural fractionation of 238U/235U. Geochim. Cosmochim. Acta 2008, 72, 345–359. [Google Scholar] [CrossRef]
  11. Chabaux, F.; Riotte, J.; Dequincey, O. U-Th-Ra fractionation during weathering and river transport. Rev. Mineral. Geochem. 2003, 52, 533–576. [Google Scholar] [CrossRef]
  12. Chen, Q.; Liu, S.; He, H.; Tang, J.; Zhao, J.; Feng, Y.; Yang, X.; Zhou, H. Seasonal variations of uranium in karst waters from Northeastern Sichuan, Central China and controlling mechanisms. Geochem. Int. 2020, 58, 103–112. [Google Scholar] [CrossRef]
  13. Cho, B.W.; Choo, C.O. Geochemical behavior of uranium and radon in groundwater of Jurassic granite area, Icheon, Middle Korea. Water 2019, 11, 1278. [Google Scholar] [CrossRef] [Green Version]
  14. Siebert, C.; Möller, P.; Magri, F.; Shalev, E.; Rosenthal, E.; Al-Raggad, M.; Rödiger, T. Applying rare earth elements, uranium, and 87Sr/86Sr to disentangle structurally forced confluence of regional groundwater resources: The case of the Lower Yarmouk Gorge. Geofluids 2019, 2019, 1–21. [Google Scholar] [CrossRef]
  15. Andersen, M.B.; Stirling, C.H.; Weyer, S. Uranium isotope fractionation. Rev. Mineral. Geochem. 2017, 82, 799–850. [Google Scholar] [CrossRef]
  16. Bourdon, B.; Turner, S.; Henderson, G.M.; Lundstrom, C.C. Introduction to U-series geochemistry. Rev. Mineral. Geochem. 2003, 52, 1–21. [Google Scholar] [CrossRef] [Green Version]
  17. Liesch, T.; Hinrichsen, S.; Goldscheider, N. Uranium in groundwater — Fertilizers versus geogenic sources. Sci. Total Environ. 2015, 536, 981–995. [Google Scholar] [CrossRef]
  18. Bischoff, J.L.; Fitzpatrick, J.A. U-series dating of impure carbonates: An isochron technique using total-sample dissolution. Geochim. Cosmochim. Acta 1991, 55, 543–554. [Google Scholar] [CrossRef]
  19. Garnett, E.R.; Gilmour, M.A.; Rowe, P.J.; Andrews, J.E.; Preece, R.C. 230Th/234U dating of Holocene tufas: Possibilities and problems. Quat. Sci. Rev. 2004, 23, 947–958. [Google Scholar] [CrossRef]
  20. Chabaux, F.; Bourdon, B.; Riotte, J. Chapter 3 U-Series geochemistry in weathering profiles, river waters and lakes. Radioact. Environ. 2008, 13, 49–104. [Google Scholar] [CrossRef]
  21. Chen, X.; Romaniello, S.J.; Herrmann, A.D.; Wasylenki, L.E.; Anbar, A.D. Uranium isotope fractionation during coprecipitation with aragonite and calcite. Geochim. Cosmochim. Acta 2016, 188, 189–207. [Google Scholar] [CrossRef] [Green Version]
  22. Kopylova, Y.; Guseva, N.; Shestakova, A.; Khvaschevskaya, A.; Arakchaa, K. Uranium and thorium behavior in groundwater of the natural spa area “Choygan mineral water” (East Tuva). Iop Conf. Ser. Earth Environ. Sci. 2015, 27, 012034. [Google Scholar] [CrossRef] [Green Version]
  23. Fleischer, R.L. Alpha-recoil damage and solution effects in minerals: Uranium isotopic disequilibrium and radon release. Geochim. Cosmochim. Acta 1982, 46, 2191–2201. [Google Scholar] [CrossRef]
  24. Andersen, M.B.; Stirling, C.H.; Porcelli, D.; Halliday, A.N.; Andersson, P.S.; Baskaran, M. The tracing of riverine U in Arctic seawater with very precise 234U/238U measurements. Earth Planet. Sci. Lett. 2007, 259, 171–185. [Google Scholar] [CrossRef]
  25. Andersen, M.B.; Erel, Y.; Bourdon, B. Experimental evidence for 234U–238U fractionation during granite weathering with implications for 234U/238U in natural waters. Geochim. Cosmochim. Acta 2009, 73, 4124–4141. [Google Scholar] [CrossRef]
  26. Uvarova, Y.A.; Kyser, T.K.; Geagea, M.L.; Chipley, D. Variations in the uranium isotopic compositions of uranium ores from different types of uranium deposits. Geochim. Cosmochim. Acta 2014, 146, 1–17. [Google Scholar] [CrossRef]
  27. Suksi, J.; Rasilainen, K.; Pitkänen, P. Variations in 234U/238U activity ratios in groundwater—A key to flow system characterisation? Phys. Chem. Earthparts A/B/C 2006, 31, 556–571. [Google Scholar] [CrossRef]
  28. Stirling, C.H.; Andersen, M.B.; Potter, E.-K.; Halliday, A.N. Low-temperature isotopic fractionation of uranium. Earth Planet. Sci. Lett. 2007, 264, 208–225. [Google Scholar] [CrossRef]
  29. Goldmann, A.; Brennecka, G.; Noordmann, J.; Weyer, S.; Wadhwa, M. The uranium isotopic composition of the Earth and the solar system. Geochim. Cosmochim. Acta 2015, 148, 145–158. [Google Scholar] [CrossRef]
  30. Schauble, E.A. Role of nuclear volume in driving equilibrium stable isotope fractionation of mercury, thallium, and other very heavy elements. Geochim. Cosmochim. Acta 2007, 71, 2170–2189. [Google Scholar] [CrossRef]
  31. Andersen, M.B.; Vance, D.; Morford, J.L.; Bura-Nakić, E.; Breitenbach, S.F.M.; Och, L. Closing in on the marine 238U/235U budget. Chem. Geol. 2016, 420, 11–22. [Google Scholar] [CrossRef]
  32. Huckle, D.; Ma, L.; McIntosh, J.; Vázquez-Ortega, A.; Rasmussen, C.; Chorover, J. U-series isotopic signatures of soils and headwater streams in a semi-arid complex volcanic terrain. Chem. Geol. 2016, 445, 68–83. [Google Scholar] [CrossRef]
  33. Bourdon, B.; Bureau, S.; Andersen, M.B.; Pili, E.; Hubert, A. Weathering rates from top to bottom in a carbonate environment. Chem. Geol. 2009, 258, 275–287. [Google Scholar] [CrossRef]
  34. Palmer, M.R.; Edmond, J.M. Uranium in river water. Geochim. Cosmochim. Acta 1993, 57, 4947–4955. [Google Scholar] [CrossRef]
  35. Goldstein, S.J.; Stirling, C.H. Techniques for measuring uranium-series nuclides: 1992–2002. Rev. Mineral. Geochem. 2003, 52, 23–57. [Google Scholar] [CrossRef]
  36. Wieser, M.E.; Schwieters, J.B. The development of multiple collector mass spectrometry for isotope ratio measurements. Int. J. Mass Spectrom. 2005, 242, 97–115. [Google Scholar] [CrossRef]
  37. Rusjan, S.; Sapač, K.; Petrič, M.; Lojen, S.; Bezak, N. Identifying the hydrological behavior of a complex karst system using stable isotopes. J. Hydrol. 2019, 577, 123956. [Google Scholar] [CrossRef]
  38. Blatnik, M.; Gabrovšek, F.; Kogovšek, B.; Mayaud, C.; Petrič, M.; Ravbar, N. Karst Hydrogeology—Research Trends and Applications: Abstracts & Guide Book; Blatnik, M., Gabrovšek, F., Kogovšek, B., Mayaud, C., Petrič, M., Ravbar, N., Eds.; ZRC Publishing: Ljubljana, Slovenia, 2019. [Google Scholar]
  39. Blatnik, M. Groundwater Distribution in the Recharge Area of Ljubljanica Springs. PhD Thesis, University of Nova Gorica, Nova Gorica, Slovenia, 2019. [Google Scholar]
  40. Pleničar, M. Postojna. In Osnovna geološka karta SFRJ 1: 100.000, list Postojna; (Basic geological map of SFR Yugoslavia 1:100 000, page Postojna); Federal Geological Survey: Belgrade, Serbia, 1970. [Google Scholar]
  41. Pleničar, M. Tolmač lista Postojna L 33-77. In Osnovna geološka karta SFRJ 1 : 100 000; (Commentary to the page Postojna L 33-77, Basic geological map of SFR Yugoslavia 1:100 000); Federal Geological Survey: Belgrade, Serbia, 1967; Volume 62. [Google Scholar]
  42. Ravbar, N.; Barberá, J.A.; Petrič, M.; Kogovšek, J.; Andreo, B. The study of hydrodynamic behaviour of a complex karst system under low-flow conditions using natural and artificial tracers (the catchment of the Unica River, SW Slovenia). Environ. Earth Sci. 2012, 65, 2259–2272. [Google Scholar] [CrossRef]
  43. Frantar, P. Water Balance of Slovenia 1971–2000; Frantar, P., Ed.; Ministry for Environment and Spatial Planning—Environmental Agency of the Republic of Slovenia: Ljubljana, Slovenia, 2008. [Google Scholar]
  44. Petric, M. Case Study: Chapter 10.3—Case study: Characterization, exploitation, and protection of the Malenščica karst spring, Slovenia. In Groundwater Hydrology of Springs; Kresic, N., Stefanovic, Z., Eds.; Elsevier: Oxford, UK, 2010; pp. 428–441. [Google Scholar] [CrossRef]
  45. Gabrovšek, F.; Turk, J. Observations of stage and temperature dynamics in the epiphreatic caves within the catchment area of the Ljubljanica river (Slovenia). Geol. Croat. 2010, 63, 187–193. [Google Scholar] [CrossRef]
  46. Sezen, C.; Bezak, N.; Šraj, M. Hydrological modelling of the karst Ljubljanica River catchment using lumped conceptual model. Acta Hydrotech. 2018, 87–100. [Google Scholar] [CrossRef]
  47. Kogovšek, J. Fizikalno-kemične značilnosti voda v zaledju Malenščice (Slovenija) (Physico-chemical properties of waters in the Malenščica recharge area (Slovenia), in Slovene with English abstract). Acta Carsologica 2004, 33, 143–158. [Google Scholar] [CrossRef]
  48. Blatnik, M.; Mayaud, C.; Gabrovšek, F. Groundwater dynamics between Planinsko Polje and springs of the Ljubljanica River, Slovenia. Acta Carsologica 2019, 48. [Google Scholar] [CrossRef]
  49. Gieskes, J.M. The alkalinity-total carbon dioxide system in seawater. In Marine Chemistry of The Sea; Goldberg, E.D., Ed.; John Wiley and Sons: New York, NY, USA, 1974; Volume 5, pp. 123–151. [Google Scholar]
  50. Parkhurst, D.L.; Appelo, C.A.J. User’s guide to PHREEQC (version 2)—A computer 25 program for speciation, batch-reaction, one-dimensional transport, and inverse geochemical calculations. Water-Resour. Investig. Rep. 1999. [Google Scholar] [CrossRef] [Green Version]
  51. Štrok, M.; Smodiš, B. Fractionation of natural radionuclides in soils from the vicinity of a former uranium mine Žirovski vrh, Slovenia. J. Environ. Radioact. 2010, 101, 22–28. [Google Scholar] [CrossRef]
  52. Trdin, M.; Nečemer, M.; Benedik, L. Fast decomposition procedure of solid samples by lithium borates fusion employing salicylic acid. Anal. Chem. 2017, 89, 3169–3176. [Google Scholar] [CrossRef] [PubMed]
  53. Benedik, L.; Rovan, L.; Klemenčič, H.; Gantar, I.; Prosen, H. Natural radioactivity in tap waters from the private wells in the surroundings of the former Žirovski Vrh uranium mine and the age-dependent dose assessment. Environ. Sci. Pollut. Res. 2015, 22, 12062–12072. [Google Scholar] [CrossRef] [PubMed]
  54. Tanimizu, M.; Sugiyama, N.; Ponzevera, E.; Bayon, G. Determination of ultra-low 236U/238U isotope ratios by tandem quadrupole ICP-MS/MS. J. Anal. At. Spectrom. 2013, 28, 1372. [Google Scholar] [CrossRef] [Green Version]
  55. Rovan, L.; Štrok, M. Optimization of the sample preparation and measurement protocol for the analysis of uranium isotopes by MC-ICP-MS without spike addition. J. Anal. At. Spectrom. 2019, 34, 1882–1891. [Google Scholar] [CrossRef]
  56. Standards for Nuclear Safety Security and Safeguards Unit. Nuclear Certified Reference Materials 2019; Directorate G – Nuclear Safety and Security, European Commission, Directorate General, Joint Research Centre Geel: Geel, Belgium, 2019; Volume 4. [Google Scholar]
  57. Cheng, H.; Lawrence Edwards, R.; Shen, C.C.; Polyak, V.J.; Asmerom, Y.; Woodhead, J.; Hellstrom, J.; Wang, Y.; Kong, X.; Spötl, C.; et al. Improvements in 230Th dating, 230Th and 234U half-life values, and U–Th isotopic measurements by multi-collector inductively coupled plasma mass spectrometry. Earth Planet. Sci. Lett. 2013, 371–372, 82–91. [Google Scholar] [CrossRef]
  58. Szramek, K.; Walter, L.M.; Kanduč, T.; Ogrinc, N. Dolomite versus calcite weathering in hydrogeochemically diverse watersheds established on bedded carbonates (Sava and Soča Rivers, Slovenia). Aquat. Geochem. 2011, 17, 357–396. [Google Scholar] [CrossRef]
  59. Fairchild, I.J.; Borsato, A.; Tooth, A.F.; Frisia, S.; Hawkesworth, C.J.; Huang, Y.; McDermott, F.; Spiro, B. Controls on trace element (Sr–Mg) compositions of carbonate cave waters: Implications for speleothem climatic records. Chem. Geol. 2000, 166, 255–269. [Google Scholar] [CrossRef]
  60. Huang, Y.; Fairchild, I.J. Partitioning of Sr2+ and Mg2+ into calcite under karst-analogue experimental conditions. Geochim. Cosmochim. Acta 2001, 65, 47–62. [Google Scholar] [CrossRef]
  61. Saunders, P.; Rogerson, M.; Wadhawan, J.D.; Greenway, G.; Pedley, H.M. Mg/Ca ratios in freshwater microbial carbonates: Thermodynamic, kinetic and vital effects. Geochim. Cosmochim. Acta 2014, 147, 107–118. [Google Scholar] [CrossRef]
  62. Bauer, F.; Gospodarič, R.; Habič, P. Underground Water Tracing: Investigations in Slovenia 1972–1975; Institute for Karst Research SAZU: Postojna, Slovenia, 1976. [Google Scholar]
  63. Kanduč, T.; Szramek, K.; Ogrinc, N.; Walter, L.M. Origin and cycling of riverine inorganic carbon in the Sava River watershed (Slovenia) inferred from major solutes and stable carbon isotopes. Biogeochemistry 2007, 86, 137–154. [Google Scholar] [CrossRef]
  64. Ravbar, N.; Engelhardt, I.; Goldscheider, N. Anomalous behaviour of specific electrical conductivity at a karst spring induced by variable catchment boundaries: The case of the Podstenjšek spring, Slovenia. Hydrol. Process. 2011, 25, 2130–2140. [Google Scholar] [CrossRef]
  65. Bell, K.G. Uranium in Carbonate Rocks; USGS, Geological Survey professional paper 474-A; U.S.Geological Survey: Washington, DC, USA, 1963; p. 29. [Google Scholar]
  66. Romaniello, S.J.; Herrmann, A.D.; Anbar, A.D. Uranium concentrations and 238U/235U isotope ratios in modern carbonates from the Bahamas: Assessing a novel paleoredox proxy. Chem. Geol. 2013, 362, 305–316. [Google Scholar] [CrossRef]
  67. Herrmann, A.D.; Gordon, G.W.; Anbar, A.D. Uranium isotope variations in a dolomitized Jurassic carbonate platform (Tithonian; Franconian Alb, Southern Germany). Chem. Geol. 2018, 497, 41–53. [Google Scholar] [CrossRef]
  68. Lund, K.; Fogler, H.S.; McCune, C.C. Acidization—I. The dissolution of dolomite in hydrochloric acid. Chem. Eng. Sci. 1973, 28, 691–700. [Google Scholar] [CrossRef]
  69. Kelepertsis, A.E. The geochemistry of uranium and thorium in some Lower Carboniferous sedimentary rocks (Great Britain). Chem. Geol. 1981, 34, 275–288. [Google Scholar] [CrossRef]
  70. Zhang, W.; Guan, P.; Jian, X.; Feng, F.; Zou, C. In situ geochemistry of Lower Paleozoic dolomites in the northwestern Tarim basin: Implications for the nature, origin, and evolution of diagenetic fluids. Geochem. Geophys. Geosyst. 2014, 15, 2744–2764. [Google Scholar] [CrossRef]
  71. Teichert, B.M.A.; Eisenhauer, A.; Bohrmann, G.; Haase-Schramm, A.; Bock, B.; Linke, P. U/Th systematics and ages of authigenic carbonates from Hydrate Ridge, Cascadia Margin: Recorders of fluid flow variations. Geochim. Cosmochim. Acta 2003, 67, 3845–3857. [Google Scholar] [CrossRef]
  72. Wang, R.-M.; You, C.-F. Precise determination of U isotopic compositions in low concentration carbonate samples by MC-ICP-MS. Talanta 2013, 107, 67–73. [Google Scholar] [CrossRef]
  73. Guerrero, J.L.; Vallejos, Á.; Cerón, J.C.; Sánchez-Martos, F.; Pulido-Bosch, A.; Bolívar, J.P. U-isotopes and 226Ra as tracers of hydrogeochemical processes in carbonated karst aquifers from arid areas. J. Environ. Radioact. 2016, 158–159, 9–20. [Google Scholar] [CrossRef] [PubMed]
  74. Riotte, J.; Chabaux, F.; Benedetti, M.; Dia, A.; Gérard, M.; Boulègue, J.; Etamé, J. Uranium colloidal transport and origin of the 234U–238U fractionation in surface waters: New insights from Mount Cameroon. Chem. Geol. 2003, 202, 365–381. [Google Scholar] [CrossRef]
  75. Riotte, J.; Chabaux, F. (234U/238U) activity ratios in freshwaters as tracers of hydrological processes: The Strengbach watershed (Vosges, France). Geochim. Cosmochim. Acta 1999, 63, 1263–1275. [Google Scholar] [CrossRef]
  76. Durand, S.; Chabaux, F.; Rihs, S.; Duringer, P.; Elsass, P. U isotope ratios as tracers of groundwater inputs into surface waters: Example of the Upper Rhine hydrosystem. Chem. Geol. 2005, 220, 1–19. [Google Scholar] [CrossRef]
  77. Schaffhauser, T.; Chabaux, F.; Ambroise, B.; Lucas, Y.; Stille, P.; Reuschlé, T.; Perrone, T.; Fritz, B. Geochemical and isotopic (U, Sr) tracing of water pathways in the granitic Ringelbach catchment (Vosges Mountains, France). Chem. Geol. 2014, 374–375, 117–127. [Google Scholar] [CrossRef]
  78. Grzymko, T.J.; Marcantonio, F.; McKee, B.A.; Mike Stewart, C. Temporal variability of uranium concentrations and 234U/238U activity ratios in the Mississippi river and its tributaries. Chem. Geol. 2007, 243, 344–356. [Google Scholar] [CrossRef]
  79. Amiotte Suchet, P.; Probst, J.-L.; Ludwig, W. Worldwide distribution of continental rock lithology: Implications for the atmospheric/soil CO2 uptake by continental weathering and alkalinity river transport to the oceans. Glob. Biogeochem. Cycles 2003, 17, 1038. [Google Scholar] [CrossRef] [Green Version]
  80. Noordmann, J.; Weyer, S.; Georg, R.B.; Jöns, S.; Sharma, M. 238U/235U isotope ratios of crustal material, rivers and products of hydrothermal alteration: New insights on the oceanic U isotope mass balance. Isot. Environ. Health Stud. 2016, 52, 141–163. [Google Scholar] [CrossRef]
  81. Stylo, M.; Neubert, N.; Wang, Y.; Monga, N.; Romaniello, S.J.; Weyer, S.; Bernier-Latmani, R. Uranium isotopes fingerprint biotic reduction. Proc. Natl. Acad. Sci. USA 2015, 112, 5619–5624. [Google Scholar] [CrossRef] [Green Version]
  82. Chen, X.; Zheng, W.; Anbar, A.D. Uranium isotope fractionation (238U/235U) during U(VI) uptake by freshwater plankton. Environ. Sci. Technol. 2020, 54, 2744–2752. [Google Scholar] [CrossRef] [PubMed]
Figure 1. Topographic map of the Ljubljanica River catchment (black line) with sampling sites adapted from Blatnik et al. [38] Blue lines represent surface streams and red lines represent caves. Blue circles represent sampling sites on sinking streams, red circles represent sampled karst springs. Bedrock samples were collected at the following locations: 1, 3, 4, 5, 6, 7, 8, 12, and 14. The dotted frame represents the area of maps in Figure 2. For more details on sampling locations, see Table 1 and description in the text.
Water 12 02064 g001
Figure 2. (a) Geological (adapted from [39]) and (b) hydrological map (adapted from [38]) of the studied area of Ljubljanica River.
Water 12 02064 g002
Figure 3. Schematic altitude profile of the sampled area; the blue lines represent water levels at high and low water. Adapted from [38].
Water 12 02064 g003
Figure 4. Daily precipitation data during the sampling period for the Postojna meteorological station (2 km south of sampling site 6) with sampling dates (red dotted line). (Source: Slovenian Environment Agency, www.meteo.si).
Water 12 02064 g004
Figure 5. Concentrations of (a) U and (b) Th; (c) activity ratio of 234U/238U; and (d) δ238U value in bulk, leachable, and residual fraction of bedrock samples; Table S1 lists tabulated results and standard uncertainties.
Water 12 02064 g005
Figure 6. Seasonal variations of (a) temperature, (b) pH, (c) conductivity, and (d) redox potential in analyzed water samples; white areas represent sinking streams and grey bars represent karst springs.
Water 12 02064 g006
Figure 7. Concentrations of dissolved (a) Mg2+, (b) Ca2+, and (c) Mg2+/Ca2+ molar ratio and (d) total alkalinity in analyzed water samples; white areas represent sinking streams and grey bars represent karst springs.
Water 12 02064 g007
Figure 8. Concentrations of (a) Na+ and (b) K+ in analyzed water samples; white areas represent sinking streams and grey bars represent karst springs.
Water 12 02064 g008
Figure 9. (a) U concentration, (b) 234U/238U activity ratio, and (c) δ238UCRM112a value in analyzed water samples; white areas represent sinking streams and grey bars represent karst springs.
Water 12 02064 g009
Figure 10. (a) Mg2+ vs. Ca2+ concentrations of the Ljubljanica River catchment and (b) correlation between (Mg2+ + Ca2+) and HCO3 concentration in springs and sinking streams of the Ljubljanica River catchment.
Water 12 02064 g010
Table 1. Coordinate locations (obtained using Google Earth Pro), dominant bedrock lithology, elevations, and discharge (obtained from hydrological services of the Slovenian Environment Agency) of karst springs and sinks.
LocationName of Spring/StreamCoordinates (Google Earth)TypeDominant Bedrock LithologyElevation (m.a.s.l.)Discharge (m3/s)
Min./Max./Mean
1Stržen45°46′14.64″ N, 14°20′10.69″ Esinking streamalluvial sediments550NA1
2Cerkniščica45°47′04.20″ N, 14°20′20.64″ Esinking streamalluvial sediments5500.1/37.3/1.1
3Rak-Mali most45°47′26.28″ N, 14°18′11.81″ Ekarst springlimestone + dolomite5000.003/35.5/4.2
4Rak-Kotliči45°47′21.00″ N, 14°17′42.10″ Ekarst springlimestone + dolomite5000.005/29.9/10.3
5Rak-Veliki most45°47′44.44″ N, 14°17′19.49″ Esinking streamlimestone + dolomite5000.01/45.3/15.7
6Pivka45°46′55.10″ N, 14°12′13.42″ Esinking streamflysch5000.1/43.3/4.3
7Unica-Planina cave45°49′11.48″ N, 14°14′44.72″ Ekarst springlimestone + dolomite4500.3/88.9/15.6
8Malenščica45°49′21.00″ N, 14°15′19.21″ Ekarst springlimestone + dolomite4501.1/11.2/6.6
9Unica-Hasberg45°49′43.45″ N, 14°15′19.21″ Esinking streamalluvial sediments4500.9/90.2/22.2
10Hotenjka45°55′48.69″ N, 14°8′23.83″ Esinking streamalluvial sediments545NA 1
11Logaščica45°54′48.12″ N, 14°13′43.02″ Esinking streamalluvial sediments4750.1/17.2/0.5
12Ljubljanica-Močilnik45°57′19.52″ N, 14°17′32.95″ Ekarst springlimestone3002.6/81.0/31.3
13Ljubljanica-Retovje45°57′15.50″ N, 14°17′57.36″ Ekarst springlimestone3002.6/81.0/31.3
14Ljubljanica-Bistra45°56′48.96″ N, 14°56′48.96″ Ekarst springdolomite3000.9/20.5/7.5
1 NA—data not available.
Table 2. Elemental and semi-quantitative mineral composition of carbonate fraction of bedrock samples.
SiteMg
mg g−1
Ca
mg g−1
Mg/Ca
at. ratio
Si
mg g−1
Al
mg g−1
Na
mg g−1
K
mg g−1
Non-Carbonate
wt%
Calcite
wt%
Dolomite
wt%
14.48387.890.021.3027.241.476.183.911000
33.11386.260.012.669.401.431.054.5099.70.3
44.98386.540.020.6624.352.474.273.161000
53.49388.760.010.3924.352.034.274.181000
63.45389.490.010.7714.091.781.202.931000
76.03380.270.032.8014.092.721.204.8499.60.4
85.63381.730.024.602.071.90BLD *7.20991
1210.42377.690.051.7823.961.454.936.271000
14124.77217.190.955.154.061.09BLD *0.95694
* BLD = below the limit of detection.
Table 3. Main mean values of hydrochemical parameters in sampled springs and sinking streams in five sampling campaigns (October 2017, December 2017, May 2018, March 2018, and August 2018); no data for redox potential is available for August 2018 because the ORP probe was malfunctioning in the field. In parentheses are shown the minimum and the maximum values.
SiteTemperature [°C]pHConductivity [µS cm−1]Redox potential [mV]Total alkalinity [mmol L−1]Ca2+
[mmol L−1]
Mg2+
[mmol L−1]
Mg/Ca molar ratioNa+
[mmol L−1]
K+
[mmol L−1]
SIcalcite
113.28.344861604.41.650.950.50.240.710.91
(3.1–26.0)(8.13–8.59)(332–771)(146–167)(3.30–5.77)(1.37–1.77)(0.38–1.48)(0.21–0.85)(0.07–0.32)(0.02–2.60)(0.81–1.01)
212.18.594311564.361.41.441.120.230.180.79
(2.6–24.7)(8.50–8.70)(294–485)(139–168)(3.74–4.96)(0.64–1.79)(1.35–1.48)(0.63–2.25)(0.16–0.33)(0.03–0.33)(0.18–1.09)
39.28.243801703.961.620.860.490.180.090.66
(3.8–14.2)(7.89–8.54)(338–430)(160–180)(3.02–4.84)(1.41–1.79)(0.15–1.06)(0.25–0.74)(0.08–0.27)(0.01–0.23)(0.41–0.84)
410.88.13221603.371.720.470.250.090.070.59
(4.9–16.9)(7.75–8.47)(215–383)(121–183)(2.95–3.69)(1.37–2.05)(0.39–0.55)(0.19–0.31)(0.07–0.14)(0.02–0.17)(0.33–0.89)
512.68.213381723.591.590.570.350.120.080.71
(4.1–25.7)(7.75–8.65)(259–387)(160–186)(3.20–3.83)(1.21–1.92)(0.44–0.75)(0.20–0.62)(0.08–0.21)(0.02–0.21)(0.34–1.05)
612.283861733.571.970.180.080.480.350.58
(4.6–22.6)(7.63–8.40)(341–450)(144–196)(2.73–4.41)(1.74–2.12)(0.16–0.21)(0.06–0.10)(0.28–0.81)(0.04–0.66)(0.05–0.94)
79.68.083491583.581.840.350.180.280.150.61
(5.7–12.9)(7.61–8.42)(276–396)(136–181)(3.37–3.73)(1.69–2.14)(0.27–0.40)(0.10–0.22)(0.19–0.38)(0.02–0.32)(0.3–0.97)
88.48.073561593.591.750.440.230.250.090.56
(5.1–11.9)(7.57–8.42)(340–404)(123–203)(3.23–3.84)(1.51–2.04)(0.26–0.60)(0.13–0.33)(0.08–0.88)(0.03–0.21)(0.20–0.86)
99.27.994191593.641.810.490.260.260.10.51
(5.1–12.3)(7.69–8.37)(342–650)(137–177)(3.39–3.90)(1.63–2.12)(0.39–0.60)(0.14–0.37)(0.09–0.73)(0.02–0.18)(0.24–0.84)
1011.88.483831614.371.361.290.880.070.040.95
(4.6–23)(8.26–8.56)(284–439)(145–172)(4.04–4.95)(1.07–1.54)(1.20–1.39)(0.60–1.12)(0.03–0.14)(0.03–0.09)(0.73–1.15)
1110.28.444291504.381.521.310.770.130.070.94
(4.8–19.3)(8.17–8.61)(414–441)(124–174)(4.11–4.80)(1.34–1.65)(1.23–1.39)(0.60–0.84)(0.10–0.19)(0.04–0.11)(0.68–1.08)
129.47.943441643.351.720.530.280.360.110.4
(6.7–11.5)(7.54–8.33)(283–400)(140–186)(2.88–3.76)(1.44–2.43)(0.32–0.75)(0.20–0.39)(0.17–1.00)(0.02–0.28)(0.22–0.68)
1310.67.93581673.721.810.480.250.210.080.44
(6.9–14.2)(7.50–8.17)(307–419)(150–185)(3.11–4.26)(1.65–2.19)(0.32–0.66)(0.18–0.40)(0.11–0.33)(0.02–0.23)(0.16–0.79)
1411.37.753741774.061.830.590.30.180.050.35
(7.8–14.7)(7.52–7.91)(315–429)(150–199)(3.79–4.55)(1.72–2.03)(0.54–0.32)(0.20–0.35)(0.10–0.23)(0.02–0.11)(0.18–0.52)
Table 4. Pearson correlation coefficient (r) between discharge and measured parameters in water from the Ljubljanica River catchment; statistically significant correlations (r2 > 0.6) are highlighted.
Parameter/Site2345678911121314
Temperature−0.96−0.93−0.89−0.81−0.93−0.97−0.64−0.980.44−0.87−0.94−0.85
pH0.900.770.800.570.250.380.060.900.680.110.19−0.18
Conductivity0.64−0.500.240.20−0.740.150.04−0.56−0.28−0.20−0.210.57
Tot. alkalinity0.77−0.83−0.24−0.79−0.63−0.79−0.39−0.580.83−0.47−0.96−0.69
Sicalcit−0.330.650.820.33−0.310.260.040.880.85−0.10−0.16−0.66
Mg2+−0.50−0.99−0.23−0.540.350.230.870.02−0.34−0.83−0.910.57
Ca2+0.870.780.430.330.640.130.660.09−0.78−0.11−0.07−0.01
Na+−0.55−0.54−0.10−0.09−0.87−0.61−0.63−0.250.01−0.300.510.26
K+0.36−0.520.50−0.150.84−0.650.910.76−0.190.280.55−0.10
Altot−0.55−0.23−0.36−0.02−0.40−0.350.720.700.010.07−0.020.18
Utot0.54−0.830.190.10−0.480.210.270.18−0.59−0.82−0.870.34
Mg2+/Ca2+−0.79−0.98−0.59−0.49−0.350.120.83−0.070.58−0.94−0.750.60
δ238U1.000.250.510.59−0.410.500.870.590.180.600.590.75
234U/238U0.86−0.90−0.86−0.87−0.89−0.49−0.91−0.930.13−0.95−0.95−0.90

