The Impact of Biophysical Processes on Sediment Transport in the Wax Lake Delta (Louisiana, USA)


1
Department of Oceanography and Coastal Science, Louisiana State University, Baton Rouge, LA 70803, USA
2
Coastal Studies Institute, Louisiana State University, Baton Rouge, LA 70803, USA
*
Authors to whom correspondence should be addressed.
†
Present Address: Bureau of Ocean Energy Management, 45600 Woodland Road, Sterling, VA 20166, USA.
Water 2020, 12(7), 2072; https://0-doi-org.brum.beds.ac.uk/10.3390/w12072072
Submission received: 11 June 2020
/
Revised: 14 July 2020
/
Accepted: 15 July 2020
/
Published: 21 July 2020
(This article belongs to the Special Issue Observation and Numerical Modeling of Sediment Transport in Coastal Areas)
Abstract
:Sediment transport in coastal regions is regulated by the interaction of river discharge, wind, waves, and tides, yet the role of vegetation in this interaction is not well understood. Here, we evaluated these variables using multiple acoustic and optical sensors deployed for 30–60 days in spring and summer/fall 2015 at upstream and downstream stations in Mike Island, a deltaic island within the Wax Lake Delta, LA, USA. During a flooding stage, semidiurnal and diurnal tidal impact was minimal on an adjacent river channel, but significant in Mike Island where vegetation biomass was low and wave influence was greater downstream. During summer/fall, a “vegetated channel” constricted the water flow, decreasing current speeds from ~13 cm/s upstream to nearly zero downstream. Synchrony between the upstream and downstream water levels in spring (R2 = 0.91) decreased in summer/fall (R2 = 0.84) due to dense vegetation, which also reduced the wave heights from 3–20 cm (spring) to nearly 0 cm (summer/fall). Spatial and temporal differences in total inorganic nitrogen and orthophosphate concentrations in the overlying and sediment porewater were evident as result of vegetation growth and expansion during summer/fall. This study provides key hourly/daily data and information needed to improve the parameterization of biophysical models in coastal wetland restoration projects.
1. Introduction
The Mississippi River delta plain is a complex and dynamic environment, regulated by the influx of water, sediment, nutrients and carbon from the Mississippi and Atchafalaya Rivers [1]. Several natural and anthropogenic factors affect this coastal environment, including rising relative sea level, reduced sediment supply, high subsidence rates, significant saltwater intrusion, coastal eutrophication, and oil and gas extraction [2,3,4,5,6]. One of the major outcomes from the spatiotemporal interaction among these natural and human impacts over the last 80 years is the extensive loss of approximately 4877 km2 of productive wetland [4,7,8].
Given the wetland’s economic value, several initiatives to restore and rehabilitate wetlands have been proposed since the late 1980s, such as the use of sediment diversions and local dredging [3,9,10,11,12,13]. Sediment diversions in Louisiana use a combination of new channels and structures to divert sediment and freshwater from the Mississippi and Atchafalaya Rivers into adjacent basins to build new land and slow down land loss. However, the success of these projects heavily depends on both the presence of vegetation and plant–sediment interactions controlling sediment trapping efficiency to gain elevation and build land. When artificial planting is used in combination with natural wetland creation or sediment diversions, vegetation can potentially uptake nutrients, slow down velocity, trap mud, and enhance mud retention to build additional land [3]. Thus, the study of plant–sediment interactions has both management and economic implications for current and future coastal wetland restoration plans in coastal Louisiana and other areas around the world.
Current diversions in the Mississippi River delta plain are not only introducing freshwater and sediment, but also carbon and nutrients to both estuarine and wetland areas. These nutrient inputs into wetlands have several fates, including vegetation uptake, deposition and burial, oxidation or reduction within the sediment, and export to the Gulf of Mexico (GOM) [14,15]. Since nitrogen and phosphorus loading rates are high, the role of wetlands as sinks and transformers of inorganic nutrients is critical to avoid eutrophic conditions in the GOM where hypoxic conditions are a dominant feature, particularly during the summer [16,17,18,19,20,21,22,23,24]. Therefore, understanding nutrient cycling, particularly nutrient removal by wetlands, is critical to the ongoing biogeochemical modeling effort by the Coastal Protection and Restoration Authority of Louisiana to evaluate the effectiveness and ecological impacts of sediment diversions [25].
Wetland vegetation can attenuate waves, reduce current speeds, protect the shoreline from storm surge, reduce turbidity and promote sediment deposition [26,27,28,29,30,31,32,33]. Water velocity within a vegetated area is reduced through drag and frictional force that promotes sediment deposition and retention [13,26,28,30]. When a water parcel enters a vegetated bed, the velocity can be dampened by an order of magnitude and further decline with increasing vegetation density [26,27,33]. In fact, fine sediment deposition is generally associated with vegetative growth [21,31,34] and overall net accretion [30].
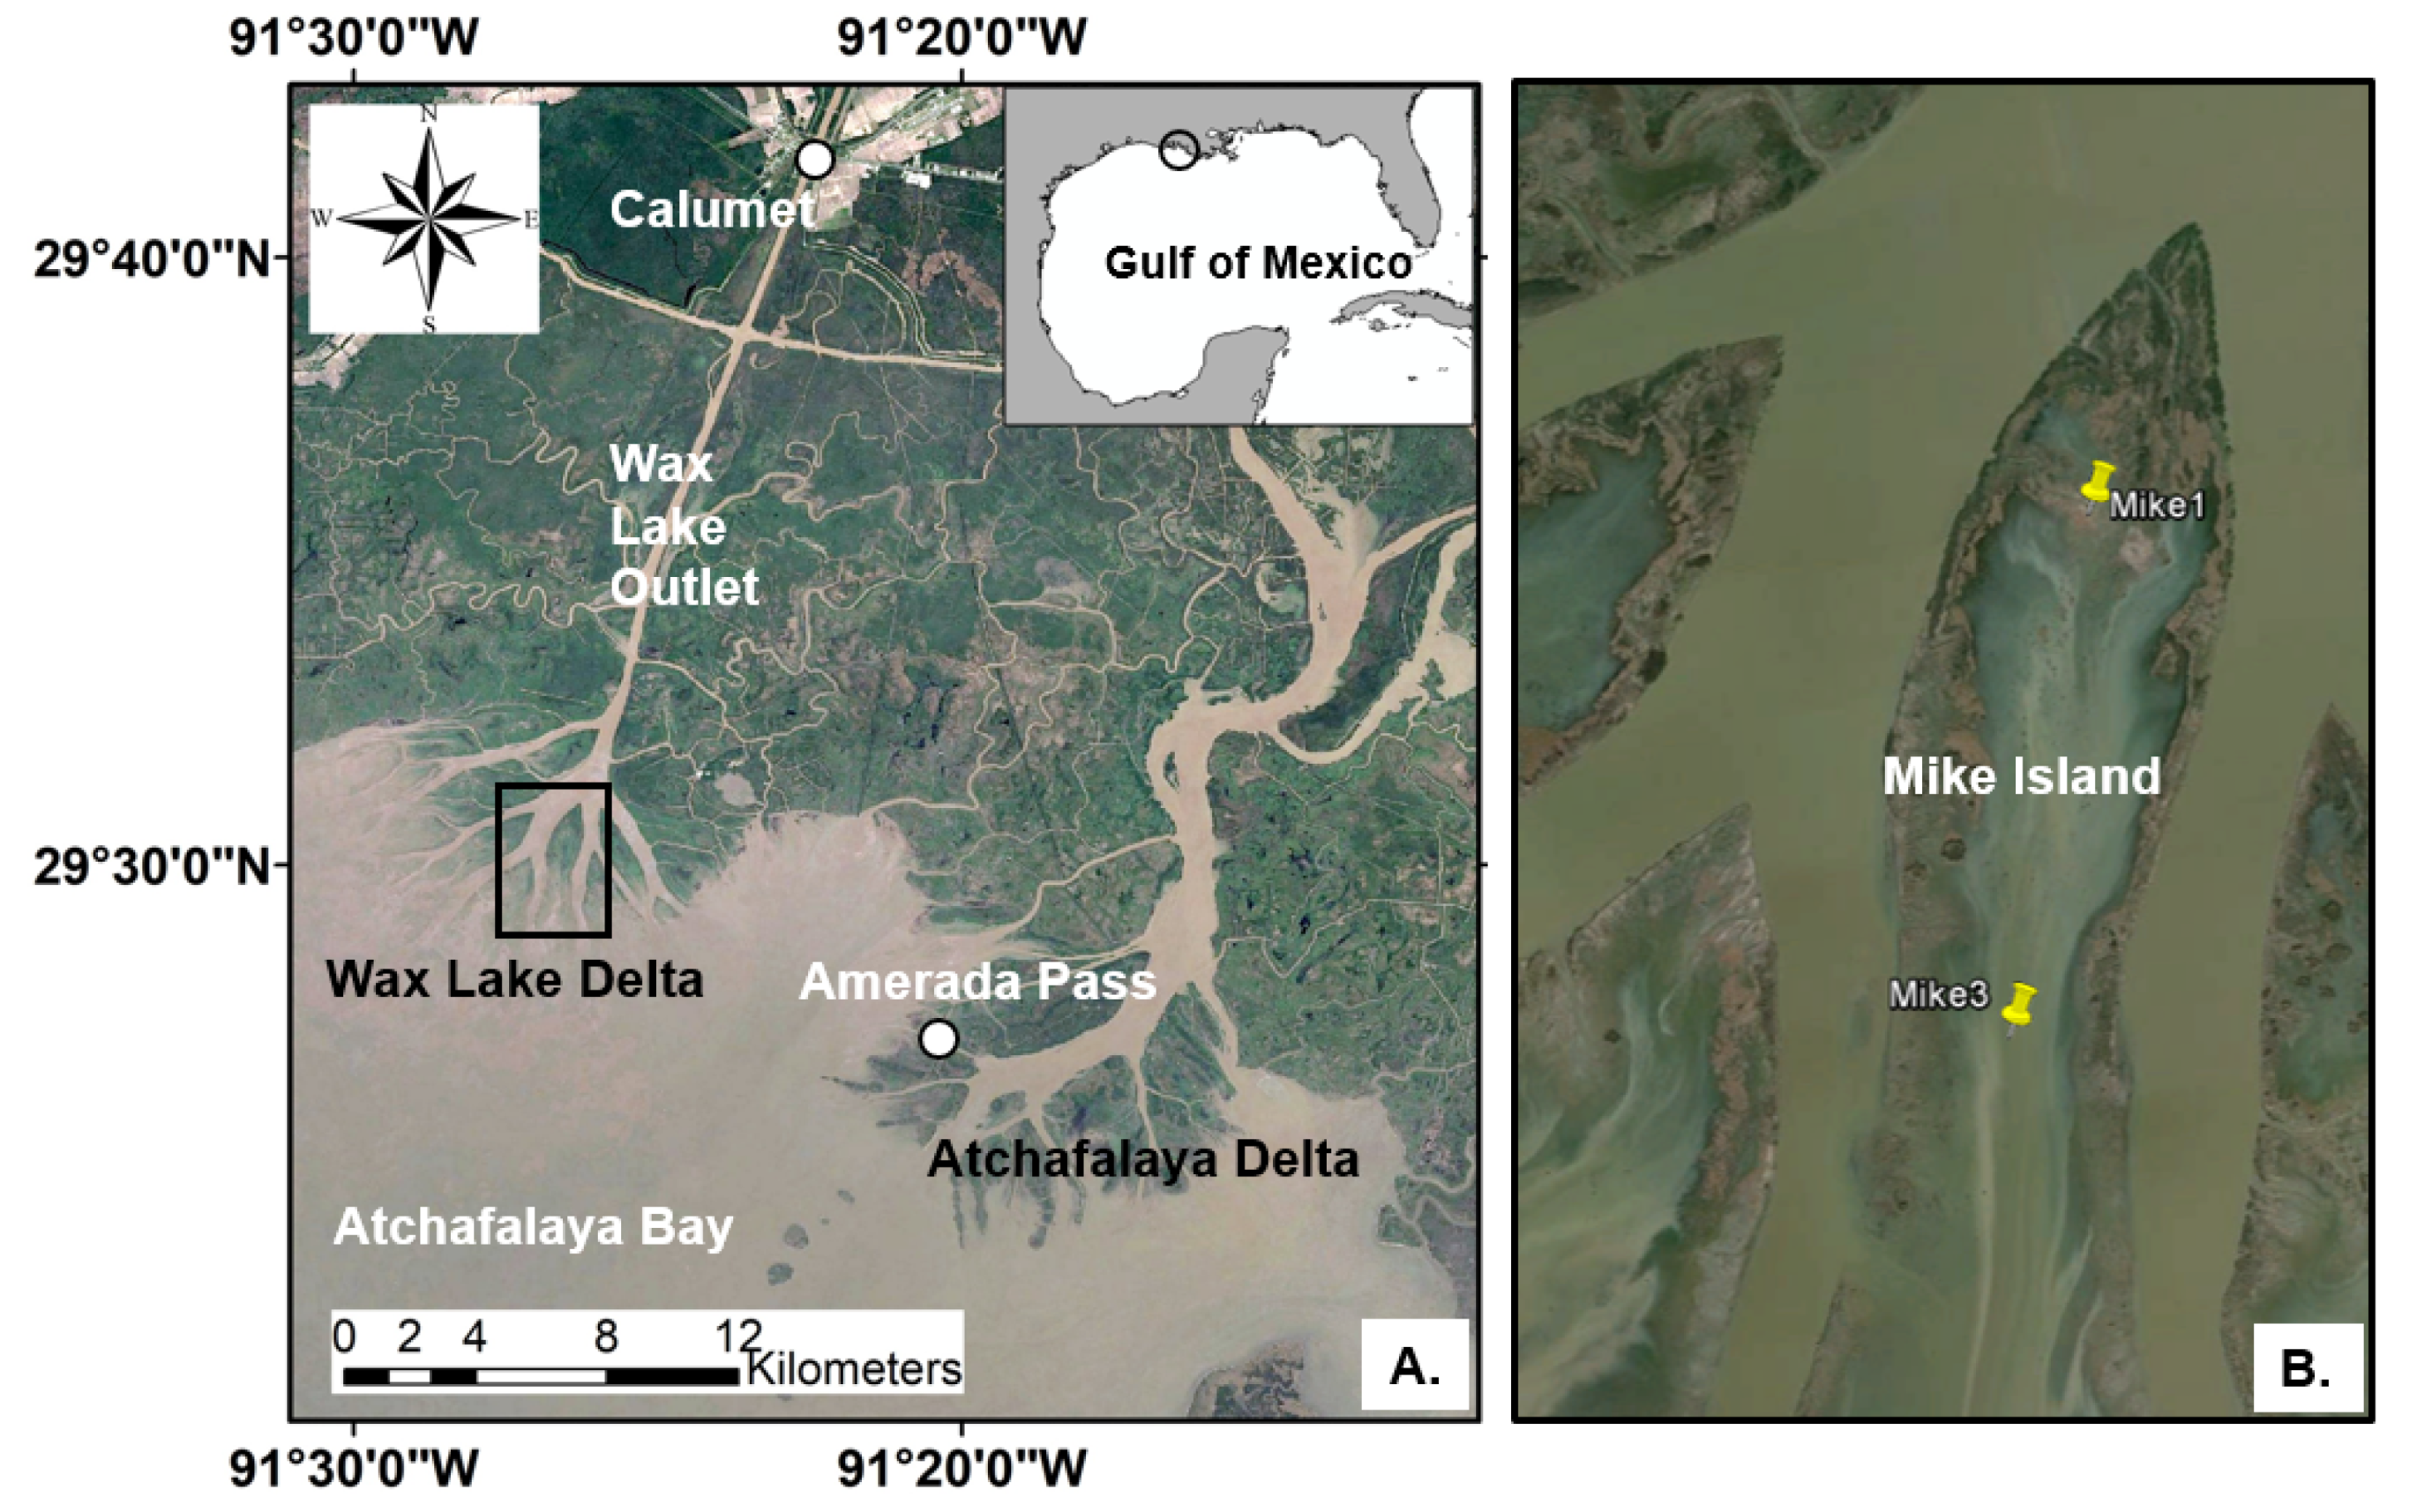
The Wax Lake Delta (WLD, Figure 1A) is a relatively recent prograding delta controlled by the Mississippi–Atchafalaya River basin, and largely influenced by seasonal river pulses, tides, winds, and cold fronts [35,36]. This area provides a unique environmental setting to evaluate how the local hydrology, sediment transport, and vegetation density interact to impact sediment transport in an accreting delta. The main objective of this study is to evaluate the interactions between physical and biogeochemical processes that control sediment deposition in the WLD at a local scale. The WLD consists of several lobes of different ages forming well defined interdistributary bays. Mike Island (Figure 1B), a deltaic island located in the middle of the WLD, is within one of the oldest lobes where the vegetation comprises complex associations of marshes and forested wetlands that are distributed along conspicuous elevation gradients. Mike Island is directly impacted by both sediment inputs from the main channel (Wax Lake Outlet, Figure 1A) and episodic storm surges [36,37,38]. The northern region of Mike Island has a small secondary channel (northwest of station Mike1 on Figure 1B) providing an entry point for water, sediment and nutrients from a primary channel to the interior of the island [39,40,41]. Approximately 23–54% of the flow from the primary channel enters the island via secondary channels and overbank flooding [39]. The tidal force also drives the sediment input and deposition [40] and is a controlling factor in the water flow direction within secondary channels in the WLD [39]. Vegetation aboveground biomass is highly seasonal with a peak productivity at the end of summer, and as a result, surficial water flow can be greatly modified, increasing the water residence time. During winter, when vegetation density and aboveground biomass is sparse and distributed in small patches, uninterrupted water flow increases.
We posed two overarching research questions of this study; first, what are the roles of wind, river discharge, waves, tides and vegetation in controlling sediment transport between an upstream and downstream location along Mike Island? How do these roles change in contrasting seasons and during river floods and cold fronts? We hypothesize that during spring, when river discharge is high and vegetation biomass is low, river discharge will be a dominant driver regulating sediment transport. Thus, the upstream location on Mike Island will be more influenced by river discharge while the downstream location will be more influenced by wave forcing due to the closer proximity to the semi-enclosed Atchafalaya Bay (Figure 1A). During summer/fall, when river discharge is low and vegetation biomass is high, velocity will drop and wave impact will be minimal. Furthermore, episodic sediment accumulation on wetlands will occur during energetic events (e.g., cold fronts). The second question is: how does the plant–sediment interaction impact nutrient concentrations at the upstream and downstream locations during contrasting seasons? We hypothesize that overlying water NO3− and PO43− concentrations will be low during the summer/fall when river discharge is low and vegetation is dense and widespread, while the NH4+ concentrations in sediment porewater will be high due to remineralization.
2. Materials and Methods
2.1. Study Area
If the Mississippi River were to naturally change its course, the next primary delta lobe would be in the Atchafalaya Bay area (Figure 1A), considering its short distance to the shoreline and steep gradient along that route [42,43]. In 1941, the U.S. Army Corps of Engineers constructed the Wax Lake Outlet (WLO, Figure 1A), diverting water from the Atchafalaya River to the northern Gulf of Mexico to suppress flooding in Morgan City, Louisiana [42,44,45]. Although not the original purpose of the man-made WLO, subaqueous land began to form in 1952 as channelized sediment began to fill into the Atchafalaya Bay; in 1973, this land became subaerial creating the WLD [42,44,45]. The Old River Control Structure, which was constructed in 1963, currently diverts 30% of the combined flow of the Mississippi and Red Rivers to the Atchafalaya River [35,44,46]. Although the WLO was man-made, the WLD has continued to self-organize and grow naturally without the need for dredging or leveeing since 1973 [44,45]. Previous work using radionuclides (7Be) indicates that high flooding conditions can result in up to 5 cm of flood sediment deposition (~0–2 cm/year) in some vegetated areas of the WLD [47].
2.2. Sampling Locations in Mike Island
Time series of velocity, water level, turbidity and nutrient data were collected using six platform stations located on Mike Island and monitored by the Frontiers in Earth System Dynamics (FESD-National Science Foundation) project [40,48,49]. Two of these six platforms were used for our study. The Mike1 station is located at the north end of the island and close to a secondary channel where pulsing river discharge enters the island (Figure 1B). The other station, Mike3, is in the interior of the island, about 1.5 km south of Mike1 (Figure 1B). In a normal river discharge condition, the river flows into Mike Island through a secondary channel, passing the upstream station (Mike1) before reaching the downstream station (Mike3). This flow direction, however, can be reversed during storm events or when river discharge is low and strong flooding tidal currents come from the GOM [23].
2.3. Wind and Discharge Data
Data collected from the nearby National Oceanic and Atmospheric Administration (NOAA) and United States Geological Survey (USGS) stations were used to evaluate the wind speed and direction, as well as river discharge. River discharge and gauge height were obtained from the Wax Lake Outlet station in Calumet, located approximately 20 km upstream of Mike Island (USGS-07381590, 29°41′52″ N, 91°22′22″ W) (Figure 1A). Wind speed and direction data were downloaded from NOAA’s National Data Buoy Center station, located at Amerada Pass on Atchafalaya Delta (NOAA-8764227, 29°26′58″ N, 91°20′17″ W), approximately 12 km southeast of Mike Island (Figure 1A).
2.4. Field and Laboratory Methods
2.4.1. Time-Series Observation
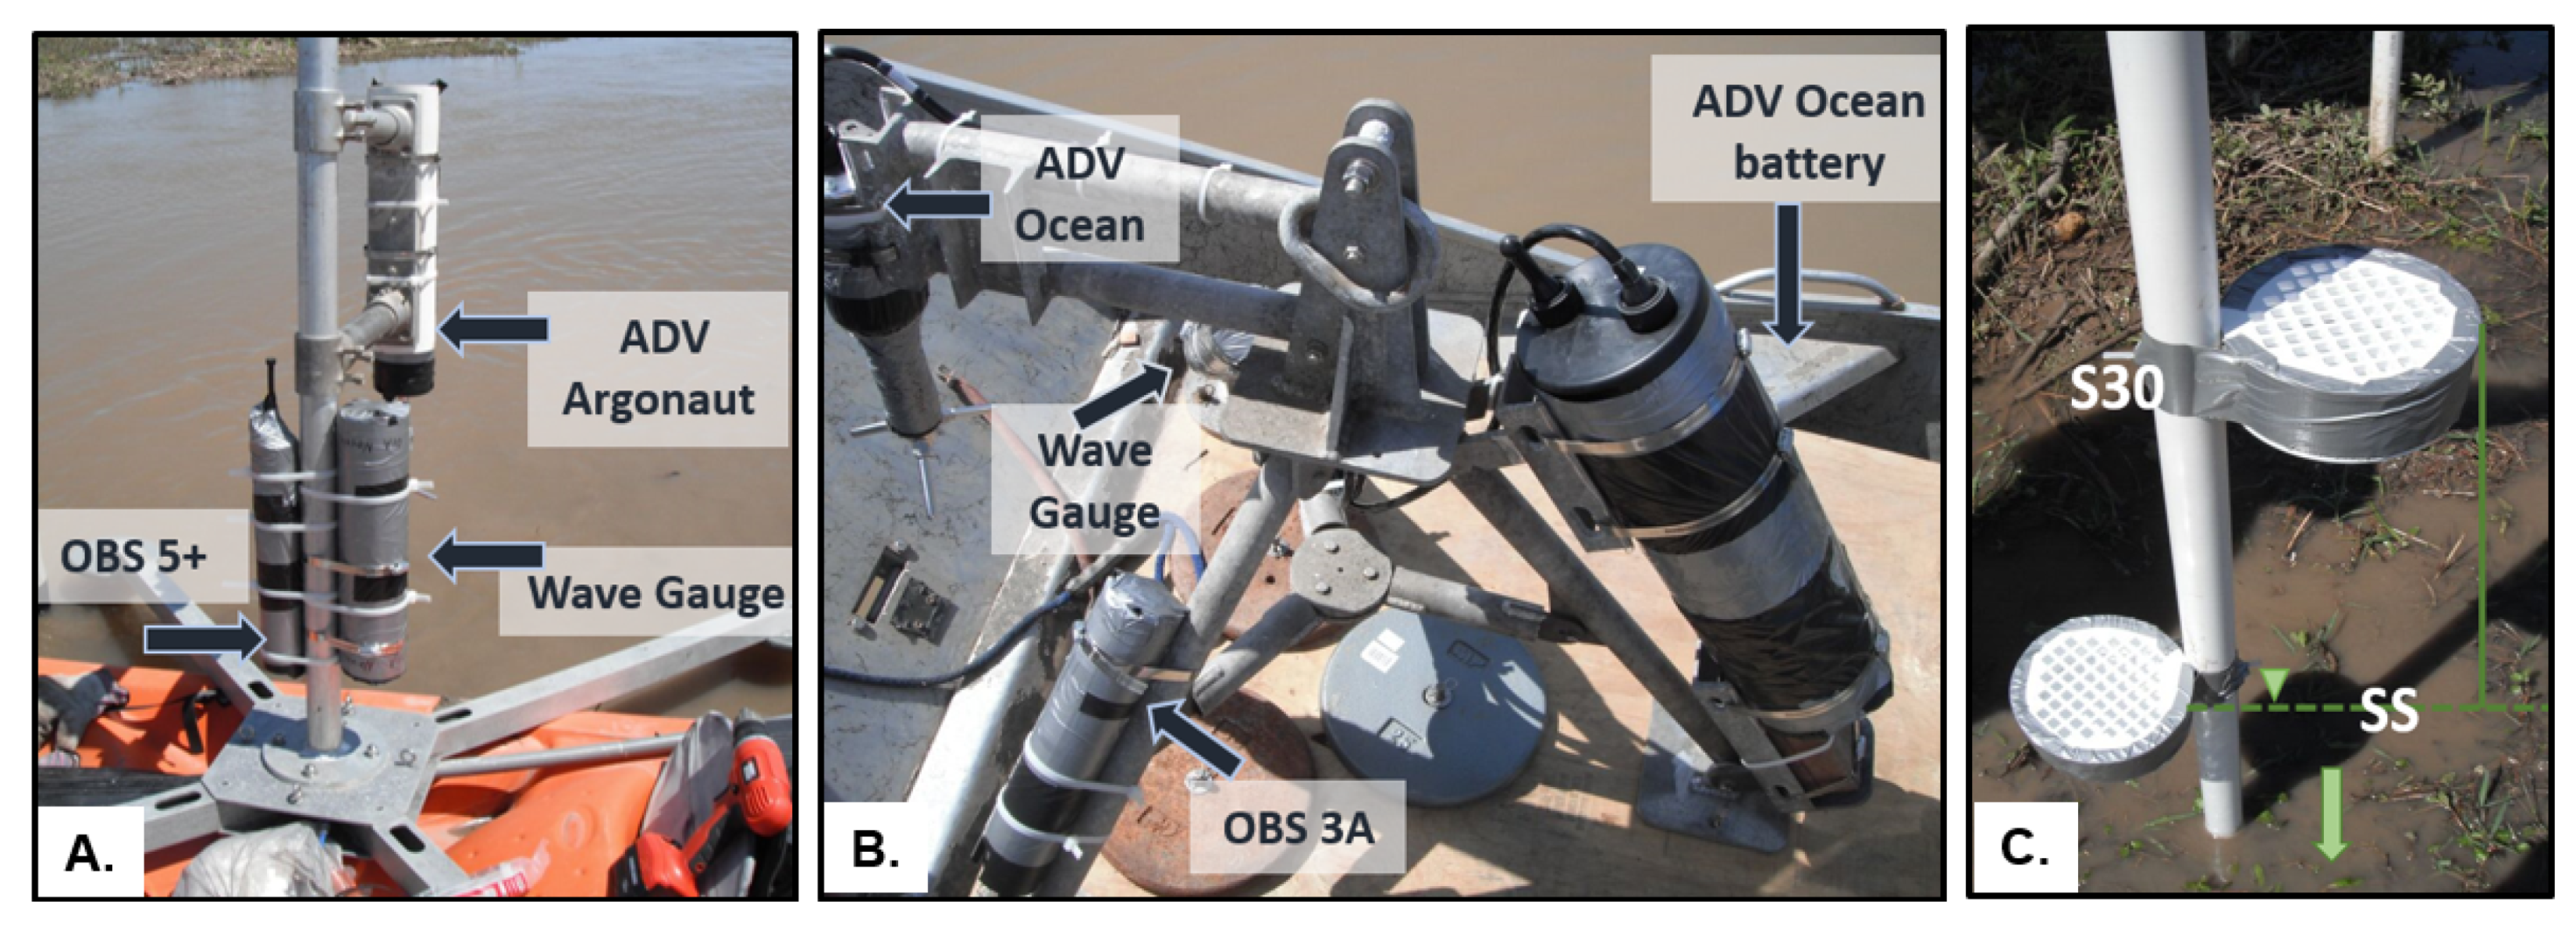
An array of acoustic and optical sensors was deployed in the spring and summer/fall seasons of 2015. The objective of these hourly deployments was to identify the spatiotemporal variations in twater level, velocity, turbidity, and waves. The spring deployment period was from 29 March to 2 May 2015 (hereafter April 2015) and the summer/fall deployment period was from 28 August to 22 October 2015 (hereafter September–October 2015) to investigate seasonal differences in river discharge, vegetation biomass and density. In both periods, an X-shaped platform was deployed at the Mike1 station and included an acoustic Doppler velocimeter (ADV) Argonaut (SonTek, San Diego, CA, USA), optical backscatter sensor (OBS) 5+ (Campbell Scientific, Logan, UT, USA), and a wave gauge (Ocean Sensor Systems, Inc., Coral Springs, FL, USA) (Figure 2A). In the case of the Mike3 platform, a tripod was used to mount an ADV Ocean (SonTek), OBS 3A (Campbell Scientific), and a wave gauge (Ocean Sensor Systems, Inc.) to compare hydrology and sediment transport (Figure 2B). The variables measured in both sites are listed in Table 1.
2.4.2. Water Sampling and Analysis
In situ water samples were collected near the sediment surface and in the middle of the water column for measurement of total suspended solid (TSS) using 2 L water bottles at Mike1 and Mike3 in March, May, August, and October of 2015. Water samples were stored in a cold room (4 °C) until filtration when the water was passed through a pre-weighed Whatman glass fiber filter with a 125 mm diameter and 0.7 μm pore size. The filter was then dried at 60 °C for 48 h and reweighed to determine suspended solid values.
Overlying water approximately 10 cm above the water–sediment interface and porewater at 30 cm below the sediment surface were collected at Mike1 and Mike3 in vegetated and non-vegetated areas during March, May, August and October 2015 to measure inorganic nutrients (hereafter, referred to as the overlying and porewater values, respectively). Two 50 mL centrifuge tubes were collected at the vegetated and non-vegetated locations. The water was filtered in the field and stored in a cooler (4 °C) during transport to the laboratory the same day, where it was stored in a freezer until analysis of the inorganic nutrients (NO2−, NO3−, NH4+, and PO43−) was completed within 1–3 days of collection. Nutrient concentrations were determined at the Wetland Biogeochemistry Analytical Services of Louisiana State University (LSU) via a segmented flow analysis using a Flow Solution IV AutoAnalyzer (OI Analytical, College Station, TX, USA).
2.4.3. Sediment Sampling and Analysis
During the spring 2015 instrument deployment, a prototype sediment trap was tested and deployed at the Mike1 and Mike3 platforms. This trap consisted of two polyvinyl chloride (PVC) caps that were 4.45 cm in height and 10 cm in diameter (total volume ~350 cm3), and drain inserts placed on opposite sides of a 2.5 cm diameter PVC pipe (see Figure 2C). One sediment trap was flushed with the sediment surface (hereafter “S-S”) and the other was located 30 cm above the sediment surface (hereafter “S-30”) (Figure 2C). During the summer/fall deployment, triplicate sediment traps were deployed at Mike1 and Mike3. At the end of each deployment, the sediment traps were stored in a cold room (4 °C) until further analysis. In the laboratory, the sediment deposited in the trap was placed into a beaker to estimate the total volume of sediment or slurry, homogenized, and was then separated into two smaller beakers for loss-on-ignition and nutrient analysis. Another aliquot was placed in a centrifuge tube for grain size analysis. The sediment was weighed in a beaker before and after it was placed in an oven for at least 48 h to measure bulk density. The material in one beaker was placed in a muffler furnace at 550 °C for 2.5 h to eliminate organic matter [50] while the sediment in the other beaker was ground and packed for analysis of the total carbon (TC), nitrogen (TN) and phosphorus (TP) concentrations. TC and TN were determined on two analytical replicates with an elemental combustion system (ECS) 4010 (Costech Analytical Technologies, Inc., Valencia, CA, USA). TP was extracted on duplicate core samples with 1 N HCL after combustion in a furnace at 550 °C [51] and determined by colorimetric analysis using a segmented flow analysis Flow Solution IV AutoAnalyzer (OI Analytical, College Station, TX, USA).
2.5. Data Analysis
Data collected from the acoustic and optical sensors were plotted and analyzed using MATLAB software. Relative water levels at Mike1 and Mike3 were calculated by subtracting the means from the measured levels using wave gauges. Water level data from Calumet, Mike1, and Mike3 in spring and summer/fall 2015 were analyzed using the Fast Fourier Transform (FFT) function in MATLAB to quantify periodicities. Coefficients of determination (R2) between the water levels in Mike1 and Mike3 were also calculated. Wave data were analyzed using a toolbox developed by Karimpour and Chen [52], and the averages and standard deviations of each period were quantified. Two-factor analysis of variance (ANOVA) tests were run on all biogeochemical data to determine the significance of each group/factor and their interaction in our experimental design using JMP Pro 12 (SAS Institute, Cary, NC, USA). In the case of the sediment trap data, trap location (upstream, downstream), collection location (water column, sediment surface), and their interaction were considered fixed factors to determine the differences in TN, TC, TP, and bulk density. Nutrient concentrations in the surface and porewaters were analyzed by the following factors: location (upstream, downstream), month of collection (May, October), vegetation presence (yes, no) and water source (overlying, porewater), and their interaction. The water nutrient data were log-transformed and evaluated for normality and sample size prior to the statistical analyses [53]. The response variables for the water nutrients were total inorganic nitrogen (TIN = NO2− + NO3− + NH4+) and PO43−. Tukey honest significant difference tests were run on significant interactions when appropriate. All significant results were determined by an alpha value = 0.05.
3. Results
3.1. Water Column Processes
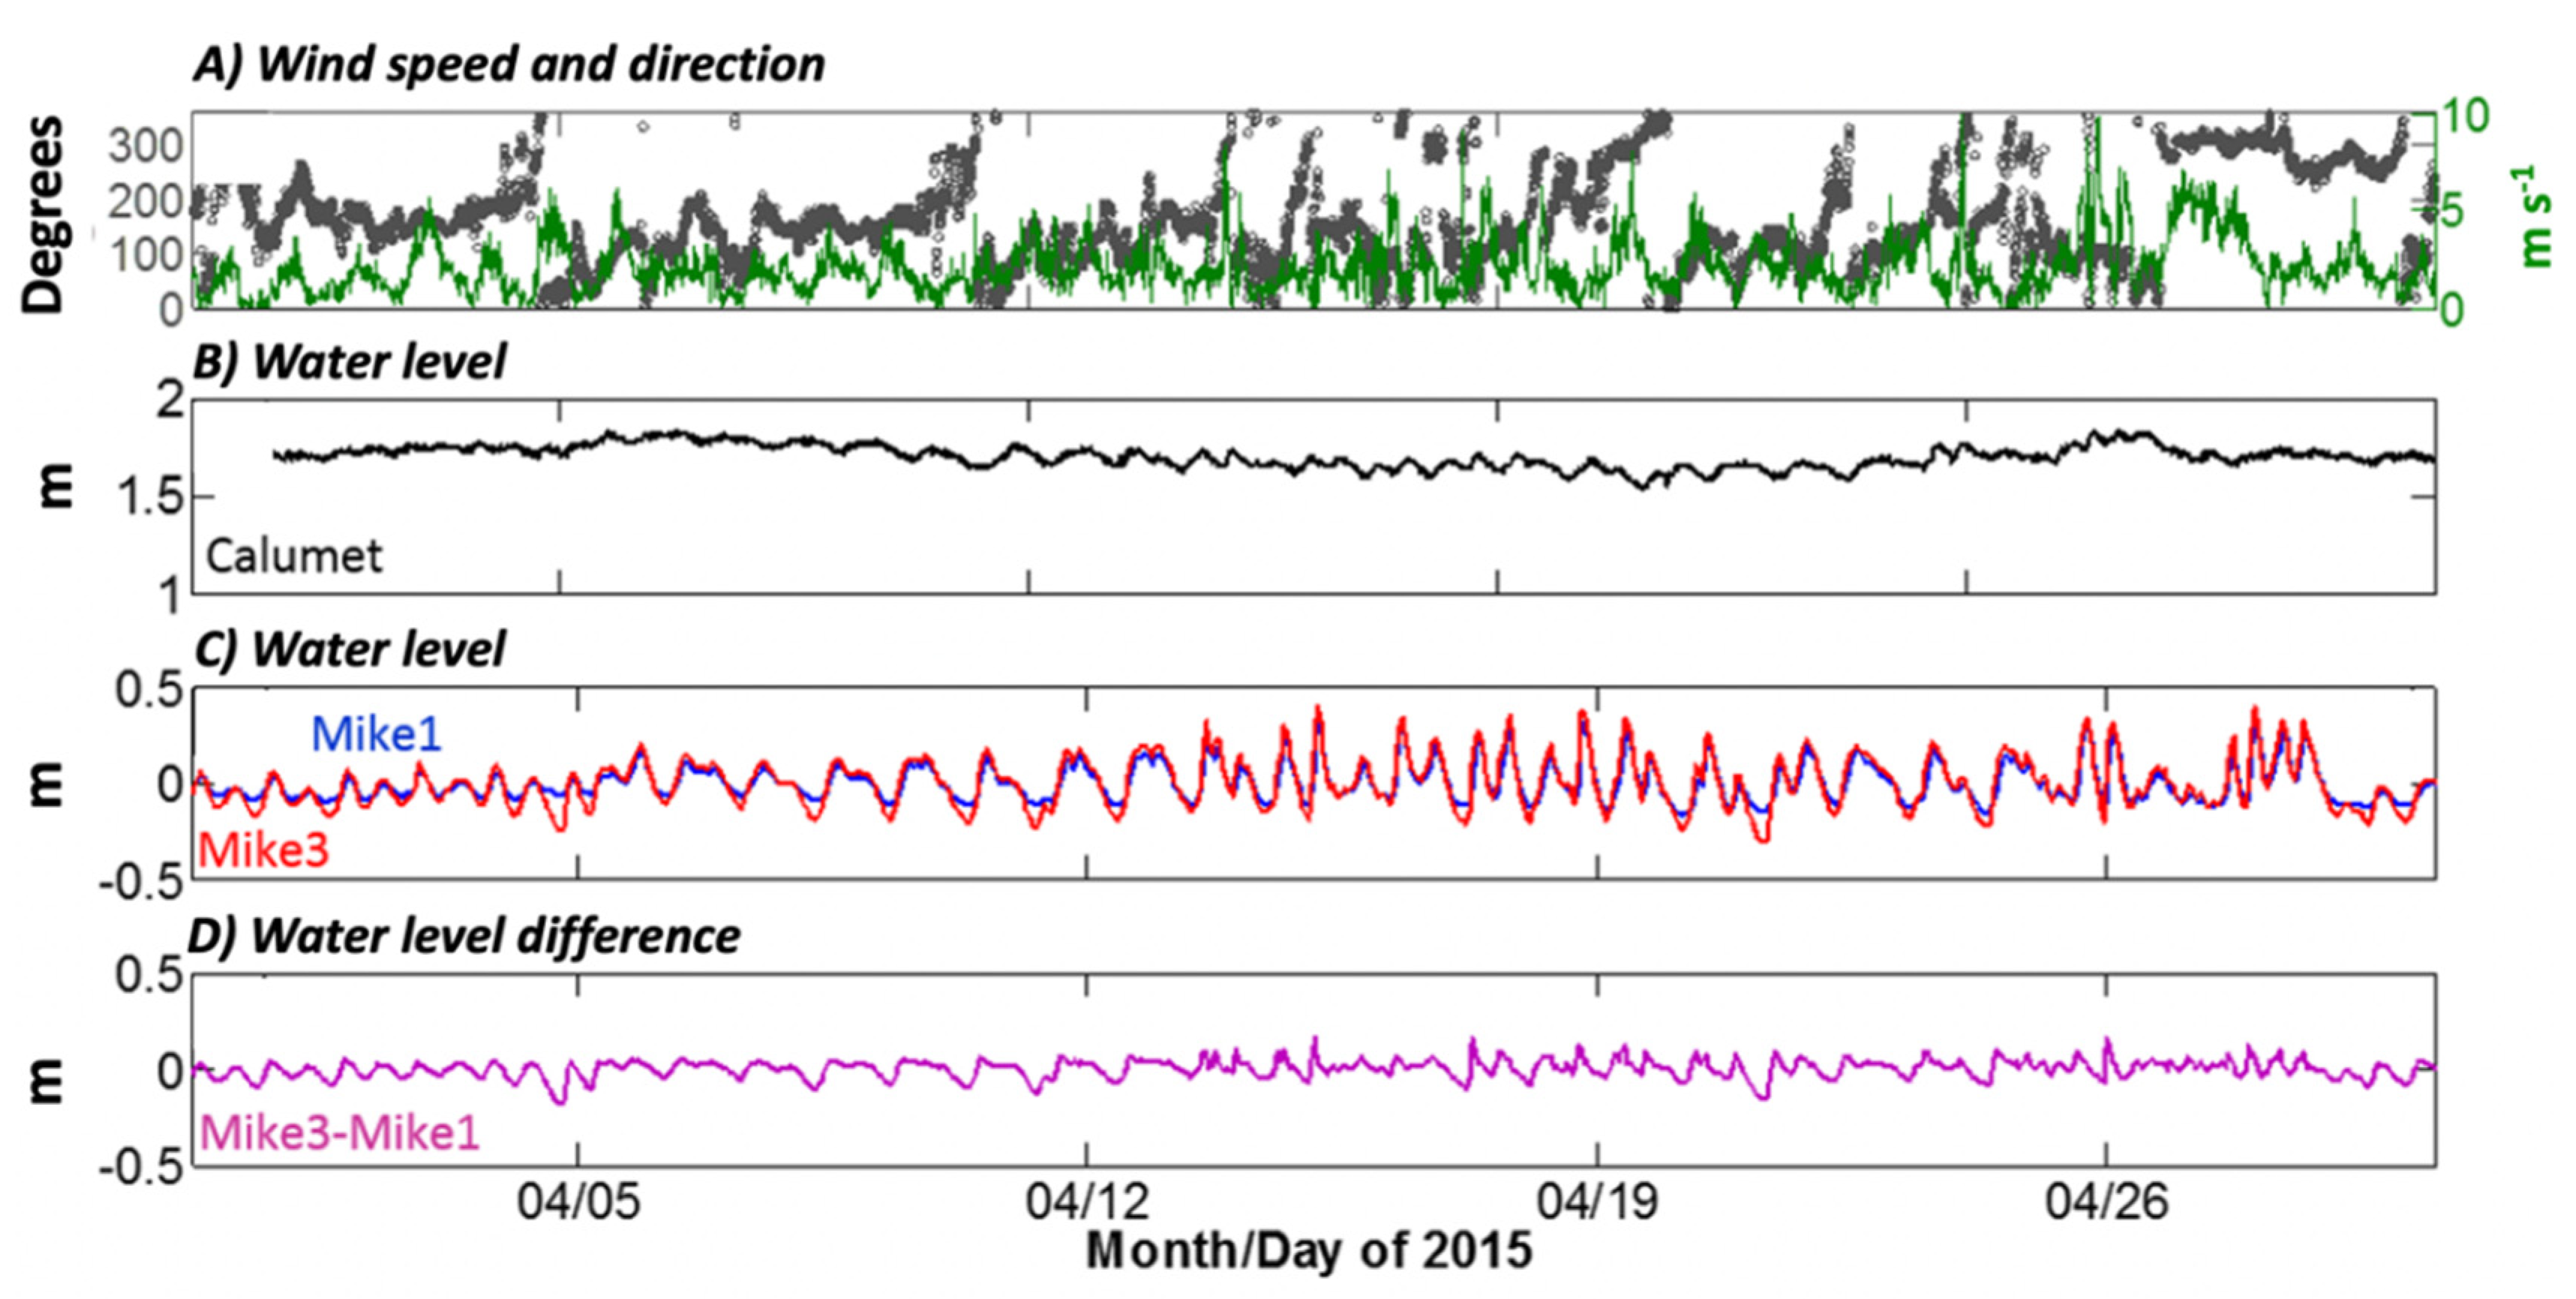
Wind data collected from the NOAA buoy station in Amerada Pass recorded wind speeds primarily between 4 and 5 m/s during the spring deployment (Figure 3A). During 2015, discharge from the Atchafalaya River was higher than in previous years and extended into late July. During the spring instrument deployment, the river was in a flood stage and discharging approximately 5500 m3/s at the Calumet monitoring station. The gage height at this station during the spring deployment was around 1.7–1.8 m with minimum variation during the deployment (Figure 3B). Relative water level variations at both Mike1 and Mike3 during the spring deployment were between −0.3 and 0.3 m (Figure 3C). Although Mike1 and Mike3 were in phase most of the time, the tidal ranges at Mike3 were slightly larger than those recorded at Mike1 during some lower water levels in the slack water stage (Figure 3C). The tides shifted between semidiurnal (two highs and two lows during a lunar day) and diurnal (one high and one low) patterns multiple times during April 2015.
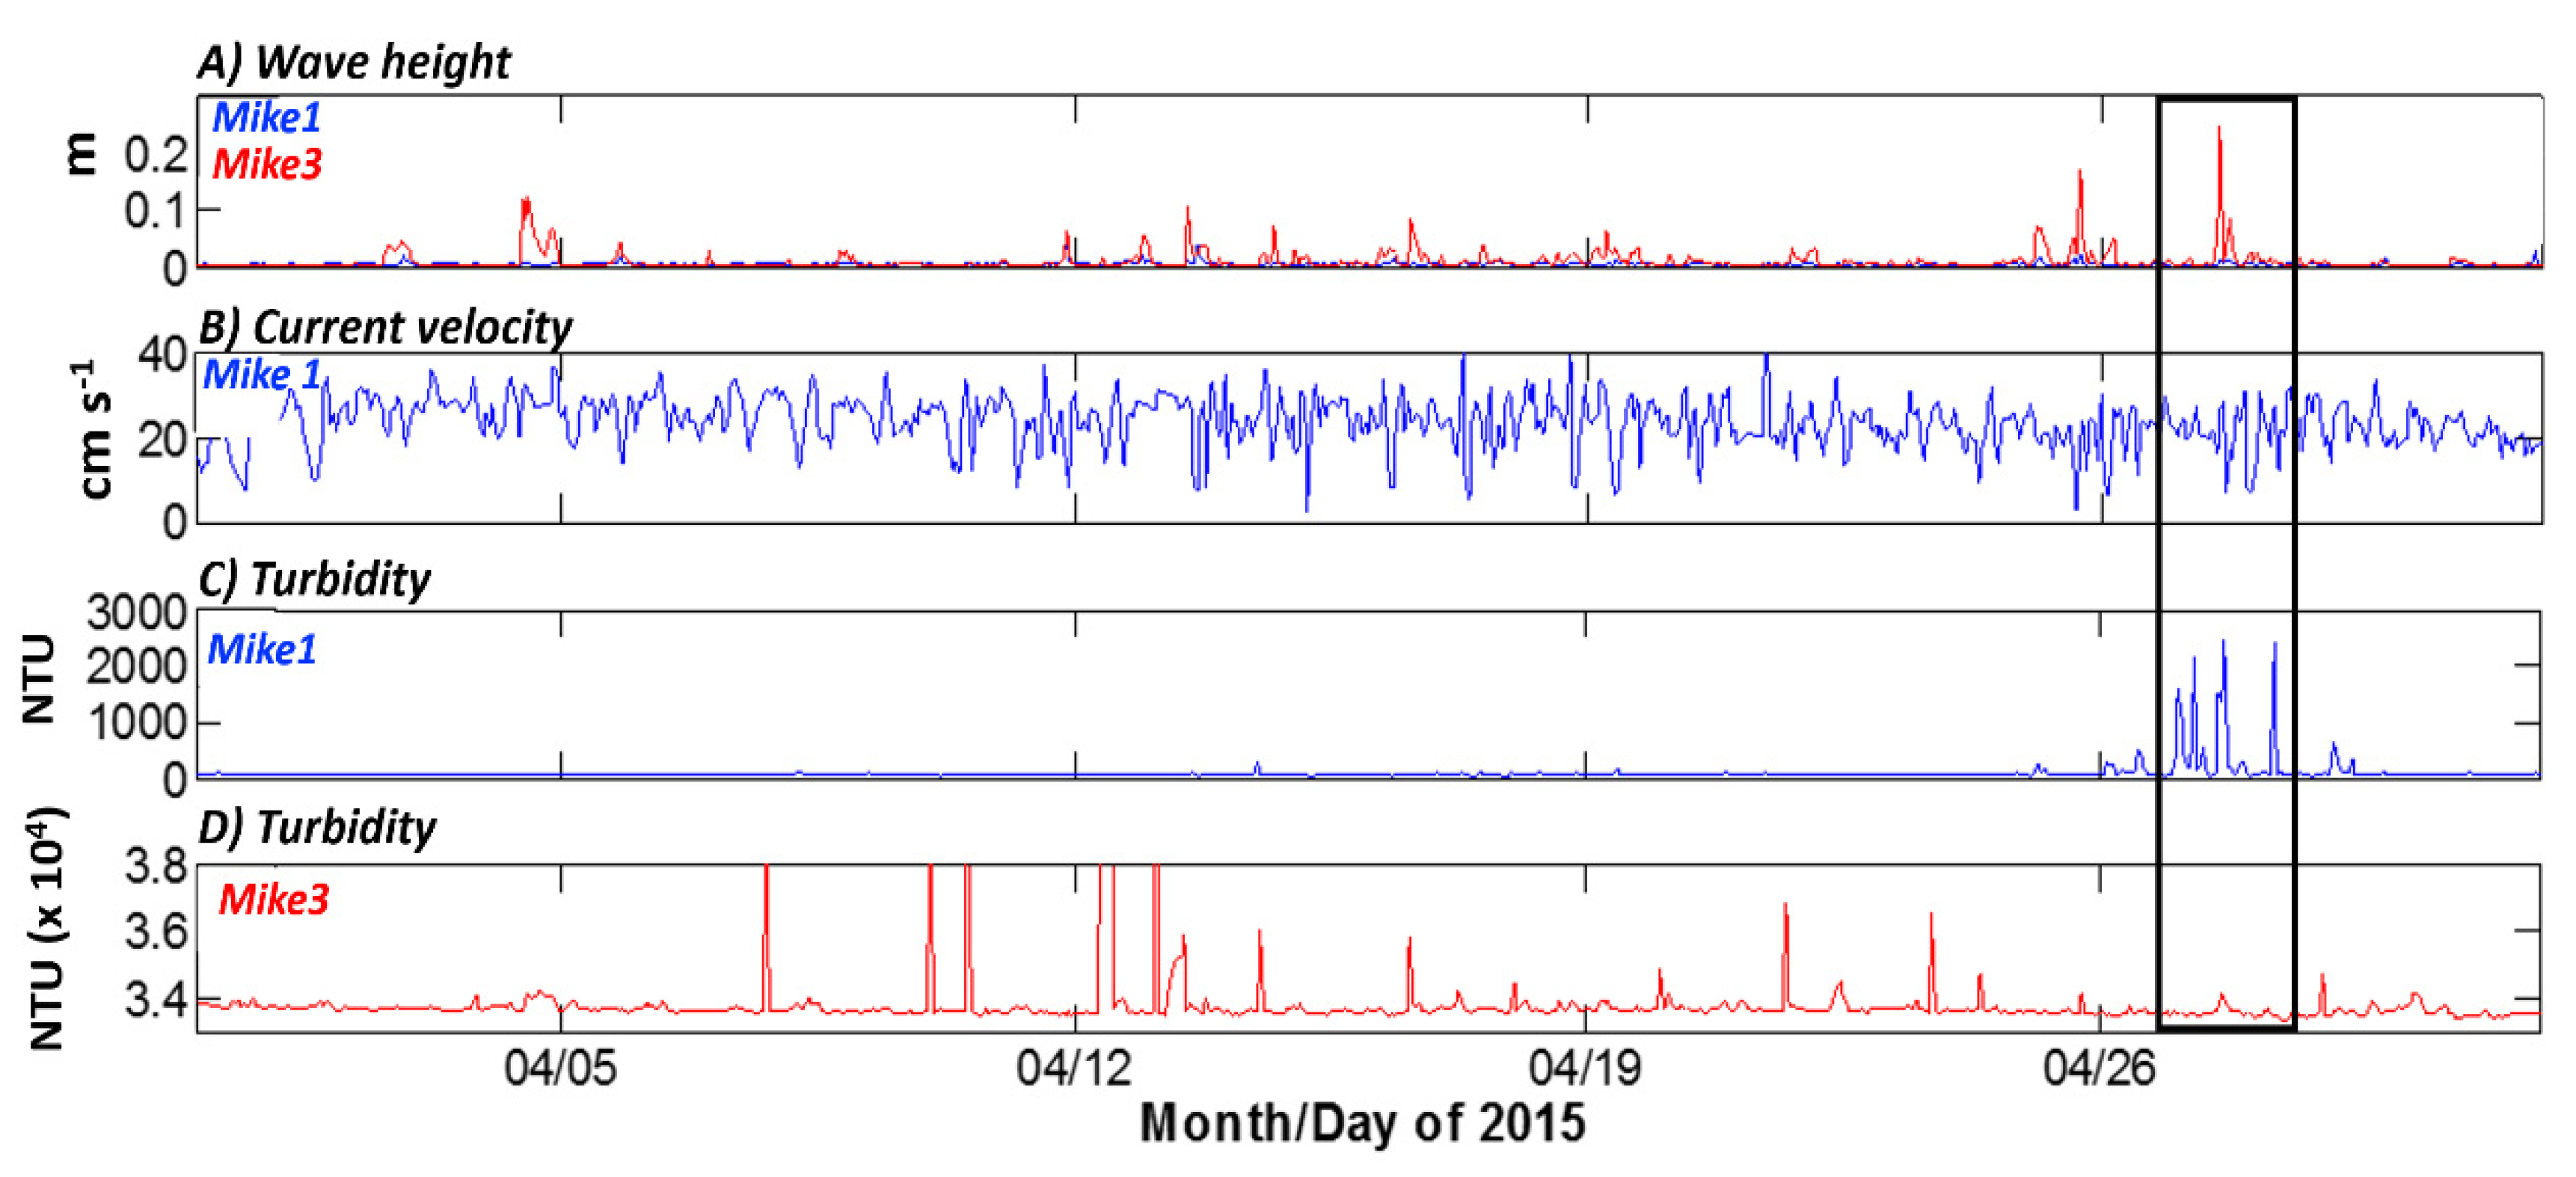
Wave, current velocity, and turbidity parameters were measured at Mike1 and Mike3 during both deployments. During the spring deployment, significant wave height at Mike1 was usually < 1 cm, with a few small peaks in wave height up to 4.24 cm (Figure 4A); average and standard deviation of wave heights during spring at Mike1 were 0.37 and 0.32 cm, respectively. Wave heights at Mike3 were generally higher than in Mike1, with wave heights primarily between 0 and 4 cm. During some storm events in late April 2015, wave height reached 24.67 cm, the highest waves measured during all sampling periods (Figure 4A); the average and standard deviation of wave heights during spring at Mike3 were 0.79 and 1.67 cm, respectively. Average current speed at Mike1 was 23 cm/s with significant fluctuations (Figure 4B). Due to instrument battery failure (ADV Ocean), no current data were collected at Mike3. Using an OBS, a proxy of turbidity (in nephelometric turbidity unit-NTU) was measured at Mike1 and Mike3. At Mike1, turbidity remained relatively low until a storm impact in late April (Figure 4C). At Mike3, optical turbidity data showed a noisy response (Figure 4D).
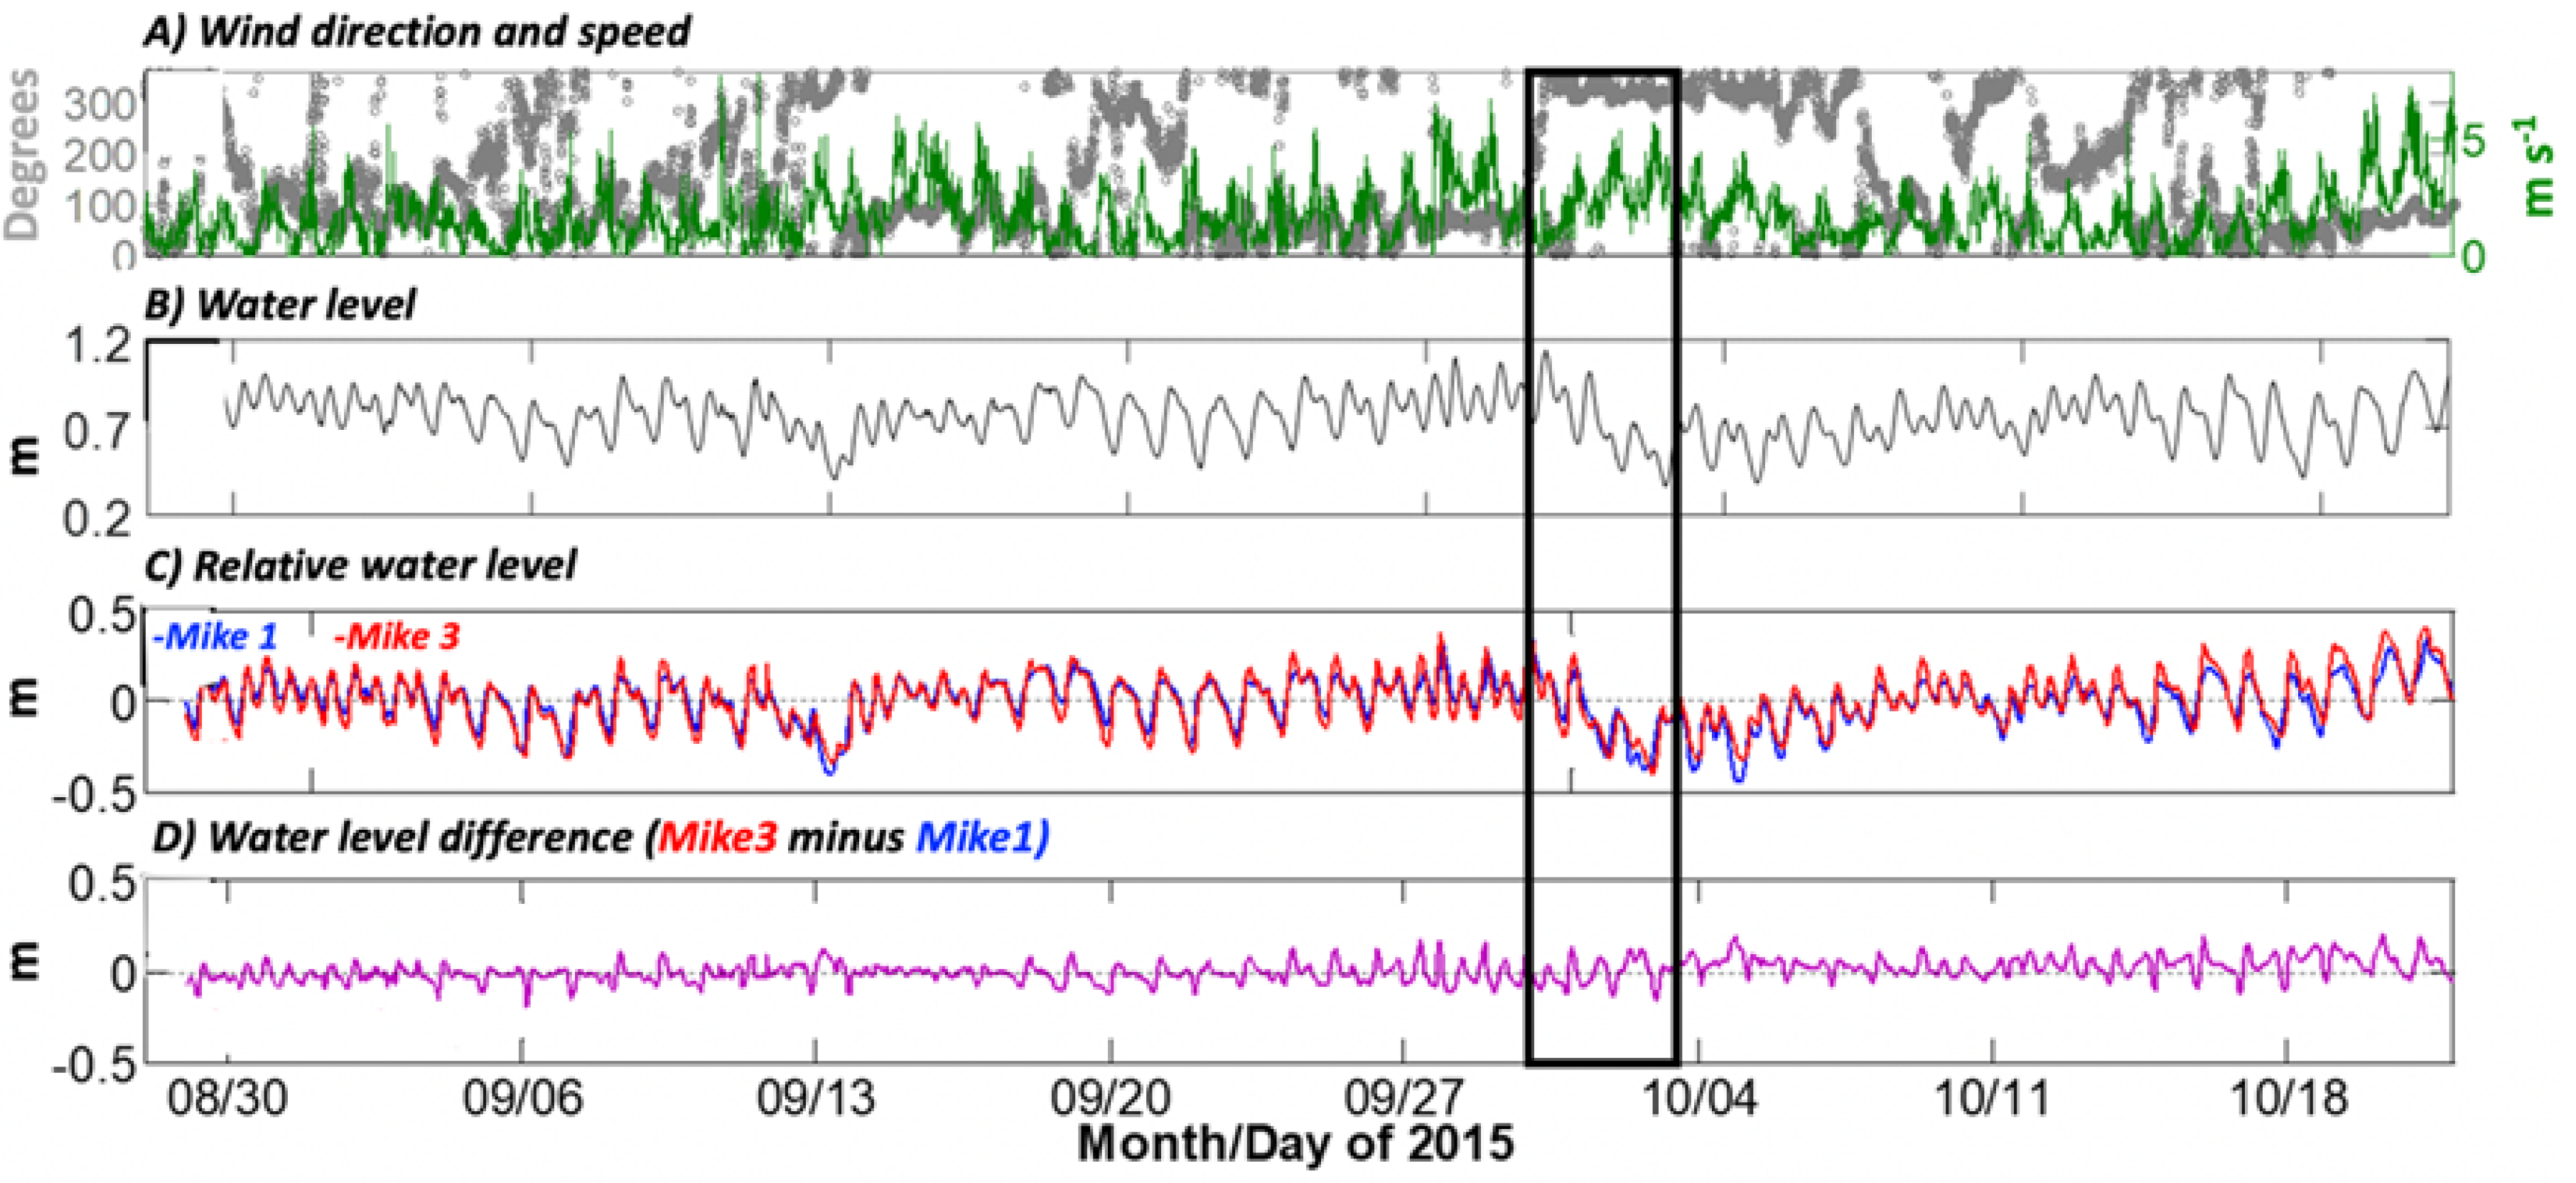
During the summer/fall deployment, wind speeds ranged from 3 to 4 m/s with a few large peaks near 7 m/s (Figure 5A), while river discharge was much lower (1000 m3/s). The water level at Calumet fluctuated between 0.3 and 1.2 m (lower than 1.8 m in April 2015) and showed a higher variation due to the influence of tides (Figure 5B). Mike1 and Mike3 water levels were less influenced by local hydrodynamics during the summer/fall due to low river discharge. Water level varied by approximately 0.6 m throughout the deployment at Mike1 and mimicked a strong tidal signal similar to Calumet (Figure 5C). At Mike3, water levels followed a similar tidal oscillation (Figure 5C). At both stations, tides shifted between diurnal and semidiurnal patterns and the lowest water level was observed in early October because of the passage of a cold front (Figure 5B,C). During this event, energetic winds of 5 m/s blew from the north for more than 5 days, lowering water levels by 0.8 m at Mike1, Mike3, and Calumet stations.
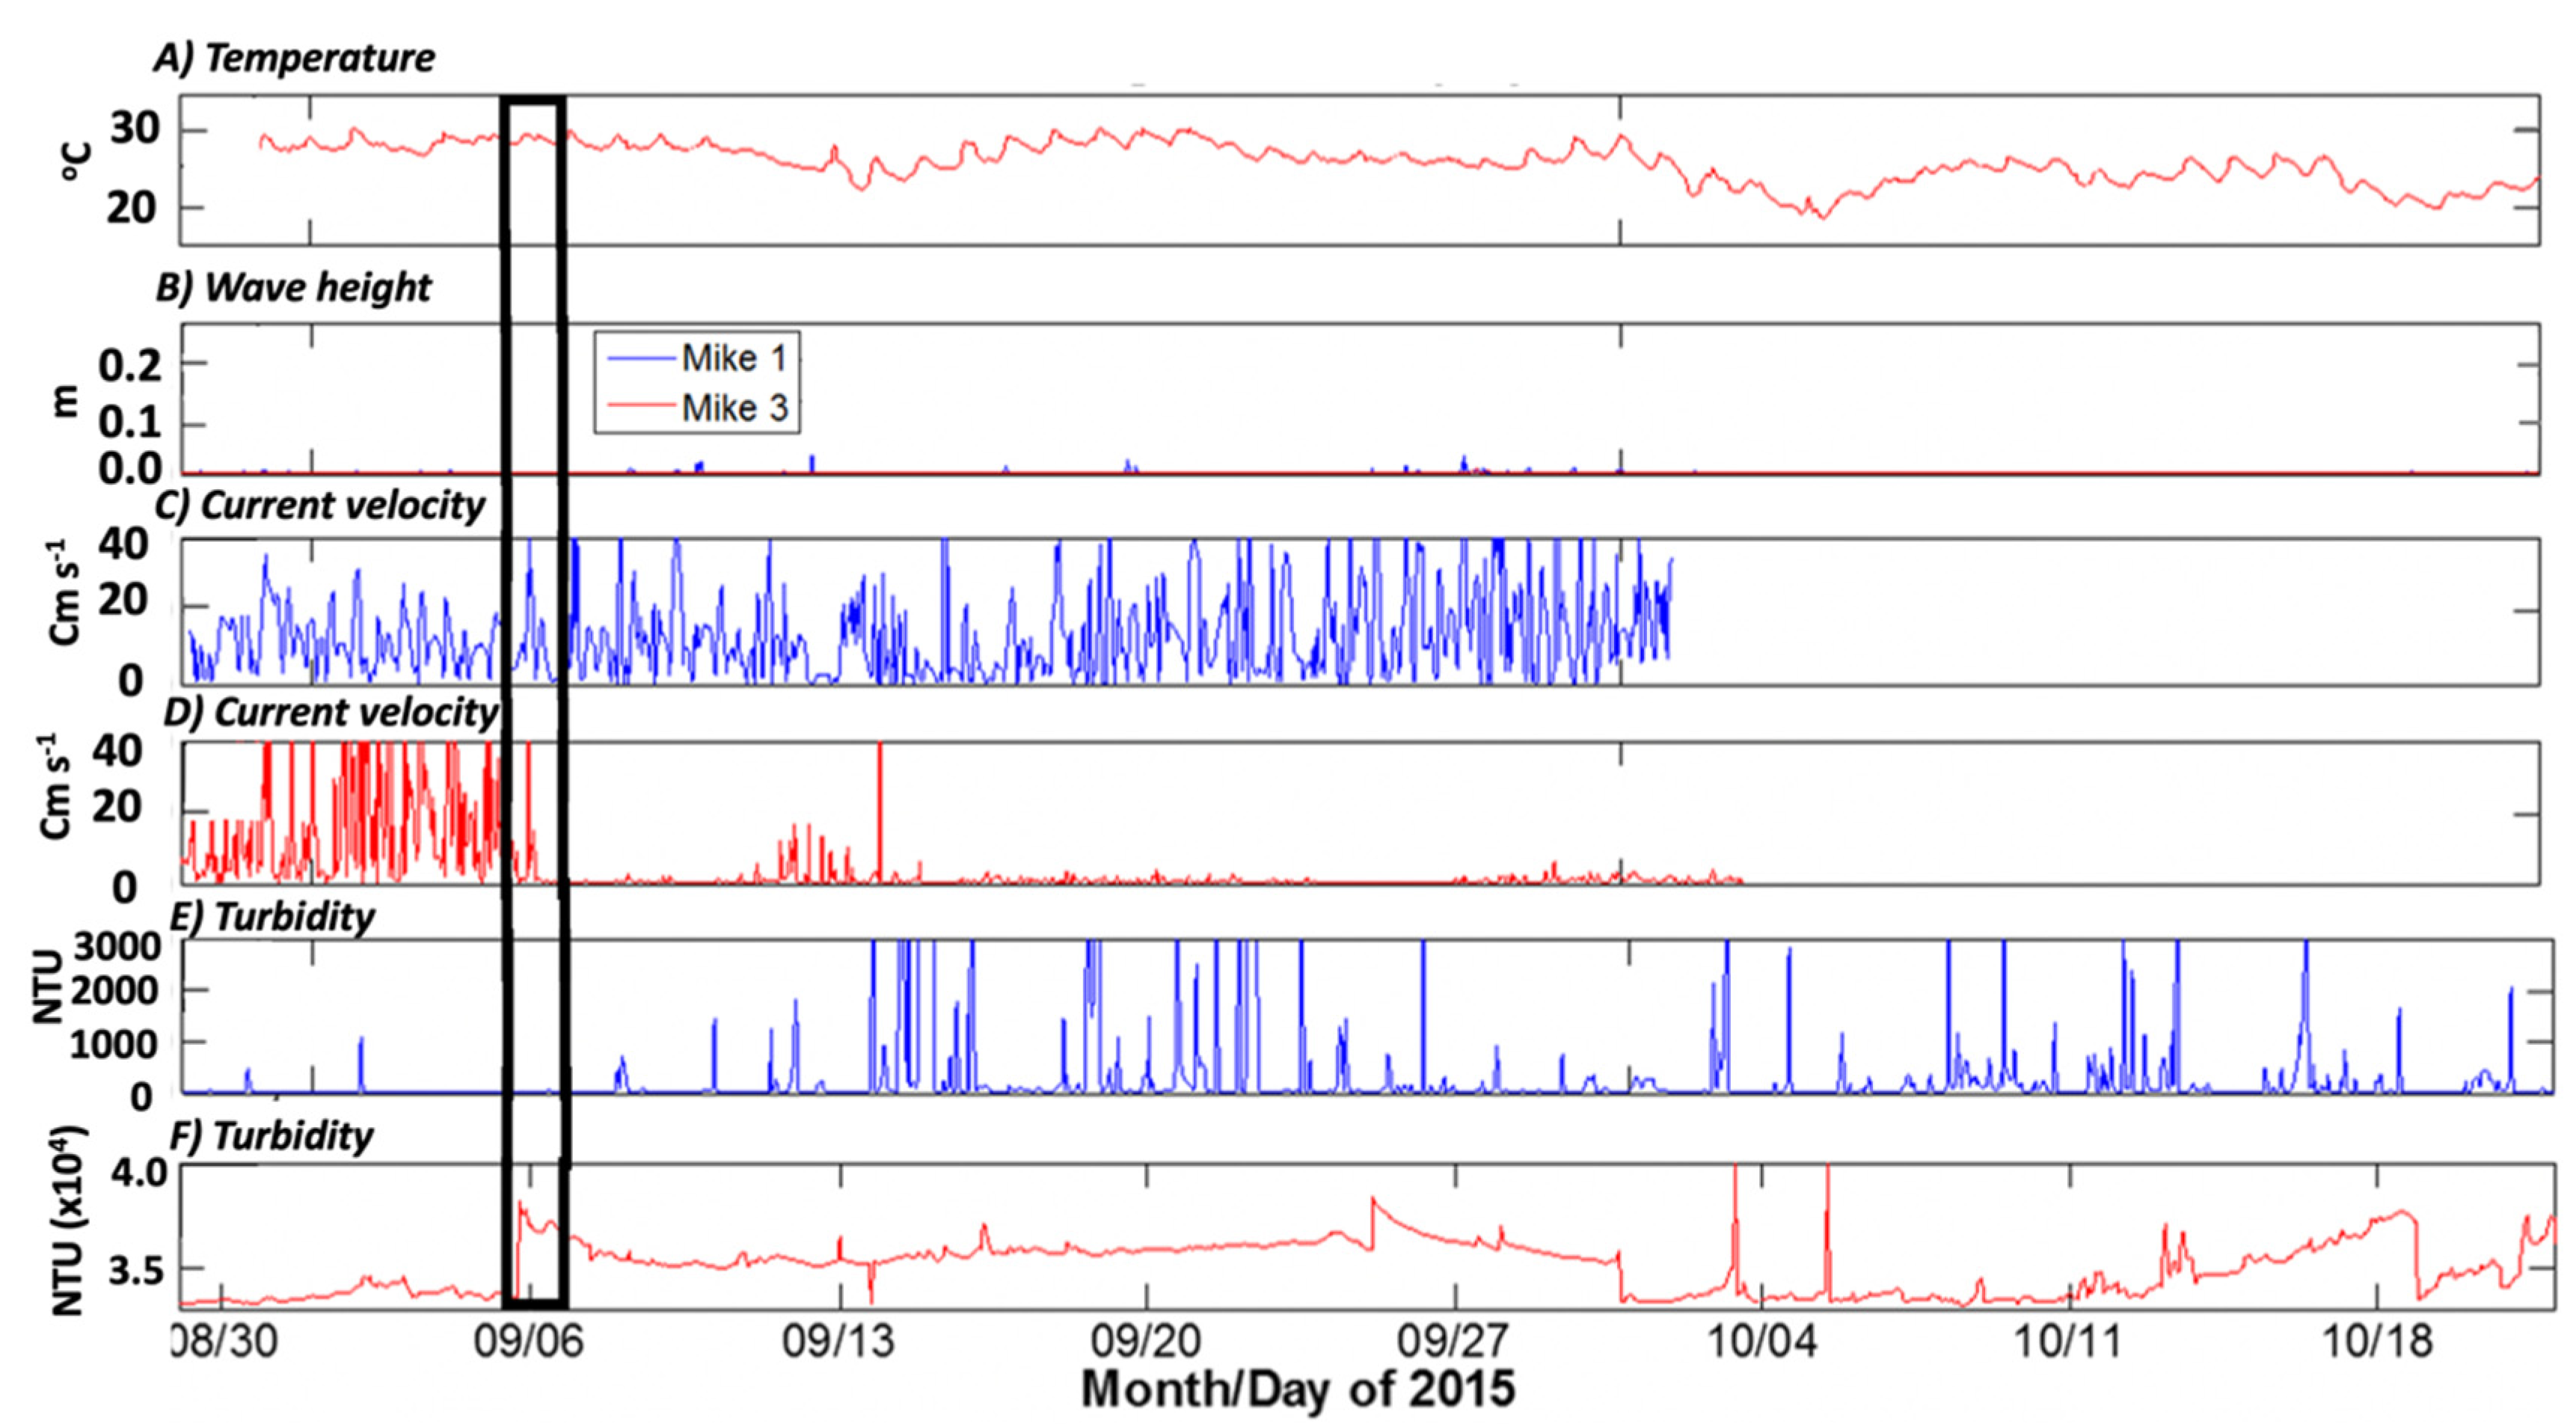
Wave height at Mike1 during the summer/fall deployment was close to 0 m throughout most of the sampling period (Figure 6B). There were several small peaks, but they rarely exceeded a few cm (Figure 6B). Wave heights at Mike3 were also minimal (Figure 6B). Average and standard deviation of wave heights during summer/fall at Mike1 were 0.17 and 0.24 cm, respectively. At Mike3, average and standard deviation of wave heights were 0.02 and 0.07 cm, respectively. Average current velocity collected by the ADV Argonaut at Mike1 was approximately 13 cm/s (Figure 6C). At Mike3, water velocities were up to 30 cm/s during the first week then rapidly decreased to near 0 cm/s on 6 September 2015 and remained low throughout the rest of the deployment (Figure 6D). There were a few periods where the velocity reached 5 or 10 cm/s, but overall, the first week of the summer/fall deployment was distinctly different from the rest of the deployment period. Turbidity values collected at Mike1 were typically low, but there were several peaks throughout the deployment (Figure 6E). Many of the large spikes in turbidity data were likely due to acoustic noise from the presence of vegetation. The turbidity data collected at Mike3 were not as variable as in Mike1 (Figure 6F). However, there was one sharp increase in turbidity on 6 September 2015 that coincided with a velocity decrease at Mike3. Moreover, our TSS values collected from bottle samples generally decreased from March to August and increased in October (see Table 2). The high surface turbidity value registered at Mike1 in October compared to the middle water column value is most probably a result of resuspension caused by disturbance prior to sampling.
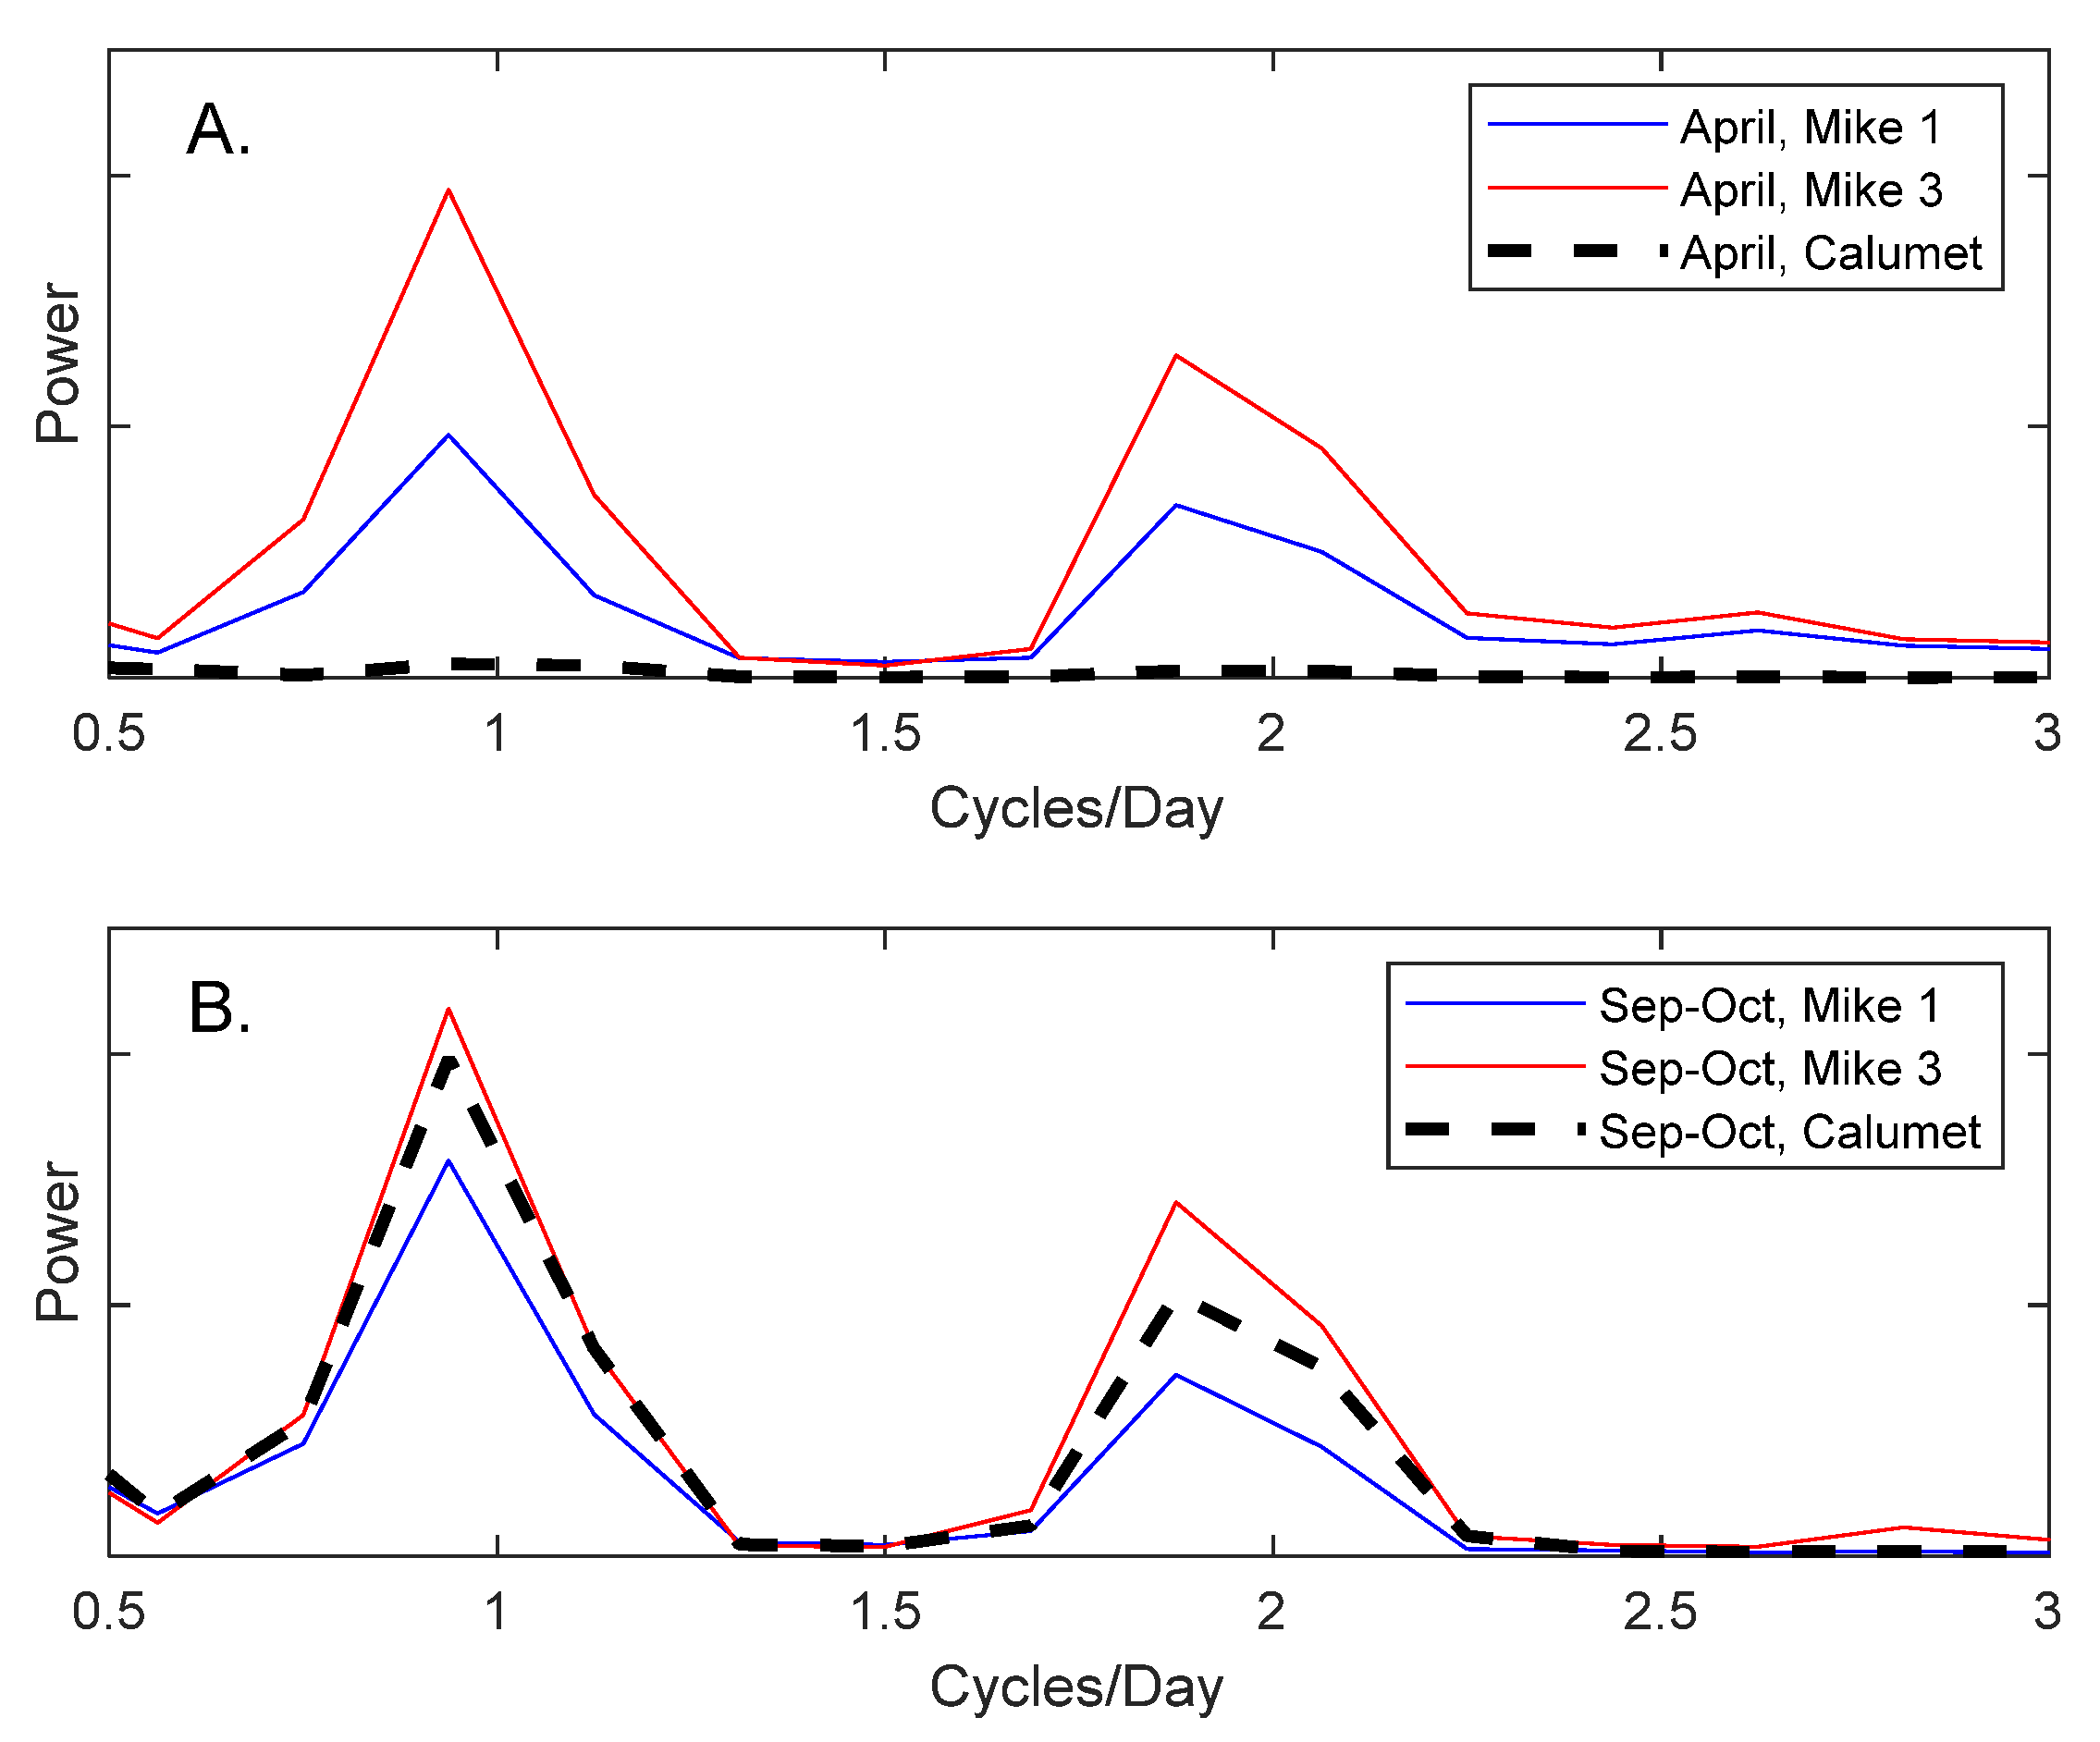
The coefficient of determination (R2) values between Mike1 and Mike3 water levels were estimated using hourly data. These measurements were distributed near the 1:1 line in both April (R2 = 0.91) and September–October (R2 = 0.84) 2015 (Figure 7), revealing that water levels at the two stations were tightly coupled due to their close proximity (1.5 km). FFT results showed that semidiurnal (approximately 2 cycles/day) and diurnal (approximately 1 cycle/day) tides dominated both Mike1 and Mike3 in both April and September–October 2015 (Figure 8); the semidiurnal tidal signal was always stronger than the diurnal. Semidiurnal and diurnal signals at the Calumet station were visible in September–October 2015, but not detectable in April 2015 (Figure 8).
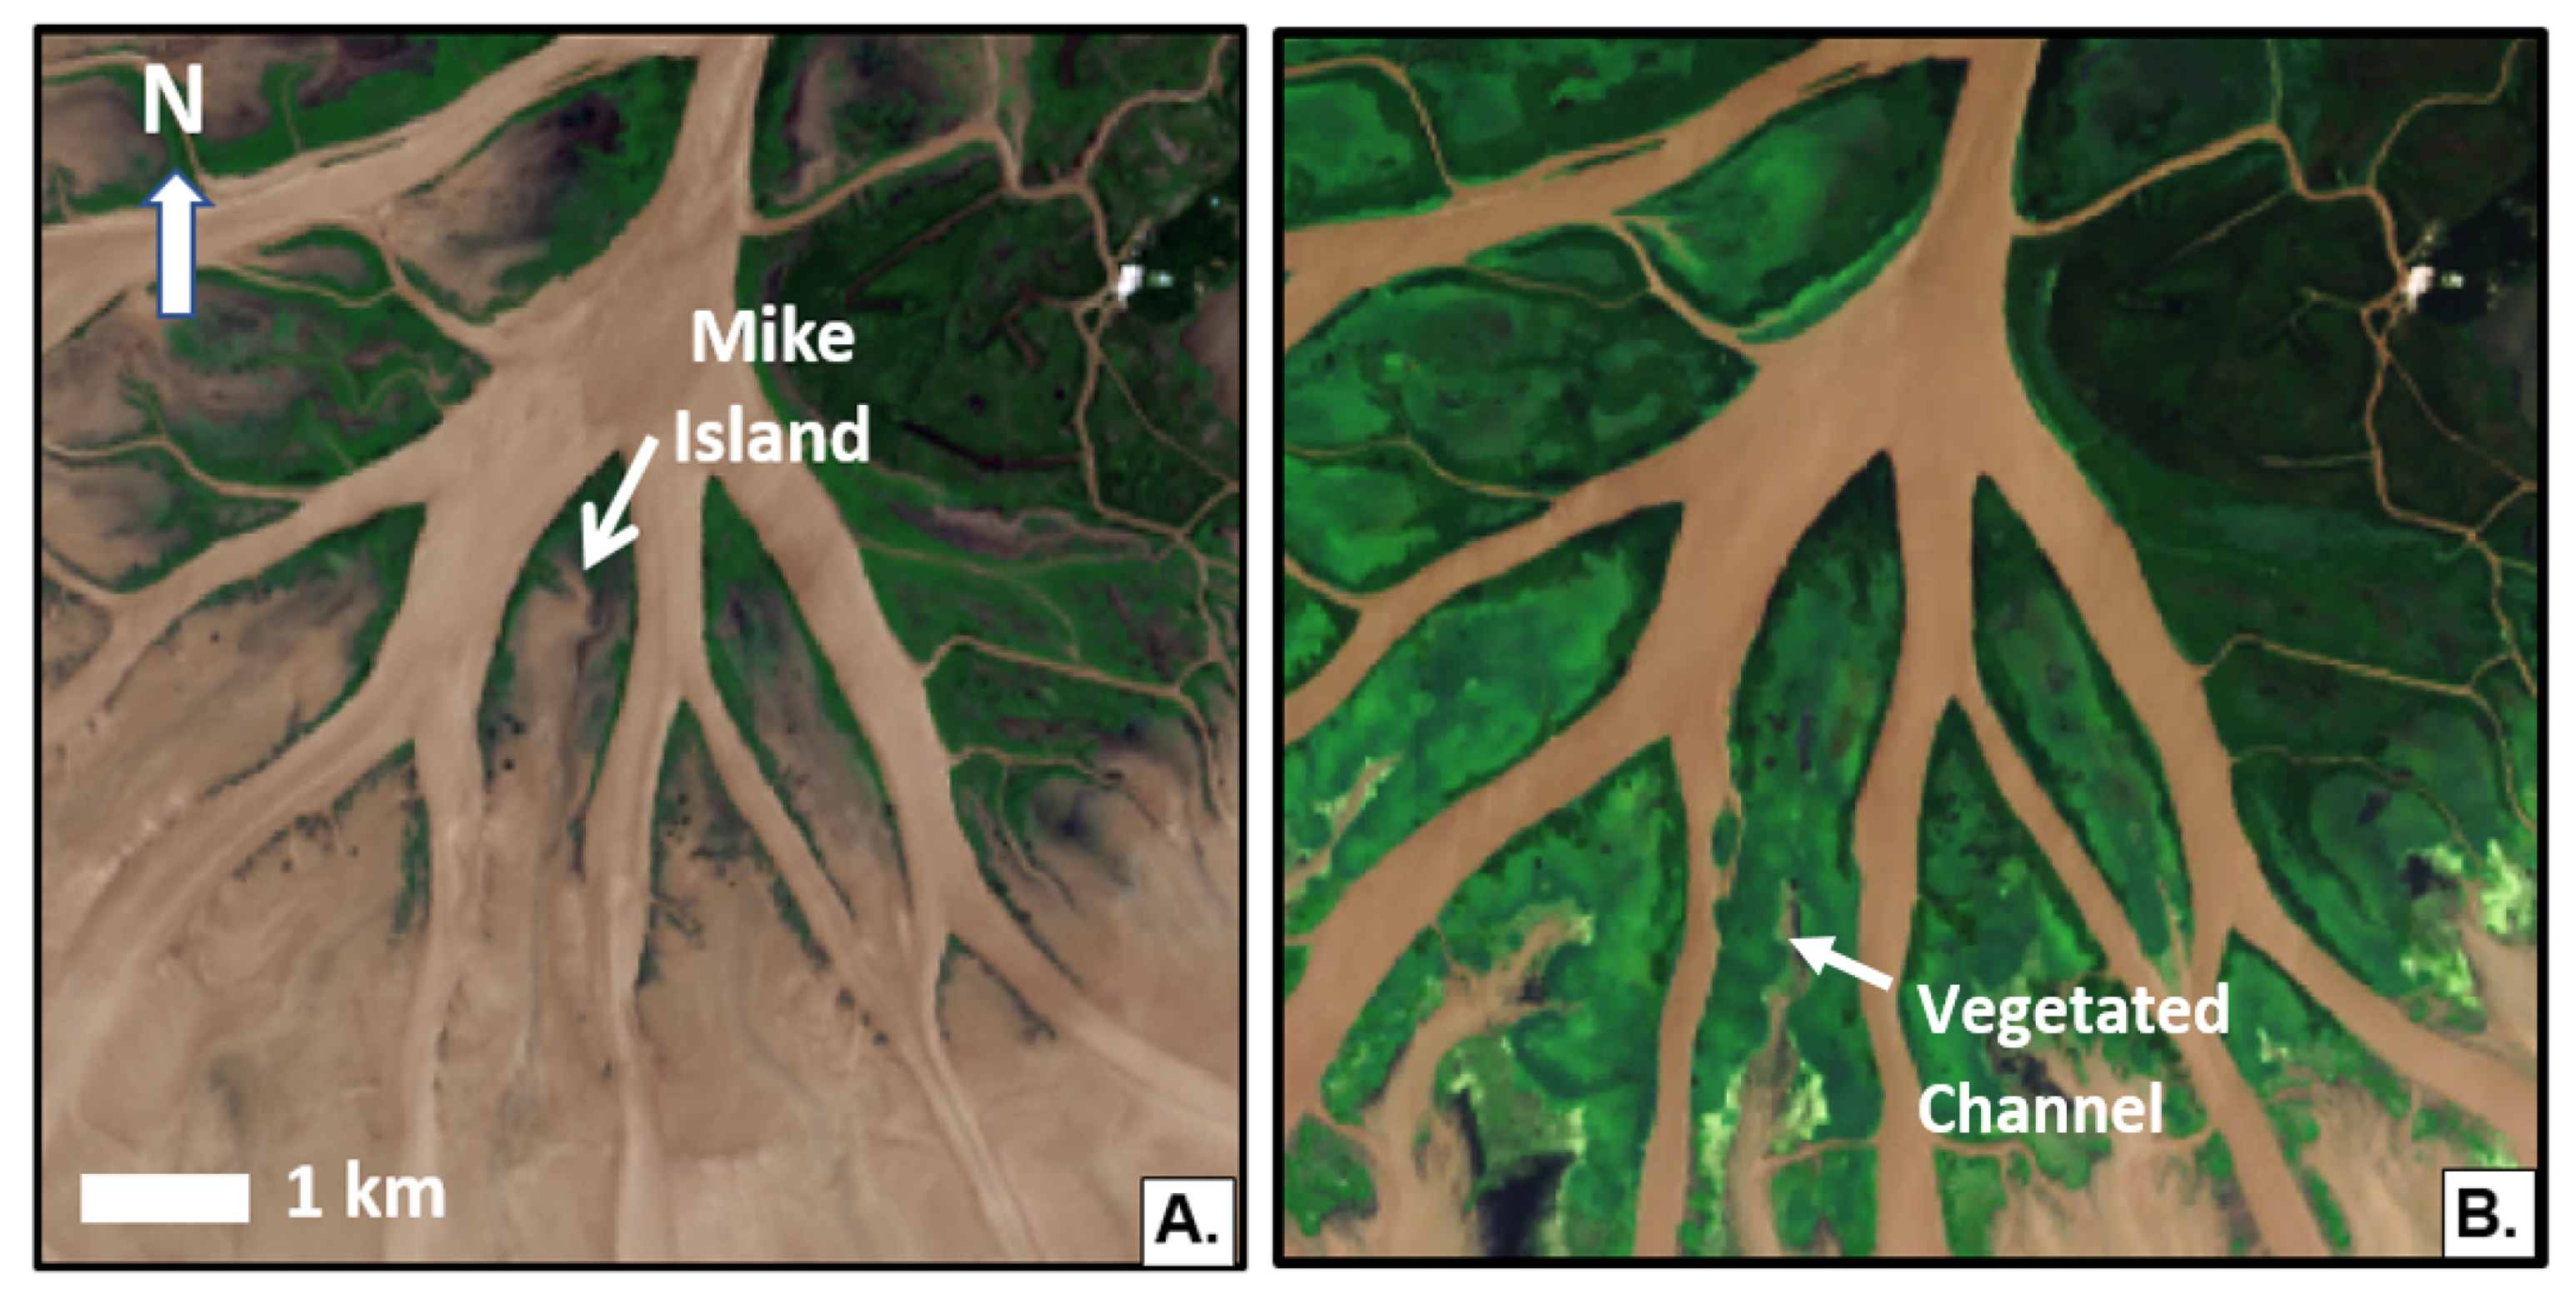
As mentioned above, the presence of vegetation during the September/October deployment had an impact on the water level, current velocity, and turbidity values. The increase in vegetation density and biomass in Mike Island at the regional scale is controlled by a significant increase in air and water temperature. During the spring deployment when water temperature ranged from 14 to 26 °C, based on the OBS 3A data, vegetation was sparse and patchy across the study area. In contrast, during the summer/fall deployment, vegetation was dense and widespread due to higher water temperatures (range: 19–31 °C) and nutrient availability, particularly NO3−. This high vegetation biomass and associated peak productivity is widely observed along the Louisiana coastline [5], especially across the delta plain [54]. The physical impact of this high vegetation density is reflected in the relative differences and fluctuations in the current velocity between the April and September–October deployment at each station (Figure 4B and Figure 6C,D). This change in velocity influences both local hydrodynamics and sediment transport at different levels when interacting with shifts in tidal periodicity across the island. The seasonal difference in vegetation biomass and spatial extension is underscored by LANDSAT imagery, contemporaneous to our instrument deployments dates (Figure 9). Indeed, even during periods of low biomass, there is still vegetation present along the northern edges of Mike Island due to a higher elevation and species-specific spatial distribution along the ridge (Figure 9A) [40,48,55]. This vegetation enhances sediment retention and ameliorates storm surge impact during cold fronts during the winter season [55].
3.2. Overlying and Porewater Inorganic Nutrient Concentrations
Due to logistical and sampling limitations, nutrient sampling did not occur during all months (i.e., March, May, August, October). TIN concentrations showed a significant three-order interaction: month of collection (May, October), location (upstream, downstream), and compartment (overlying, porewater) (p = 0.0062) (Table S1). The largest nitrogen form contributing to porewater TIN concentrations is [NH4+] (78.6 ± 9.5 μM), while [NO3−] is the main contributor to overlying water TIN (22.5 ± 3.6 μM). Average TIN was significantly higher in the porewater in October at Mike1 (115.4 μM) and Mike3 (101.5 μM) than in the other collection dates or compartments (Figure 10 and Figure 11).
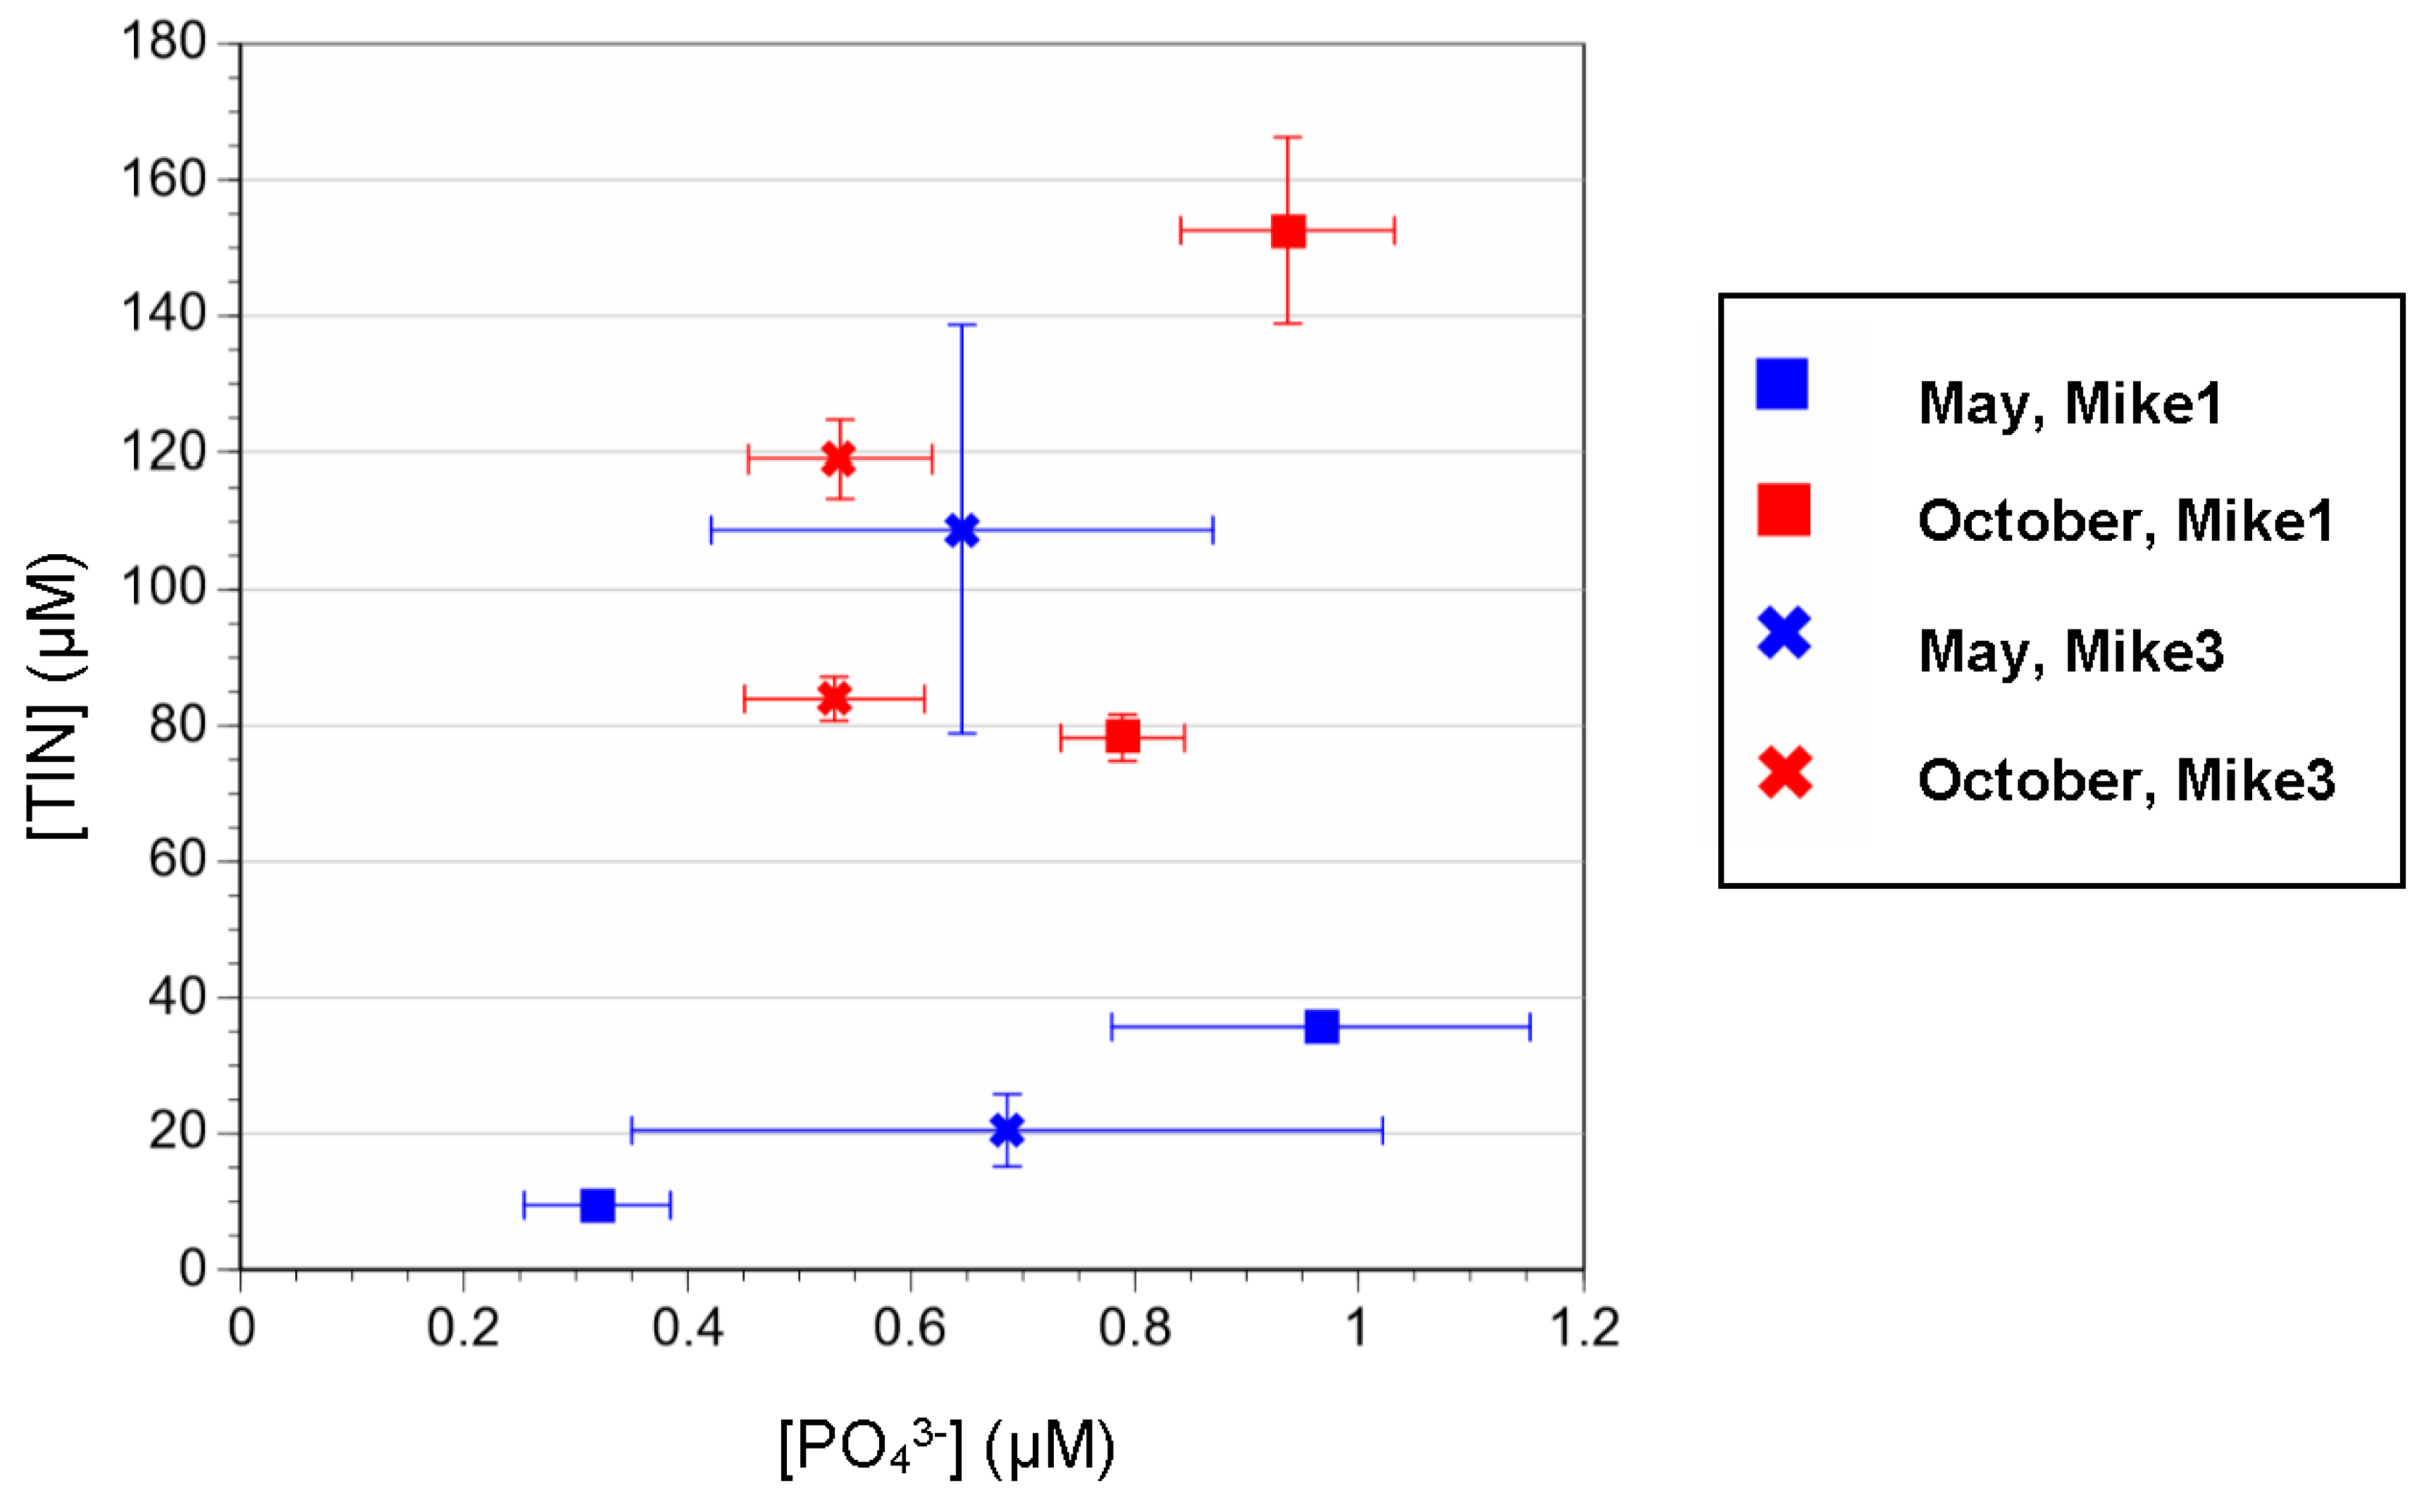
Soluble reactive phosphorus (SRP, PO43−) showed a significant two-order statistical interaction between station location (upstream or downstream) and month of collection (May, October) (p = 0.0004) (Table S2). During May 2015, there was no significant difference in PO43− concentrations in overlying water between the upstream and downstream locations (Figure 10). Additionally, there was no significant difference (p = 0.3071) (Table S4) in the PO43− concentration between the vegetated and non-vegetated areas downstream, whereas the concentration in the non-vegetated locations upstream was significantly greater than in the vegetated areas in May 2015 (p = 0.0067) (Table S3). However, during October, the upstream location had significantly higher concentrations of PO43−; downstream concentrations at Mike3 did not vary significantly between the seasons. Location and vegetation presence had a significant interaction in determining PO43− concentrations (p = 0.0188) (Table S2); the highest PO43− values were measured in the non-vegetated area at the upstream location (Mike1) (Figure 10 and Figure 11). Additionally, there was a significant interaction between compartment (i.e., overlying water and porewater) and vegetation presence (p = 0.0331) (Table S2). Overall, the mean PO43− concentration was higher in the overlying water (1.25 ± 0.16 μM)) than in the sediment porewater (Figure 10 and Figure 11).
3.3. Sediment Trap
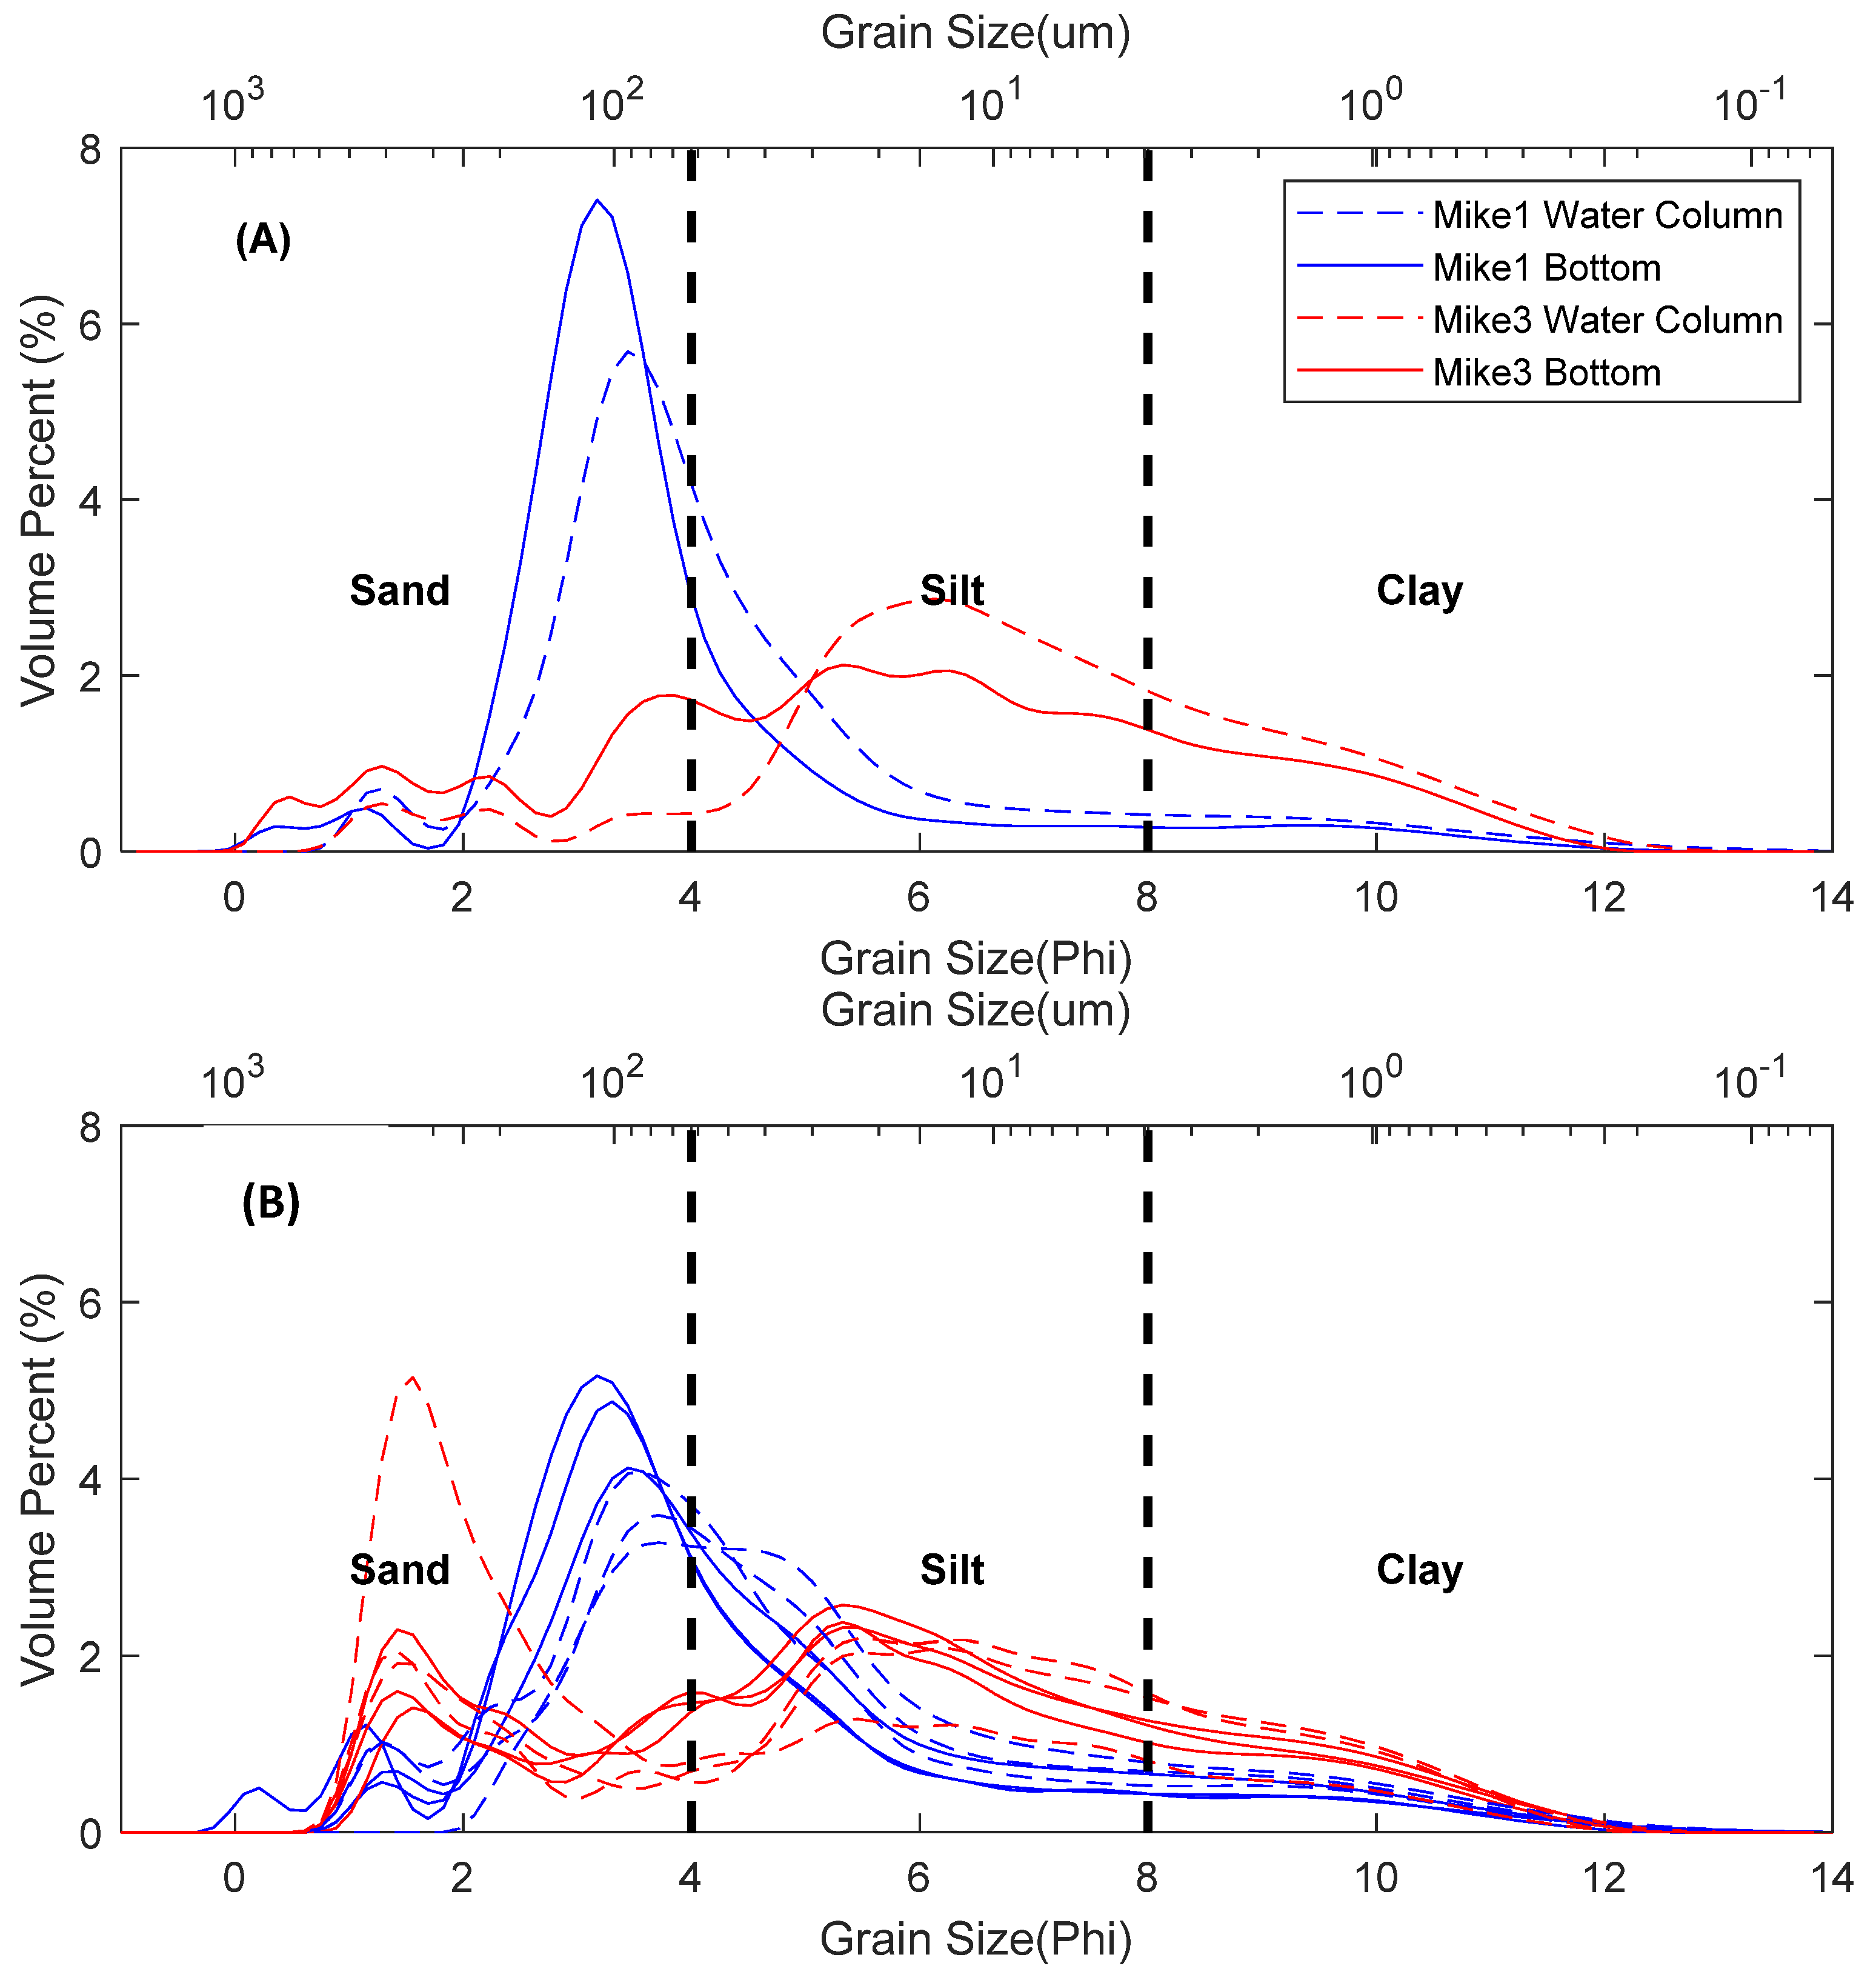
The prototype sediment traps used in April 2015 at Mike1 and Mike3 to capture sediment at two levels, i.e., 30 cm above the sediment–water interface (S-30) and on the sediment surface (S-S), were successful in trapping sediment. In our study, sand, silt, and clay are defined as >63 μm (<4 phi), 63–4 μm (4–8 phi) and <4 μm (>8 phi), respectively. During spring 2015, sediment traps were deployed on 28 March and retrieved on 2 May 2015. Since there was only one trap set (N = 1) deployed at Mike1 and Mike3, no statistical analyses were performed to evaluate differences in sediment accumulation in the traps between dates; only general trends are presented. Bulk density values estimated per trap were 1.5 (S-30) and 1.4 (S-S) g/cm3 at Mike1. However, at Mike3, bulk density values were only 0.53 (S-30) and 0.47 (S-S) g/cm3. Similar bulk density values were registered during the summer deployment. Average bulk density values at Mike1 were 1.25 (S-30) and 1.15 (S-S) g/cm3. At Mike3, average bulk density values were much lower, with 0.23 (S-30) and 0.03 g/cm3 (S-S); the low values might be associated with the proportion of sediment slurry and excess water contained in the traps after sampling.
The sediment collected in the traps deployed at Mike1 and Mike3 was also analyzed for TN, TP, and TC content (Table 3) and grain size distribution. In spring, the dominant grain size trapped at Mike1 was fine sand and coarse silt in both the S-30 and S-S traps (Figure 12A). At Mike3, the trapped sediment was more poorly sorted, and silt was the dominant grain size in both traps (Figure 12A). During the summer/fall deployment, a similar pattern in grain size was found; the dominant grain size in Mike1 was fine sand (Figure 12B). However, at Mike3, a bimodal distribution was apparent, with a primary mode in silt and a secondary mode in sand (Figure 12B).
4. Discussion
4.1. Water Column Processes
Mike Island is part of a dynamic system where seasonal pulsing regulates several hydrodynamic forcings throughout the WLD, including waves, tides, river discharge, and currents that in turn control elevation gradients characterized by distinct vegetation communities. High river discharge during the spring strongly influenced the hydrology of the secondary channel located at the northern end of Mike Island; this channel serves as an entry point of riverine waters into the island interior. Since the channel is narrow, the flow recorded by the ADV Argonaut instrument at Mike1 during the spring is relatively high (Figure 4B). Comparatively, the Mike1 station is not influenced by waves from the GOM like Mike3, as shown by the wave height during spring 2015 (Figure 4A). This pattern was expected due to the proximity of Mike3 to the extensive and semi-enclosed Atchafalaya Bay (Figure 1). During a 3 day period in late April 2015, turbidity values at Mike3 were variable and characterized by several large spikes (Figure 4C). It is possible that some optical noise in the OBS data from Mike3 was due to vegetation growth and/or floating organic matter (e.g., leaves and vegetation mats). Nevertheless, our data recorded the passing of a strong wind-driven storm through the Louisiana coast on 27 April 2015, which was associated with a number of distinct physical processes: high wind speed at Amerada Pass, high water level at Calumet (Figure 3A,B), taller wave height in Mike3 (Figure 4A), and a notable increase in water turbidity at Mike1 (Figure 4C).
River discharge in 2015 was generally higher than the long-term average annual records during our study. However, river discharge was lower during the summer/fall deployment, resulting in a smaller impact on Mike Island local hydrodynamics during peak plant biomass and productivity. Average current velocity at Mike1 during the summer/fall deployment was high (~16 cm/s), but comparatively lower than the spring deployment (~23 cm/s) (Figure 4B and Figure 6C). Since river discharge was lower during the summer/fall, the water flow entering the island through the secondary channel was weaker, as indicated by the lower water velocity at Mike1 during this season. During the summer/fall deployment, vegetation had no measurable impact on the flow at Mike1 because the channel was not yet completely colonized by aquatic/wetland plants when compared to the remainder of the island area. The higher velocity measurements at Mike1 than Mike3 during the summer/fall support this conclusion (Figure 6). However, peak biomass and productivity likely influenced the low wave heights observed at both Mike1 and Mike3 during this deployment (Figure 6B). During the first week of the summer/fall deployment at Mike3, the velocity was higher (~30 cm/s) than the velocity recorded at Mike1 during the spring (~23 cm/s) (Figure 4B and Figure 6D).
Furthermore, there was a surprising reduction in the velocity with a concurrent increase in turbidity at Mike3 around 6 September 2015. During the entire summer/fall deployment, the quality of the ADV velocity u, v and w components at Mike3 was generally above 80%. Previous studies have suggested that vegetation presence creates a channel where the velocity is maintained between the vegetated areas but suppressed within these habitats [30]. It is likely that the seasonal vegetation distribution at Mike3 during our study created a “vegetated channel” (Figure 9B) where an enhanced flow passed the ADV Ocean instrument attached to the tripod before 6 September 2015. Alternatively, the turbulence and vortical structures generated near this vegetated channel can keep organic matter and fine sediments in suspension, facilitating their transport downstream from Mike1 to Mike3, i.e., [13]. After early September, the water velocity soon dropped to nearly 0 cm/s while a sharp increase in turbidity was also recorded at Mike3 (Figure 6D,F). Yet, there was no increase in wave or wind values that could potentially trigger sediment resuspension. Turbidity currents can potentially cause resuspension in some areas as sediment-laden water moves down a slope [57]; however, no studies have reported turbidity currents near the study area so it is unlikely that it is the cause of this observed increase in turbidity.
Water levels in the Calumet, Mike1, and Mike 3 stations are under the combined seasonal control of river and tides (Figure 7 and Figure 8). For instance, our data show that a low-frequency seasonal river flood dominated over the high-frequency tides in April 2015. The coefficients of determination decrease from 0.91 to 0.84 can be explained by the presence of a dense vegetation gradient between Mike1 and Mike3. The increase in vegetation density, in conjunction with aboveground biomass, reduced the water flows leading to time lags in the water level phases between Mike1 and Mike3. Semidiurnal and diurnal tidal signals were not detectable in April 2015, but were visible in September–October 2015, indicating tidal decoupling between these stations. Additionally, during September–October 2015, the wave heights dissipated to nearly zero likely due to the presence of dense vegetation in Mike1 and Mike3, yet semidiurnal and diurnal tides penetrated through the entire Mike Island and even moved upstream 20 km reaching the Calumet station (Figure 1 and Figure 8).
4.2. Water–Sediment Interface
The overlying and porewater nutrient concentration showed significant interactions among the month, location, vegetation presence, and compartment (i.e., overlying water and porewater) factors. The relationship between PO43− and TIN concentrations in the overlying and sediment porewater shows a distinct nutrient gradient influencing vegetation productivity and biomass density in both locations (Figure 10 and Figure 11). In May 2015, both Mike1 and Mike3 had similar PO43− (0.9–1.7 µM) and TIN (28–40 µM) concentrations in the overlying water. This pattern was apparent in both sampling points (replicates) within each location (Mike1, Mike3; Figure 10), indicating that the water mass over the sediment surface was the same in May at both locations and towards the end of the peak river discharge. In contrast, in October 2015, both nutrients’ concentrations in the overlying water were up to 3× higher at the upstream (Mike1: TIN: 47.2 μM; PO43−: 2.6 μM) site than the downstream (Mike3: TIN: 3.8 μM; PO43−: 0.8 μM; Figure 10). Higher nutrient concentrations were expected at Mike1 given the direct influence of river discharge; during peak river discharge, nutrient concentrations are approximately the same [58]. Similarly, recent work shows higher NO3− concentrations in the overlying water at Mike Island during warmer months [59]. This riverine influence is underscored by the overlying water PO43− concentration at Mike1 in October (i.e., 2.65 μM; Figure 10) which was 2× the concentration measured in May 2015, while the concentrations at Mike3 were similar during both seasons. The PO43− porewater concentrations did not vary between seasons, probably as a result of the interaction between plant uptake during the growing season and high reducing conditions, where there is high potential for the microbially mediated release of iron (Fe)-bound PO43− from sediments that are characterized by a low organic matter to Fe ratio (OM:Fe) [58].
In contrast to PO43−, the TIN porewater concentrations were high with most of the TIN comprised of NH4+. This form of inorganic nitrogen is dominant in the sediment porewaters, probably as result of high remineralization rates occurring at the end of the growing season in the WLD, when plants begin to die and belowground living biomass is high [60,61]. This major seasonal variation in TIN and PO43− concentrations between locations and the porewater versus the overlying water indicates significant differences in nutrient transport and use (e.g., plant uptake) within the system. For instance, the lack of vegetation early in the year (spring) maintains a homogenous flow moving downstream without a large reduction in water velocity. However, during October, at the end of the vegetation growing season, the river stage is lower and vegetation biomass is high. Water flow from the primary channel upstream still enters the island via the secondary channel, as indicated by the higher nutrient concentrations in this location (Figure 10 and Figure 11). As the flow moves downstream, however, the vegetation can slow water flow [26,27,33]. Additionally, this reduction in water velocity promotes sediment deposition. It has been reported that about 90% of the inorganic phosphorus entering an estuarine/coastal system is bound to sediment particles [58,62]. As the water flow decreases downstream due to the presence of dense vegetation and flow dispersion, sediment (i.e., and adsorbed PO43− in sediment) may become deposited, thus decreasing the availability of PO43− in the overlying water downstream. TIN uptake by plants can help explain the difference in concentrations between Mike1 and Mike3 in October 2015 in our study area. When the water residence time is prolonged due to a reduction in velocity, the vegetation can utilize inorganic nutrients in the overlying water and facilitate the exchange of TIN and PO43− between the overlying water and the sediment by diffusion.
During May, TIN concentrations were significantly lower in the porewater than during October (p < 0.001, Figure 11). However, no significant differences were observed between PO43− concentrations across location or month. As mentioned above, the significantly higher TIN concentrations in October 2015 can be attributed to higher remineralization and microbial activity at the end of the growing season. In addition, this higher concentration in October could be due to the net decomposition or flux of nitrate into the sediments. Because there was a significantly higher NO2− + NO3− (N + N) concentration in the overlying water than the porewater (Figure 10 and Figure 11) it is probable that a net flux occurred from the overlying water into the sediments [59]. Additional studies assessing inorganic and organic nutrient fluxes between the sediment and overlying water using cores and flumes are needed in conjunction with water flow measurement in Mike Island.
Overall, the material collected in the sediment traps show that higher bulk density, lower organic matter, higher nutrient (TP, TN) and carbon (TC) content, and coarser grain size were typical characteristics of the sediment collected at Mike1 (Table 3). High bulk density and low organic matter content suggest that there is more mineral sediment deposition upstream than downstream. In addition, more nutrients and carbon were trapped at Mike1, with the exception of TN in spring. This difference between upstream and downstream locations is caused by the influx of water flow from the secondary channel directly impacting the Mike1 site. Higher sediment TN content during spring at Mike3 could be explained by the contribution of organic matter due to overbank flooding. Coarser sediment was also trapped upstream, which is expected since coarser particles settle out more quickly than finer particles.
Although our sediment trap prototype was efficient in capturing sediment to determine its grain size composition, there is still the need to increase the sampling distribution to determine a water column-integrated sediment loading rate. The two depths used here were selected to evaluate the grain size differences slightly above the sediment surface (S-S) and 30 cm (S-30) above the sediment surface (Figure 2C). These positions were selected at the outset of the study given the lack of information about the potential minimum and maximum water column depths at each station under different river discharge stages. Now that this range and duration was determined at least for two seasons, it is recommended to increase the number of trap positions throughout the water column to characterize the differences in the sediment composition and accumulation resulting from non-linear flow velocity and suspended inorganic profiles with more detail.
4.3. Vegetation
Vegetation significantly influences current speed and wave attenuation [26,27,28,31]. There is evidence that during peak biomass in August 2015, wave height was greatly diminished, likely due to vegetation presence as shown by the small wave heights recorded at Mike1 and Mike3 compared to the April data, when both the vegetation biomass and density were low (Figure 4 and Figure 6). Additionally, the ADV Ocean current velocity data showed large decreases in velocity at Mike3. Thus, vegetation density had a strong influence on the current velocity in this area, which has been similarly observed in other studies [26,27,28,31]. As mentioned in Section 4.1, vegetation can be effective in dissipating waves, but not tides.
We acknowledge that our instrument readings might also reflect vegetation entangled in the tripod given the sporadic noisy data, or that new plant growth interfered with the acoustic and optical signals. This interference could have caused the large decrease in velocity that coincided with an increase in turbidity (Figure 6). Indeed, dense mats of aquatic vegetation (e.g., Eichornia crassipes) were found and removed during retrieval of the instruments in October 2015, thus there is a potential effect of floating vegetation on data collection. Additionally, biofouling was found on some sensors deployed in summer/fall 2015 that impacted our results, such as the OBS readings (e.g., Figure 6F). These field limitations highlight the challenging nature in the analysis of time-series optical and acoustic observations in dense-vegetation coastal areas like the Wax Lake Delta; these limitations are also underscored by the low number of studies in this type of system at the temporal scales we performed our study.
4.4. A Conceptual Model
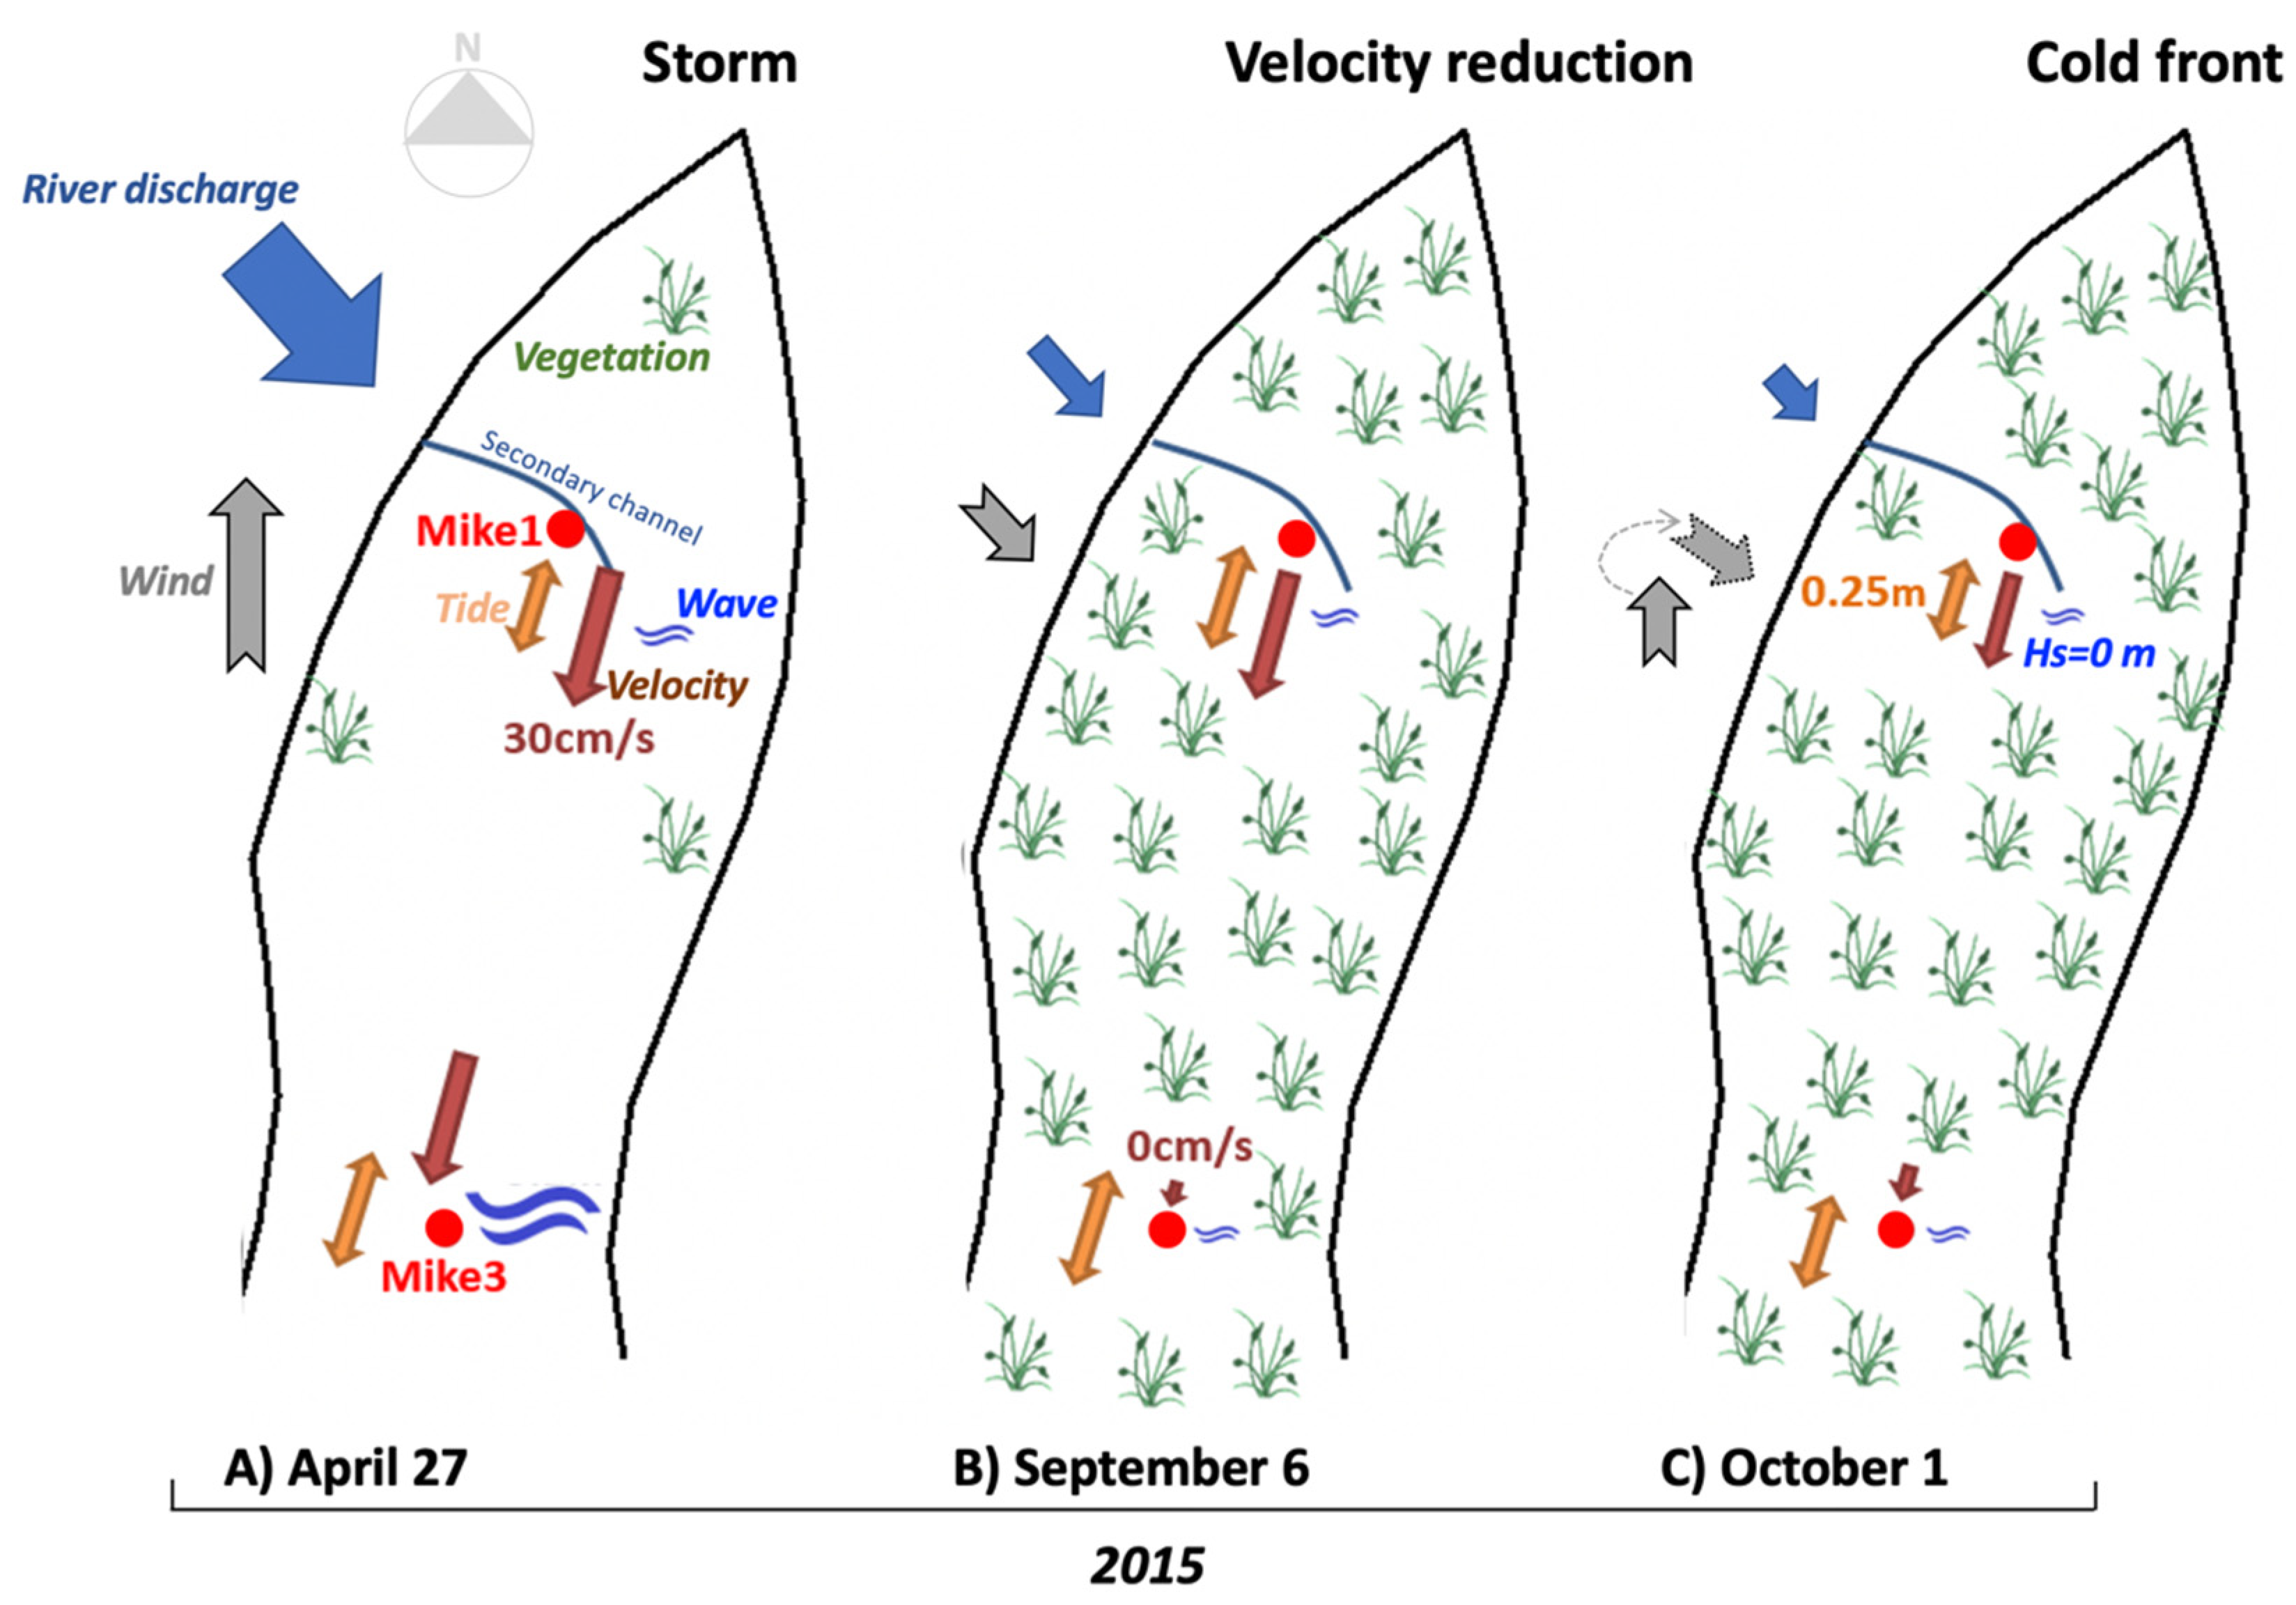
We summarize our results using a conceptual model to illustrate the relative impact of river discharge and wind patterns on hydrodynamic drivers (e.g., waves, current velocity, tides) interacting with vegetation presence on Mike Island in 2015 (Figure 11A). The three scenarios describe the interaction between the observed climatic conditions and field measurements to highlight the relative role and timing of events regulating sediment transport and water velocity across the island. In late April 2015, a storm event enhanced wind speeds, causing up to 0.2 m wave heights at Mike3 that increased the sediment resuspension and water turbidity (Figure 13A). This storm was associated with a tornado, as shown by our wind direction/rotation field measurements and the highest water level (Figure 3). The second scenario was the velocity reduction occurring on 6 September 2015 when the largest discrepancy in the velocity values between Mike1 and Mike3 were recorded (Figure 13B). Although tides were recorded at both Mike1 and Mike3 during this event, wave heights were small at both locations. This reduction is attributed to the widespread dense vegetation across the island during this time, which has also been described in other field and laboratory studies (e.g., [30,32,63,64]). The third scenario consisted of the passage of a cold front on 1 October (Figure 13C). The average water level at Mike1 dropped by 0.8 m and the air temperature (8 °C) was lower than in summer (30 °C). A strong shift in the wind direction from southerly to northwesterly winds was also recorded. Cold fronts are common meteorological events in coastal Louisiana, and it is likely that more than one passed throughout our study area during the instrument deployment in 2015 [36,40,65]. Together, these three scenarios occurring within one year underscore the dynamic interaction between hydrological and climatic events controlling sediment deposition and plant productivity in this river-dominated deltaic system in a subtropical climate.
Finally, this conceptual model invites several follow-up questions to be validated in time and space. In the future, additional study locations, in either other permanent stations (i.e., Mike Island platform network) or other locations across the delta, should be able to capture further granularity. For example, selecting a more extensive elevation gradient across the width of Mike Island might show stronger differences between the vegetations’ extension/biomass and sediment transport patterns. Thus, our results represent a baseline to advance further studies in Mike Island and other deltaic islands, including the need to expand monitoring stations to other deltaic islands and perform similar studies in other river-dominated delta systems.
5. Conclusions
Our results show how several factors, including seasonal patterns in wind, wave, river, tide, and vegetation presence (density, productivity and biomass) interact on Mike Island to regulate sediment transport. These interactions, depending on the Atchafalaya River stage, can influence accretion rates and relative elevation as determined by other studies describing lobe formation and expansion in the WLD region (e.g., [3,39,61]). Indeed, we documented the relative importance of pulsing storm events as a critical natural disturbance that trigger biological and geophysical changes in short periods [65,66]. During our spring deployment, Mike Island was characterized by limited vegetation coverage and biomass and high river discharge; river and wind-driven waves were dominant factors controlling sediment transport from the upstream (Mike1) station to the downstream (Mike3). Additionally, the tidal impact on river discharge upstream at the Calumet gauge station was minimal in April 2015 and the tides on Mike Island shifted between diurnal and semidiurnal patterns. Regardless of the river stages and vegetation biomass, the FFT results show the combined presence of distinct semidiurnal and diurnal tides in Mike1 and Mike3 in April and September–October 2015. In summer, the vegetation growth and expansion created a “vegetated channel” that constricted water flow to the middle of the island (Figure 6D and Figure 13; [30]). In addition, when river discharge was low and vegetation biomass high, the waves were very small, yet tidal forcing was detected. Although tides can still penetrate through the dense and extensive vegetation patches, even reaching the Calumet station upstream, this vegetation slows the current velocity and attenuates waves, prolonging water residence time throughout Mike Island (Figure 11). This increase in water residence time induced significant fine sediment deposition as registered in our sediment traps. This process has also been reported in other coastal and river-dominated habitats [21,26,27,28,29,30,31,32,33]. The presence of vegetation, especially aboveground biomass, enhanced sediment trapping and served as a critical functional attribute regulating net accretion and land formation in the WLD. Our study shows that the magnitude, extension, and spatiotemporal variation of hydrological and climate variables controlling sediment deposition and vegetation trapping efficiency needs to be quantified at different temporal (hours, days) and spatial scales (m, ha). Hence, our study, by design, focused on measurements of critical environmental variables at this local scale that are lacking not only in the WLD, but also in other deltaic systems. This hierarchical approach can help advance engineering designs and model parametrization to successfully implement sediment river diversions to restore coastal wetlands in coastal Louisiana, as proposed in the 2012 and 2017 Louisiana’s Comprehensive Master Plan for a Sustainable Coast [67].
Supplementary Materials
The following materials are available online at https://0-www-mdpi-com.brum.beds.ac.uk/2073-4441/12/7/2072/s1, Table S1: ANOVA source table for the total inorganic nitrogen (TIN) concentrations; the following notation is used to indicate levels of significance * <0.05, ** <0.01, *** <0.001, Table S2: ANOVA source table for the PO43− concentrations; the following notation is used to indicate levels of significance * <0.05, ** <0.01, *** <0.001, Table S3: ANOVA source table for PO43− concentrations at Mike1 during May 2015; the following notation is used to indicate levels of significance * <0.05, ** <0.01, *** <0.001, Table S4: ANOVA source table for PO43− concentrations at Mike3 during May 2015; the following notation is used to indicate levels of significance * <0.05, ** <0.01, *** <0.001.
Author Contributions
Conceptualization, C.E., K.X., and V.H.R.-M.; methodology, C.E., K.X., and V.H.R.-M.; software, C.E., K.X., and V.H.R.-M.; validation, C.E., K.X., and V.H.R.-M.; formal analysis, C.E., K.X., and V.H.R.-M.; investigation, C.E., K.X., and V.H.R.-M.; resources, K.X., and V.H.R.-M.; data curation, C.E., K.X., and V.H.R.-M.; writing—original draft preparation, C.E., K.X., and V.H.R.-M.; writing—review and editing, C.E., K.X., and V.H.R.-M.; visualization, C.E., K.X., and V.H.R.-M.; supervision, K.X., and V.H.R.-M.; project administration, C.E., K.X., and V.H.R.-M.; funding acquisition, K.X., V.H.R.-M. All authors have read and agreed to the published version of the manuscript.
Funding
This research was funded by the Coastal Protection and Restoration Authority (CPRA) through the Coastal Science Assistantship Program (CSAP). Additional partial support was provided by a pFund through the Board of Regents and the National Science Foundation-Coupled Natural Human systems grant (No. DBCS 1212112). V.H.R.-M also received partial support from the Department of the Interior South-Central Climate Adaptation Science Center (Cooperative Agreement #G12AC00002).
Acknowledgments
We are particularly grateful for the advice, guidance and help from Robert Twilley, Edward Castañeda-Moya and Gregg Snedden throughout the entire study, including the use of the established platforms on Mike Island. We are also thankful for the laboratory and field support from our colleagues in the Wetland Biogeochemistry Analytical Services, Sediment Dynamics Laboratory, and Earth Scan Laboratory at LSU. We thank four anonymous reviewers for constructive comments on earlier versions of this manuscript. We also extend our sincere appreciation to many colleagues that volunteered in the field and help in the data analysis.
Conflicts of Interest
The authors declare no conflict of interest.
References
- Blum, M.D.; Roberts, H.H. The Mississippi Delta region: Past, present, and future. Annu. Rev. Earth Planet Sci. 2012, 40, 655–683. [Google Scholar] [CrossRef]
- Salinas, L.M.; Delaune, R.D.; Patrick, W.H. Changes occurring along a rapidly submerging coastal area—Louisiana, USA. J. Coast. Res. 1986, 2, 269–284. [Google Scholar]
- Paola, C.; Twilley, R.R.; Edmonds, D.A.; Kim, W.; Mohrig, D.; Parker, G.; Viparelli, E.; Voller, V.R. Natural Processes in Delta Restoration: Application to the Mississippi Delta. Annu. Rev. Mar. Sci. 2011, 3, 67–91. [Google Scholar] [CrossRef]
- Rosen, T.; Xu, Y.J. Recent decadal growth of the Atchafalaya River Delta complex: Effects of variable riverine sediment input and vegetation succession. Geomorphology 2013, 194, 108–120. [Google Scholar] [CrossRef]
- Rivera-Monroy, V.H.; Elliton, C.E.; Narra, S.; Meselhe, E.; Zhao, X.; White, E.; Sasser, C.E.; Visser, J.M.; Meng, X.; Wang, H.; et al. Wetland Biomass and Productivity in Coastal Louisiana: Base Line Data (1976–2015) and Knowledge Gaps for the Development of Spatially Explicit Models for Ecosystem Restoration and Rehabilitation Initiatives. Water 2019, 11, 2054. [Google Scholar] [CrossRef] [Green Version]
- Schleiss, A.J.; Franca, M.J.; Juez, C.; De Cesare, G. Reservoir Sedimentation. J. Hydraul. Res. 2016, 54, 595–614. [Google Scholar] [CrossRef]
- Couvillion, B.R.; Beck, H.; Schoolmaster, D.; Fischer, M. Land Area Change in coastal Louisiana 1932 to 2016; U.S. Geological Survey Reston: Reston, VA, USA, 2017; p. 16.
- Couvillion, B.R.; Fischer, M.R.; Beck, H.J.; Sleavin, W.J. Spatial configuration trends in coastal Louisiana from 1985 to 2010. Wetlands 2016, 36, 347–359. [Google Scholar] [CrossRef]
- Allison, M.A.; Meselhe, E.A. The use of large water and sediment diversions in the lower Mississippi River (Louisiana) for coastal restoration. J. Hydrol. 2010, 387, 346–360. [Google Scholar] [CrossRef]
- Nittrouer, J.A.; Best, J.L.; Brantley, C.; Cash, R.W.; Czapiga, M.; Kumar, P.; Parker, G. Mitigating land loss in coastal Louisiana by controlled diversion of Mississippi River sand. Nat. Geosci. 2012, 5, 534–537. [Google Scholar] [CrossRef]
- Xu, K.; Bentley, S.J., Sr.; Robichaux, P.; Sha, X.; Yang, H. Implications of texture and erodibility for sediment retention in receiving basins of coastal Louisiana diversions. Water 2016, 8, 26. [Google Scholar] [CrossRef] [Green Version]
- Xu, K.H.; Bentley, S.J.; Day, J.W.; Freeman, A.M. A review of sediment diversion in the Mississippi River Deltaic Plain. Estuar. Coast. Shelf Sci. 2019, 225, 106241. [Google Scholar] [CrossRef]
- Juez, C.; Schärer, C.; Jenny, G.; Schleiss, A.J.; Franca, M.J. Floodplain land cover and flow hydrodynamic control of overbank sedimentation in compound channel flows. Water Resour. Res. 2019, 55, 9072–9091. [Google Scholar] [CrossRef]
- Reddy, K.R.; Kadlec, R.H.; Flaig, E.; Gale, P.M. Phosphorus Retention in Streams and Wetlands: A Review. Crit. Rev. Environ. Sci. Technol. 1999, 29, 83–146. [Google Scholar] [CrossRef]
- Reddy, K.R.; Patrick, W.H. Nitrogen transformations and loss in flooded soils and sediments. Crit. Rev. Environ. Control 1984, 13, 273–309. [Google Scholar] [CrossRef]
- Nichols, D.S. Capacity of natural wetlands to remove nutrients from wastewater. J. Water Pollut. Control Fed. 1983, 55, 495–505. Available online: https://0-www-jstor-org.brum.beds.ac.uk/stable/25041910 (accessed on 22 June 2016).
- Day, J.W.; Ko, J.Y.; Rybczyk, J.; Sabins, D.; Bean, R.; Berthelot, G.; Brantley, C.; Cardoch, L.; Conner, W.; Day, J.N.; et al. The use of wetlands in the Mississippi Delta for wastewater assimilation: A review. Ocean Coast. Manag. 2004, 47, 671–691. [Google Scholar] [CrossRef]
- Fisher, J.; Acreman, M.C. Wetland nutrient removal: A review of the evidence. Hydrol. Earth Syst. Sci. 2004, 8, 673–685. [Google Scholar] [CrossRef] [Green Version]
- Hunter, R.; Lane, R.; Day, J.; Lindsey, J.; Day, J.; Hunter, M. Nutrient removal and loading rate analysis of Louisiana forested wetlands assimilating treated municipal effluent. Environ. Manag. 2009, 44, 865–873. [Google Scholar] [CrossRef] [PubMed]
- Twilley, R.R.; Rivera-Monroy, V.H. Sediment and nutrient trade-offs in restoring Mississippi River Delta: Restoration versus eutrophication. J. Contemp. Water Res. Educ. 2009, 141, 39–44. [Google Scholar] [CrossRef]
- Henry, K.M.; Twilley, R.R. Nutrient biogeochemistry during the early stages of delta development in the Mississippi River Deltaic Plain. Ecosystems 2014, 17, 327–343. [Google Scholar] [CrossRef]
- Rabalais, N.; Turner, R.E.; Wiseman, W.J. Gulf of Mexico hypoxia, A.K.A. “The Dead Zone.”. Annu. Rev. Ecol. Syst. 2002, 33, 235–263. [Google Scholar] [CrossRef]
- O’Connor, M.T.; Moffett, K.B. Groundwater dynamics and surface water- groundwater interactions in a prograding delta island, Louisiana, USA. J. Hydrol. 2015, 524, 15–29. [Google Scholar] [CrossRef]
- Twilley, R.R.; Casteñeda-Moya, E.; Bentley, S.J., Sr.; Chen, Q.; Edmonds, D.A.; Hagan, S.C.; Lam, N.S.; Willson, C.S.; Xu, K.; Braud, D.; et al. Seasonal and spatial variation of surface water nitrate concentrations and water flow in delta islands of Wax Lake Delta, Louisiana. In Proceedings of the State of the Coast Meeting 2016, New Orleans, LA, USA, 2 June 2016. [Google Scholar]
- Peyronnin, N.S.; Caffey, R.H.; Cowan, J.H.; Justic, D.; Kolker, A.S.; Laska, S.B.; McCorquodale, A.; Melancon, E.; Nyman, J.A.; Twilley, R.R.; et al. Optimizing sediment diversion operations: Working group recommendations for integrating complex ecological and social landscape interactions. Water 2017, 9, 368. [Google Scholar] [CrossRef] [Green Version]
- Leonard, L.A.; Luther, M.E. Flow hydrodynamics in tidal marsh canopies. Limnol. Oceanog. 1995, 40, 1474–1484. [Google Scholar] [CrossRef]
- Nepf, H.M.; Sullivan, J.A.; Zavitoski, R.A. A model for diffusion within emergent vegetation. Limnol. Oceanog. 1997, 42, 1735–1745. [Google Scholar] [CrossRef] [Green Version]
- Nepf, H.M. Drag, turbulence, and diffusion in flow through emergent vegetation. Water Resour. Res. 1999, 35, 479–489. [Google Scholar] [CrossRef]
- Nepf, H.M.; Vivoni, E.R. Flow structure in depth-limited, vegetated flow. J. Geophys.Res. 2000, 105, 28547–28557. [Google Scholar] [CrossRef]
- Madsen, J.D.; Chambers, P.A.; James, W.F.; Koch, E.W.; Westlake, D.F. The interaction between water movement, sediment dynamics and submersed macrophytes. Hydrobiologia 2001, 444, 71–84. [Google Scholar] [CrossRef]
- Cotton, J.A.; Wharton, G.; Bass, J.A.B.; Heppell, C.M.; Wotton, R.S. The effects of seasonal changes to in-stream vegetation cover on patterns of flow and accumulation of sediment. Geomorphology 2006, 77, 320–334. [Google Scholar] [CrossRef]
- Augustin, L.N.; Irish, J.L.; Lynett, P. Laboratory and numerical studies of wave damping by emergent and near-emergent wetland vegetation. Coast. Eng. J. 2009, 56, 332–340. [Google Scholar] [CrossRef]
- Corenblit, D.; Steiger, J.; Gurnell, A.M.; Tabacchi, E.; Roques, L. Control of sediment dynamics by vegetation as a key function driving biogeomorphic succession within fluvial corridors. Earth Surf. Proc. Land. 2009, 34, 1790–1810. [Google Scholar] [CrossRef]
- Smith, B.C. The Effects of Vegetation on Island Geomorphology in the Wax Lake Delta, Louisiana. Master’s Thesis, The University of Texas at Austin, Austin, TX, USA, May 2014. [Google Scholar]
- Mossa, J.; Roberts, H.H. Synergism of riverine and winter storm-related sediment transport processes in Louisiana’s coastal wetlands. Trans. Gulf Coast Assoc. Geol. Soc. 1990, 40, 635–642. [Google Scholar]
- Roberts, H.H.; DeLaune, R.D.; White, J.R.; Li, C.; Sasser, C.E.; Braud, D.; Weeks, E.; Khalil, S. Floods and cold front passages: Impacts on coastal marshes in a river diversion setting (Wax Lake Delta Area, Louisiana). J. Coast. Res. 2015, 31, 1057–1068. [Google Scholar] [CrossRef]
- Cahoon, D.R. A review of major storm impacts on coastal wetland elevations. Estuar. Coasts 2006, 29, 889–898. [Google Scholar] [CrossRef]
- Turner, R.E.; Baustian, J.J.; Swenson, E.M.; Spicer, J.S. Wetland sedimentation from hurricanes Katrina and Rita. Science 2006, 314, 449–452. [Google Scholar] [CrossRef]
- Hiatt, M.; Passalacqua, P. Hydrological connectivity in river deltas: The first-order importance of channel-island exchange. Water Resour. Res. 2015, 51, 2264–2282. [Google Scholar] [CrossRef] [Green Version]
- Bevington, A.E.; Twilley, R.R.; Sasser, C.R.; Holm, G.O., Jr. Contribution of river floods, hurricanes, and cold fronts to elevation change in a prograding deltaic floodplain in the northern Gulf of Mexico, USA. Estuar. Coast. Shelf Sci. 2016, 191, 188–200. [Google Scholar] [CrossRef] [Green Version]
- Hiatt, M.; Snedden, G.; Day, J.W.; Robli, R.V.; Nyman, J.A.; Lane, R.; Sharp, L.A. Drivers and impacts of water level fluctuations in the Mississippi River delta: Implications for delta restoration. Estuar. Coast. Shelf Sci. 2019, 224, 117–137. [Google Scholar] [CrossRef]
- Roberts, H.H.; Coleman, J.M.; Bentley, S.J., Sr.; Walker, N.D. An embryonic major delta lobe: A new generation of delta studies in the Atchafalaya-Wax Lake Delta system. Trans. Gulf Coast Assoc. Geol. Soc. 2003, 53, 690–703. [Google Scholar]
- Day, J.W., Jr.; Boesch, D.F.; Clairain, E.J.; Kemp, G.P.; Laska, S.B.; Mitsch, W.J.; Orth, K.; Mashriqui, H.; Reed, D.J.; Shabman, L.; et al. Restoration of the Mississippi Delta: Lessons from Hurricanes Katrina and Rita. Science 2007, 315, 1679–1684. [Google Scholar] [CrossRef] [Green Version]
- Wellner, R.; Beaubouef, R.; Van Wagoner, J.; Harry, R.; Sun, T. Jet-plume depositional bodies—The primary building blocks of Wax Lake Delta. Trans. Gulf Coast Assoc. Geol. Soc. 2005, 55, 867–909. [Google Scholar]
- Jones, C.E. Radar remote sensing of the Louisiana wetlands to study delta formation and marsh status. Natl. Wetl. Newsl. 2016, 38, 12–16. Available online: https://www.eli.org/sites/default/files/nwn/issue/38.1_Jones.pdf (accessed on 5 January 2020).
- Allison, M.A.; Demas, C.R.; Ebersole, B.A.; Kleiss, B.A.; Little, C.D.; Meselhe, E.A.; Powell, N.J.; Pratt, T.C.; Vosburg, B.M. A water and sediment budget for the lower Mississippi Atchafalaya River in flood years 2008–2010: Implications for sediment discharge to the oceans and coastal restoration in Louisiana. J. Hydrol. 2012, 432, 84–97. [Google Scholar] [CrossRef]
- Kolker, A.S.; Li, C.; Walker, N.D.; Pilley, C.; Ameen, A.D.; Boxer, G.; Ramatchandirane, C.; Ullah, M.; Williams, K.A. The impacts of the great Mississippi/Atchafalaya River flood on the oceanography of the Atchafalaya Shelf. Cont. Shelf Res. 2014, 86, 17–33. [Google Scholar] [CrossRef]
- Bevington, A.E.; Twilley, R.R. Island edge morphodynamics along a chronosequence in a prograding deltaic floodplain wetland. J. Coast. Res. 2018, 34, 806–817. [Google Scholar] [CrossRef]
- Twilley, R.R.; Day, J.W.; Bevington, A.E.; Castañeda-Moya, E.; Christensen, A.; Holm, G.; Heffner, L.R.; Lane, R.; McCall, A.; Aarons, A.; et al. Ecogeomorphology of coastal deltaic floodplains and estuaries in an active delta: Insights from the Atchafalaya Coastal Basin. Estuar. Coast. Shelf Sci. 2019, 227, 106341. [Google Scholar] [CrossRef]
- Heiri, O.; Lotter, A.F.; Lemcke, G. Loss on ignition as a method for estimating organic and carbonate content in sediments: Reproducibility and comparability of results. J. Paleolimnol. 2001, 25, 101–110. [Google Scholar] [CrossRef]
- Aspila, K.I.; Agemian, H.; Chau, A.S.Y. Semiautomated method for determination of inorganic, organic, and total phosphate in sediments. Analyst 1976, 101, 187–197. [Google Scholar] [CrossRef]
- Karimpour, A.; Chen, Q. Wind wave analysis in depth limited water using OCEANLYZ, a MATLAB toolbox. Comput. Geosci. 2017, 106, 181–189. [Google Scholar] [CrossRef]
- Tolotti, M.; Thies, H.; Nickus, U.; Psenner, R. Temperature modulated effects of nutrients on phytoplankton changes in a mountain lake. Hydrobiologia 2012, 221, 61–75. [Google Scholar] [CrossRef]
- Visser, J.M.; Sasser, C.E.; Chabreck, R.H.; Linscombe, R.G. Marsh vegetation types of the Mississippi River Deltaic Plain. Estuaries 1998, 21, 818–828. [Google Scholar] [CrossRef]
- Carle, M.V.; Sasser, C.E. Productivity and Resilience: Long-Term Trends and Storm-Driven Fluctuations in the Plant Community of the Accreting Wax Lake Delta. Estuar. Coasts 2016, 39, 406–422. [Google Scholar] [CrossRef]
- Landsat Missions, United States Geological Survey (USGS). Available online: https://www.usgs.gov/land-resources/nli/landsat/landsat-data-access?qt-science_support_page_related_con=0#qt-science_support_page_related_con (accessed on 5 January 2020).
- Zordan, J.; Juez, C.; Schleiss, A.J.; Franca, M.J. Entrainment, transport and deposition of sediment by saline gravity currents. Adv. Water Resour. 2018, 115, 17–31. [Google Scholar] [CrossRef]
- Upreti, K.; Maiti, K.; Rivera-Monroy, V.H. Microbial mediated sedimentary phosphorus mobilization in emerging and eroding wetlands of coastal Louisiana. Sci. Total Environ. 2019, 651, 122–133. [Google Scholar] [CrossRef] [PubMed]
- Li, S.; Christensen, A.; Twilley, R.R. Benthic fluxes of dissolved oxygen and nutrients across hydrogeomorphic zones in a coastal deltaic floodplain within the Mississippi River delta plain. Biogeochemistry 2020, 149, 115–140. [Google Scholar] [CrossRef]
- Rivery-Monroy, V.H.; Lenaker, P.; Twilley, R.R.; Delaune, R.D.; Lindau, C.W.; Nuttle, W.; Habib, E.; Fulweiler, R.W.; Casteñeda-Moya, E. Denitrification in coastal Louisiana: A spatial assessment and research needs. J. Sea Res. 2010, 63, 157–172. [Google Scholar] [CrossRef]
- Carle, M.V.; Sasser, C.E.; Roberts, H.H. Accretion and vegetation community change in the Wax Lake Delta following the historic 2011 Mississippi River flood. J. Coast. Res. 2015, 31, 569–587. [Google Scholar] [CrossRef]
- Froelich, P.N. Kinetic control of dissolved phosphate in natural rivers and estuaries—A primer on the phosphate buffer mechanism. Limnol. Oceanog. 1988, 33, 649–668. [Google Scholar] [CrossRef]
- Anderson, M.E.; Smith, J.M.; McKay, S.K. Wave dissipation by vegetation. In Coastal and Hydraulics Engineering Technical Note ERDC/CHL CHETN-I-82; U.S. Army Engineer Research and Development Center: Vicksburg, MS, USA, 2011; pp. 1–22. Available online: http://chl.erdc.usace.army.mil.chetn (accessed on 5 January 2020).
- Temmerman, S.; Bouma, T.J.; Govers, G.; Wang, Z.B.; De Vries, M.B.; Herman, P.M.J. Impact of vegetation on flow routing and sedimentation patterns: Three- dimensional modeling for a tidal marsh. J. Geophys. Res. Earth Surf. 2005, 110. [Google Scholar] [CrossRef]
- Li, C.; Roberts, H.; Stone, G.W.; Weeks, E.; Luo, Y. Wind surge and saltwater intrusion in Atchafalaya Bay during onshore winds prior to cold front passage. Hydrobiologia 2011, 658, 27–39. [Google Scholar] [CrossRef]
- Huang, W.; Li, C. Cold front driven flows through multiple inlets of Lake Pontchartrain Estuary. J. Geophys. Res. 2017, 122, 8627–8645. [Google Scholar] [CrossRef] [Green Version]
- Coastal Protection and Restoration Authority. Available online: http://coastal.la.gov/our-plan/2017-coastal-master-plan/ (accessed on 5 January 2020).
Figure 1.
(A) Map of the National Oceanic and Atmospheric Administration (NOAA) Amerada Pass (NOAA-8764227) wind and the United States Geological Survey (USGS) Calumet (USGS-07381590) discharge stations in relation to Mike Island on the Wax Lake Delta. Black rectangle displays the extent of panel (B). The circle in the Gulf of Mexico inset shows the overall study area. (B) Observational/sampling stations Mike1 and Mike3 are located ~1.5 km apart. Base maps in (A,B) are both from Google Earth.

Figure 2.
(A). X-shaped platform deployed at Mike1 with an acoustic Doppler velocimeter (ADV) Argonaut, optical backscatter sensor (OBS) 5+, and a wave gauge. (B) Tripod deployed at Mike3 with instruments including an ADV Ocean (sensor and external battery), OBS 3A, and a wave gauge. (C) Set of sediment traps used for the collection at the sediment surface (S-S) and 30 cm above the bed (S-30); the picture was taken before the set was inserted into the sediment.

Figure 3.
Wind, relative water level, and water level difference measurements (A–D) from the April 2015 instrument deployment at Mike1 and Mike3. Note the increase in wind speed and relative water level towards the end of April. The Calumet discharge station (B) is located ~20 km upstream of Mike Island (29°41′52″ N, 91°22′22″ W). Wind speed and direction data were downloaded from NOAA’s National Data Buoy Center station, located at Amerada Pass on Atchafalaya Delta (see methods).

Figure 4.
Hydrological variables and turbidity variations, measured in nephelometric turbidity unit-NTU, (A–D) at monitoring stations located in Mike Island (Wax Lake Delta, LA, USA) during instrument deployment in April 2015; note the enhanced wave height at Mike3 and turbidity at Mike1 during late April (rectangle inset). See the methods section for the instruments’ description.

Figure 5.
Wind speed and relative water elevation data during the instrument deployment in Mike Island (Wax Lake Delta, LA, USA) in September–October 2015; (A) wind direction and speed, (B) water lever, (C) relative water lever, (D) water level difference (Mike3 minus Mike1); note the drop in the water level in early October 2015 (rectangle inset). See methods section for instruments’ description. Wind speed and direction data were downloaded from NOAA’s National Data Buoy Center station located at Amerada Pass on Atchafalaya Delta (see methods).

Figure 6.
Water temperature, wave height, current velocity, and turbidity data, measured in nephelometric turbidity unit-NTU, during the instrument deployment in Mike Island (Wax Lake Delta, LA, USA) in September/October 2015; (A) temperature, (B) wave height, (C) current velocity (Mike1), (D) current velocity (Mike3), (E) turbidity (Mike1), (F) turbidity (Mike3); note the sharp water velocity reduction and increase in turbidity at Mike3 on 6 September 2015 (rectangle inset).

Figure 7.
Coefficients of determination (R2) between Mike1 and Mike3 water levels in April (A) and September–October (B) 2015. Mike1 and Mike3 are 1.5 km apart and their water levels are generally tightly coupled.
Figure 7.
Coefficients of determination (R2) between Mike1 and Mike3 water levels in April (A) and September–October (B) 2015. Mike1 and Mike3 are 1.5 km apart and their water levels are generally tightly coupled.

Figure 8.
Water level cycles/day at the Calumet (dashed black), Mike1 (blue) and Mike3 (red) sampling stations in April (A) and September–October (B) 2015. Tidal cycles at the Calumet station are barely detected in April due to spring river flood dominance.
Figure 8.
Water level cycles/day at the Calumet (dashed black), Mike1 (blue) and Mike3 (red) sampling stations in April (A) and September–October (B) 2015. Tidal cycles at the Calumet station are barely detected in April due to spring river flood dominance.

Figure 9.
LANDSAT images processed using data from the USGS [56] and analyzed by the Earth Scan Laboratory at Louisiana State University (LSU). Images show the vegetation cover on Mike Island during (A) low density and biomass on 19 April 2015, and (B) the peak end of summer productivity on 25 August 2015.

Figure 10.
Soluble reactive phosphorus (SRP, PO43−) and total inorganic nitrogen (TIN) concentrations (μM) in overlying water at the Mike1 (square) and Mike3 (cross) locations during May (blue) and October (red) 2015; standard error bars are included in both the x and y dimensions.
Figure 10.
Soluble reactive phosphorus (SRP, PO43−) and total inorganic nitrogen (TIN) concentrations (μM) in overlying water at the Mike1 (square) and Mike3 (cross) locations during May (blue) and October (red) 2015; standard error bars are included in both the x and y dimensions.

Figure 11.
Soluble reactive phosphorus (SRP, PO43−) and total inorganic nitrogen (TIN) concentrations (μM) in porewater at the Mike1 (square) and Mike3 (cross) locations during May (blue) and October (red) 2015; standard error bars are present in both the x and y dimensions.
Figure 11.
Soluble reactive phosphorus (SRP, PO43−) and total inorganic nitrogen (TIN) concentrations (μM) in porewater at the Mike1 (square) and Mike3 (cross) locations during May (blue) and October (red) 2015; standard error bars are present in both the x and y dimensions.

Figure 12.
Grain size distribution (µm) of sediment collected in the traps during (A) 28 March–2 May 2015 and (B) 28 August–2 October 2015. See Figure 2C showing the trap setup at bottom (sediment surface) and water column (30 cm above sediment surface) positions.
Figure 12.
Grain size distribution (µm) of sediment collected in the traps during (A) 28 March–2 May 2015 and (B) 28 August–2 October 2015. See Figure 2C showing the trap setup at bottom (sediment surface) and water column (30 cm above sediment surface) positions.

Figure 13.
Conceptual diagram describing the climatic and hydrological events controlling sediment deposition and transport in Mike Island (Wax Lake Delta, Louisiana) in 2015: (A) storm event, (B) water velocity reduction due to vegetation interference and (C) cold front.
Figure 13.
Conceptual diagram describing the climatic and hydrological events controlling sediment deposition and transport in Mike Island (Wax Lake Delta, Louisiana) in 2015: (A) storm event, (B) water velocity reduction due to vegetation interference and (C) cold front.


Table 1.
Sampling specifications and placement of the instruments deployed at Mike1 and Mike3 during both field campaigns.
Table 1.
Sampling specifications and placement of the instruments deployed at Mike1 and Mike3 during both field campaigns.
| Station | Instrument | Sensor Orientation | Distance Above Sediment–Water Interface (cm) | Sampling Rate (Hz) | Burst Duration (s) | Sampling Interval (s) |
|---|---|---|---|---|---|---|
| Mike1 | ADV Argonaut | downward looking | 15 | 0.2 | 60 | 3600 |
| OBS 5+ | downward looking, optic window facing upstream | 15 | 1 | 60 | 3600 | |
| Wave Gauge | downward looking | 15 | 10 | 1200 | 3600 | |
| Mike3 | ADV Ocean | downward looking | 15 | 1 | 1024 | 3600 |
| OBS 3A | downward looking, optic window facing upstream | 15 | 1 | 60 | 3600 | |
| Wave Gauge | downward looking | 15 | 10 | 1200 | 3600 |
Table 2.
Total suspended solids (TSS) concentrations in the surface and middle water column sampled in March, May, August and October 2015 at both Mike1 and Mike3 stations.
Table 2.
Total suspended solids (TSS) concentrations in the surface and middle water column sampled in March, May, August and October 2015 at both Mike1 and Mike3 stations.
| Day | Month | Location | Surface TSS (mg/L) | Middle TSS (mg/L) |
|---|---|---|---|---|
| 30 | March | Mike1 | 187.57 | 235.43 |
| Mike3 | 75.71 | 103.48 | ||
| 2 | May | Mike1 | 99.57 | 122.67 |
| Mike3 | 80.24 | 53.93 | ||
| 28 | August | Mike1 | 41.38 | 101.24 |
| Mike3 | 17.76 | 22.29 | ||
| 22 | October | Mike1 | 377.55 | 28.38 |
| Mike3 | 53.07 | 110.43 |
Table 3.
Sediment total phosphorus (TP), total nitrogen (TN) and total carbon (TC) concentrations (mg/cm3). Sediment was collected in sediment traps located at the sampling stations Mike1 and Mike 3 during the spring (n = 1) and summer/fall 2015 (n = 3) deployments. See Figure 2C and methods section for trap specifications and sampling description.
| SPRING | SUMMER/FALL | ||||||
|---|---|---|---|---|---|---|---|
| TP (mg/cm3) | TN (mg/cm3) | TC (mg/cm3) | TP (mg/cm3) | TN (mg/cm3) | TC (mg/cm3) | ||
| Mike1 | Water Column | 0.5804 | 6.34 | 84.02 | 0.5658 | 10.91 | 123.4 |
| Sediment Surface | 0.5758 | 6.68 | 92.98 | 0.5796 | 11.51 | 120.2 | |
| Mike3 | Water Column | 0.4282 | 10.91 | 10.95 | 0.0919 | 3.35 | 32.2 |
| Sediment Surface | 0.4494 | 11.51 | 13.25 | 0.1988 | 7.57 | 78.4 | |
© 2020 by the authors. Licensee MDPI, Basel, Switzerland. This article is an open access article distributed under the terms and conditions of the Creative Commons Attribution (CC BY) license (http://creativecommons.org/licenses/by/4.0/).
Share and Cite
MDPI and ACS Style
Elliton, C.; Xu, K.; Rivera-Monroy, V.H. The Impact of Biophysical Processes on Sediment Transport in the Wax Lake Delta (Louisiana, USA). Water 2020, 12, 2072. https://0-doi-org.brum.beds.ac.uk/10.3390/w12072072
AMA Style
Elliton C, Xu K, Rivera-Monroy VH. The Impact of Biophysical Processes on Sediment Transport in the Wax Lake Delta (Louisiana, USA). Water. 2020; 12(7):2072. https://0-doi-org.brum.beds.ac.uk/10.3390/w12072072
Chicago/Turabian StyleElliton, Courtney, Kehui Xu, and Victor H. Rivera-Monroy. 2020. "The Impact of Biophysical Processes on Sediment Transport in the Wax Lake Delta (Louisiana, USA)" Water 12, no. 7: 2072. https://0-doi-org.brum.beds.ac.uk/10.3390/w12072072
Note that from the first issue of 2016, this journal uses article numbers instead of page numbers. See further details here.