Effects of Different Irrigation Methods on Environmental Factors, Rice Production, and Water Use Efficiency


1
College of Agricultural Science and Engineering, Hohai University, Nanjing 211106, China
2
Xuzhou Institute of Water Resources Science, Xuzhou 221008, China
*
Author to whom correspondence should be addressed.
Water 2020, 12(8), 2239; https://0-doi-org.brum.beds.ac.uk/10.3390/w12082239
Submission received: 5 July 2020
/
Revised: 5 August 2020
/
Accepted: 7 August 2020
/
Published: 9 August 2020
(This article belongs to the Special Issue Crop Water Stress and Deficit Irrigation)
Abstract
:Rice is one of the most important food crops in China and is also the largest user of agricultural water. Experiments were conducted for two consecutive years at two locations of Jiangsu province to study the effect of four irrigation methods with four replications (shallow water irrigation (FSI), wet-shallow irrigation (WSI), controlled irrigation (CI), and rain-catching and controlled irrigation (RCCI)) on drainage, rainwater utilization rate, pollutant load of N and P, irrigation water, grain yield, and water use efficiency. The results show that FSI treatment used the largest irrigation amount, which is significantly higher than the other three irrigation methods, but the southern part of Jiangsu province especially Nanjing and riverside areas are relatively rich in water resources. It can be seen from our findings that FSI and RCCI are the best irrigation methods in Nanjing area to get a higher yield. However, the yield of CI treatment varies greatly; the annual and seasonal yield changes of CI treatment are higher than those of other treatments; and the risk of yield reduction is greater. Thus, considering water saving and high efficiency, RCCI is a better irrigation strategy than FSI. Combined with the following analysis, it can be seen that RCCI irrigation treatment has less nitrogen and phosphorus pollution load with no significant difference in yield in Lianshui and in 2017 in Nanjing area. Therefore, RCCI is more suitable for irrigation in Lianshui and similar areas.
1. Introduction
Rice is one of the main cereal crops in China, and about 65% of Chinese people rely on rice as their staple food. Nearly 95% of the rice grown in China is produced under traditional transplanted conditions with longer periods of flooding [1]. Rice is one of the most important food crops in Jiangsu Province and is also the largest user of agricultural water [2]. More than 80% of agricultural water resources are used for rice irrigation [3]. Rice irrigation is a focus of water-saving irrigation research in Jiangsu Province. Rice production in Jiangsu Province is higher compared to the whole country [2], and the unit usage of chemical fertilizers, pesticides, and herbicides is also at a high level compared to the whole country [4]. A large number of chemical fertilizers and pesticides, if combined with excessive irrigation, will not only waste resources but also cause agricultural nonpoint source pollution and ecological damage [5].
At present, the water-saving irrigation modes for rice in Jiangsu Province mainly include shallow-water frequent irrigation, wet shallow irrigation, alternate dry and wet irrigation, controlled irrigation, and water storage and controlled irrigation, which have been proposed in recent years [6]. A layer of standing water is maintained in shallow-water frequent irrigation method throughout the growing season [7], but the standing water layer is allowed to dry up to 10% of field capacity under wet shallow irrigation before the application of next irrigation [8]. Alternate dry and wet irrigation is a method to save water in irrigated rice cultivation, and it is the intermittent drying of the rice fields instead of keeping them continuously flooded [9]. The soil of rice fields is kept dry for 60–80% of the growing period under controlled irrigation without standing water after the re-greening stage, similar to the water saving technique used in System of Rice Intensification [10]. The selection of water-saving irrigation modes for rice in the province pays more attention to water-savings, but the irrigation water in the water saving modes is not enough to reduce pollutant emission and improve the ecological effect [11]. Along the Yangtze River, in coastal areas and even in the southern part of Huaibei region, although the implementation of controlled irrigation reduces water demand because of its abundant rainfall, due to excessive drainage, rainwater utilization may be low and nitrogen and phosphorus loss may increase [12], while excessive water storage after rain may increase the risk of production reduction. Therefore, according to the characteristics of different regions in Jiangsu Province, the existing water-saving irrigation technologies are tested and compared to form the spatial layout and operation specifications of water-saving, pollution-control, and eco-friendly rice irrigation and drainage modes in different regions, which are of practical significance for reducing waste of water resources and improving rural environment and ecology.
At present, the selection of water-saving irrigation technology emphasizes its water-saving effect, and, with this as the main consideration factor, different irrigation modes are recommended, but the comprehensive research on its ecological effect and the environmental effect has not been studied yet. Towa and Xiangping [7] found that the lower irrigation limit, although saving irrigation water, promoted the growth of weeds, especially the increase in the number and types of xerophytic weeds, and may aggravate the occurrence of diseases and insect pests, requiring more labor input and/or the cost of herbicides and pesticides. The increase in labor costs and the loss of pollutants can partially or completely offset the positive effect of water-saving.
Different irrigation and drainage modes of rice will affect the discharge load of pollutants from rice fields. Some traditional water-saving irrigation modes, such as controlled irrigation, shallow wet irrigation, etc., and excessive alternation of drought and flood will accelerate the mineralization of chemical fertilizers and organic matters and increase the risk of fertilizer loss. Due to the lack of comparative studies on the environmental and ecological effects of different irrigation modes, it is difficult to determine the appropriate irrigation mode.
The existing water-saving irrigation mode emphasizes the advanced technology, but the lack of research on the risk of reduced yield has affected the scientific selection of irrigation and drainage modes. Although some studies have shown that it is possible to achieve high yield or even increase production while saving water, these practices require sufficient knowledge which the farmers are lacking. Some indices, such as soil moisture content, soil suction, and other parameters, are not well controlled, especially the judgment of the lower limit of irrigation is insufficient, and there is a certain risk of yield reduction [13,14]. Under the mode of water storage and controlled irrigation, increasing the depth of rainwater after rain can reduce water consumption, but it may cause crop lodging and yield reduction. This phenomenon occurs on a large scale in the Taihu Lake Basin and the eastern coastal areas. At present, there is not much research on the risk of water-saving irrigation for rice. There is no report on the risk analysis of yield reduction for different irrigation modes in different regions of Jiangsu Province.
At present, the domestic understanding of water-saving irrigation mainly lies in how to reduce irrigation water consumption. In fact, in addition to consuming rainwater and irrigation water, if the concentration of pollutants in the drainage generated by irrigation and drainage activities exceeds the allowable concentration of the environment, a certain amount of water is required to dilute to reduce environmental and ecological risks.
To study the above-mentioned problems, Jiangsu Rural Water Conservancy Science and Technology Center, Hohai University, and Lianshui Irrigation Experimental Station have jointly carried out research on the ecological and environmental effects of water-saving irrigation for rice. The research was carried out on rice under different irrigation methods to study their effect on rice production, irrigation and drainage volume, nitrogen, and phosphorus pollutant emissions during two consecutive rice growing seasons.
2. Materials and Methods
2.1. Site Descriptions
To study the adaptability of different water-saving methods, field experiments were conducted in Lianshui and Nanjing experimental zones during the 2016 and 2017 rice growing seasons (Figure 1). For Nanjing experimental zone, the experiments were conducted in the southern region at the water-saving park of Hohai University (31°57′ N, 118°50′ E). The soil was taken from the water-saving park. The field capacity of the soil was 38.2%, the dry bulk density of the soil was 1.31 g/cm3, and the soil type was clay loam. The mass fractions of total phosphorus, available phosphorus, total nitrogen, and available nitrogen were 33.0, 10.37, 62.9, and 47.4 mg/kg, respectively. The mass fraction of organic matter and pH values were 2.40% and 8.10, respectively. Lianshui experiments were conducted in Lianshui Irrigation Experimental Station, Lianshui county, which is part of the Lianshui main canal. The geographical location of the experimental area is 33°50′ N and 119°16′ E. The soil was sandy loam textured, and the average dry bulk density of 0–100 cm soil layer was 1.38 g/cm3. The field water holding capacity was 27.9%, and the saturated water content was 33.04% (weight water content). Organic matter was 0.84%, total nitrogen was 0.062%, available phosphorus was 6.8 mg/kg, and available potassium was 112 mg/kg.
2.2. Experimental Detail
2.2.1. Experimental Design of Nanjing Experimental Area
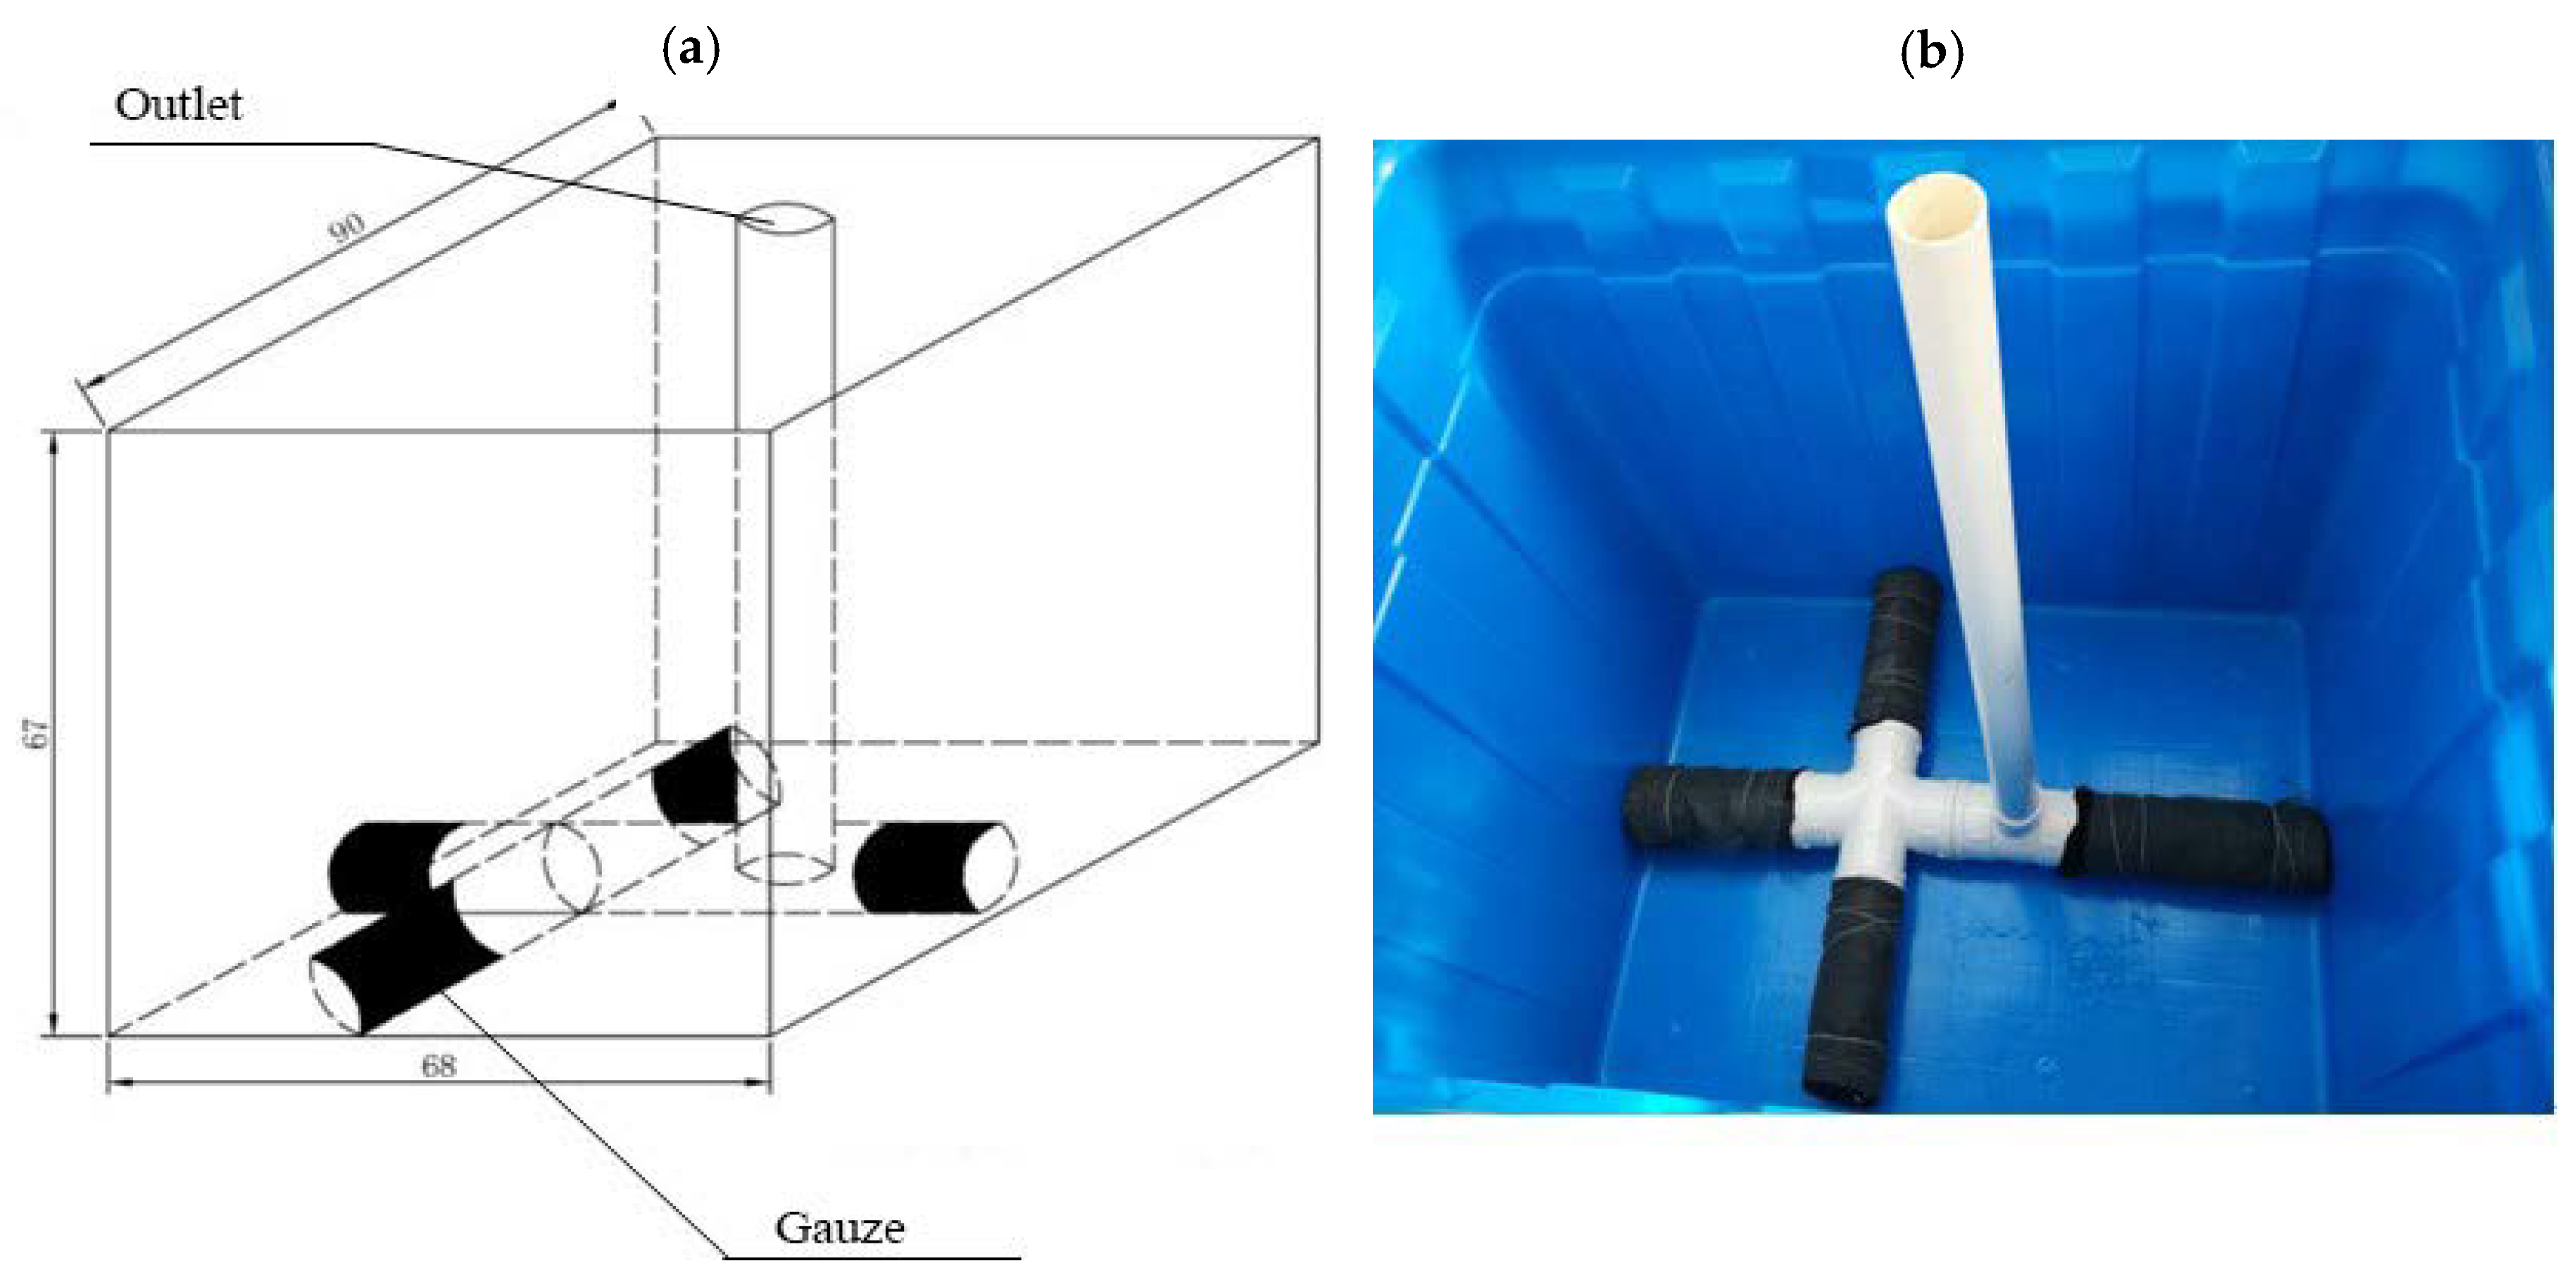
According to the characteristics of the region along the Yangtze River and southern Jiangsu, four different irrigation modes are set up, namely shallow water irrigation (FSI), Wet-shallow Irrigation, (WSI), Controlled Irrigation, (CI), and rain-catching and controlled irrigation (RCCI). The pot planting experimental method was adopted. Each treatment was repeated four times, totaling 16 pots. The dimensions of pots comprise 90 cm, 68 cm, and 77 cm as the inside length, width, and height, respectively. The experimental diagram is shown in Figure 2 and Figure 3. Before loading soil, a 7-cm layer of gravel and coarse sand was laid as a filter layer at the bottom of each pot, and then the air-dried and sieved soil was loaded layer by layer (once every 10 cm) into the pot, reserving a water storage depth of 20 cm for each bucket. The experiments were initiated on 10 May 2016, and 10 May 2017. The rice variety “Nanjing 5055” was used for both experimental sites, which is a high-yield variety commonly used in the region. On June 24, seedlings with basically the same size and three leaves and one stem were selected for transplanting. The row spacing was 20 cm × 15 cm, and there were three plants per hole. The rice was harvested on October 25, with a total growth period of 123 days. The basic fertilizer (compound fertilizer, N:P2O5:K2O = 15%:15%:15%) was applied at 300 kg/ha on June 21. Urea (nitrogen content ≥ 46.2%) was applied at 150.0, 125.0, and 150.0 kg/ha on July 3, July 21, and August 28 as green returning fertilizer, tillering fertilizer, and spike fertilizer, respectively, and the same amount of fertilizer was applied to each treatment. The insecticides were sprayed on July 7 and August 10 because locusts and leaf rollers are common in rice fields. Weeding was done during the whole growth period. When the soil moisture reached the lower limit, irrigation was applied to the upper limit. Additional measurements were carried out in the case of rainfall. When the rainfall exceeded the maximum rainfall storage depth, timely drainage was carried out to the upper limit of rainfall storage. Except for irrigation and drainage measures, other agricultural technology measures were the same (Table 1).
2.2.2. Experimental Design of Lianshui Experimental Area
The experiments were conducted in lysimeters. The lysimeters used had length × width × height = 100 cm × 100 cm × 120 cm. The top was reserved with a water storage depth of 20 cm. The water level was kept the same as that of the field and drained the water to the same level as that of the field when the water level exceeded that of the field, otherwise replenished water through the lower inverted filter layer. The seedlings were raised on 10 May 2016. On June 24, seedlings with three leaves and one heart and the same size were selected for transplanting. The row spacing was 20 cm × 15 cm. Three plants were planted in each hole. The seedlings were harvested on October 25. The total growth period was 123 days. The basic fertilizer (compound fertilizer, N:P2O5:K2O = 15%:15%:15%) was applied at 300 kg/ha on June 21. Urea (nitrogen content ≥ 46.2%) was applied at 150.0, 125.0, and 150.0 kg/ha on July 3, July 21, and August 28 as green returning fertilizer, tillering fertilizer, and spike fertilizer, respectively, and the application rates of each treatment were consistent. Insecticides were sprayed on July 7 and August 10, because locusts and leaf rollers are common in rice fields. Disease prevention and pest control were carried out four times in the whole growth period. The irrigation methods were the same as Nanjing experimental area (Table 1).
2.3. Observation Contents and Test Methods
2.3.1. Meteorological and Soil Moisture Data
The automatic weather stations (Hobo, Onset Computer Corp., Bourne, MA, USA) were installed in both study areas to monitor meteorological parameters including temperature, humidity, wind speed, solar radiation, and rainfall. The measurements were conducted at 8:00 a.m. every day. When there was a water layer on the surface of the field, the depth of water was read by a steel ruler. The volumetric soil moisture contents were monitored by a Time Domain Reflectometer (TDR, Mini Trase System-Soil Moisture Equipment Corp., Santa Barbara, CA, USA). When there was no water layer on the surface of the field, the TDR probes were embedded in the soil at 0–30 cm to measure the soil moisture. TDR was calibrated for the experimental soil before data collection.
2.3.2. Irrigation and Drainage
According to the irrigation and drainage control standards for each treatment, when the soil moisture dropped to the lower limit of irrigation, the water was irrigated to the upper limit (Table 1). When the depth of the water layer exceeded the maximum depth of rain storage, the water was drained to the upper limit of rain storage in time, and the irrigation and drainage time and amount of water will be recorded each time. For the lysimeter, when the underground water level exceeded the field underground water level in the test area, drainage was carried out. Drainage was collected in the drainage tank and calculated by an automatic tipping meter. Water samples were collected each time water was drained and stored in the refrigerator. The detailed water table depth control and the duration of flooding in different stages for the irrigation treatments are presented in Table 1. The highest values of irrigation water were recorded in FSI because a standing layer of water was maintained in FSI and WSI throughout the growing period. The upper limit for CI and RCCI irrigation treatments was 100% of water holding capacity.
2.3.3. Water Demand and Water Consumption
For pot experiments, the water balance method was used to calculate the water demand of crops using Equation (1);
where ET is the water requirement of rice in the growth period, mm; P is the rainfall in the growth period, mm; I is the irrigation water volume in the growth period, mm; D1 and D2 are the surface drainage and percolation during the growth period, mm; and H1 and H2 are the soil water yield at the beginning and end of the test, mm. Water Consumption of Rice = ET + D2.
ET = P + I + H1 − H2 − D1 − D2
Groundwater was drained once every three days during the growth period, and total drained water was calculated at the end of the growth period. All drainage water was sampled for nitrogen and phosphorus.
2.3.4. Nitrogen and Phosphorus Concentration Test
Total nitrogen in water samples was determined by alkaline potassium persulfate digestion ultraviolet spectrophotometry (GB 11894-89), and total phosphorus was determined by ammonium molybdate spectrophotometry (GB 11893-89) [15]. The samples were tested and analyzed within 2 h after collection. Whenever a timely analysis was not possible, samples were put into a freezer and stored at 4 °C for 24 h.
2.3.5. Grain Yield and Water Use Efficiency
The grain yield is the total dry weight of the rice grains. Water use efficiency (WUE) was calculated with the following relation (2) [16];
2.4. Statistical Analysis
The analysis of variance (One-way ANOVA) was done by the general linear model (univariate) using SPSS 16.0 (SPSS, Chicago, IL, USA). The mean values of the treatment were compared when the significant differences were noticed at p ≤ 0.05.
3. Results
Different water-saving irrigation modes affect the process of crop water consumption and irrigation and drainage by adjusting soil moisture content and field water layer. Water layer change not only affects rainfall splash erosion and field surface water turbulence but also affects nitrogen and phosphorus pollutant concentration in drainage by changing grid drainage time and sediment precipitation time in farmland drainage, thus affecting non-point source pollution load. Based on the experimental results in Nanjing and Lianshui experimental areas, this study analyzed the irrigation and drainage volume, rainwater utilization rate, nitrogen, and phosphorus pollutant load by examining their environmental effects and impact mechanisms on rice production under different irrigation methods.
3.1. Influence of Irrigation Mode on Drainage and Rainwater Utilization Rate
Table 2 shows the effect of different irrigation methods on the drainage and rainwater utilization rate for two experiments. The results observed at the Lianshui experimental site are similar to those of the Nanjing experimental site, but the drainage was relatively higher in 2016 when compared to 2017. The highest increase in drainage was observed under WSI at Nanjing experimental area (12.4% and 52.0% in 2016 and 2017, respectively) when compared with FSI. In the Lianshui experiment, WSI and RCCI decreased drainage (16.1% and 86.6% during 2016), but only RCCI decreased drainage (66.5%) in 2017. WSI and CI increased drainage by 34.5% and 44.4%, respectively, during 2017 when compared with FSI. While studying rainwater utilization rate for the Nanjing experiment, both WSI and CI decreased rainwater utilization rate during both experimental years, but RCCI improved rainwater utilization rate by 7.4% and 3.5% in 2016 and 2017, respectively, when compared with FSI. In the Lianshui experiment, RCCI significantly improved the rainwater utilization rate by 20.4% and 13.6% during 2016 and 2017, respectively, when compared with FSI.
3.2. Pollutant Load of Different Irrigation Methods
Table 3 presents the concentration of nitrogen and phosphorus in underground drainage and surface drainage and the total amount of drainage for the calculation of the pollutant load per hectare area. For Nanjing experimental area, the N pollutant load of underground drainage was higher under WSI (36.7% and 75.6% in 2016 and 2017, respectively) and CI (35.2% and 82.1% in 2016 and 2017, respectively) when compared with FSI, but RCCI decreased N pollutant load by 24.9% and 2.9% in 2016 and 2017, respectively. While studying the N pollutant load by surface drainage, all treatments decreased the N pollutant load when compared with FSI during both years. However, the highest decrease in the N pollutant load by surface drainage was observed under CI (36.7% and 10.3% in 2016 and 2017, respectively) in Nanjing experimental area. Comparing with FSI, the total N pollutant load was highest under WSI (19.7% and 47.8% in 2016 and 2017, respectively) and CI (12.2% and 48.5% in 2016 and 2017, respectively) and lowest under RCCI (19.8% and 2.8% in 2016 and 2017, respectively) when compared with FSI for Nanjing experimental area. While studying the effect of irrigation methods on N pollutant load in the Lianshui experimental area, FSI had the highest values of N pollutant load in both surface and underground drainage during both experimental years. In 2016, underground and surface drainage N pollutant load was 35.9% and 73.6% less, respectively, under RCCI when compared with FSI, whereas the highest decrease in N pollutant load in underground and surface drainage was observed under WSI (36.9%) and RCCI (88.9%) when compared with FSI during 2017 for Lianshui experimental area. The total N pollutant load was also significantly decreased under all the treatments when compared with FSI during both experimental years and the highest decrease was observed under RCCI (66.5% and 87.7% in 2016 and 2017, respectively).
While studying the effect of different irrigation treatments on phosphorous pollutant load in Nanjing experiment area, the highest decrease of phosphorous pollutant load was observed under RCCI (26.3% and 64.0% in 2016 and 2017, respectively) in underground drainage, whereas the highest decrease in the surface drainage phosphorous pollutant load was recorded in CI (42.3% and 33.3% in 2016 and 2017, respectively) when compared with FSI. However, the total phosphorous pollutant load had the greatest decrease under RCCI (23.5% and 59.6% in 2016 and 2017, respectively) when compared with FSI in the Nanjing experimental area. In Lianshui experimental area, all the treatments significantly decreased underground, surface, and total phosphorous pollutant drainage when compared with FSI except underground phosphorous pollutant drainage under CI in 2017 which increased underground P by 7.1%. The highest decrease in phosphorous pollutant load was observed under RCCI in underground drainage (44.1% and 17.9% in 2016 and 2017, respectively), surface drainage (77.4% and 90.5% in 2016 and 2017, respectively), and total drainage (67.8% and 78.9% in 2016 and 2017, respectively).
3.3. Irrigation Amount, Grain Yield and Water Use Efficiency
Table 4 shows the effect of different irrigation methods on irrigation amount, rice yield, and water productivity. Comparing with FSI, all other irrigation methods significantly decreased the amount of irrigation water (10.5–53.1% and 20.6–44.9% in 2016 and 2017, respectively, in Nanjing and 6.8–10.1% and 14.7–20.3% in 2016 and 2017, respectively, in Lianshui). In the Nanjing experiment, comparing with FSI, the highest water savings were observed under RCCI (53.1% and 44.9% in 2016 and 2017, respectively) followed by CI (42.8% and 41.6% in 2016 and 2017, respectively). In the Lianshui experiment, the highest amount of water savings was recorded under WSI (10.1%) and RCCI (20.3%) during 2016 and 2017, respectively.
The FSI and RCCI irrigation methods had no significant difference in grain yield during both experimental years at both experimental locations (p < 0.05). However, both CI and WSI showed a higher variation in grain yield during different growing seasons. The highest yield was recorded under FSI (12,057.3 and 11,060.0 kg/ha in 2016 and 2017, respectively) followed by RCCI (11,508.5 and 11,553.7 kg/ha in 2016 and 2017, respectively) in Nanjing experimental station. Compared with FSI, the highest decrease in yield was observed under WSI in Nanjing experimental station (12.1% and 8.1% in 2016 and 2017, respectively). In Lianshui area, the highest and lowest yield was observed under CI (12,335.0 kg/ha) and WSI (9980.0 kg/ha), respectively, in 2016 experimental season. In 2017, WSI and CI gave the highest (10,730 kg/ha) and lowest (8695.0 kg/ha) yield, respectively. For Lianshui experimental station, the highest increase (14.6%) and decrease (7.3%) was observed under CI and WSI, respectively, when compared with FSI during 2016. In 2017, the highest increase (10.7%) and decrease (10.3%) were observed under WSI and CI when compared with FSI during 2017, respectively.
Comparing with FSI, all other methods significantly increased the water productivity in Nanjing experimental station except WSI, which showed no significant difference. The highest increase in water productivity was recorded in RCCI (103.4% and 89.25% in 2016 and 2017, respectively) followed by CI (62.7% and 61.9% in 2016 and 2017, respectively). While studying the effect of different irrigation methods on the water productivity in Lianshui area, the highest increase in water productivity was observed under CI (23.2% and 9.0% in 2016 and 2017, respectively) when compared with FSI. WSI and RCCI did not affect the water productivity during 2016 but an increase of 30.0% and 21.9% in water productivity was observed during 2017 when compared with FSI in the Lianshui area.
4. Discussion
4.1. Influence of Irrigation Mode on Drainage and Rainwater Utilization Rate
From the drainage data of the Nanjing experimental area, it can be seen that, in the two years, FSI and RCCI have less drainage and higher rainwater utilization rate, while WSI and CI have more drainage. This effect may be attributed to two reasons: (1) controlling the lower water storage limit of irrigation and draining more water; and (2) rainfall distribution. In 2016, the rainfall in Nanjing experimental area was relatively high, but the distribution was relatively uniform and the rainwater utilization rate was relatively high. However, although the rainfall in 2017 was not high, due to the concentrated rainfall, a large amount of water was drained from the paddy fields and the rainwater utilization rate was not high. This suggests that FSI and especially RCCI have a positive impact on improving rainwater utilization rate and reducing water discharge in the rainy areas along the Yangtze River and southern Jiangsu Province. However, WSI and CI, with more surface drainage, increase the risk of nitrogen and phosphorus pollution and correspondingly increase the drainage pressure.
4.2. Pollutant Load of N and P under Different Irrigation Methods
Farmland pollutants enter the water body mainly through drainage. Farmland drainage includes two parts: surface drainage and underground drainage. For Nanjing experimental area, the underground and surface drainage N pollutant load was WSI > CI > FSI > RCCI and FSI > RCCI > WSI > CI, respectively, and the total N pollutant load was WSI > CI > FSI > RCCI from larger to smaller in 2016. In 2017, the N pollutant load of underground and surface drainage was CI > WSI > FSI > RCCI and FSI > WSI > RCCI > CI, and the total N pollutant load was CI > WSI > FSI > RCCI. Thus, it can be seen that the WSI and CI irrigation methods will produce larger pollutant load in Nanjing experimental area. It is much larger than the other two irrigation modes. Bonaiti and Borin [17] found similar findings and reported that frequent irrigation and discharge treatments caused more losses of N and P, which gradually reduced the mass concentration of N and P in the surface water. Furthermore, a lot of N was lost due to surface drainage, therefore the losses and concentrations of groundwater drainage of N also decreased gradually [18]. It could also be because the phosphorous in fertilizer was fixed and absorbed easily by the upper rootzone soil and the disturbance of soil irrigation and drainage amplified the releasing of P to the surface water from the upper rootzone soil [19]. The retention mechanisms of P comprises of sorption (absorption and adsorption) uptake by plants, and exchange reactions with the soils [20]. Kovacic, et al. [21] found a similar trend and reported that, with the downward movement of N and P into the soil, the nutrients in the irrigation water were absorbed by the soil through the inorganic nitrogen absorption, the fixed deposition of phosphorus, and the absorption by the rice, due to which the losses and concentrations of N and P in surface drainage decreased gradually. This shows that, from the point of view of pollutant load, the water-saving irrigation modes suitable for the Nanjing test area are shallow water regular irrigation and water storage controlled irrigation, and the water storage controlled irrigation mode is the best. The nitrogen and phosphorus loss load of CI, WSI, and RCCI in the Lianshui test area were lower than that of FSI, which is different from that of the Nanjing experimental area. This variation might be due to the difference in soil texture in the two study areas. From the point of view of pollutant load alone, RCCI and WSI in Lianshui experimental area have better emission reduction effects. The reason for controlling the increase of N and P loss in irrigation might be due to controlling shallow water depth after rain.
4.3. Productivity Parameters
4.3.1. Irrigation Water under Different Irrigation Methods
Rice is one of the major consumers of freshwater. The flooded rice fields have an evapotranspiration of 4–7 mm day−1, which is a little higher than that in aerobic fields [22,23]. However, depending on soil texture, water depth, and age of rice cultivation, the percolation losses are on the higher side ranging from several to even hundreds of mm day−1 [22,24]. It has been reported by Belder, et al. [24] that water consumption was 600–900 mm under continuous flooding considering precipitation and irrigated water. In our findings, FSI consumed higher amounts of irrigation water in both Nanjing (374.9 and 496.7 mm ha−1) and Lianshui (639.7 and 415.6 mm ha−1) experimental areas, whereas the lowest irrigation amount was recorded in RCCI for Nanjing experimental area (175.7 and 273.8 mm ha−1). WSI and RCCI had the highest values of irrigation amount in 2016 (575.0 mm ha−1) and 2017 (331.1 mm ha−1) experimental years, respectively, in Lianshui experimental area. It is commonly observed that irrigation with standing water in paddy fields would lead to more loss of irrigation water due to higher percolation and seepage rates [23,25]. In the present study, RCCI and CI saved more irrigated water compared with FSI and WSI, which is in agreement with the above statement. FSI and WSI both increased the irrigated water in Nanjing, whereas only FSI increased irrigation water in the Lianshui area. This might be ascribed that constant flooding improved the plow sole that controlled the infiltration rate [26]. Janssen and Lennartz [27] reported that the average infiltration rates were 28.0, 0.79, and 0.16 cm day−1 for three paddy fields with a cultivation duration of 3, 20, and 100 years, respectively, and demonstrated that the age of the field is strongly dependent on the infiltration rate. The soil drying could lead to cracking and shrinkage, thus risking amplified soil water losses [28,29].
4.3.2. Grain Yield under Different Irrigation Methods
In Asia, more than 75% of rice production takes place in irrigated areas, which consists of 55% of the total rice area of the region [30]. Previous research has revealed that constant flooding is not crucial to attaining the higher grain yield in rice in the field. The saturated irrigation and alternate wetting and drying irrigation can maintain or even increase grain yield if the lowest water potential is controlled reasonably according to various soil properties when compared with flooding irrigation [24,31]. Our findings are consistent with previous studies; a slight grain yield decrease was observed in all treatments when compared with FSI (Table 4). Venuprasad, et al. [32] stated that plant height is a key agronomic characteristic in rice that significantly affects the grain yield and it is also responsible for determining plant architecture. In our results, the yield of CI treatment varied greatly and similar findings were also stated by Shao et al. [33] while studying the effects of controlled irrigation and drainage on grain yield of paddy rice. The absence of a layer of flooding water will expose the stems of the rice plant to temperature extremes and will negatively affect the plant growth [34], which will ultimately affect the grain yield.
4.3.3. Water Use Efficiency under Different Irrigation Methods
Water use efficiency (WUE) is a crucial indicator for managing agricultural water. While analyzing multi-site data, Bouman and Tuong [28] concluded that WUE was 0.2–0.4 kg m−3 and 0.3–1.1 kg m−3 in India and Philippines, respectively, for constant flooding rice when both rain and irrigation water were considered. In our study, the highest WUE values were observed under RCCI (6.6 and 4.2 kg m−3) in Nanjing experimental area and CI (2.1 kg m−3) and RCCI (2.84 kg m−3) during 2016 and 2017, respectively, in Lianshui experimental area. The higher WUE values with a significant reduction in grain yield convey less importance particularly when food security is not assured. Some earlier researchers have also confirmed that, with saving irrigation water, saturated soil culture also maintains or even increases grain yield [28,35]. In our findings, the grain yield under all the treatments had a slight difference but RCCI and CI consumed less irrigation water due to which they had higher WUE values.
5. Conclusions
The results reveal that FSI treatment used the largest amount of irrigation water, which was significantly higher than the other three irrigation modes but the southern part of Jiangsu province especially Nanjing and riverside areas are relatively rich in water resources. Therefore, FSI and RCCI are the best irrigation methods in Nanjing area to get a higher yield because the yield of controlled irrigation treatment varies greatly and the annual and seasonal yield changes of CI treatment are higher than those of the other treatments, and the risk of yield reduction is greater. Therefore, considering water saving and high efficiency, RCCI is a better irrigation strategy than FSI. Combining the analysis, it can be seen that RCCI irrigation treatment has less N and P pollutant load with no significant difference in yield in the Lianshui and in 2017 in Nanjing area. Therefore, RCCI is more suitable for irrigation in Lianshui and similar areas.
Author Contributions
Conceptualization, X.G.; methodology, S.Z. and K.C.; software, G.R.; validation, S.Z. and G.R.; formal analysis, G.R.; data curation, S.Z. and K.C.; writing—original draft preparation, S.Z. and G.R.; writing—review and editing, G.R., X.G., and L.S.; supervision, X.G.; project administration, X.G.; and funding acquisition, X.G. All authors have read and agreed to the published version of the manuscript.
Funding
This research was supported by Jiangsu Water Science and Technology Program (Grant No. 2018046 and 2019045).
Conflicts of Interest
The authors declare no conflict of interest.
References
- Nie, L.; Peng, S. Rice production in China. In Rice Production Worldwide; Springer: Berlin, Germany, 2017; pp. 33–52. [Google Scholar]
- Guo, J.; Hu, X.; Gao, L.; Xie, K.; Ling, N.; Shen, Q.; Hu, S.; Guo, S. The rice production practices of high yield and high nitrogen use efficiency in Jiangsu, China. Sci. Rep. 2017, 7, 1–10. [Google Scholar] [CrossRef] [PubMed]
- Shivakoti, G.; Vermilion, D.; Lam, W.-F.; Ostrom, E.; Pradhan, U.; Yoder, R. Asian Irrigation in Transition: Responding to Challenges; SAGE Publications: New Delhi, India, 2005; p. 528. [Google Scholar]
- Wu, Y.; Wang, E.; Miao, C. Fertilizer Use in China: The Role of Agricultural Support Policies. Sustainability 2019, 11, 4391. [Google Scholar] [CrossRef] [Green Version]
- Xie, Y.; Wang, Z.; Guo, X.; Lakthan, S.; Chen, S.; Xiao, Z.; Alhaj Hamoud, Y. Effects of Different Irrigation Treatments on Aquaculture Purification and Soil Desalination of Paddy Fields. Water 2019, 11, 1424. [Google Scholar] [CrossRef] [Green Version]
- Zhuang, Y.; Zhang, L.; Li, S.; Liu, H.; Zhai, L.; Zhou, F.; Ye, Y.; Ruan, S.; Wen, W. Effects and potential of water-saving irrigation for rice production in China. Agric. Water Manag. 2019, 217, 374–382. [Google Scholar] [CrossRef]
- Towa, J.J.; Xiangping, G. Effects of irrigation and weed-control methods on growth of weed and rice. Int. J. Agric. Biol. Eng. 2014, 7, 22–33. [Google Scholar]
- Peng, S.; Hou, H.; Xu, J.; Mao, Z.; Abudu, S.; Luo, Y. Nitrous oxide emissions from paddy fields under different water managements in southeast China. Paddy Water Environ. 2011, 9, 403–411. [Google Scholar] [CrossRef]
- Van der Hoek, W.; Sakthivadivel, R.; Renshaw, M.; Silver, J.; Birley, M.; Konradsen, F. Alternate Wet/Dry Irrigation in Rice Cultivation: A Practical Way to Save Water and Control Malaria and Japanese Encephalitis? Research Report; IWMI: Colombo, Sri Lanka, 2001; p. 47. [Google Scholar]
- Sato, S.; Yamaji, E.; Kuroda, T. Strategies and engineering adaptions to disseminate SRI methods in large-scale irrigation systems in Eastern Indonesia. Paddy Water Environ. 2011, 9, 79–88. [Google Scholar] [CrossRef]
- Nie, T.; Chen, P.; Zhang, Z.; Qi, Z.; Lin, Y.; Xu, D. Effects of different types of water and nitrogen fertilizer management on greenhouse gas emissions, yield, and water consumption of paddy fields in cold region of China. Int. J. Environ. Res. Public Health 2019, 16, 1639. [Google Scholar] [CrossRef] [Green Version]
- Guo, X.P.; Zhang, Z.Y.; Yin, G.X. Effect of controlled drainage on loss of nitrogen and phosphorous from paddy field. J. Shanghai Jiaotong Univ. (Agric. Sci.) 2006, 24, 307–310. [Google Scholar]
- Li, Y.; Barker, R. Increasing water productivity for paddy irrigation in China. Paddy Water Environ. 2004, 2, 187–193. [Google Scholar] [CrossRef]
- Fu, Z.Q.; Huang, H.; Chen, C.; He, B.L. Effect of irrigation depths on methane emission in rice-duck complex ecosystems. J. Hunan Agric. Univ. 2006, 32, 632. [Google Scholar]
- Federation WE, American Public Health Association. Standard Methods for the Examination of Water and Wastewater; American Public Health Association: Washington, DC, USA, 2005; p. 21. [Google Scholar]
- Rasool, G.; Guo, X.; Wang, Z.; Ali, M.U.; Chen, S.; Zhang, S.; Wu, Q.; Ullah, M.S. Coupling fertigation and buried straw layer improves fertilizer use efficiency, fruit yield, and quality of greenhouse tomato. Agric. Water Manag. 2020, 239, 106239. [Google Scholar] [CrossRef]
- Bonaiti, G.; Borin, M. Efficiency of controlled drainage and subirrigation in reducing nitrogen losses from agricultural fields. Agric. Water Manag. 2010, 98, 343–352. [Google Scholar] [CrossRef]
- Tan, X.; Shao, D.; Gu, W.; Liu, H. Field analysis of water and nitrogen fate in lowland paddy fields under different water managements using HYDRUS-1D. Agric. Water Manag. 2015, 150, 67–80. [Google Scholar] [CrossRef]
- Liu, R.; Wang, F.; Zhang, A.; Youhong, L.I.; Chen, C.; Hong, Y.; Yang, Z. Types of Fertilizers and Their Application Affect the Leaching of Nitrogen and Phosphorus in Paddy Fields in Irrigation Districts of Yellow River. J. Irrig. Drain. 2017, 9, 46–49. [Google Scholar]
- Reddy, K.R.; Kadlec, R.H.; Flaig, E.; Gale, P.M. Phosphorus retention in streams and wetlands: A review. Crit. Rev. Environ. Sci. Technol. 1999, 29, 83–146. [Google Scholar] [CrossRef]
- Kovacic, D.A.; David, M.B.; Gentry, L.E.; Starks, K.M.; Cooke, R.A. Effectiveness of constructed wetlands in reducing nitrogen and phosphorus export from agricultural tile drainage. J. Environ. Qual. 2000, 29, 1262–1274. [Google Scholar] [CrossRef] [Green Version]
- Tabbal, D.F.; Bouman, B.A.M.; Bhuiyan, S.I.; Sibayan, E.B.; Sattar, M.A. On-farm strategies for reducing water input in irrigated rice; case studies in the Philippines. Agric. Water Manag. 2002, 56, 93–112. [Google Scholar] [CrossRef]
- Alberto, M.C.R.; Wassmann, R.; Hirano, T.; Miyata, A.; Hatano, R.; Kumar, A.; Padre, A.; Amante, M. Comparisons of energy balance and evapotranspiration between flooded and aerobic rice fields in the Philippines. Agric. Water Manag. 2011, 98, 1417–1430. [Google Scholar] [CrossRef]
- Belder, P.; Bouman, B.A.M.; Cabangon, R.; Guoan, L.; Quilang, E.J.P.; Yuanhua, L.; Spiertz, J.H.J.; Tuong, T.P. Effect of water-saving irrigation on rice yield and water use in typical lowland conditions in Asia. Agric. Water Manag. 2004, 65, 193–210. [Google Scholar] [CrossRef]
- Tan, X.; Shao, D.; Liu, H.; Yang, F.; Xiao, C.; Yang, H. Effects of alternate wetting and drying irrigation on percolation and nitrogen leaching in paddy fields. Paddy Water Environ. 2013, 11, 381–395. [Google Scholar] [CrossRef]
- Chen, S.K.; Liu, C.W.; Huang, H.C. Analysis of water movement in paddy rice fields (II) simulation studies. J. Hydrol. 2002, 268, 259–271. [Google Scholar] [CrossRef]
- Janssen, M.; Lennartz, B. Horizontal and vertical water and solute fluxes in paddy rice fields. Soil Tillage Res. 2007, 94, 133–141. [Google Scholar] [CrossRef]
- Bouman, B.; Tuong, T.P. Field water management to save water and increase its productivity in irrigated lowland rice. Agric. Water Manag. 2001, 49, 11–30. [Google Scholar] [CrossRef]
- Chen, S.K.; Liu, C.W. Analysis of water movement in paddy rice fields (I) experimental studies. J. Hydrol. 2002, 260, 206–215. [Google Scholar] [CrossRef]
- Dawe, D. Water productivity in rice-based systems in Asia–variability in space and time. Plant Prod. Sci. 2005, 8, 219–228. [Google Scholar] [CrossRef] [Green Version]
- Cabangon, R.J.; Tuong, T.P.; Castillo, E.G.; Bao, L.X.; Lu, G.; Wang, G.; Cui, Y.; Bouman, B.A.; Li, Y.; Chen, C. Effect of irrigation method and N-fertilizer management on rice yield, water productivity and nutrient-use efficiencies in typical lowland rice conditions in China. Paddy Water Environ. 2004, 2, 195–206. [Google Scholar] [CrossRef]
- Venuprasad, R.; Dalid, C.; Del Valle, M.; Zhao, D.; Espiritu, M.; Cruz, M.S.; Amante, M.; Kumar, A.; Atlin, G. Identification and characterization of large-effect quantitative trait loci for grain yield under lowland drought stress in rice using bulk-segregant analysis. Theor. Appl. Genet. 2009, 120, 177–190. [Google Scholar] [CrossRef]
- Shao, G.C.; Deng, S.; Liu, N.; Yu, S.E.; Wang, M.H.; She, D.L. Effects of controlled irrigation and drainage on growth, grain yield and water use in paddy rice. Eur. J. Agron. 2014, 53, 1–9. [Google Scholar] [CrossRef]
- Stuerz, S.; Sow, A.; Muller, B.; Manneh, B.; Asch, F. Leaf area development in response to meristem temperature and irrigation system in lowland rice. Field Crop. Res. 2014, 163, 74–80. [Google Scholar] [CrossRef]
- Nguyen, H.T.; Fischer, K.S.; Fukai, S. Physiological responses to various water saving systems in rice. Field Crop. Res. 2009, 112, 189–198. [Google Scholar] [CrossRef]
Figure 1.
Location of experimental sites in the map of Jiangsu province, China.

Figure 2.
(a) Schematic diagram of pot planting experiment; and (b) physical diagram of pot planting experimental device.
Figure 2.
(a) Schematic diagram of pot planting experiment; and (b) physical diagram of pot planting experimental device.

Figure 3.
Arrangement diagram of rice pot planting experiment.


Table 1.
Irrigation and drainage standards under different irrigation modes (Nanjing, Lianshui).
| Treatments | Irrigation Control Index | Returning to Green Period | Tillering Stage | Jointing and Booting Stages | Heading and Flowering Stage | Milk Stage | Yellow Ripening Stage |
|---|---|---|---|---|---|---|---|
| FSI | Upper limit (mm) | 30 | 30 | 50 | 40 | 40 | 0 |
| Lower limit (mm) | 10 | 10~60% * | 10 | 10 | 10 | 60~70% * | |
| Rain upper limit (mm) | 40 | 100 | 100 | 100 | 80 | 0 | |
| WSI | Upper limit (mm) | 30 | 20 | 20 | 30 | 30 | 0 |
| Lower limit (mm) | 20 mm * | 70~90 | 90 | 100 | 80 | 70~80% | |
| Rain upper limit (mm) | 40 | 60 | 100 | 100 | 80 | 0 | |
| CI | Upper limit (%) | 30 mm * | 100 | 100 | 100 | 100 | 80 |
| Lower limit (%) | 10 mm * | 60~70 | 70~80 | 80 | 70 | Dry naturally | |
| Rain upper limit (mm) | 40 | 60 | 80 | 80 | 80 | 0 | |
| RCCI | Upper limit (%) | 30 mm * | 100 | 100 | 100 | 100 | 80 |
| Lower limit (%) | 10 mm * | 60~70 | 70~80 | 80 | 70 | Dry naturally | |
| Rain upper limit (mm) | 80 | 150 | 200 | 200 | 200 | 0 |
Note: FSI, Shallow water frequent irrigation; WSI, Shallow wet irrigation; CI, Control irrigation; RCCI, Rain catching-controlled irrigation. “mm” indicates the depth of water on the surface of the field; “%” indicates the percentage of the water content of the 30 cm surface soil to the saturated water content of the soil; “*” indicates that the data of this row are expressed differently from other data in the same column. The irrigation control index was higher before and lower after the tillering stage, while it was lower before and higher after the jointing and booting stage.
Table 2.
Effect of different irrigation methods on drainage and rainwater utilization rate.
| Location | Treatments | Rainfall (mm) | Drainage (mm) | Rainwater Utilization Rate (%) | ||||||
|---|---|---|---|---|---|---|---|---|---|---|
| 2016 | 2017 | Avg. | 2016 | 2017 | Avg. | 2016 | 2017 | Avg. | ||
| Nanjing | FSI | 1014.5 | 1004.9 | 1009.7 | 506.1 b | 189.2 b | 347.65 b | 50.1 a | 81.2 a | 65.65 a |
| WSI | 1014.5 | 1004.9 | 1009.7 | 568.7 a | 287.5 a | 428.1 a | 43.9 b | 71.4 b | 57.65 b | |
| CI | 1014.5 | 1004.9 | 1009.7 | 554.0 a | 283.0 a | 418.5 a | 45.4 b | 71.8 b | 58.6 b | |
| RCCI | 1014.5 | 1004.9 | 1009.7 | 468.6 c | 160.9 c | 314.75 c | 53.8 a | 84.0 a | 68.9 a | |
| Lianshui | FSI | 605.0 | 795.4 | 700.2 | 115.6 a | 135.5 c | 125.55 c | 80.9 c | 83.0 b | 81.95 b |
| WSI | 605.0 | 795.4 | 700.2 | 96.4 b | 182.3 b | 139.35 b | 84.1 b | 77.1 c | 80.6 b | |
| CI | 605.0 | 795.4 | 700.2 | 116.8 a | 195.6 a | 156.2 a | 80.7 c | 75.4 c | 78.05 b | |
| RCCI | 605.0 | 795.4 | 700.2 | 15.5 c | 45.4 d | 30.45 d | 97.4 a | 94.3 a | 95.85 a | |
Numbers with the same letters in the same column have no significant difference at p ≥ 0.05.
Table 3.
Effect of different irrigation methods on pollutant load.
| Location | Nanjing | Lianshui | |||||||||||
|---|---|---|---|---|---|---|---|---|---|---|---|---|---|
| Pollutant load | Treatments | N (kg/ha) | P (kg/ha) | N (kg/ha) | P (kg/ha) | ||||||||
| 2016 | 2017 | Avg. | 2016 | 2017 | Avg. | 2016 | 2017 | Avg. | 2016 | 2017 | Avg. | ||
| Under-ground | FSI | 13.3 b | 9.70 b | 11.5 b | 0.76 b | 0.89 a | 0.83 a | 3.76 a | 3.63 a | 3.70 a | 0.34 a | 0.28 a | 0.31 a |
| WSI | 18.2 a | 17.0 a | 17.6 a | 0.97 a | 0.30 c | 0.64 b | 2.82 b | 2.29 b | 2.56 b | 0.31 b | 0.25 b | 0.28 a | |
| CI | 18.0 a | 17.7 a | 17.8 a | 0.93 a | 0.83 b | 0.88 a | 2.69 b | 2.38 b | 2.54 b | 0.26 c | 0.30 a | 0.28 a | |
| RCCI | 9.97 c | 9.42 b | 9.7 c | 0.56 c | 0.32 c | 0.44 c | 2.41 b | 2.70 b | 2.56 b | 0.19 d | 0.23 b | 0.21 b | |
| Surface | FSI | 6.22 a | 5.56 a | 5.89 a | 0.26 a | 0.06 a | 0.16 a | 16.3 a | 18.9 a | 17.6 a | 0.84 a | 1.47 a | 1.16 a |
| WSI | 5.21 b | 5.52 a | 5.37 a | 0.20 b | 0.06 a | 0.13 b | 9.94 c | 11.5 c | 10.7 c | 0.41 c | 0.30 c | 0.36 c | |
| CI | 3.94 c | 4.99 a | 4.47 b | 0.15 c | 0.04 b | 0.10 c | 12.5 b | 13.7 b | 13.1 b | 0.53 b | 0.63 b | 0.58 b | |
| RCCI | 5.66 b | 5.41 a | 5.54 a | 0.22 a | 0.06 a | 0.14 b | 4.31 d | 2.09 d | 3.20 c | 0.19 d | 0.14 d | 0.17 d | |
| Total | FSI | 19.5 c | 15.3 b | 17.5 b | 1.02 b | 0.94 a | 0.98 a | 20.06 a | 22.5 a | 21.3 a | 1.18 a | 1.75 a | 1.47 a |
| WSI | 23.4 a | 22.6 a | 23.0 a | 1.17 a | 0.36 c | 0.77 b | 12.76 c | 13.7 c | 13.2 c | 0.72 c | 0.55 c | 0.64 c | |
| CI | 21.9 b | 22.7 a | 22.3 a | 1.07 b | 0.87 b | 0.97 a | 15.19 b | 16.1 b | 15.7 b | 0.79 b | 0.93 b | 0.86 b | |
| RCCI | 15.6 d | 14.8 b | 15.2 c | 0.78 c | 0.38 c | 0.58 c | 6.72 d | 4.79 d | 5.76 d | 0.38 d | 0.37 d | 0.38 d | |
N, nitrogen; P, phosphorous. Numbers with the same letters in the same column have no significant difference at p ≥ 0.05.
Table 4.
Output, irrigation water consumption, and irrigation water productivity under different irrigation methods.
Table 4.
Output, irrigation water consumption, and irrigation water productivity under different irrigation methods.
| Location | Treatments | Yield (kg/ha) | Irrigation Amount (mm) | Water Productivity (kg/m3) | |||
|---|---|---|---|---|---|---|---|
| 2016 | 2017 | 2016 | 2017 | 2016 | 2017 | ||
| Nanjing | FSI | 12,057.3 a | 11,060.0 a | 374.9 a | 496.7 a | 3.22 c | 2.23 b |
| WSI | 10,604.9 c | 10,163.9 b | 335.6 a | 394.4 b | 3.16 c | 2.58 b | |
| CI | 11,233.8 bc | 10,474.5 a | 214.5 b | 290.2 c | 5.24 b | 3.61 a | |
| RCCI | 11,508.5 b | 11,553.7 a | 175.7 c | 273.8 c | 6.55 a | 4.22 a | |
| Lianshui | FSI | 10,760.0 b | 9694.0 ab | 639.7 a | 415.6 a | 1.68 b | 2.33 b |
| WSI | 9980.0 b | 10,730.0 a | 575.0 b | 354.7 b | 1.74 b | 3.03 a | |
| CI | 12,335.0 a | 8695.0 b | 596.3 b | 341.6 b | 2.07 a | 2.54 b | |
| RCCI | 10,345.0 b | 9398.0 b | 594.0 b | 331.1 b | 1.74 b | 2.84 a | |
Numbers with the same letters in the same column have no significant difference at p ≥ 0.05.
© 2020 by the authors. Licensee MDPI, Basel, Switzerland. This article is an open access article distributed under the terms and conditions of the Creative Commons Attribution (CC BY) license (http://creativecommons.org/licenses/by/4.0/).
Share and Cite
MDPI and ACS Style
Zhang, S.; Rasool, G.; Guo, X.; Sen, L.; Cao, K. Effects of Different Irrigation Methods on Environmental Factors, Rice Production, and Water Use Efficiency. Water 2020, 12, 2239. https://0-doi-org.brum.beds.ac.uk/10.3390/w12082239
AMA Style
Zhang S, Rasool G, Guo X, Sen L, Cao K. Effects of Different Irrigation Methods on Environmental Factors, Rice Production, and Water Use Efficiency. Water. 2020; 12(8):2239. https://0-doi-org.brum.beds.ac.uk/10.3390/w12082239
Chicago/Turabian StyleZhang, Shuxuan, Ghulam Rasool, Xiangping Guo, Liang Sen, and Kewen Cao. 2020. "Effects of Different Irrigation Methods on Environmental Factors, Rice Production, and Water Use Efficiency" Water 12, no. 8: 2239. https://0-doi-org.brum.beds.ac.uk/10.3390/w12082239
Note that from the first issue of 2016, this journal uses article numbers instead of page numbers. See further details here.