Digestate Liquid Fraction Treatment with Filters Filled with Recovery Materials


1
Department of Agronomy, Food, Natural Resources, Animals and Environment (DAFNAE), University of Padova, Viale dell’Università, 16, 35020 Legnaro, Italy
2
Consorzio di Ricerca per lo Sviluppo di Sistemi Innovativi, via Libertà, 203, 90133 Palermo, Italy
*
Author to whom correspondence should be addressed.
Water 2021, 13(1), 21; https://0-doi-org.brum.beds.ac.uk/10.3390/w13010021
Submission received: 2 October 2020
/
Revised: 1 November 2020
/
Accepted: 18 December 2020
/
Published: 24 December 2020
(This article belongs to the Special Issue Application of Constructed Wetland Systems for Agricultural Wastewater Treatment in the Mediterranean Region)
Abstract
:Constructed wetlands (CWs) represent a green technology for digestate liquid fraction (DLF) treatment. However, previous research has warned about their performance when treating wastewater with high suspended solid and organic loads. In addition, the high NH4-N concentration typical of this wastewater can compromise vegetation establishment and activity. In view of this, a digestate pretreatment is needed. This study aimed to test the performance of filters filled with recovery materials, such as brick and refractory material, for DLF pretreatment. The effect on DLF physical (electrical conductivity, pH, dissolved oxygen, and temperature) and chemical (total nitrogen, ammonia–nitrogen, nitrate–nitrogen, total phosphorus, soluble phosphorus, and chemical oxygen demand) characteristics was monitored during eight weekly cycles. The effect of filtration on total nitrogen and ammonia–nitrogen removal began after about one month of loading, suggesting that an activation period is necessary for bacteria. For effective N removal, the presence of multiple digestate recirculations per day through the filters appears mandatory to guarantee the alternation of nitrification and denitrification conditions. For P removal, filling material particle size appeared to be more important than its composition. Unclear performances were observed considering chemical oxygen demand. Further studies on filling media and microbial community interactions, and the long-term efficiency of filters, are desirable.
1. Introduction
Electricity production from biogas plants in the European Union (EU) has grown rapidly during the past 25 years, accounting for half of the global biogas production (ca. 650 PJ) in 2015 [1]. The biomass of digestate, the by-product of anaerobic digestion, is quantitatively similar to the inlet raw materials. Indeed, during anaerobic digestion, a fraction of organic carbon is transformed into methane (CH4) and carbon dioxide (CO2), whereas for most of the other elements, particularly nitrogen (N) and phosphorus (P), there is no material loss but rather a form change [2,3]. The N recovery in the digestate is close to 100%, whereas P, calcium (Ca), magnesium (Mg), and manganese (Mn) are partially crystallized in substituted phosphate form, which can be used as P fertilizer [4]. Generally, digestates are characterized by a higher ammonium (NH4+)-to-total-N (TN) ratio; stable organic matter (OM) and pH; and lower easily degradable OM, total and organic carbon (C) content, biological oxygen (O2) demand (BOD5), C-to-N ratio, and viscosity compared with undigested raw materials [5]. Nonetheless, digestate composition is a function of incoming biomass [6,7]. For example, the NH4+-N content is directly related to feedstock total N content. Indeed, feedstock-derived digestates are characterized by a high NH4+-N-to-TN ratio and a low C-to-N ratio [8,9] due to the high degradability of the raw materials (e.g., cereal grains). In contrast, cattle manures or fibrous feedstocks with low N content (e.g., silage maize) lead to a low NH4+-N-to-TN ratio digestate [10].
Digestate is commonly recycled as fertilizer [11], but if its total N content is expected to be higher than the EU Nitrates Directive limits per spreading unit surface, it has to be treated for N reduction [12,13] before agriculture use. Different types of digestate treatment are reported in the literature, from liquid/solid separation to membrane filtration [14,15]. However, these are expensive to realize and maintain. Separation creates two outputs—a solid and a liquid fraction—that need to be stored and handled separately [16]. The former represents about 15% of the raw digestate and is concentrated in organic matter, as organic N and P, and is a valuable and easily manageable soil amendment [17]. The liquid fraction, which represents about 85% of the raw digestate, is rich in nitrogen (about 0.5% of fresh weight), mainly as ammonium (about 70%) [18]. Considering the European Nitrates Directive limits (from 170 to 340 kg N ha−1 in relation to vulnerability of spreading area) and taking into account the liquid fraction characteristics, its management is more difficult than that of the solid fraction and requires a large land area for spreading. In addition, its management implies the costs of transportation and distribution. For these reasons, the reduction in the N content in this fraction is of crucial importance to reduce the required land area and related costs of distribution.
Constructed wetlands (CWs) represent a green technology for digestate treatment [19,20]. They are engineered systems that exploit natural processes to remove organic compounds and nutrients from wastewater [21,22,23,24] and provide effective, low-cost, low-maintenance, and environmentally beneficial alternatives to traditional systems [25,26]. Despite the numerous reported benefits, previous research has warned about the long-term function of CWs as a form of treatment for wastewater characterized by high organic and suspended solid loads [27,28,29] as digestate [19,30] due to substrate clogging. Additionally, the high NH4+-N and salinity content may compromise the plant survival in CWs [26]. In several papers, the digestate liquid fraction (DLF) was diluted (from 1:2 to 1:20 DLF:water) before CW treatment, and in some cases it was additionally subjected to a residence time in a sediment tank [13,19,20,31] with the aim to reduce the suspended solids and NH4+-N concentration. However, dilution may not be considered a suitable solution in practical conditions because it implies higher volumes to store and manage. For this reason, a digestate pretreatment able to reduce the pollutant load before CW treatment is needed. Different pretreatment technologies are available, such as ultrafiltration, reverse osmosis, and stripping, that also allow nutrient recovery, but these are relatively complex and expensive [32] from both economic and environmental perspectives. Therefore, interest in exploring more environmentally friendly pretreatment solutions remains. A possible low-cost pretreatment system, already used for other effluents, is aerobic filtration [33,34]. Although sand-filled filters are the most commonly used approach [35,36,37,38,39], several investigations of on-farm and/or low-cost filtering media have been undertaken, such as wood chips, wheat straw [40], oyster shells [41], semisoft plastic media [34], rockwool [42], and materials from the recirculation of subproducts of different industrial processes (e.g., laterite [43], zeolite, and zeolitite [44,45]). In this context, the individuation of low-cost and easily available filling materials is a target that can combine the needs of developing filters for DLF pretreatment and fostering the circular economy of farms [46,47]. However, to our knowledge, no studies have been conducted on the use of recovery materials for filtration before DLF CW treatment.
Therefore, the aim of this study was to test the effects of recovery materials used as filtering media, such as fragmented bricks and refractories, on the main DLF chemical–physical characteristics and to evaluate whether the resulting wastewater presents adequate characteristics to be treated with CWs.
2. Materials and Methods
2.1. Filter Structure and Composition
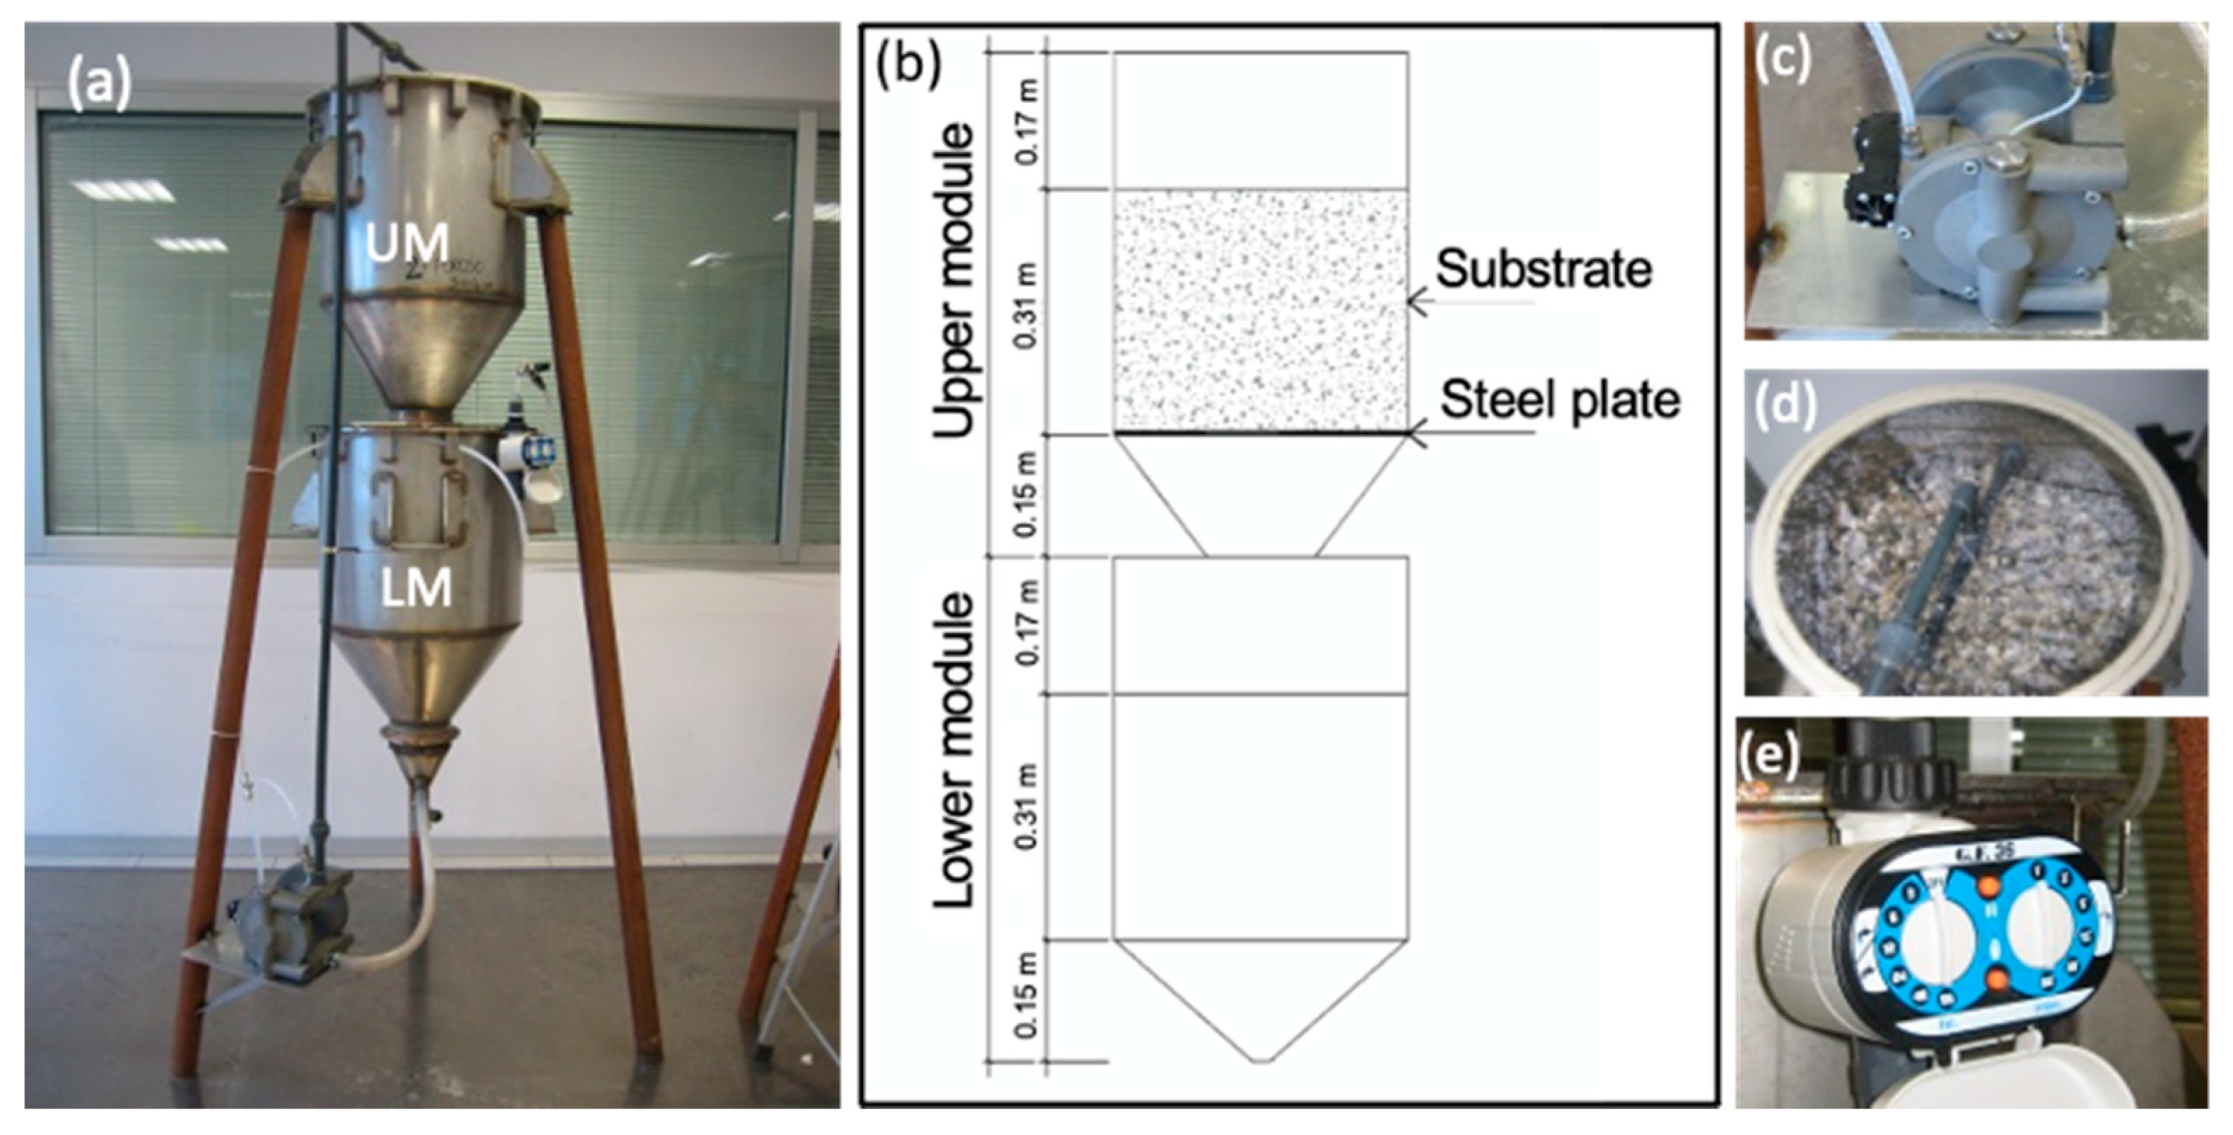
The experiment took place indoors from March to May 2013 and involved four aluminum filters composed of two modules each (0.48 m height, 0.48 m diameter, 0.08 m3 volume) (Figure 1). The upper module was a real filter containing the filling medium held by a steel plate mesh and covered with a plastic cap to prevent evaporation. The lower module was a tank in which the DLF was stored after filtration. Upper and lower modules were connected through a vacuum pump, which was controlled by a timer set to a 3 h timespan, allowing eight filtration cycles per day.
The filters were filled with three different materials, namely, brick (BRICK), porous refractory material (REFR), and gravel (GRAVEL) (Table 1). BRICK was derived from a demolition recovery industry and composed mainly of brick tiles, roof tiles, and pottery, with an average size in the 50–70 mm range. REFR was derived from blast furnace demolition and mainly composed of aluminum silicon oxide (51%), magnesium aluminum silicate (19%), and aluminum oxide (14%), with smaller percentages of andalusite (8%), alpha-quartz (3%), cristobalite (4%), and zirconium silicate (1%). REFR presented two different dimensions: 20–30 mm (REFR 20–30) and 30–50 mm (REFR 30–50). GRAVEL was a building material of fluvial origin composed of 52% dolomite, 17% potassium aluminum silicate hydroxide, 13% calcium carbonate, 8% albite calcian, and 5% each of magnesium iron aluminum silicate hydrate and silicon oxide. Filters contained 40–89 kg of filling material to cover the upper module internal volume and presented a porosity between 41% (GRAVEL) and 55% (REFR 30–50).
2.2. Filter Loading
Each week, the DLF filtered in the previous week was discharged from the lower module and a new quantity of fresh DLF was loaded in the upper module. The filter loading took place manually by removing the plastic cap and gently pouring 20 L of DLF into the upper module. The DLF residence time was in the 15–22 min range, but the quantity of DLF percolation was not regular during this period. Irrespective of the filling material, about 90% of DLF came out in the first 2 min. The DLF was collected at the Bondeno (FE, Italy) biogas plant and fed with a mixture of pig slurry (8%) and energy crops (e.g., silage maize) (92%).
2.3. Chemical–Physical Analysis
Monitoring took place each week for a total of eight weeks, collecting both inlet and each filter outlet. Electrical conductivity (EC), pH, dissolved oxygen (DO), and temperature (T) were measured directly inside the lower module using a Hach Lange HQD 40d multiparameter (Hach Lange GmbH, Berlin, Germany) with interchangeable probes according to standard methods [48]. Representative samples were collected and analyzed on-site to obtain total nitrogen (TN), ammonia–nitrogen (NH4-N), nitrate–nitrogen (NO3-N), total phosphorus (TP), soluble phosphorus (PO4-P), and chemical oxygen demand (COD) with a Hach-Lange DR-2800 spectrophotometer (Hach Lange GmbH, Berlin, Germany) and adequate cuvette test kits (LCK 014, 338, 340, 348, 350, 514) [49] according to Din [50]. Turbidity was measured with a portable HI83414 turbidimeter (HANNA Instrument, Smithfield, RI, USA) as an indirect measure of suspended solids in the digestate. DLF samples were diluted before measurements to allow parameter values to enter into the measuring ranges. The DLF inlet and outlet volumes were measured with a graduated cylinder to allow the calculation of inlet and outlet mass as inflow or outflow concentration (mg L−1) multiplied by inflow or outflow volume (L). These values were used to represent the daily mass trend of cumulative nitrogen forms.
2.4. Statistical Analysis
The data series parameters did not follow a normal distribution and, thus, were tested using the Kruskal–Wallis nonparametric test using weekly measurements as replicates. Statistical analysis was performed on parameters of both concentration and mass balance for nitrogen and phosphorus forms and COD, comparing the inlet and filter outlets. For EC, pH, DO, T, and turbidity, only inlet and filter outlet values were compared. Correlations between monitored wastewater parameters were evaluated using the Spearman rank correlation. Statistical analysis was performed with Statistica software (Stat Soft. Inc., Tulsa, OK, USA), version 10.
3. Results and Discussion
3.1. Digestate Physical Characteristics
The inlet DLF EC values ranged between 24.8 and 28.4 mS cm−1 with a median value of 27.5 mS cm−1 (Table 2). This is in accordance with the literature, in which digestate from anaerobic digestion of pig slurry (digested alone or codigested with other matrices) is characterized by 20–30 mS cm−1 EC. After filtration, considering the whole experimental period, the EC median value was significantly (Kruskal–Wallis p < 0.05) reduced (−26.5%) by BRICK, REFR 20–30, and GRAVEL (Table 2). It is worth noting that, although reduced by filtration, the EC value did not reach the 4 mS cm−1 considered to be the EC threshold for CW plant survival [51]. As is well known, the reduction in EC is related to lower ion concentration. However, in our experiment, considering the N and P forms, only NH4-N significantly influenced the EC value with a positive effect as demonstrated by the Spearman correlation (R = 0.910, p < 0.001).
The pH of the inlet DLF was steady over time, with values between 7.6 and 7.8, a range slightly lower than that reported in the literature for animal-slurry-derived digestate (around 8) [52,53,54]. Aerobic filtration significantly (Kruskal–Wallis p < 0.05) increased pH in all filtering materials, with the exception of GRAVEL (Table 2), which showed higher variability, ranging from 7.5 to 8.8. The pH increase after filtration was probably due to both (i) the formation of ammonium carbonate ((NH4)2CO3) [55] and the removal of CO2 as a result of the transformation of CO32− and 2H+ to CO2 and H2O [56], and (ii) the reduction of multivalent ions as SO42− [2]. It is worth nothing that nitrification and denitrification work optimally in the 7.5–8.5 and 6.5–7.5 ranges, respectively [57,58]. Thus, it is speculated that filtration allows the formation of optimal conditions for nitrification while also avoiding the possible environmental drawbacks linked with denitrification conditions (e.g., N2O emissions). The pH increase observed in the wastewater after filter pretreatment is not considered to compromise the subsequent CW treatment. In fact, the values are well tolerated by the main macrophytes used in the CWs [59], and the high CO2 partial pressures arising in the rhizosphere due to plants and microbial respiration [60,61] are expected to reduce the pH value [13]. Finally, the pH values of DLF filter outlets were within the range obtained by Comino et al. [19] and Zhou et al. [20].
As expected, the DLF DO content was very low before filtration, with values ranging from 0.13 to 0.25 mg L−1. After filtration, all filtering materials demonstrated a significant (Kruskal–Wallis p < 0.05) DO increase, reaching a median value between 0.20 and 0.30 mg L−1 (Table 2). The low oxygen conditions inside the filter may favor the production of nitrite from ammonia rather than of nitrate [62]. Moreover, decreased nitrification as a result of low DO may represent a major obstacle to achieve high N removal in CWs [63]. It is worth noting that the tested filters were intended to be pretreatment for CWs; thus, a DO increase and, in turn, COD and N removal are expected in the subsequent CW treatment step [64]. The still-low DO content after pretreatment may suggest that DLF would require, as a subsequent treatment step, a vertical subsurface flow CW and/or intensified CWs (e.g., aeration, waterdrop influent, and tidal operation). Indeed, the DO concentration inside the substrate can reach 8 mg L−1 in an aerated CW, therefore creating optimal conditions for the nitrification–denitrification process, which needs a high O2 level, thus determining the COD consumption [65].
The temperature depended on the room temperature and was not affected by filtering materials, ranging from 12.2 to 22.0 °C during the experimental period (Table 2). These temperatures fell within the optimal range for nitrifying bacteria growth, according to Reddy and Patrick [66].
The turbidity of the inlet DLF was higher than 30,000 NTU and ranged between 31,540 (first cycle) and 42,360 NTU (sixth cycle). No significant turbidity reduction was observed with BRICK and REFR 30–50 filling materials, whereas a significant (Kruskal–Wallis p < 0.05) reduction was found with REFR 20–30 and GRAVEL media. Considering the behavior of the filters during the experiment, the turbidity was lowered after filtration until the seventh cycle, which was in the range of 30,000–35,000 NTU. On the contrary, during the last monitoring cycle, the turbidity increased to 45,000 NTU in all filters. This behavior can be explained as the release of suspended solids previously accumulated around filling material particles, suggesting that a cycle of filter washing would be required. Although a few filters significantly reduced turbidity, its value remains high (Table 2). However, this parameter is usually highly abated in subsurface flow CWs (from 70% to 85%) [67], suggesting the use of this kind of CW after filter pretreatment. In addition, a correlation between turbidity and TP presence in wastewater has been reported [68].
3.1.1. Nitrogen
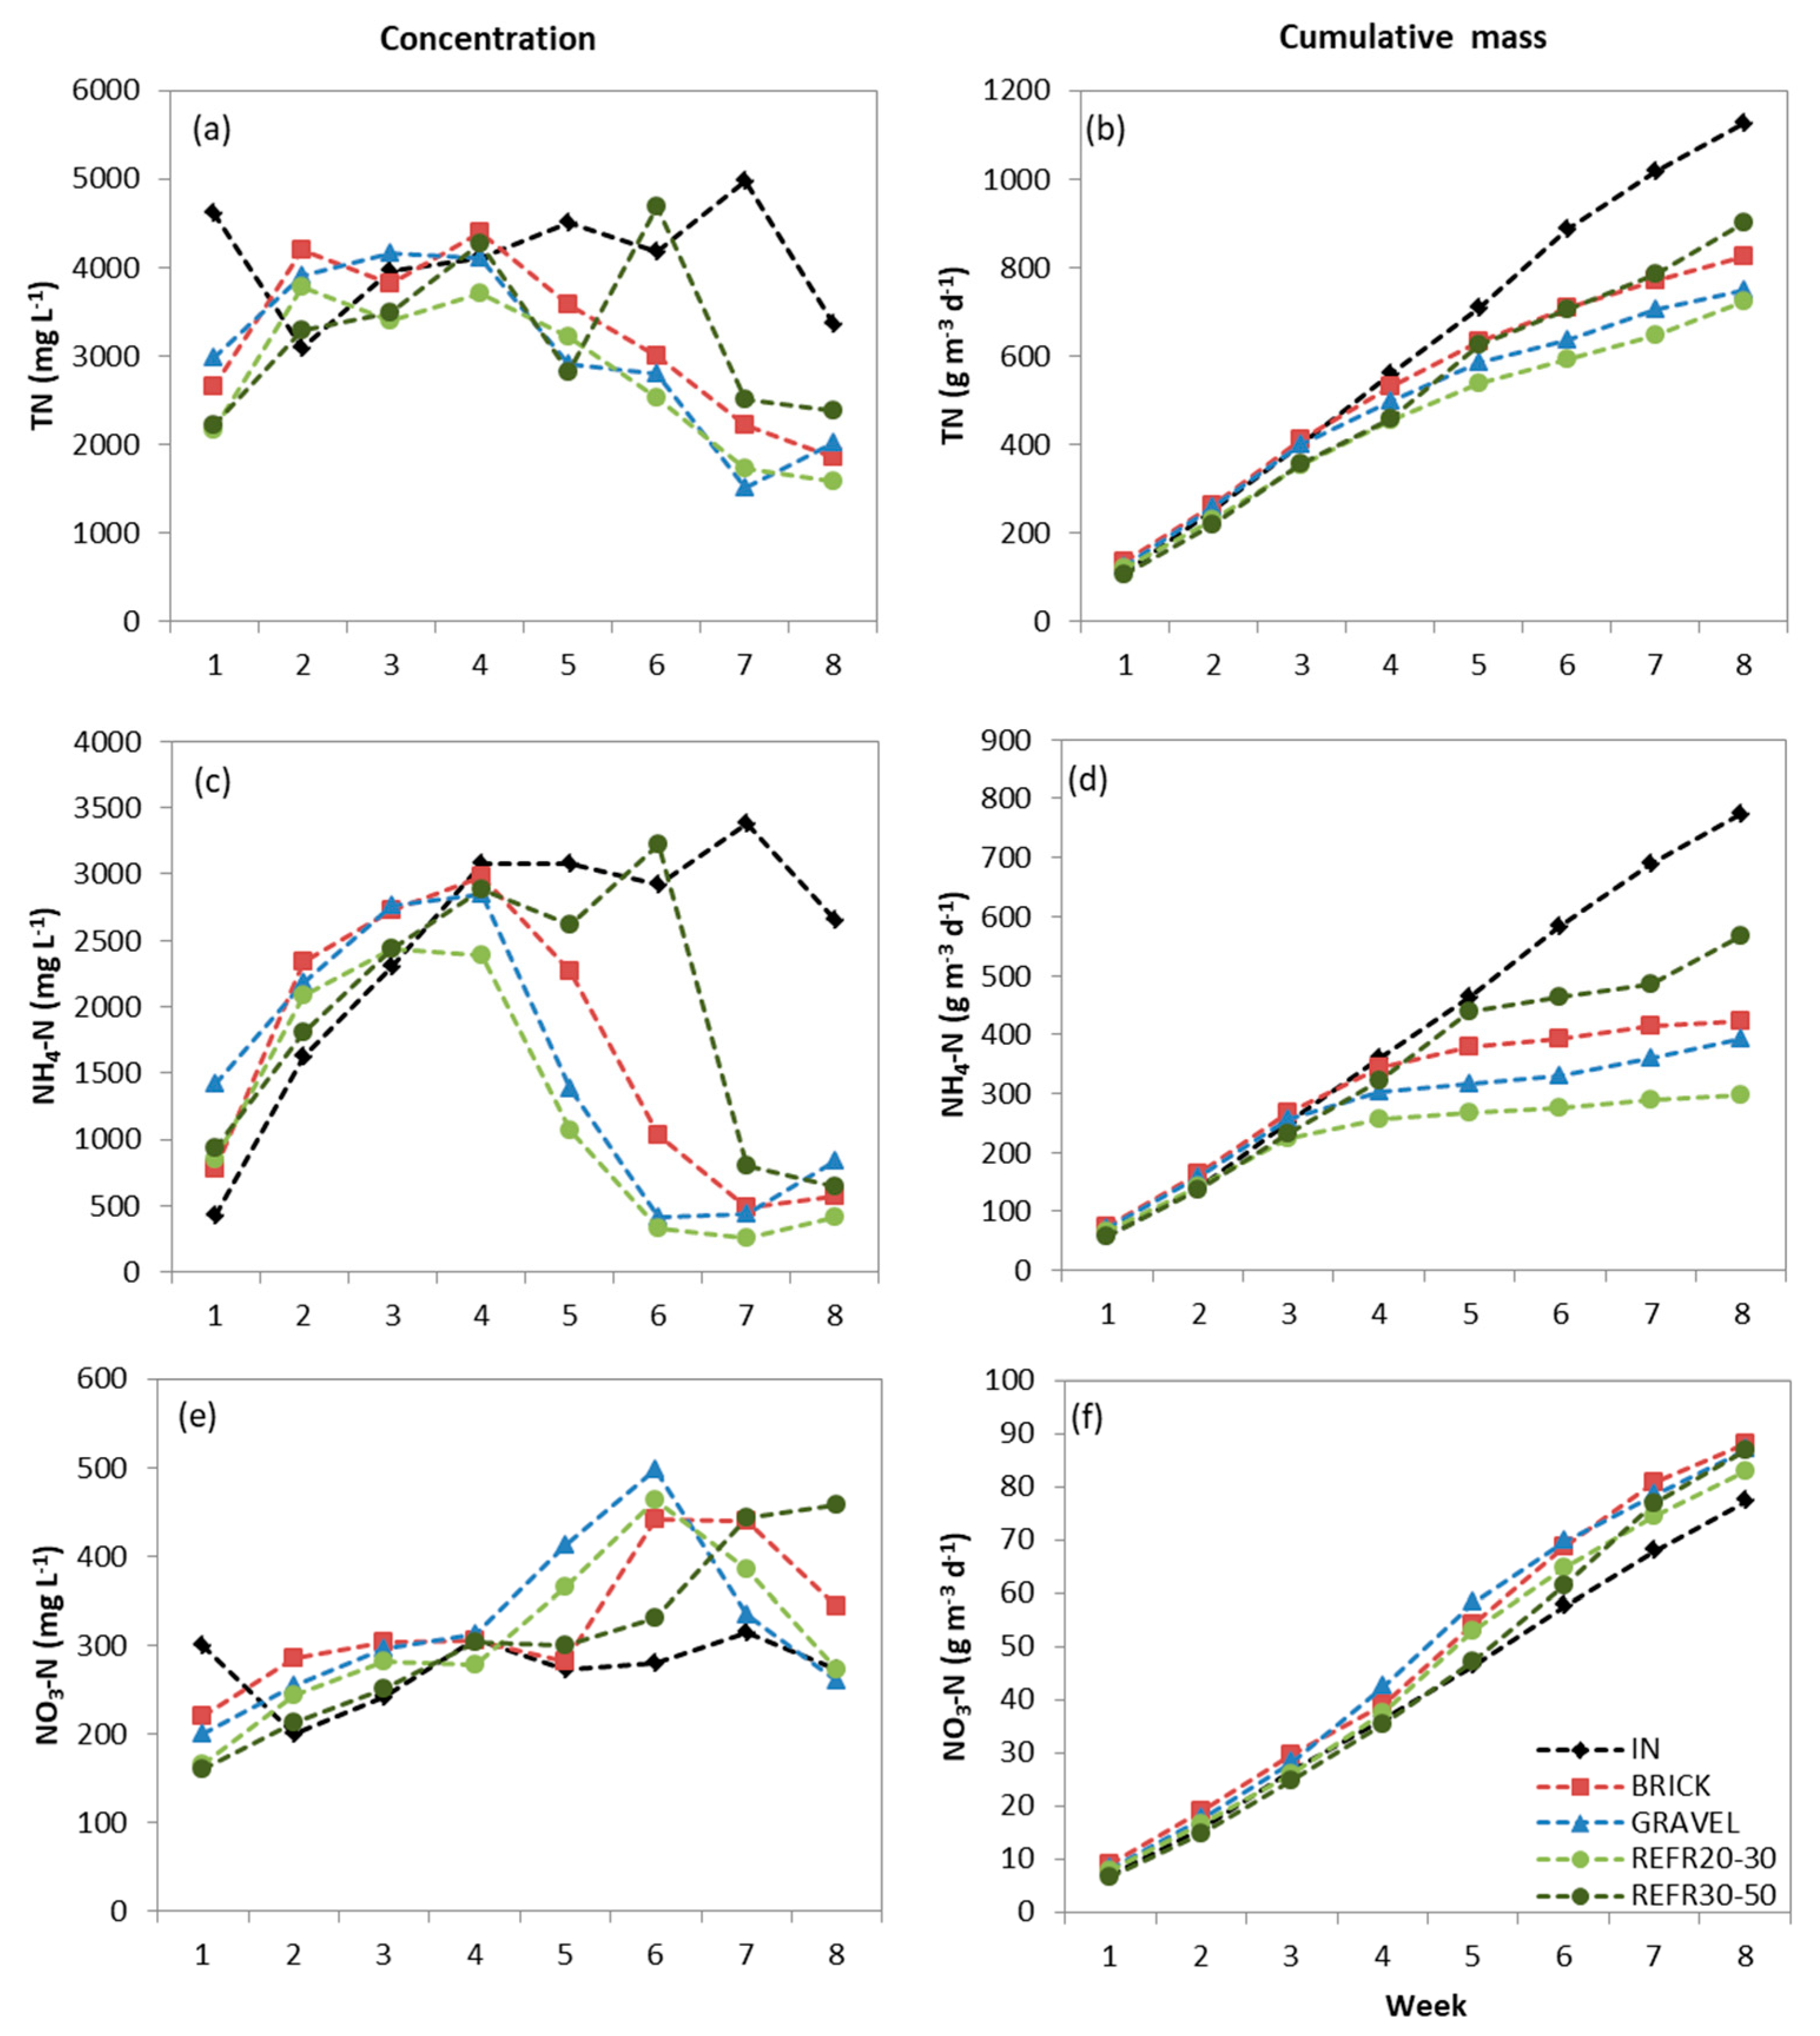
During the experimental period, the DLF TN concentration ranged between 3030 and 4980 mg L−1 in the inlet. Taking into account the supplied DLF quantity, the cumulative filter load ranged from 108 to 178 g m−3 d−1. Considering the median values, the inlet DLF TN content was formed by 72% of NH4-N and 7% of NO3-N, confirming the review of Möller and Müller [2], who observed that 45–80% of TN is present in ammonia form in the DLF. Considering the whole monitoring period, the DLF TN concentration did not show significant changes after filtration (Table 3). Regarding TN dynamics, all filters reduced the TN concentration and mass after the fourth week (Figure 2a,b). A different trend was instead observed for NH4-N, in which the inlet increased from the first (429 mg L−1) to the fourth week (3070 mg L−1) and then showed a steady concentration around 3000 mg L−1.
The NH4-N filter load ranged from 58 to 121 g m−3 d−1 (Figure 2d). Considering the whole experimental period, the NH4-N concentration and absolute DLF content were significantly reduced by filtration only when using REFR 20–30 (−67.0% and −77.0%, respectively) as the filter medium. However, from the fourth experimental week, different cumulative abatement behaviors were observed among filters, ranked as follows: REFR 20–30 > GRAVEL > BRICK > REFR 30–50. In addition, regarding NH4-N concentration dynamics, a general and consistent decreasing trend was visible after the fourth week in all filters (Figure 2), in which concentrations in the DLF outlet around 400–500 mg L−1 were obtained. Ammonia dynamics are pH and temperature dependent [69]. In this study, pH ranged from 8.3 to 8.6 throughout the treatment period. Therefore, ammonia loss through volatilization from filters was negligible because NH4–N is generally insignificant below 7.5 pH and losses are often not serious around 8.0 pH [66]. The values measured at the filter outlets are similar to those obtained in studies in which DLF was diluted before CW treatment (from about 65 to 500 mg L−1) [13,19,31] and do not compromise vegetation establishment and wetland functioning [24]. Thus, for NH4-N, filtration pretreatment can be a valuable alternative to DLF dilution before CW treatment.
In contrast, the NO3-N concentration and its absolute presence in the inlet DLF were more stable over time and ranged between 200 and 314 mg L−1 (median value 276 mg L−1), whereas a specific dynamic was observed at each filter outlet (Figure 2e,f). Considering the whole monitoring period, neither NO3-N concentration nor NO3-N absolute content was significantly different between inlet and filter outlets (Table 3). Although not significant for NO3-N, an opposite trend was observed between NO3-N (i.e., increase) and NH4-N (i.e., decrease) during the fourth to sixth week period, probably due to nitrifying bacteria growth, which implies a start-up period of about 40 days [70]. Subsequently (sixth to eighth week), the NH4-N mass content in the treated DLF was stable (Figure 2d), whereas the TN decreased (Figure 2b) and NO3-N slightly increased (Figure 2f) compared with the inlet. Considering that filters were not vegetated, N removal should have been achieved through microorganisms. In addition, it can be speculated that the NO3-N mass content decrease in the last two monitoring cycles was due to denitrification. Indeed, denitrification occurs when O2 levels are depleted (<0.5 mg L−1) and NO3− becomes the primary oxygen source for microorganisms [63,71]. In this study, the DLF DO content was always below 0.5 mg L−1 and N form dynamics indicate that four weeks is the time period required for biological activation of the proposed filters.
3.1.2. Phosphorus
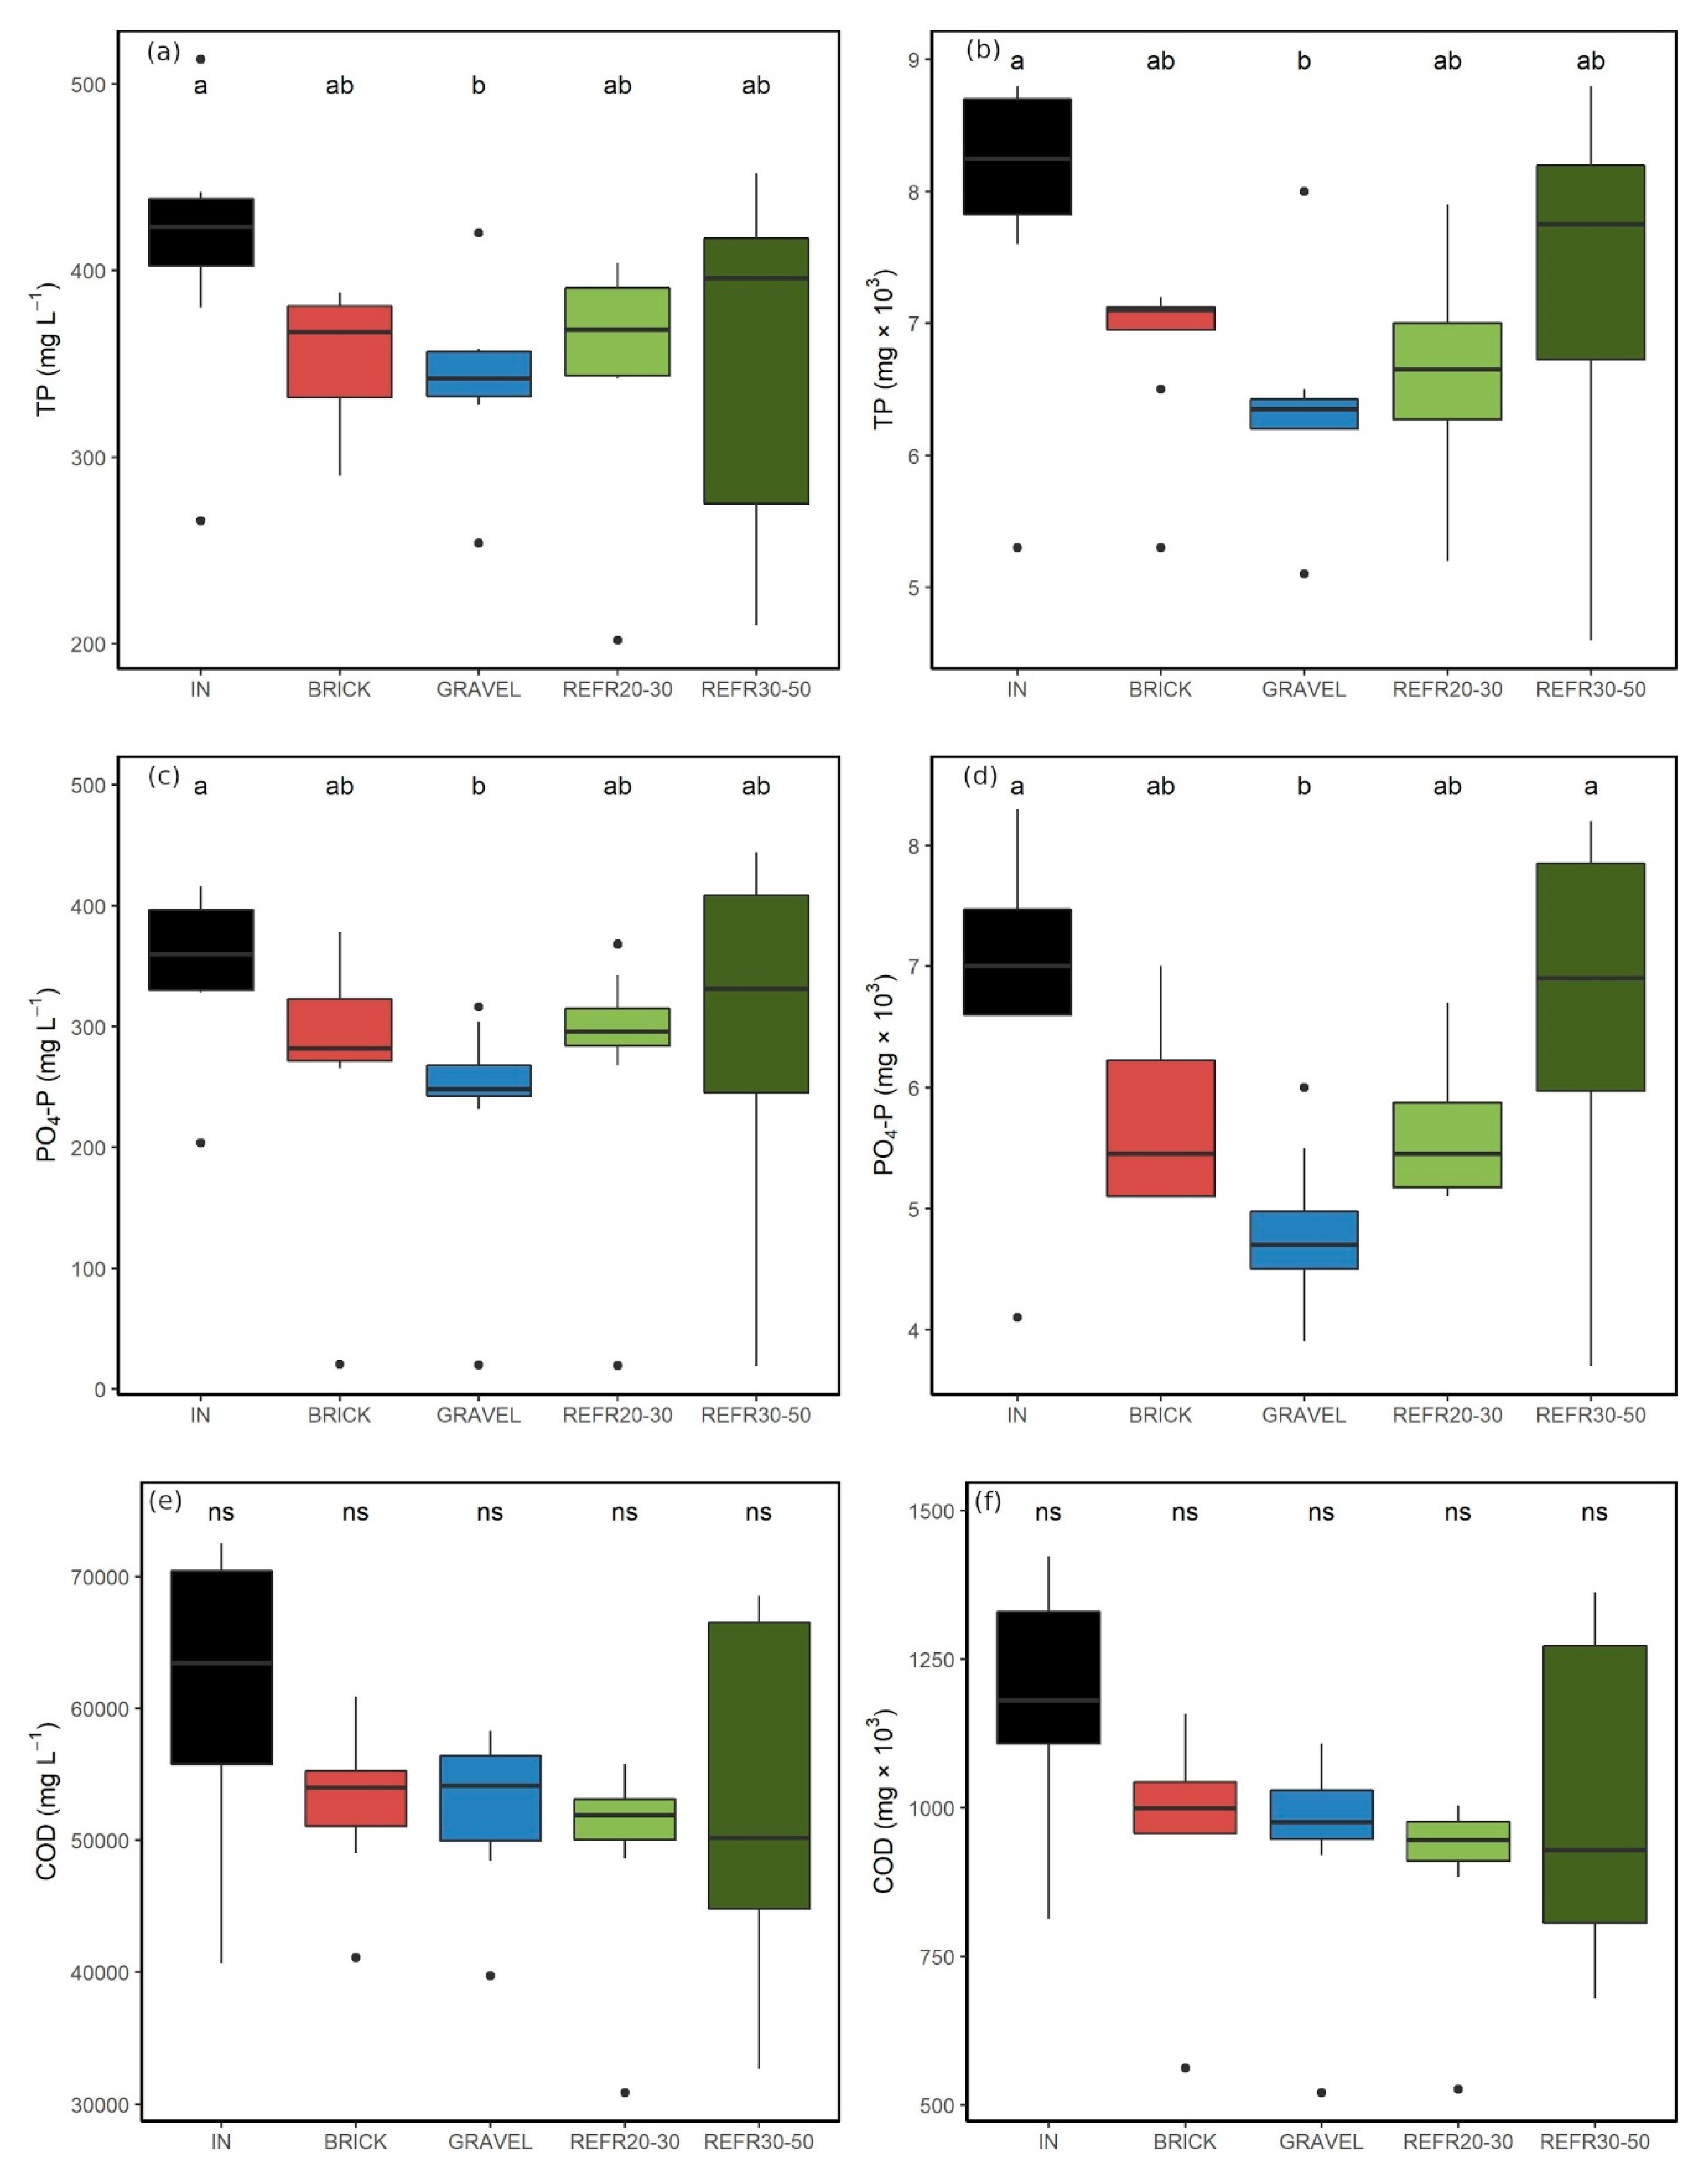
The inlet DLF TP concentration and weekly absolute load median values were 411.5 mg L−1 and 8.2 g filter−1, respectively. Among the studied filtering media, only GRAVEL was able to significantly reduce both TP concentration (−17%) and mass balance (−23%) (Figure 3a,b).
The PO4-P concentration in the inlet DLF represented 85% of the TP. Its concentration and weekly absolute load median values were 351.5 mg L−1 and 7.0 g filter−1, respectively. PO4-P showed the same behavior observed for TP; only GRAVEL significantly reduced its content, by 29% and 34%, for concentration and mass balance, respectively (Figure 3c,d). P removal in natural-like systems is a critical issue that has not yet been sufficiently solved and is closely associated with the properties of the filter material [72]. Indeed, P removal is mainly achieved via precipitation or sorption on filtering media [72], the latter being controlled by the properties of physical–chemical substrates [73]. In addition, a microbial P uptake has also been observed [63]. In CW systems, P removal is also a critical issue because the major removal processes (i.e., adsorption on the substrate surface and precipitation) are saturable and decrease over time [63]. However, in these systems, plant uptake represents one of the key levers to improve P removal efficiency but with a species-specific effect [74]. Taking into account the high P concentration still present after filtration, plants characterized by high P uptake should be chosen to vegetate CWs used to treat DLF filter outlets.
In this experiment, the best performance was achieved using GRAVEL substrate, probably due to the higher specific surface area, which increases as the particle size decreases. Indeed, GRAVEL was the material with the lowest particle size, from 2.5 to 7.5 times lower than that of all other substrates. Consequently, as already reported by Henderson et al. [75], it may be speculated that the microbial population linked to the P cycle may have a much greater surface area to colonize in gravel than in other substrates. Additionally, digestate recirculation through the filter led to a slight increase in O2 availability, which may have fostered microbial P uptake [76].
3.1.3. Chemical Oxygen Demand (COD)
The COD concentration in the inlet DLF during the monitoring period ranged between 40,620 mg L−1 (first cycle) and 71,170 mg L−1 (fourth cycle), with a median value of 59,035 mg L−1. The COD quantity loaded in each filter with DLF was in the 812–1423 g range per monitoring cycle, with a median value of 1181 g. The statistical analysis of COD concentration and mass balance did not show differences among filters, probably due to the high variability of the dataset, particularly in REFR 30–50 (Figure 3e). Indeed, removing the latter from the database, significant (Kruskal–Wallis p < 0.05) COD mass removal was found in REFR 20–30. Trends of the COD mass absolute value (Figure 3f) were very similar to the concentration trends. In this study, the low COD abatement may be due to (1) the preservation of recalcitrant material during anaerobic digestion that, in turn, leads to a high content of biologically stable organic carbon (similar to that of compost) in the DLF [77], and (2) the low O2 available and high COD/TN ratio (about 15.2). The latter represents the relative quantity of carbon sources able to affect the decomposition of organics by microorganisms, as well as the microbial processes of nitrification and denitrification [78,79]. Therefore, the influent COD/N ratios can promote or inhibit the microbial activity affecting the pollutant removal performance [80,81]. Despite the filters’ effect, the COD concentration was still too high in DLF, most likely due to the high quantity of suspended solids. Therefore, the effect of filtration, as managed in this research, is not yet sufficient to prepare wastewater for subsequent wetland treatment. Different options may be suggested: enhanced filtration by more recirculation and/or intensified wetlands, as previously mentioned.
4. Conclusions
The aerobic filters tested in this study showed encouraging results in DLF treatment, suggesting that recovery materials might also be suitable for agricultural wastewater treatment and may provide new insights into the circular economy. Although the monitoring period was limited, some preliminary results were obtained:
- -
- DLF turbidity was lowered only by REFR 20–30 and GRAVEL filtering materials.
- -
- EC was only slightly abated by filters, and thus remains a challenge for the establishment of CW vegetation.
- -
- The effect of filtration on TN and NH4-N removal began after about one month of loading, suggesting that this is the period after which bacterial activation occurs.
- -
- REFR 20–30 was the only filtering material able to significantly remove TN and NH4-N from the DLF to values suitable for CW vegetation.
- -
- For P removal, filling material particle size appeared more important than its composition. Indeed, the best performances were observed with GRAVEL.
The filters demonstrated insufficient performance for COD; therefore, further studies may verify if a smaller (e.g., <1.5 cm) particle size may be more effective. For efficient N removal, the presence of multiple digestate recirculations per day through the filters appears necessary to guarantee the alternation of nitrification and denitrification conditions. Further studies elucidating the interactions between filling media and microbial communities, and the long-term efficiency of filters, are required.
Author Contributions
Conceptualization, M.B.; formal analysis, I.P., G.V., and C.M.; investigation, I.P.; data interpretation, I.P., G.V., C.M., and M.B.; writing—original draft preparation, I.P. and C.M.; writing—review and editing, I.P., C.M., G.V., and M.B.; visualization, I.P. and C.M.; supervision, M.B.; funding acquisition, M.B. All authors have read and agreed to the published version of the manuscript.
Funding
This research was funded by Progetti Fondimpresa “Sviluppo di sistemi innovativi per il trattamento di digestato, reflui zootecnici e rifiuti ceramici”.
Conflicts of Interest
The authors declare no conflict of interest.
References
- Benato, A.; Macor, A. Italian biogas plants: Trend, subsidies, cost, biogas composition and engine emissions. Energies 2019, 12, 979. [Google Scholar] [CrossRef] [Green Version]
- Möller, K.; Müller, T. Effects of anaerobic digestion on digestate nutrient availability and crop growth: A review. Eng. Life Sci. 2012, 12, 242–257. [Google Scholar] [CrossRef]
- Sánchez-Ramírez, J.E.; Pastor, L.; Martí, N.; Claros, J.; Doñate, S.; Bouzas, A. Analysis of uncontrolled phosphorus precipitation in anaerobic digesters under thermophilic and mesophilic conditions. Environ. Technol. 2019, 1–10. [Google Scholar] [CrossRef] [PubMed]
- Marcato, C.E.; Pinelli, E.; Pouech, P.; Winterton, P.; Guiresse, M. Particle size and metal distributions in anaerobically digested pig slurry. Bioresour. Technol. 2008, 99, 2340–2348. [Google Scholar] [CrossRef] [Green Version]
- Tambone, F.; Scaglia, B.; D’Imporzano, G.; Schievano, A.; Orzi, V.; Salati, S.; Adani, F. Assessing amendment and fertilizing properties of digestates from anaerobic digestion through a comparative study with digested sludge and compost. Chemosphere 2010, 81, 577–583. [Google Scholar] [CrossRef]
- Nkoa, R. Agricultural benefits and environmental risks of soil fertilization with anaerobic digestates: A review. Agron. Sustain. Dev. 2014, 34, 473–492. [Google Scholar] [CrossRef] [Green Version]
- Tampio, E.; Salo, T.; Rintala, J. Agronomic characteristics of five different urban waste digestates. J. Environ. Manag. 2016, 169, 293–302. [Google Scholar] [CrossRef]
- Emmerling, C.; Barton, J. Anaerobic co-digestion of topinambour (Helianthus tuberosus L.) and properties of the remaining biogas manure. Arch. Agron. Soil Sci. 2007, 53, 683–690. [Google Scholar] [CrossRef]
- De Boer, H.C. Co-digestion of animal slurry can increase short-term Nitrogen recovery by crops. J. Environ. Qual. 2008, 37, 1968–1973. [Google Scholar] [CrossRef]
- Möller, K.; Schulz, R.; Müller, T. Substrate inputs, nutrient flows and nitrogen loss of two centralized biogas plants in southern Germany. Nutr. Cycl. Agroecosystems 2010, 87, 307–325. [Google Scholar] [CrossRef]
- Maucieri, C.; Barbera, A.C.; Borin, M. Effect of injection depth of digestate liquid fraction on soil carbon dioxide emission and maize biomass production. Ital. J. Agron. 2016, 11, 6–11. [Google Scholar] [CrossRef]
- Delzeit, R.; Kellner, U. How Location Decisions Influence Transport Costs of Processed and Unprocessed Bioenergy Digestates: The Impact of Plant Size and Location on Profitability of Biogas Plants in Germany; Kiel Workingpapers: Kiel, Germany, 2011. [Google Scholar]
- Maucieri, C.; Mietto, A.; Barbera, A.C.; Borin, M. Treatment performance and greenhouse gas emission of a pilot hybrid constructed wetland system treating digestate liquid fraction. Ecol. Eng. 2016, 94, 406–417. [Google Scholar] [CrossRef]
- Macura, B.; Johannesdottir, S.L.; Piniewski, M.; Haddaway, N.R.; Kvarnström, E. Effectiveness of ecotechnologies for recovery of nitrogen and phosphorus from anaerobic digestate and effectiveness of the recovery products as fertilisers: A systematic review protocol. Environ. Evid. 2019, 8, 29. [Google Scholar] [CrossRef]
- Zheng, T.; Qiu, Z.; Dai, Q.; Chen, J. Study of biogas slurry concentrated by reverse osmosis system: Characteristics, optimization, and mechanism. Water Environ. Res. 2019, 91, 1447–1454. [Google Scholar] [CrossRef] [PubMed]
- Lukehurst, C.T.; Frost, P.; Al Seadi, T. Utilisation of digestate from biogas plants as biofertiliser. IEA Bioenergy 2010, Task 37, 1–22. [Google Scholar]
- Badagliacca, G.; Petrovičovà, B.; Pathan, S.I.; Roccotelli, A.; Romeo, M.; Monti, M.; Gelsomino, A. Use of solid anaerobic digestate and no-tillage practice for restoring the fertility status of two Mediterranean orchard soils with contrasting properties. Agric. Ecosyst. Environ. 2020, 300, 107010. [Google Scholar] [CrossRef]
- Maucieri, C.; Borin, M. CO2 emissions and maize biomass production using digestate liquid fraction in two soil texture types. Trans. ASABE 2017, 60, 1325–1336. [Google Scholar] [CrossRef]
- Comino, E.; Riggio, V.A.; Rosso, M. Constructed wetland treatment of agricultural effluent from an anaerobic digester. Ecol. Eng. 2013, 54, 165–172. [Google Scholar] [CrossRef]
- Zhou, S.; Wang, C.; Liu, C.; Sun, H.; Zhang, J.; Zhang, X.; Xin, L. Nutrient removal, methane and nitrous oxide emissions in a hybrid constructed wetland treating anaerobic digestate. Sci. Total Environ. 2020, 733, 138338. [Google Scholar] [CrossRef]
- Vymazal, J. Removal of phosphorous in constructed wetland with horizontal subsurface flow in the Czech Republic. WaterAir Soli Pollut. Focus 2004, 4, 657–670. [Google Scholar] [CrossRef]
- Szogi, A.A.; Rice, J.M.; Humenik, F.J.; Hunt, P.G.; Stem, G. Constructed wetlands for confined swine wastewater treatment. In Proceedings of the 1999 Animal Waste Management System Symposium, Cary, NC, USA; 1999; pp. 379–383. [Google Scholar]
- Knight, R.L.; Payne, V.W.E.; Borer, R.E.; Clarke, R.A.; Pries, J.H. Constructed wetlands for livestock wastewater management. Ecol. Eng. 2000, 15, 41–55. [Google Scholar] [CrossRef]
- Borin, M.; Politeo, M.; De Stefani, G. Performance of a hybrid constructed wetland treating piggery wastewater. Ecol. Eng. 2013, 51, 229–236. [Google Scholar] [CrossRef]
- Smith, K.A.; Charles, D.R.; Moorhouse, D. Nitrogen excretion by farm livestock with respect to land spreading requirements and controlling nitrogen losses to ground and surface waters. Part 2: Pigs and poultry. Bioresour. Technol. 2000, 71, 183–194. [Google Scholar] [CrossRef]
- Healy, M.G.; Rodgers, M.; Mulqueen, J. Treatment of dairy wastewater using constructed wetlands and intermittent sand filters. Bioresour. Technol. 2007, 98, 2268–2281. [Google Scholar] [CrossRef] [PubMed]
- Hunt, P.G.; Szögi, A.A.; Humenik, F.J.; Rice, J.M.; Matheny, T.A.; Stone, K.C. Constructed wetlands for treatment of swine wastewater from an anaerobic lagoon. Trans. Am. Soc. Agric. Eng. 2002, 45, 639–647. [Google Scholar]
- Hunt, P.G.; Matheny, T.A.; Stone, K.C. Denitrification in a coastal plain riparian zone contiguous to a heavily loaded swine wastewater spray field. J. Environ. Qual. 2004, 33, 2367–2374. [Google Scholar] [CrossRef] [PubMed]
- Harrington, C.; Scholz, M. Assessment of pre-digested piggery wastewater treatment operations with surface flow integrated constructed wetland systems. Bioresour. Technol. 2010, 101, 7713–7723. [Google Scholar] [CrossRef]
- Monfet, E.; Aubry, G.; Ramirez, A.A. Nutrient removal and recovery from digestate: A review of the technology. Biofuels 2018, 9, 247–262. [Google Scholar] [CrossRef]
- Wu, S.; Lei, M.; Lu, Q.; Guo, L.; Dong, R. Treatment of pig manure liquid digestate in horizontal flow constructed wetlands: Effect of aeration. Eng. Life Sci. 2016, 16, 263–271. [Google Scholar] [CrossRef] [Green Version]
- Fuchs, W.; Drosg, B. Assessment of the state of the art of technologies for the processing of digestate residue from anaerobic digesters. Water Sci. Technol. 2013, 67, 1984–1993. [Google Scholar] [CrossRef] [Green Version]
- Sánchez, L.D.; Marin, L.M.; Visscher, J.T.; Rietveld, L.C. Low-cost multi-stage filtration enhanced by coagulation-flocculation in upflow gravel filtration. Drink. Water Eng. Sci. 2012, 5, 73–85. [Google Scholar] [CrossRef] [Green Version]
- Wei, X.M.; Lin, C.; Duan, N.; Peng, Y.X.; Ye, Z.Y. Application of aerobic biological filter for treating swine farms wastewater. Procedia Environ. Sci. 2010, 2, 1569–1584. [Google Scholar] [CrossRef] [Green Version]
- Liu, Q.; Mancl, K.; Tuovinen, O.H. Biomass accumulation and carbon utilization in layered sand filter biofilm systems receiving milk fat and detergent mixtures. Bioresour. Technol. 2003, 89, 275–279. [Google Scholar] [CrossRef]
- Nakhla, G.; Farooq, S. Simultaneous nitrification-denitrification in slow sand filters. J. Hazard. Mater. 2003, 96, 291–303. [Google Scholar] [CrossRef]
- Roseth, R. Shell sand: A new filter medium for constructed wetlands and wastewater treatment. J. Environ. Sci. Heal. Part. A Toxic Hazard. Subst. Environ. Eng. 2000, 35, 1335–1355. [Google Scholar] [CrossRef]
- Tao, W.; Wang, J. Effects of vegetation, limestone and aeration on nitritation, anammox and denitrification in wetland treatment systems. Ecol. Eng. 2009, 35, 836–842. [Google Scholar] [CrossRef]
- Zheng, D.; Deng, L.W.; Fan, Z.H.; Liu, G.J.; Chen, C.; Yang, H.; Liu, Y. Influence of sand layer depth on partial nitritation as pretreatment of anaerobically digested swine wastewater prior to anammox. Bioresour. Technol. 2012, 104, 274–279. [Google Scholar] [CrossRef]
- Saliling, W.J.B.; Westerman, P.W.; Losordo, T.M. Wood chips and wheat straw as alternative biofilter media for denitrification reactors treating aquaculture and other wastewaters with high nitrate concentrations. Aquac. Eng. 2007, 37, 222–233. [Google Scholar] [CrossRef]
- Wang, Z.; Dong, J.; Liu, L.; Zhu, G.; Liu, C. Screening of phosphate-removing substrates for use in constructed wetlands treating swine wastewater. Ecol. Eng. 2013, 54, 57–65. [Google Scholar] [CrossRef]
- Yasuda, T.; Kuroda, K.; Fukumoto, Y.; Hanajima, D.; Suzuki, K. Evaluation of full-scale biofilter with rockwool mixture treating ammonia gas from livestock manure composting. Bioresour. Technol. 2009, 100, 1568–1572. [Google Scholar] [CrossRef]
- Kadam, A.M.; Nemade, P.D.; Oza, G.H.; Shankar, H.S. Treatment of municipal wastewater using laterite-based constructed soil filter. Ecol. Eng. 2009, 35, 1051–1061. [Google Scholar] [CrossRef]
- Wang, H.; Xu, J.; Sheng, L. Purification mechanism of sewage from constructed wetlands with zeolite substrates: A review. J. Clean. Prod. 2020, 120760. [Google Scholar] [CrossRef]
- Ferretti, G.; Galamini, G.; Medoro, V.; Coltorti, M.; Giuseppe, D.D.; Faccini, B. Impact of sequential treatments with natural and na-exchanged chabazite zeolite-rich tuff on pig-slurry chemical composition. Water 2020, 12, 310. [Google Scholar] [CrossRef] [Green Version]
- Mateus, D.M.R.; Pinho, H.J.O. Evaluation of solid waste stratified mixtures as constructed wetland fillers under different operation modes. J. Clean. Prod. 2020, 253, 119986. [Google Scholar] [CrossRef]
- Kasprzyk, M.; Gajewska, M. Phosphorus removal by application of natural and semi-natural materials for possible recovery according to assumptions of circular economy and closed circuit of P. Sci. Total Environ. 2019, 650, 249–256. [Google Scholar] [CrossRef] [PubMed]
- APHA. Standard Methods for the Examination of Water and Wastewater, 20th ed.; American Public Health Association: Washington, DC, USA; American Water Works Association: Denver, CO, USA; Water Environment Federation: Alexandria, VA, USA, 1998. [Google Scholar]
- Hach-Lange, C. Water Analysis Handbook; Hach Company: Loveland, CO, USA, 1989. [Google Scholar]
- DIN (Deutsches Institut FürNormung). German Standard Methods for the Examination of Water, Wastewater and Sludge; Deutches Institut für Normung: Berlin, Germany, 1985. [Google Scholar]
- Dayton, E.A.; Basta, N.T. Characterization of drinking water treatment residuals for use as a soil substitute. Water Environ. Res. 2001, 73, 52–57. [Google Scholar] [CrossRef] [PubMed]
- Alburquerque, J.A.; de la Fuente, C.; Bernal, M.P. Chemical properties of anaerobic digestates affecting C and N dynamics in amended soils. Agric. Ecosyst. Environ. 2012, 160, 15–22. [Google Scholar] [CrossRef]
- Chadwick, D.R. Digestate as a fertiliser and environmental concerns. In Anaerobic Digestion Stakeholder Workshop. Session IV: Building the Market for Digestate; Exeter University: Exeter, UK, 2007. [Google Scholar]
- Smith, K.A.; Metcalfe, P.; Grylls, J.; Jeffrey, W.; Sinclair, A. Nutrient Value of Digestate from Farm-Based Biogas Plants in Scotland; Report for Scottish Executive Environment and Rural Affairs Department-ADA/009/06; Scottish Executive Environmental and Rural Affairs Department: Edinburgh, UK, 2007.
- Webb, A.R.; Hawkes, F.R. Laboratory scale anaerobic digestion of poultry litter: Gas yield-loading rate relationship. Agric. Waste 1985, 13, 31–49. [Google Scholar] [CrossRef]
- Sommer, S.G.; Husted, S. A simple model of pH in slurry. J. Agric. Sci. Camb. 1995, 124, 447–453. [Google Scholar] [CrossRef]
- Platzer, C. Enhanced nitrogen elimination in subsurface flow artificial wetlands—A multi stage concept. In Proceedings of the Fifth International Conference on Wetland Systems for Water Pollution Control, Vienna, Austria; 1996. [Google Scholar]
- Paul, E.A.; Clark, F.E. Soil Microbiology and Biochemistry, 2nd ed.; Academic Press: San Diego, CA, USA, 1996; ISBN 0125468059. [Google Scholar]
- Kadlec, R.H.; Wallace, S.D. Treatment Wetlands, 2nd ed.; CRC Press: Boca Raton, FL, USA, 2009; ISBN 9781566705264. [Google Scholar]
- Boyer, M.L.H.; Wheeler, B.D. Vegetation patterns in spring-fed calcareous fens: Calcite precipitation and constraints on fertility. J. Ecol. 1989, 77, 597. [Google Scholar] [CrossRef]
- Schot, P.P.; Wassen, M.J. Calcium concentrations in wetland groundwater in relation to water sources and soil conditions in the recharge area. J. Hydrol. 1993, 141, 197–217. [Google Scholar] [CrossRef] [Green Version]
- Bernet, N.; Dangcong, P.; Delgenès, J.-P.; Moletta, R. Nitrification at low Oxygen concentration in biofilm reactor. J. Environ. Eng. 2001, 127, 266–271. [Google Scholar] [CrossRef]
- Vymazal, J. Removal of nutrients in various types of constructed wetlands. Sci. Total Environ. 2007, 380, 48–65. [Google Scholar] [CrossRef] [PubMed]
- Shi, W.; Li, H.; Li, A. Mechanism and influencing factors of Nitrogen removal in subsurface flow constructed wetland. Appl. Chem. Eng. 2018, 1, 9–14. [Google Scholar]
- Zhuang, L.L.; Yang, T.; Zhang, J.; Li, X. The configuration, purification effect and mechanism of intensified constructed wetland for wastewater treatment from the aspect of nitrogen removal: A review. Bioresour. Technol. 2019, 293, 122086. [Google Scholar] [CrossRef] [PubMed]
- Reddy, K.R.; Patrick, W.H. Nitrogen transformations and loss in flooded soils and sediments. Crit. Rev. Environ. Control. 1984, 13, 273–309. [Google Scholar] [CrossRef]
- Parde, D.; Patwa, A.; Shukla, A.; Vijay, R.; Killedar, D.J.; Kumar, R. A review of constructed wetland on type, treatment and technology of wastewater. Environ. Technol. Innov. 2020, 101261. [Google Scholar] [CrossRef]
- Koskiaho, J.; Puustinen, M. Suspended solids and nutrient retention in two constructed wetlands as determined from continuous data recorded with sensors. Ecol. Eng. 2019, 137, 65–75. [Google Scholar] [CrossRef]
- Wallace, S.; Knight, R. Small-Scale Constructed Wetland Treatment Systems; IWA Publishing: London, UK, 2006. [Google Scholar]
- Jiang, W.; Tian, X.; Li, L.; Dong, S.; Zhao, K.; Li, H.; Cai, Y. Temporal bacterial community succession during the start-up process of biofilters in a cold-freshwater recirculating aquaculture system. Bioresour. Technol. 2019, 287, 121441. [Google Scholar] [CrossRef]
- Pramanik, B.K.; Fatihah, S.; Shahrom, Z.; Ahmed, E. Biological aerated filters (BAFs) for carbon and nitrogen removal: A review. J. Eng. Sci. Technol. 2012, 7, 428–446. [Google Scholar]
- Vohla, C.; Kõiv, M.; Bavor, H.J.; Chazarenc, F.; Mander, Ü. Filter materials for phosphorus removal from wastewater in treatment wetlands—A review. Ecol. Eng. 2011, 37, 70–89. [Google Scholar] [CrossRef]
- Guan, B.; Yao, X.; Jiang, J.; Tian, Z.; An, S.; Gu, B.; Cai, Y. Phosphorus removal ability of three inexpensive substrates: Physicochemical properties and application. Ecol. Eng. 2009, 35, 576–581. [Google Scholar] [CrossRef]
- Maucieri, C.; Salvato, M.; Borin, M. Vegetation contribution on phosphorus removal in constructed wetlands. Ecol. Eng. 2020, 152, 105853. [Google Scholar] [CrossRef]
- Henderson, C.; Greenway, M.; Phillips, I. Removal of dissolved nitrogen, phosphorous and carbon from stormwater by biofiltration mesocosms. Water Sci. Technol. 2007, 55, 183–191. [Google Scholar] [CrossRef] [PubMed]
- Shi, X.; Fan, J.; Zhang, J.; Shen, Y. Enhanced phosphorus removal in intermittently aerated constructed wetlands filled with various construction wastes. Environ. Sci. Pollut. Res. 2017, 24, 22524–22534. [Google Scholar] [CrossRef]
- Tambone, F.; Orzi, V.; Zilio, M.; Adani, F. Measuring the organic amendment properties of the liquid fraction of digestate. Waste Manag. 2019, 88, 21–27. [Google Scholar] [CrossRef]
- Zhu, H.; Yan, B.; Xu, Y.; Guan, J.; Liu, S. Removal of nitrogen and COD in horizontal subsurface flow constructed wetlands under different influent C/N ratios. Ecol. Eng. 2014, 63, 58–63. [Google Scholar] [CrossRef]
- Chen, X.; Zhu, H.; Yan, B.; Shutes, B.; Tian, L.; Wen, H. Optimal influent COD/N ratio for obtaining low GHG emissions and high pollutant removal efficiency in constructed wetlands. J. Clean. Prod. 2020, 267, 122003. [Google Scholar] [CrossRef]
- Fan, J.; Wang, W.; Zhang, B.; Guo, Y.; Ngo, H.H.; Guo, W.; Zhang, J.; Wu, H. Nitrogen removal in intermittently aerated vertical flow constructed wetlands: Impact of influent COD/N ratios. Bioresour. Technol. 2013, 143, 461–466. [Google Scholar] [CrossRef]
- Wang, J.; Hou, J.; Xia, L.; Jia, Z.; He, X.; Li, D.; Zhou, Y. The combined effect of dissolved oxygen and COD/N on nitrogen removal and the corresponding mechanisms in intermittent aeration constructed wetlands. Biochem. Eng. J. 2020, 153, 107400. [Google Scholar] [CrossRef]
Figure 1.
Description of filter structure: (a) upper (UM) and lower (LM) filter modules; (b) modules’ internal structure with dimensions expressed in mm; (c) vacuum pump; (d) plastic cap; (e) timer.
Figure 1.
Description of filter structure: (a) upper (UM) and lower (LM) filter modules; (b) modules’ internal structure with dimensions expressed in mm; (c) vacuum pump; (d) plastic cap; (e) timer.

Figure 2.
Total nitrogen (TN), ammonia–nitrogen (NH4-N), and nitrate–nitrogen (NO3-N) during the eight-week experiment. Values are expressed as concentration (a,c,e) and cumulative mass balance (b,d,f).
Figure 2.
Total nitrogen (TN), ammonia–nitrogen (NH4-N), and nitrate–nitrogen (NO3-N) during the eight-week experiment. Values are expressed as concentration (a,c,e) and cumulative mass balance (b,d,f).

Figure 3.
Box plot of total phosphorus (TP), soluble phosphorus (PO4-P), and chemical oxygen demand (COD) expressed as concentration (a,c,e) and mass balance (b,d,f). Different letters indicate significant differences according to a Kruskal–Wallis test with p ≤ 0.05. ns = not significant difference.


Table 1.
Composition and characteristics of filters.
| Filter Name | Size (mm) | Total Weight (kg) | Porosity (%) | Residence Time (min) |
|---|---|---|---|---|
| BRICK | 50–100 | 60 | 53 | 17 1 |
| REFR 30–50 | 30–50 | 61 | 47 | 21 1 |
| REFR 20–30 | 20–30 | 40 | 55 | 22 1 |
| GRAVEL | 8–15 | 89 | 41 | 15 1 |
1 90% of digestate exits after 2 min.
Table 2.
The eight-week median values of electrical conductivity (EC), pH, dissolved oxygen (DO), temperature (T), and turbidity of digestate at the inlet (IN) and filter outlets. Different letters indicate significant differences at p < 0.05 using the Kruskal–Wallis test.
Table 2.
The eight-week median values of electrical conductivity (EC), pH, dissolved oxygen (DO), temperature (T), and turbidity of digestate at the inlet (IN) and filter outlets. Different letters indicate significant differences at p < 0.05 using the Kruskal–Wallis test.
| Property | Unit | IN | BRICK | REFR 30–50 | REFR 20–30 | GRAVEL |
|---|---|---|---|---|---|---|
| EC | mS cm−1 | 27.5 a | 20.8 b | 21.6 a | 18.7 b | 21.5 b |
| pH | - | 7.7 a | 8.6 b | 8.5 b | 8.5 b | 8.3 a |
| DO | mg L−1 | 0.18 a | 0.30 b | 0.21 b | 0.20 b | 0.26 b |
| T | °C | 18.9 ns | 19.9 ns | 18.9 ns | 19.2 ns | 19.2 ns |
| Turbidity | NTU | 38,265 a | 33,330 a | 32,040 a | 32,040 b | 31,190 b |
ns: not significant; REFR: porous refractory material
Table 3.
The eight-week median values of total nitrogen (TN), ammonia–nitrogen (NH4-N), and nitrate–nitrogen (NO3-N) at the inlet (IN) and filter outlets. Different letters indicate significant differences at p < 0.05 by Kruskal–Wallis test. ns: not significant.
Table 3.
The eight-week median values of total nitrogen (TN), ammonia–nitrogen (NH4-N), and nitrate–nitrogen (NO3-N) at the inlet (IN) and filter outlets. Different letters indicate significant differences at p < 0.05 by Kruskal–Wallis test. ns: not significant.
| Parameter (mg L−1) | IN | BRICK | REFR 30–50 | REFR 20–30 | GRAVEL |
|---|---|---|---|---|---|
| TN | 4035 ns | 3290 ns | 3050 ns | 2870 ns | 2940 ns |
| NH4-N | 2910 a | 1643 a | 2124 a | 960 b | 1398 a |
| NO3-N | 276 ns | 305 ns | 302 ns | 280 ns | 304 ns |
| Parameter (g filter−1) | |||||
| TN | 80.7 a | 62.5 a | 57.0 a | 51.5 b | 52.8 a |
| NH4-N | 58.2 a | 30.8 a | 38.2 a | 13.4 b | 22.6 a |
| NO3-N | 5.5 ns | 5.7 ns | 5.7 ns | 5.3 ns | 5.6 ns |
Publisher’s Note: MDPI stays neutral with regard to jurisdictional claims in published maps and institutional affiliations. |
© 2020 by the authors. Licensee MDPI, Basel, Switzerland. This article is an open access article distributed under the terms and conditions of the Creative Commons Attribution (CC BY) license (http://creativecommons.org/licenses/by/4.0/).
Share and Cite
MDPI and ACS Style
Piccoli, I.; Virga, G.; Maucieri, C.; Borin, M. Digestate Liquid Fraction Treatment with Filters Filled with Recovery Materials. Water 2021, 13, 21. https://0-doi-org.brum.beds.ac.uk/10.3390/w13010021
AMA Style
Piccoli I, Virga G, Maucieri C, Borin M. Digestate Liquid Fraction Treatment with Filters Filled with Recovery Materials. Water. 2021; 13(1):21. https://0-doi-org.brum.beds.ac.uk/10.3390/w13010021
Chicago/Turabian StylePiccoli, Ilaria, Giuseppe Virga, Carmelo Maucieri, and Maurizio Borin. 2021. "Digestate Liquid Fraction Treatment with Filters Filled with Recovery Materials" Water 13, no. 1: 21. https://0-doi-org.brum.beds.ac.uk/10.3390/w13010021
Note that from the first issue of 2016, this journal uses article numbers instead of page numbers. See further details here.