
An Evaluation of Urban Resilience to Flooding


1
Evergrande School of Management, Wuhan University of Science and Technology, Wuhan 430065, China
2
Hubei Industrial Policy and Management Center, Wuhan 430065, China
3
Faculty of Science and Engineering, University of Wolverhampton, Wolverhampton WV1 1NA, UK
4
School of Business, Hubei University, Wuhan 430062, China
*
Author to whom correspondence should be addressed.
Water 2021, 13(15), 2022; https://0-doi-org.brum.beds.ac.uk/10.3390/w13152022
Submission received: 17 June 2021
/
Revised: 20 July 2021
/
Accepted: 20 July 2021
/
Published: 24 July 2021
(This article belongs to the Special Issue Flood Risk Management and Resilience)
Abstract
:Flooding has become the natural disaster that causes the greatest losses, with urban flooding restricting the healthy development of cities. The ability to assess a city’s resilience to flooding is very important and would contribute to improving resilience and also help to inform planning and development. The aim of this study was to determine the key urban flood resilience indicators for three different Chinese cities (Wuhan, Nanjing, and Hefei) and to prioritize these for each city. A combined interpretive structure and network analysis method (ISM-ANP) model was used to evaluate and analyze the selected evaluation indicators. A four-level urban flood resilience evaluation network model was constructed to determine the interdependence between indicators and to calculate the priorities of the flood resilience indicators for the three cities. Overall, rescue capacity was found to be extremely important and was defined as the most important index. For Wuhan, indicators related to the distribution of waters were found to be more important, while for Nanjing, spatial planning and spatial structure of land use were found to be key priorities. In Hefei, the level of investment in infrastructure and the level of public resources occupy a more important position. The framework presented in this study contributes to the understanding of urban flood resilience and has the potential to be extended to other natural hazards.
1. Introduction
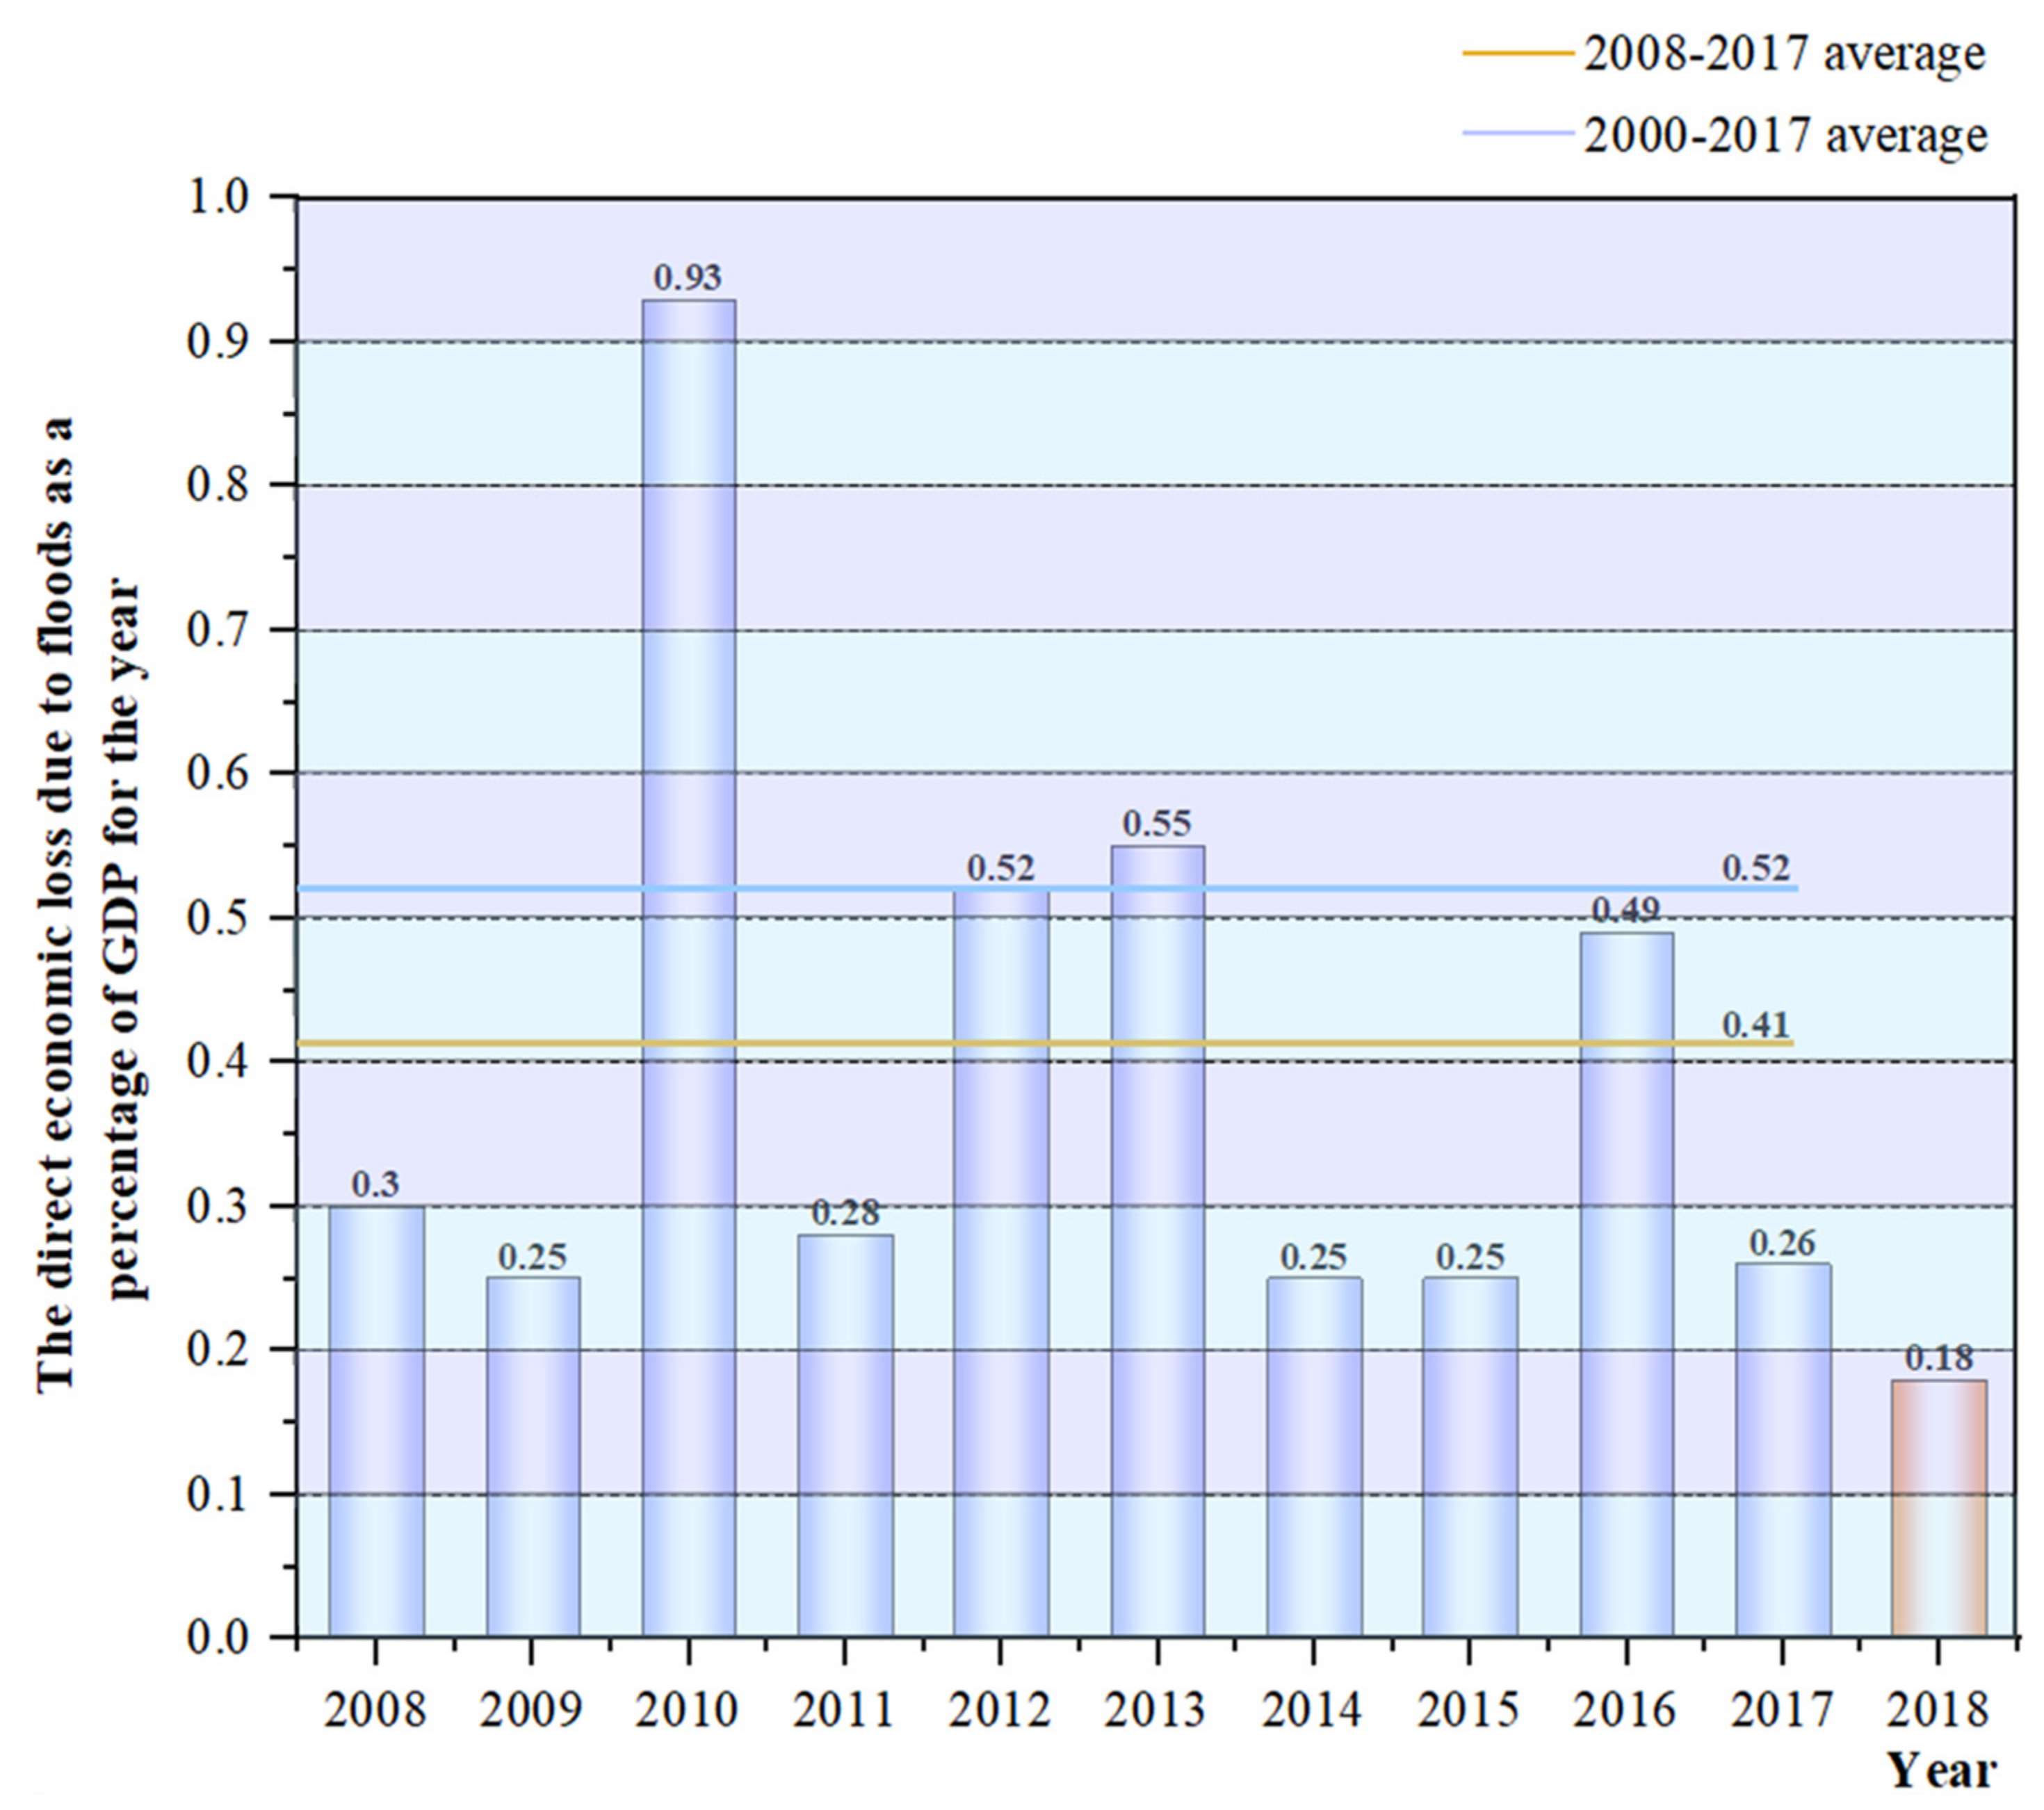
Flooding has become the most frequent natural hazard posing significant social, economic, and environmental damages across the globe especially in urban areas with high levels of vulnerability [1]. According to the “Annual Flood and Drought Disaster Report in China” (Ministry of Water Resources of the People’s Republic of China, 2019), in the 10 years from 2008 to 2018, huge economic losses have been caused by flooding every year. For example, in 2018, 83 cities experienced flood events, and the direct economic losses accounted for 18% of GDP that year, as shown in Figure 1 [2]. As global warming and human activities intensify, extreme rainfall events in the future will become more frequent, leading to more fatalities and losses [3,4]. The ability of a city to resist the effects of flooding has gradually received more attention and development. Even when such hazards are recognized, risk reduction and vulnerability are often not salient concerns until after these events occur [5]. However, in order to manage future flooding it is crucial to consider flood risk mitigation and adaptation measures now. In recent times, improving resilience to flooding has become one of the most important methods for coping with climate change and natural hazards, and hence the quantitative evaluation of flood resilience has emerged as a priority [6].
Consequently, there has been a noticeable shift from efforts to understand hazard vulnerability towards improving the resilience of cities to flooding [7]. The adversities caused by rapid urbanization and natural disasters (such as extreme precipitation, waterlogging, hail, etc.) have promoted the need for further research on sustainable development and resilience [8]. Resilience is a controversial concept and has different definitions in different disciplines and contexts [9]. For example, in engineering, usually engineers define it as the ability of a system to recover from a disruption caused by a disturbance [10]. In ecology, it is related to the changes that the system can tolerate and the ability to reorganize or renew [11]. The National Research Council defines resilience as “the ability to prepare and plan for, absorb, recover from, and more successfully adapt to adverse events” [12]. The connotation of resilience in the context of flood risk management relate to when the urban water system faces floods: (a) the ability to withstand flooding events, that is, the ability to protect against floods; (b) the resilience when events occur, that is, the ability to minimize damage and support speedy recovery; and (c) the self-organization, learning, and adaptability of the system [13]. Combining the understanding of resilience by different scholars and experts, this study defines resilience as the extent to which the system endures interference and can still return to its original state quickly when impacted, maintaining its main functions, structural characteristics, and self-regulation ability. The combination of resilience theory and water systems knowledge opens up the potential for new research directions and a vision of future flood resilience [14].
Flood resilience captures the ability to thrive through flood events and recover from the disruptions occurred to the engineering assets [15]. Some scholars have defined the concept of flood resilience from different scales such as building units, cities, river basins, and regions (Table 1). The common point is that on the one hand, they emphasize the ability to withstand flood hazards, and on the other hand, they emphasize the ability to recover after the hazard has taken place [16]. The single-scale flood resilience of a building emphasizes more on the physical structure to resist flood hazards, while the urban and regional flood resilience emphasizes the accumulation of experience and pays attention to social structures and spatial characteristics [17]. In the context of urban flooding, flood resilience is defined as the ability of a city to resist flood events, to adapt to their impacts, and to recover to the original state after the flooding has receded. This represents the function of the system during and after a flood event [18]. Thus, flood risk management requires efforts not only associated with the zoning of flooding hazards [19,20], but with flood risk management strategies that combine hazard exposure and social vulnerability [21,22], but also concerning how to build the capacity to become resilient [23].
A new wave of research has proven that flood resilience can be integrated systematically into urban planning processes and procedures [24]. However, the current academic research on urban flood resilience is still in its infancy [25,26] and can be roughly divided into the following categories:
(1) Studies that explore the concept and connotations of urban flood resilience and the development of flood resilience theory [10,27,28]; as the scale increases, the connotation of flood resilience becomes more abundant [29].
(2) Evaluation methods of urban flood resilience. This includes urban mitigation assessment methods, which are considered an essential step to reduce flood risk and better prepare for natural hazards [6,30,31,32,33].
(3) Planning strategies and risk reduction methods to improve urban flood resilience; see for example [25,34,35].
In terms of flood resilience assessment methods, Huang et al. (2020) selected the evaluation index system of urban flood resilience and built a simulation model based on system dynamics [28]. Zhong et al. (2020) and Sun et al. (2019) proposed the fuzzy Delphi method and the combination of the analytical network process (ANP) to develop an advanced urban flood prevention measurement index framework [34]. Cui and Li (2019) used the analytical network process (ANP) combined with fuzzy comprehensive evaluation to establish an urban community flood prevention ability framework [30]. Based on this, flood resilience was evaluated by the use of the Decision Test and Evaluation Laboratory (DEMATEL), interpreted structural model (ISM), and ANP [26]. Lin et al. (2019) presented a new quantitative flood susceptibility analysis framework to estimate the potential flood extents and scale. This framework was based on the multicriteria decision-making methods within a platform of the geographic information system (GIS). A composite urban flood risk index (FRI) was derived from various flood conditioning factors [31]. Seekao and Pharino (2016) developed a flood vulnerability map based on the geo-environmental characteristics of the study area. The map was produced through the use of geographic information system methods and a multicriteria evaluation [32]. Rehman et al. (2019) undertook a systematic review of flood assessment research published in reputed journals and identified the main methods and approaches [33].
Although the term resilience has become a new paradigm for flood risk management in places including Europe, Australia, and the United States, China’s approach is still in its infancy [36]. This has tended to focus mainly on the analysis of the concept of urban resilience and the development of theoretical frameworks, including the construction and evaluation of indicator systems [37]. Hence, there remains a number of challenges in formulating the priority of indicators that can be used to evaluate the causes of flooding and improve urban resilience strategies. This research combines the interpretative structure model (ISM) and the network analysis method (ANP) to propose a network structure model to strengthen urban flood resilience, including the following goals: (1) to determine the indicators of urban flood resilience, (2) to establish a simplified hierarchical structure model to distinguish the relationship between indicators, and (1) to determine the priority of indicators and develop policy implications for different cities.
2. Methodology
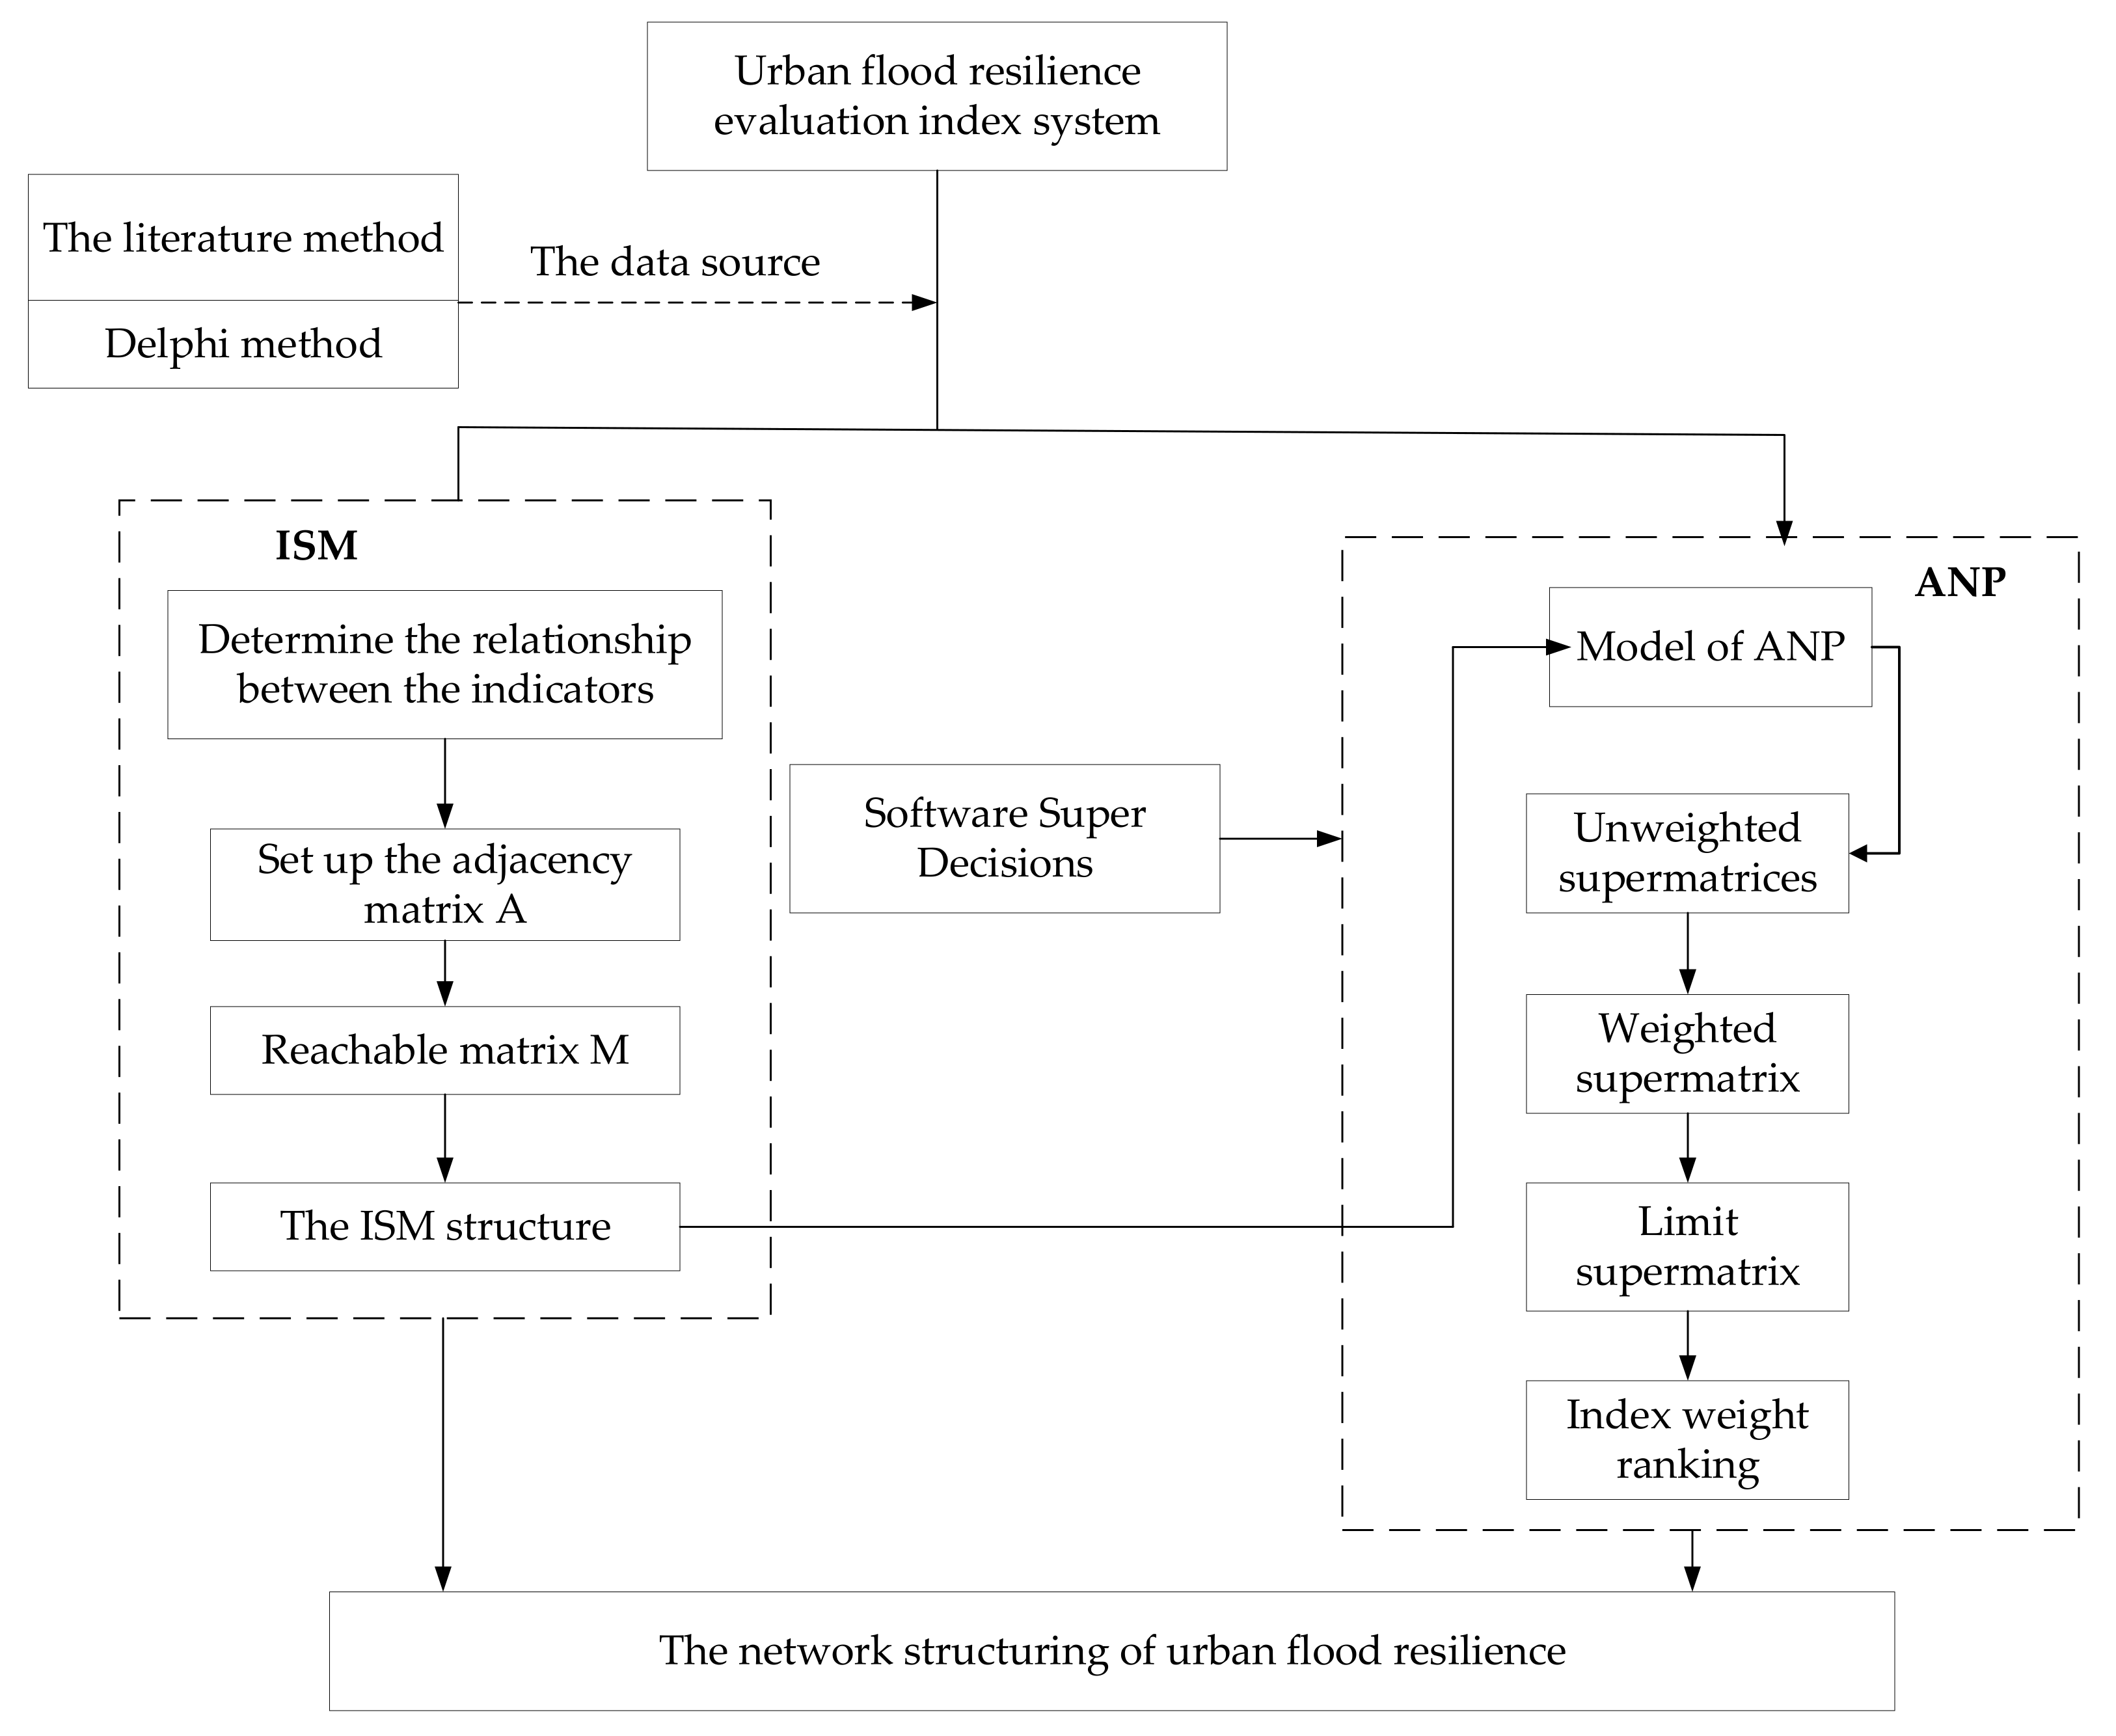
Figure 2 shows the framework for this research. First, the level and index factors of the city’s ability to withstand floods are determined. Secondly, the Interpretive Structure Model (ISM) is used to describe the direct relationship between the indicators, the mutual constraints, connections, and influences, while the correlation matrix of graph theory is used to analyze the overall structure of the system. After the calculation, the network structure model is constructed; then, the analytic network process (ANP) is used to calculate the weight of each of the urban flood resilience indicators, the gaps in the flood resilience of each city, and the ranking of urban flood resilience indicators.
2.1. Establish an ISM Model
ISM is a conceptual model that can transform ambiguous thoughts and opinions into intuitive models with good structural relationships. By mastering the correlation between various representative indicators, and assisted by computing power, ISM can be applied towards helping to improve the understanding of flood resilience. Graphs and matrices explain the indicators and the relationships between them in detail [38]. The basic steps to implement ISM are as follows [7,23,38,39,40,41]:
- 1.
- Establish an adjacency relationship matrix.
The indicators of urban resilience are denoted as V1, V2, V3 …, Vn, Vi ∈ V and were selected, n is the quantity of resilience indicators, and V is the set of resilience indicators. By issuing questionnaires to experts and analyzing the literature, the correlation between the elements is obtained, and then the adjacency matrix A that can reflect the correlation between the elements is established. Set the threshold value λ, if A = (aij)m×n, then aij is the influence of element Vi on Vj, and “0” and “1” are used to indicate the relationship between elements, which is defined as Equation (1):
When Vi has an influence on Vj, aij = 1, when Vi has no influence on Vj, aij = 0.
- 2.
- Reachability matrix solution.
The reachable matrix (denoted by M) is a matrix form that describes the degree that can be reached after a certain length of path between each node of the directed connection graph. The adjacency matrix A obtained from the previous step uses the Boolean algebra operation rules and Formula (2) to calculate the reachable matrix.
Then, M = (A + I)k.
- 3.
- Determining the hierarchical evaluation network.
The antecedent set Ai and the reachability set Ri can be determined by Equations (3) and (4) separately,
If “Ri ∩ Ai = Ri” is satisfied, which means that the reachability set of Ri is completely included in the antecedent set of Ai, then Ri is the factor set with the highest priority, denoted as Level 1. Subsequently, all elements in Ri form the indicators set, and the corresponding row and column are deleted from the matrix D, and class division is done to divide different indicators into different levels. Finally, the hierarchical structure of the network can be determined.
2.2. ANP Method
ANP has evolved from the analytic hierarchy process (AHP), which is applied to assign weights of the selected dimensions and indicators [7]. AHP determines the weight of indicators by pairing dimensions and indicators without considering the interdependence among dimensions [42]. ANP extends the AHP to problems with dependence and feedback. It allows for more complex interrelationships among decision elements by replacing a hierarchy in the AHP with a network [38]. The analysis process using ANP is as follows [38,43,44,45,46]:
- Extracting the features of a problem.
This entails carrying out a systematic analysis of the problem to be solved to form element sets and elements, and at the same time determining the independence or influence relationships between each element. Here, urban flood resilience was broken down into different dimensions, and a reasonable network was constructed through quantitative correlation.
- 2.
- Construct a pairwise comparison judgment matrix.
Decision indicators at each dimension are compared pairwise with respect to their importance towards the same dimension, and the dimensions themselves are also compared pairwise regarding their contribution to the resilience. The relative importance values are determined by Satty’s scale as in AHP (Table 2), then, the priority vector can be calculated.
- 3.
- Calculate eigenvalues and eigenvectors.
After completing the integrated comparison matrix, the eigenvector method and Formula (5) are used to obtain the eigenvector W.
where λmax is the maximum eigenvalue of the comparison matrix.
- 4.
- Checking consistency.
The consistency index (CI) and consistency ratio (CR) are calculated.
where n is the order of the comparison matrix and RI is the average random index based on matrix size. All the comparison matrices are required to pass the test with CR < 0.1, otherwise, the problem must be re-examined and corrected into the judgment of the even comparison matrix.
- 5.
- Initialize supermatrix formation and supermatrix solution.
After the consistency check is completed, under the influence of a single index that meets the consistency, the eigenvectors of each dimension index are integrated into a large matrix, which becomes an unweighted super matrix. A weighted supermatrix is derived by transforming all columns sum to unity, and then the weights are calculated by long-term stable weighted values, allowing the weight of the indicator to be obtained.
3. Empirical Research
3.1. Study Area
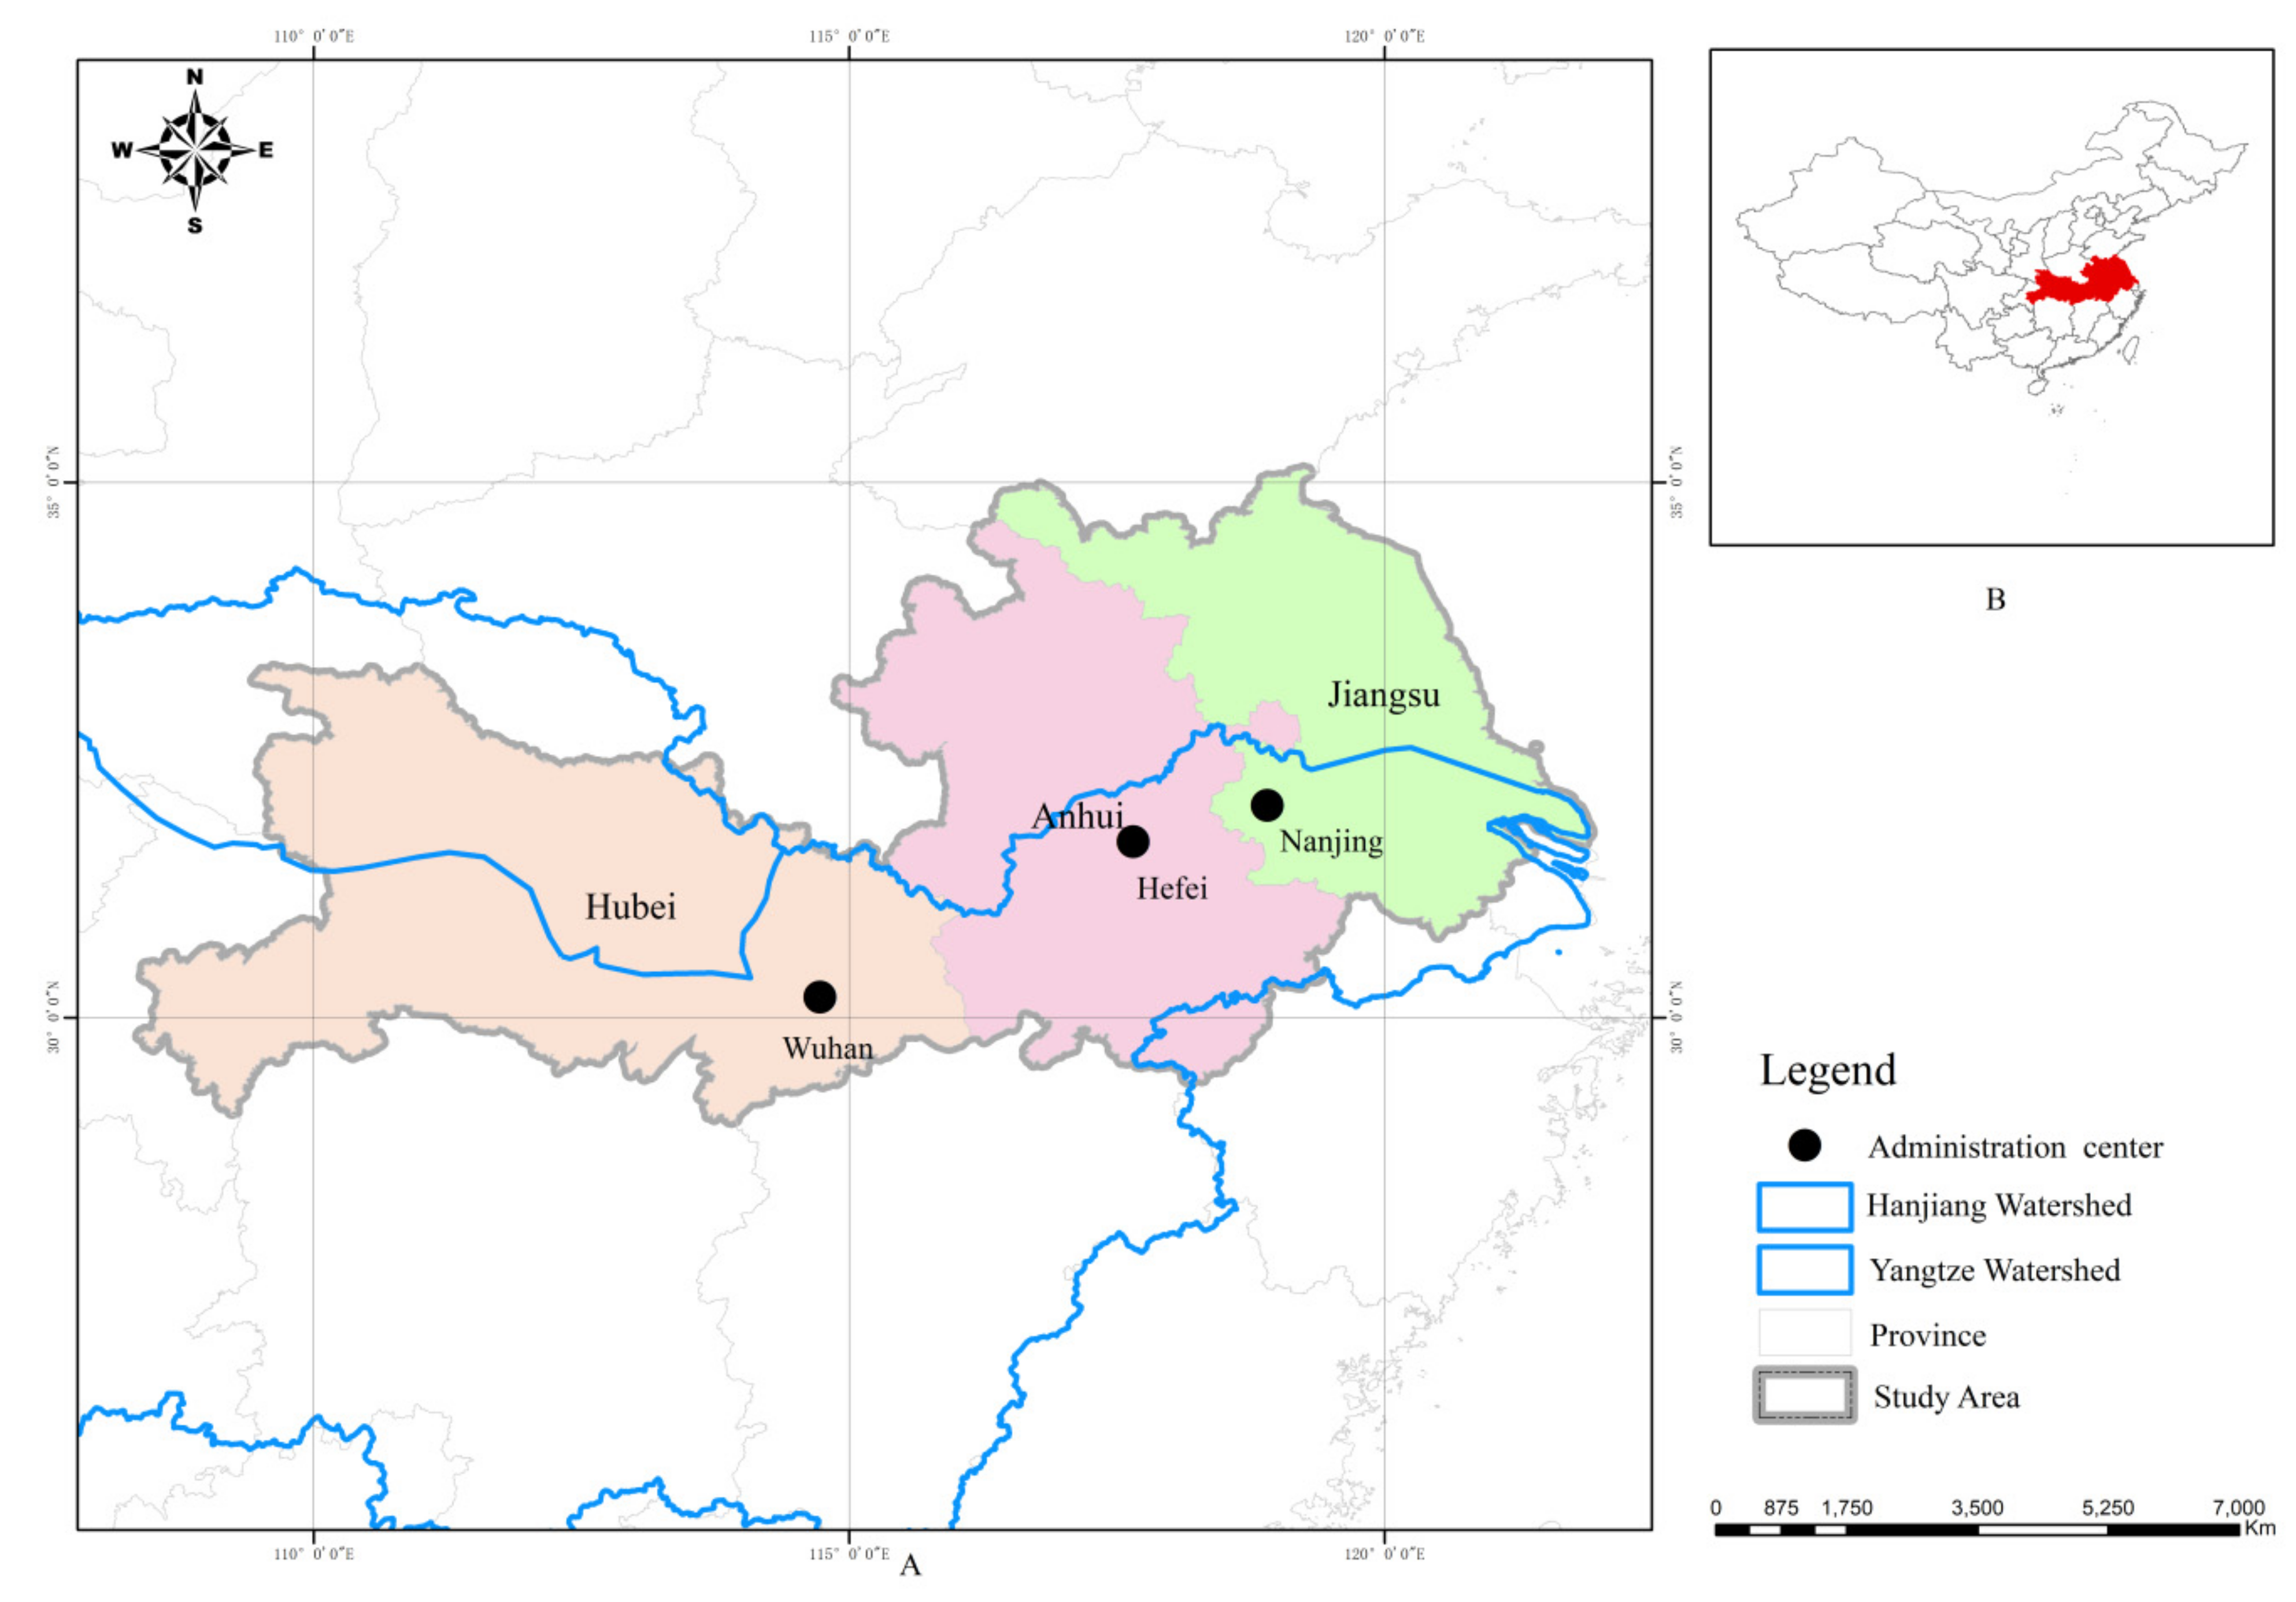
This research selected Wuhan, Nanjing, and Hefei as the research objects. These three cities are all regions with a relatively developed economy and a relatively high degree of urban agglomeration in China (Figure 3).
Wuhan is an important city for flood control of the Yangtze River. The Yangtze River runs through the urban area of Wuhan. The Han River, the largest tributary of the Yangtze River, also merges into the Yangtze River in Wuhan. The annual flood level is higher than the city’s ground elevation. Both the upstream and local rainfall is high, with an average annual rainfall of 1269 mm. Wuhan’s geographical location and climatic characteristics make it a severely flood affected area, with the city’s flood defenses being tested in the flood season almost every year. For example, from 30 June to 9 July 2016, the direct economic losses caused by floods in Wuhan reached USD 55.50 million, the affected population was 535,800, and 120,000 hectares of crops were damaged, causing serious losses.
Nanjing and Hefei have relatively advantageous geographical locations. They are located in the Yangtze River Delta Impact Plain. They form an important part of the Yangtze River Delta city cluster and have an irreplaceable position in the country’s development of modern cities. Nanjing is located in the lower reaches of the Yangtze River, adjacent to the river and the sea, and flooding poses a major threat. For example, on 14 July 2020, due to multiple consecutive days of heavy rainfall, the water level at Xiaguan Station in Nanjing broke through 10.03 m (the warning level is 8.7 m), exceeding the warning level by 1.33 m. Hence, improving the management of flood risk is a priority for the city.
Hefei is the provincial capital of the Anhui Province. The annual average rainfall is 1100 mm and there are highly concentrated rains in some seasons. In 2020, Hefei experienced heavy rains for 18 consecutive days. According to the data released by the Anhui channel of People’s Daily Online on 29 July 2020, 15,000 houses were damaged by floods, and 759,000 people were affected, with direct economic losses of USD 66.13 million.
It can be seen that these three cities are all flood-prone areas, and their economic development levels are quite similar. For this reason they were selected as the research objects for this study towards improving the understanding of their flood resilience and based on the research results to develop valid recommendations for improving their flood control policies and strategies.
3.2. Determine the Relationship between ISM-Based Evaluation Indicators
- Determine the evaluation index system.
Based on evidence from the international research literature [47,48,49] and considering the availability of data, 13 indicators suitable for urban flood resilience were determined around the five dimensions of economic systems, natural environment, government and organization, scientific and technological capabilities, and built environment. Technological capabilities are based on rescue capability and prediction and preparation capabilities. The built environment targets life support systems and infrastructure capabilities. In addition, the government and organization dimension generally refers to hardware and software plans developed to prevent the impact of disasters. The government and organization dimension also includes management capabilities and institutions that respond to disaster outbreaks. The economic systems dimension considers the response and resilience of society and economy to emergencies. In addition, it also includes the financial capacity of the local government to deal with typhoons and floods. Finally, as far as the natural environment is concerned, this focuses on areas with high potential for landslides, floods, and other hazards. Following this, the next steps were to establish an indicator system for urban flood resilience (see Table 3) and conduct evaluation, comparison, and analysis.
- 2.
- Establish adjacency matrix.
V1–V13 are used to represent the secondary indicators in order to form an ISM implementation team to determine the correlation between the indicators. A combination of the Delphi method and an analysis of related literature was adopted. Eight experts with rich experience in urban flood resilience and related fields were invited to complete a questionnaire survey. Details of these experts are shown in Appendix C. Please refer to Appendix D for the specific questionnaire survey. After the results were summarized and sorted, the related literature was analyzed in combination to further determine the relationship between the indicators. Finally, the relationship between all index factors was obtained, and the adjacency matrix A was established.
- 3.
- Calculation of reachable matrix.
The reachable matrix M that can be obtained by programming with Matlab 9.1.0.
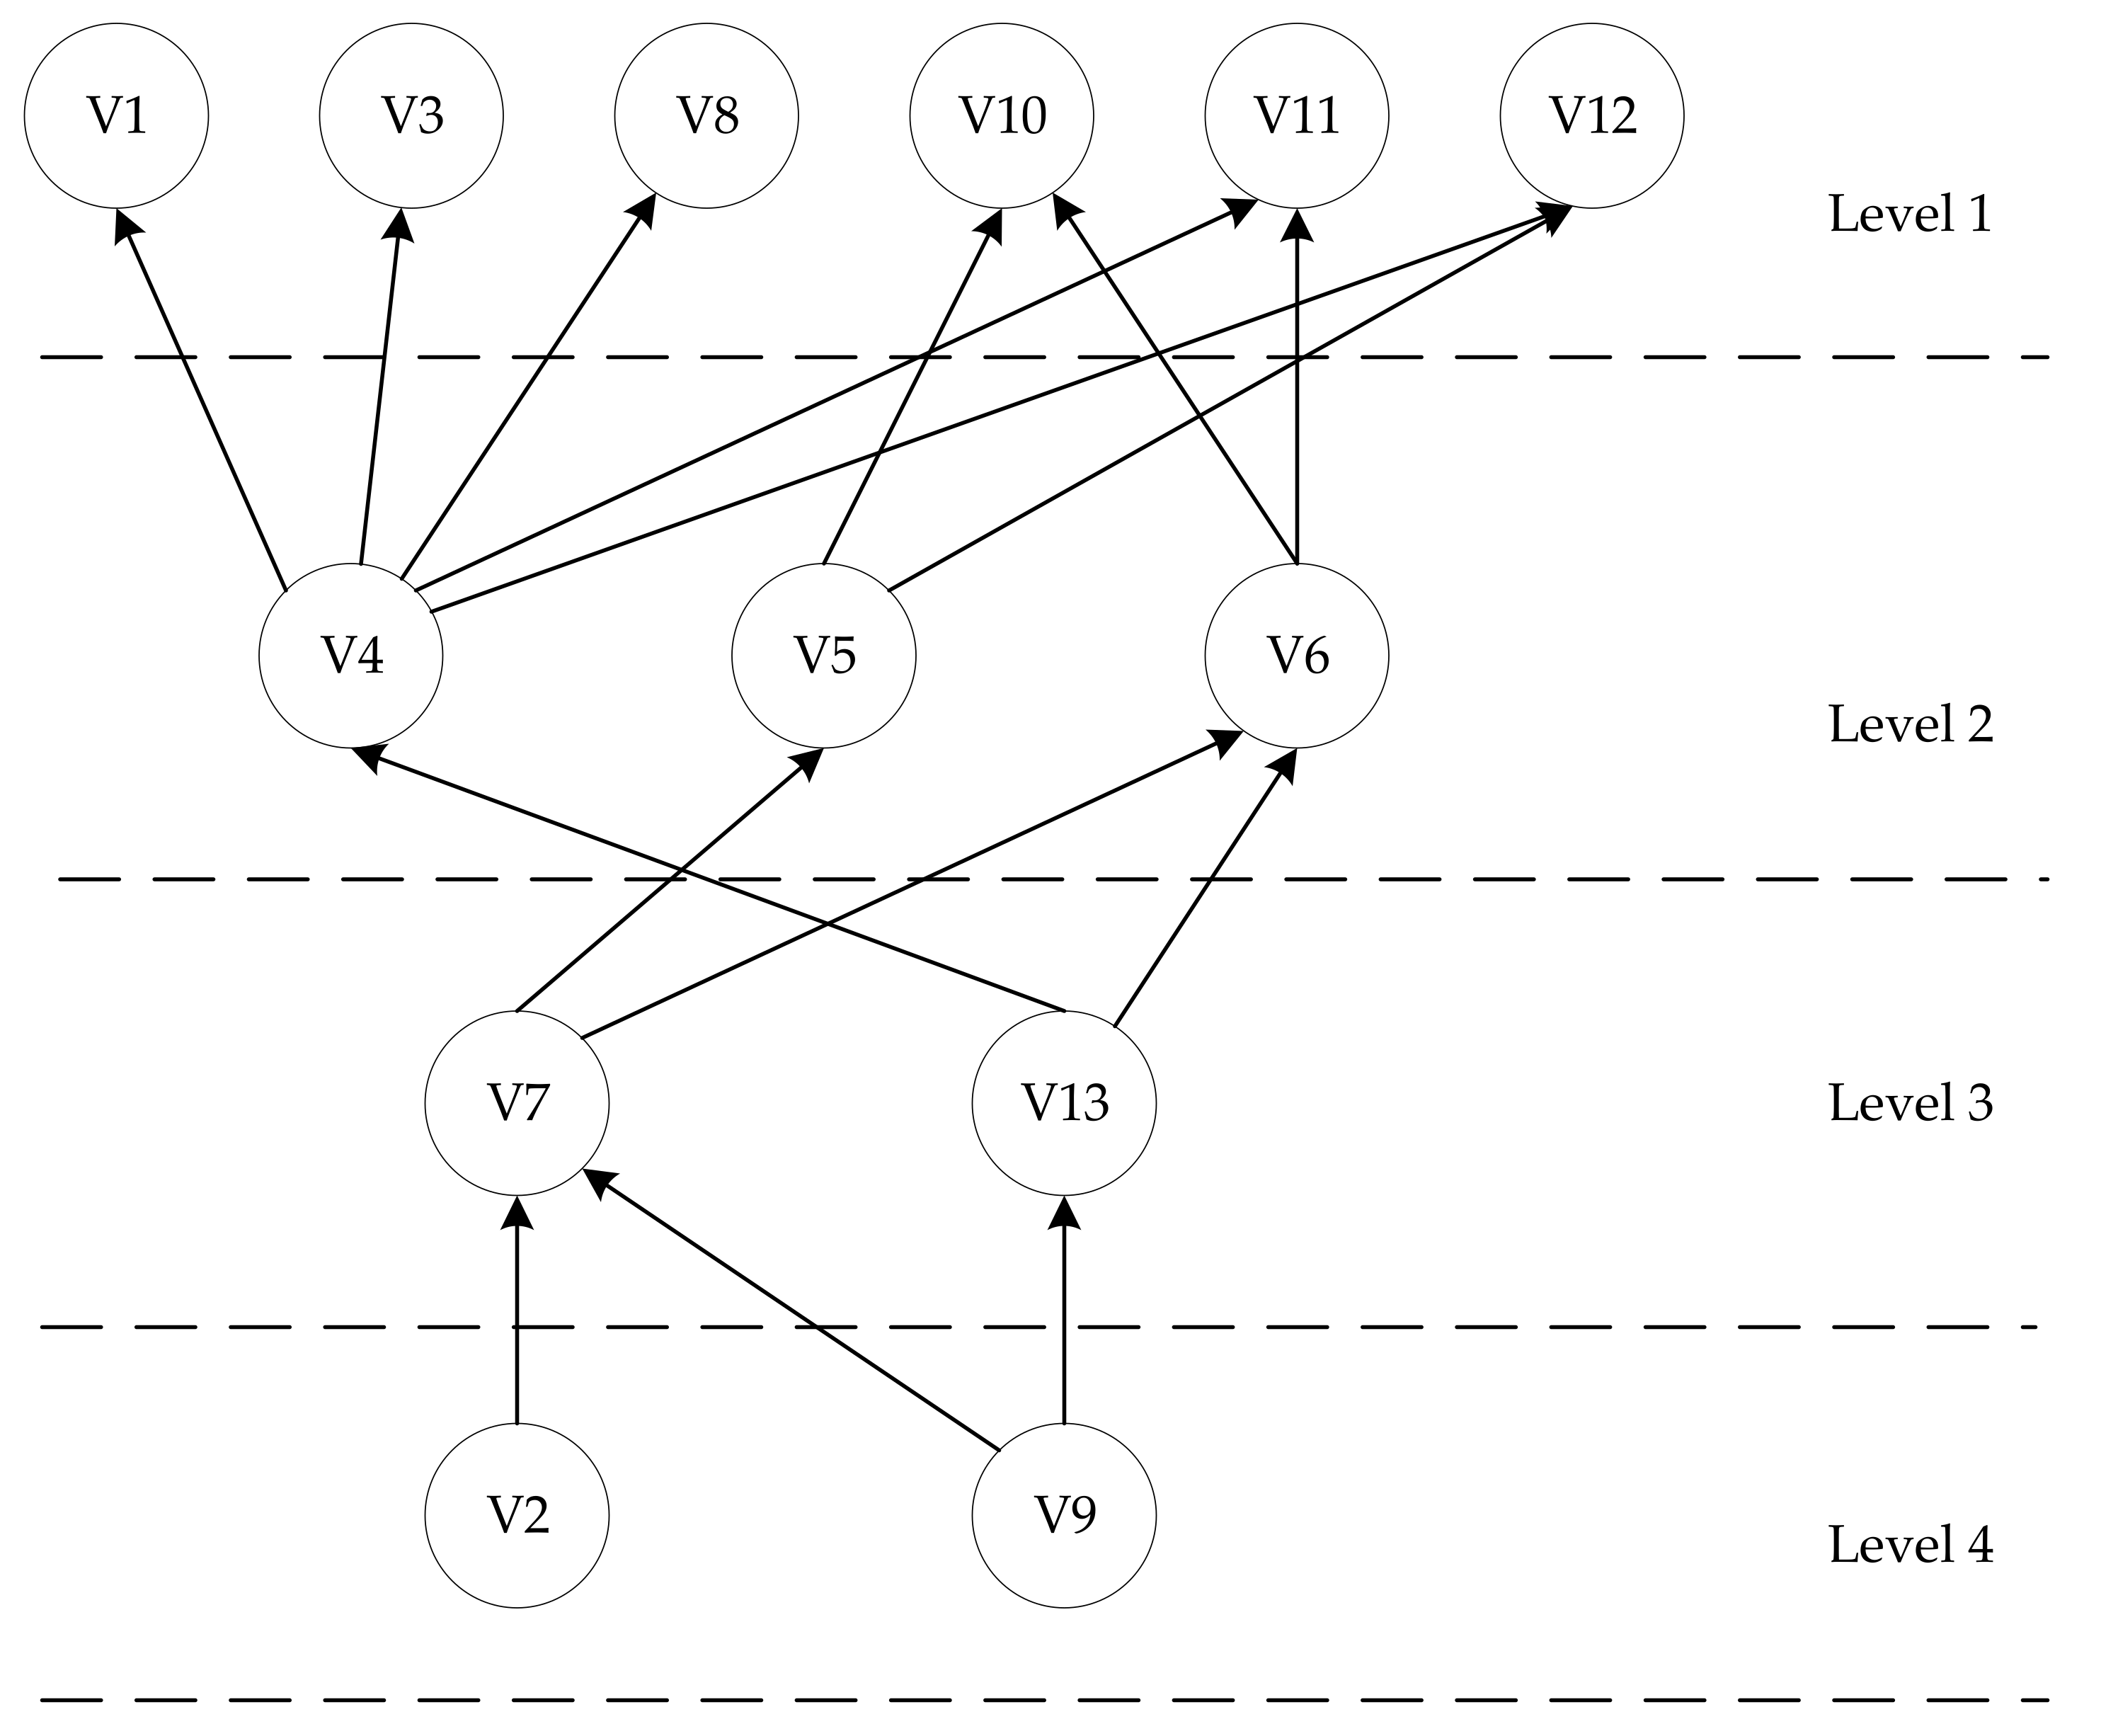
According to the reachable matrix M and Equations (3) and (4), the antecedent set and the reachability set are determined, and then the inter-level division is performed. The solution process of the inter-level division is illustrated in Table 4 as an example. From Table 4, we can extract the level of infrastructure investment (V1), social security (V3), resource allocation capacity (V8), weather forecast profile (V10), flood resource recovery (V11), and land use (V12) as urban flood resilience factors of the first layer of the structural model. In the same way, the division between levels is continued, and finally, the structure model is established according to the reachable matrix arranged between the levels, as shown in Figure 4.
As can be seen from the ISM model, the 13 indicators of the model can be divided into 4 levels. Level 1 represents direct impact indicators, where the level of infrastructure investment directly affects the availability, breadth, and accessibility of resources. Level 2 and level 3 are defined as indirect impact levels, indicating lesser influence, and including environmentally sensitive areas (V4), protection of water resources (V5), water distribution (i.e., precipitation) (V6), flood control plans (V7), and the level of public resources (V13). These factors play the role of linking the preceding and the following factors, so strengthening of the management of the intermediate and indirect factors is essential. From a deeper perspective, the lower level is defined as the fundamental impact level, which is the most basic and objective index of a city’s flood resilience, including rescue capabilities and capacity (V2) and reasonable spatial planning (V9). Spatial planning is considered to be an important way to improve the flood resilience of cities. The explanatory structure model roughly analyzes the influence relationship among the indicators from the qualitative point of view, so that the primary, secondary, and weighty relationship among the indicators can be shown intuitively.
3.3. ANP Model of Urban Flood Resilience
Based on the results of the ISM model in the previous section, the ANP network structure model of urban flood resistance was proposed and studied. The network analytic hierarchy process (ANP) is a new decision-making method developed on the basis of the analytic hierarchy process (AHP). Because of the network structure, the calculation method of ANP is very complicated, and it is difficult to apply the ANP model to the practical decision-making problem without the help of software. The Super Decision (SD) software successfully programmed the calculation of ANP based on the ANP theory. Super Decision is a decision-making software dedicated to network analysis. It has powerful functions and can create complex system models.
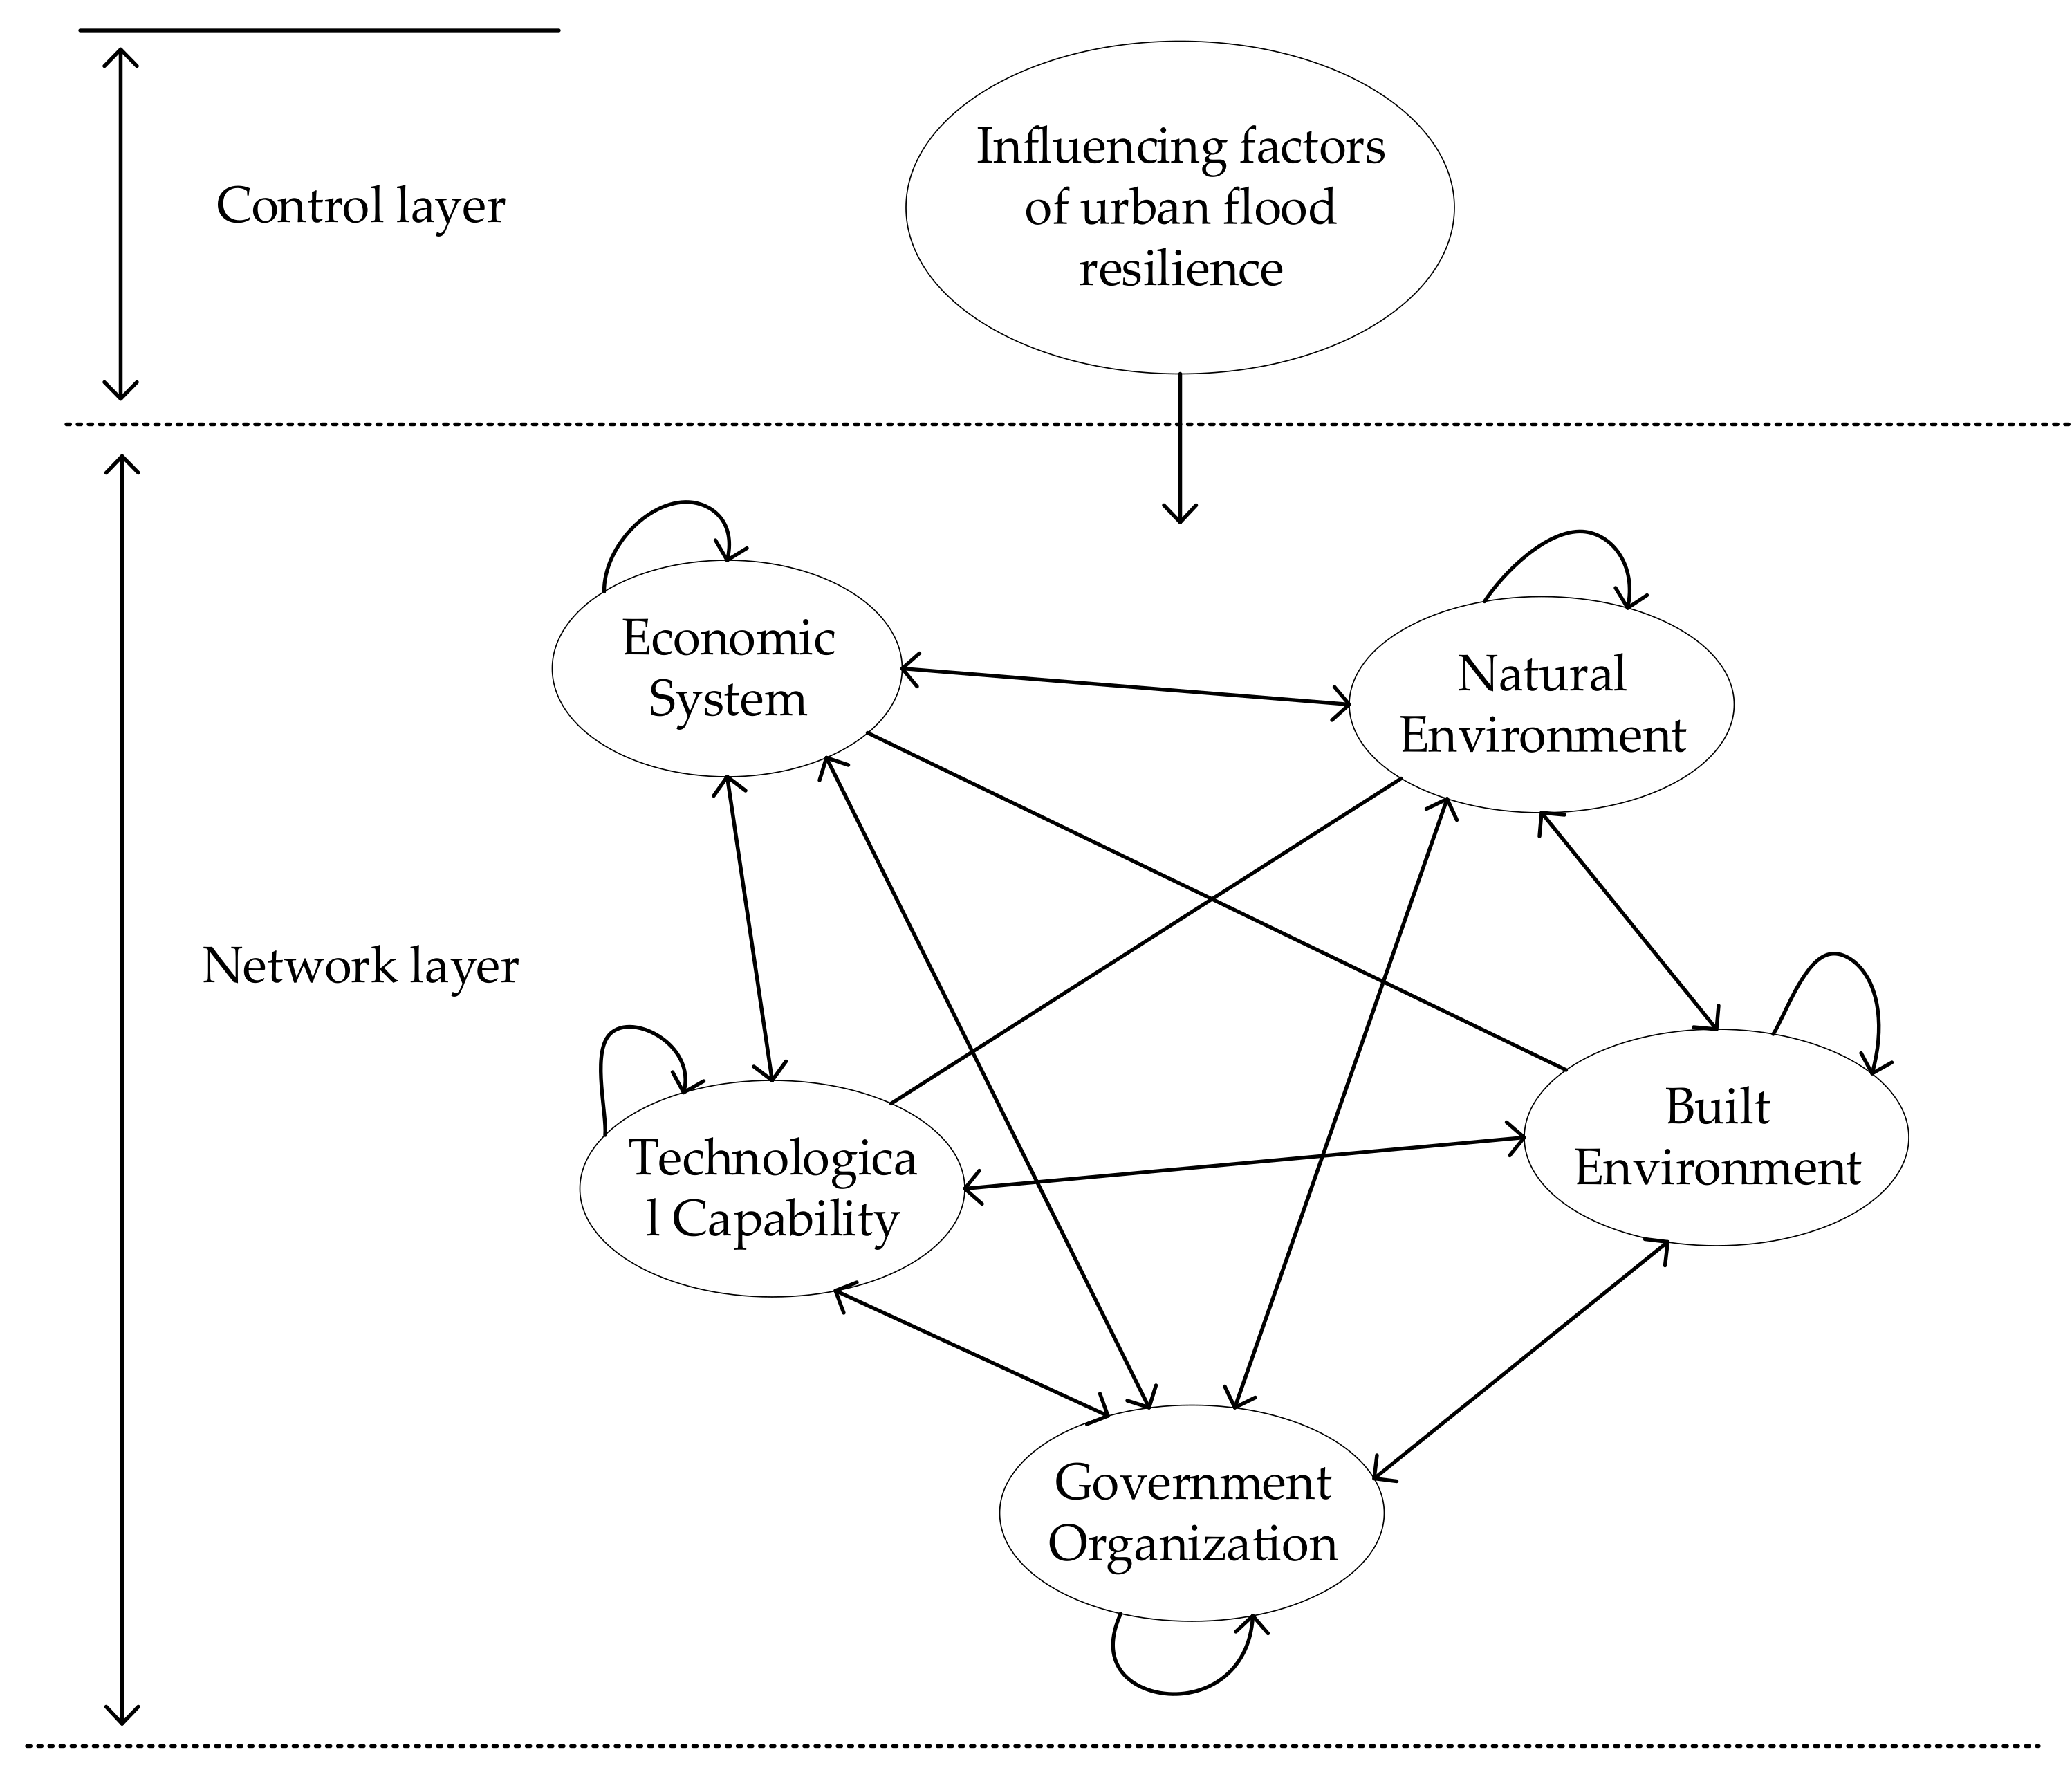
The ANP method was used to analyze the weights of flood resilience indicators in Wuhan, Nanjing, and Hefei, separately, and to comprehensively consider the interaction between the indicators in order to obtain the priority of urban flood resilience indicators in each location. The determined indicators and their relationships were entered into the Super Decision (SD) software to form a network structure diagram, as shown in Figure 5. The circular arrows indicate the mutual influence relationships within the indicators, and the direct arrows indicate the mutual influence relationships between the indicator groups. The flood resilience system indicators and their interdependence were then calculated for each city. Based on the established ANP model of urban flood elasticity influencing factors, combined with Formulas (5)–(7) and the analysis process of the ANP model, the SD software was used to find the weightless supermatrix, weighted supermatrix, and finally to draw the limit hypermatrix to get the weight of each index.
Before calculating the weightless supermatrix, a judgment matrix should be constructed. After consulting experts, the judgment matrix for the pairwise comparison of each indicator was developed, and these judgments were entered into the SD software to calculate the weightless supermatrix of the three city indicators (as shown in Appendix A). The column is a sorting weight based on the element. If there is no effect, the value is 0. Finally, according to the extreme supermatrix (see Appendix B), the overall normalized weights of the evaluation indicators of Wuhan, Nanjing, and Hefei were obtained, as shown in Table 5, and the comparison of the resilience indicators in the cities is shown in Figure 6.
3.4. Results and Analysis
The analysis revealed that rescue capability (V2) was undoubtedly the most important index for the three cities. Urban rescue capability is one of the backbones of the city’s prevention and response to emergencies, and it is also an important part of urban emergency management. It is of great significance for enhancing the overall strength of the city and ensuring sustainable development. Improving urban rescue capabilities is a top priority for protecting the lives of community members. If the rescue capacity is not up to the required level, the intensity of even small flooding can bring about great damage to a city.
In addition, for Wuhan, water distribution (V6), environmentally vulnerable areas (V4), water resource protection (V5) and flood resource recovery (V11) have important effects on flood resilience. The water area of Wuhan City accounts for 26.1% of the main city, and the water area of Nanjing accounts for 11.4% of the main city. The waters of Hefei City are basically within Chaohu Lake, and its general public expenditures are also far behind those of Wuhan and Nanjing. A comparison of the data between Wuhan, Nanjing, and Hefei reveals the differences in the area of water coverage and the direction of general public expenditure. The abundance of water resources in Wuhan is extremely important to its own development advantages. Wuhan has more water areas and is located in an important position on the Yangtze River. Rainstorm rapids or flooding of rivers and lakes can cause floods, so these indicators are particularly important. Wuhan’s GDP and general public budget are both at the leading level of these three cities. Therefore, the capital-related basic investment (V1) has a relatively mature ability to deal with risks, and the levels of social security (V3) and public resources (V13) are also relatively mature. In addition, the prevention and control plan (V7) is relatively well-developed, so its importance is relatively low compared to natural factors. Compared with Nanjing in terms of population density and area, Wuhan has a relatively uniform population distribution and relatively good spatial planning. Therefore, indicators of urban planning, such as V9 and V12, are of lower importance in the face of flooding.
Nanjing is densely populated, its water area is sparse, and the built-up area is relatively small. Therefore, the overall planning of Nanjing (V9, V12) is extremely important when floods occur. Although its water area is less than that of Wuhan, Nanjing also belongs to a higher level, so the indexes of water natural factors (V4, V6, V5, V11) also belong to a more important level. The GDP of Nanjing has always been at the leading level in China, its ability to deal with risks is relatively mature, and various prevention and control schemes of public resources are relatively strong. Therefore, the weights of V1, V13, V8, V3, V7, and V10 are relatively small, and their influences on the flood resilience of Nanjing are relatively low.
Compared with Wuhan and Nanjing, the infrastructure (V1) and public resources levels (V13) of Hefei account for a larger weight. This is due to the infrastructure and public resources of Hefei being relatively poor, so the city is prone to greater damages when flooding occurs; hence, greater attention is paid to these issues. Following this, V8, V3, V9, V6, and V11 have a relatively large weight, because the water area in Hefei is small, and when the flood comes, the losses caused by these natural factors is relatively small compared with the damage to infrastructure. Hefei is a first-tier city in China and its GDP is smaller than that of Wuhan and Nanjing, but it is also at the forefront of the country. Therefore, its flood prevention plan (V7) is relatively complete and has a certain ability to resist floods.
4. Discussion
This study determined the evaluation index system of urban flood resilience and established an evaluation model to evaluate the flood resilience of the three cities of Wuhan, Nanjing, and Hefei. Through the analysis, it was found that the rescue capability (V2) plays an important role in the flood events. Water distribution and protection of water resources also have a major impact on Wuhan’s flood resilience. For the city of Nanjing, reasonable spatial planning and land use are more important. In Hefei, the level of investment in infrastructure and the level of public resources occupy relatively important positions, which have a greater impact on the resilience of urban floods.
In previous studies, some scholars also evaluated the flood resilience of three cities [17]. Liu et al. (2018) established an evaluation index system based on stimulus, sensitivity, and adaptability, and conducted an analysis of flood resilience in Suzhou, Wuxi, and Changzhou. Compared with previous research, this article is a slight improvement. It not only evaluates the city’s flood resilience, but also analyzes the priority of indicators based on the actual conditions of Wuhan, Nanjing, and Hefei.
This study also has certain shortcomings. In the analysis process, the article combined two model methods, namely, the interpretation structure model and the network analytic hierarchy process, and thus built the ISM-ANP model. Some scholars have used this model to conduct other studies to prove the usability of this model [36,41]. However, this method has certain limitations, that is, the data are subjective. In future research, the model can be optimized, and a combination of subjective and objective methods can be used to improve the subjectivity of the model. In addition, although this research takes urban flood resilience as the research theme, it does not belong to the traditional research paradigm based on the perspective of engineering technology. Based on quantitative research and practical application feasibility considerations, this study uses representative indicators to develop an innovative and robust process for assessing urban flood resilience. However, due to the complex structure of the urban flood system and many influencing factors, it is difficult to fully analyze the resilience of the urban flood system. The application of urban flood resilience assessment methods in the world is still at the theoretical and qualitative level. The selection of indicators can only refer to the previous research literature, and a more comprehensive and systematic evaluation of the quantitative indicators and methods of urban infrastructure flexibility is also needed. The urban flood resilience assessment system constructed in this paper can provide a reference for other regions to carry out urban flood resilience assessments.
Research on resilience to urban flooding is still in its infancy, and it is essential to further increase the quantitative assessment of urban flood resilience as development and construction continues to take place. This will also be indispensable information in the subsequent implementation of spatial planning processes that are sympathetic to maintaining and improving flood resilience.
5. Conclusions
In this study we considered 13 indicators of urban flood resilience, namely, the level of infrastructure investment (V1), rescue capabilities (V2), social security (V3), environmentally sensitive area (V4), water resource protection (V5), water distribution (V6), the flood control plan (V7), resource allocation capacity (V8), rational spatial planning (V9), weather forecast overview (V10), flood resource recovery (V11), spatial structure of land use (V12), and public resource level (V13).This research investigated the resilience of Wuhan, Nanjing, and Hefei to urban floods and proposed a new evaluation framework. The ISM was used to divide the selected indicators between levels to establish a hierarchical structure diagram of urban flood resilience; on this basis, the network analysis method was used to analyze the index weights of Wuhan, Nanjing, and Hefei. This evaluation method can also be used in the group decision-making method in urban flood management to determine the interdependence between various indicators. Based on the analysis, the conclusions that can be drawn from this study are as follows:
- This study determined an indicator system for evaluating urban flood resilience and constructed an evaluation framework based on the ISM-ANP method. Using the ISM analysis method, the evaluation index system was divided into four layers, and V1, V3, V8, V10, V11, and V12 were determined as direct surface factors; in other words, these indicators will directly affect urban flood resilience and are classified in the upper layer of the ISM hierarchical structure. Factors V4, V5, and V6 and V7 and V13 were on the second and third layers, respectively, and identified as intermediate indirect factors. V2 and V9 were defined as deep-level fundamental factors, placed on the fourth layer of the ISM structure, and are the fundamental factors that affect the city’s ability to withstand floods.
- This study combines two model methods, namely, the interpretation structure model (ISM) and the analytic network process (ANP), and enriches the research content in the field of flood resilience. When the ISM method is applied, it is necessary to find experts in relevant fields to compare and judge the relationship between the selected indicators. On this basis, the ANP method uses expert survey methods to get the judgment matrix among indicators. Finally, the Super Decision software is used to get the weight of each indicator. However, because the ISM-ANP model relies on the personal experience, knowledge, and professional judgment of the decision maker, there is a certain degree of subjectivity. Therefore, when the model is actually used, the results may be different due to the difference in the personal level of the decision maker. Using expert groups to judge the relationship between factors may be limited by personal values or experience and knowledge. Different experts may have differences. It is more cumbersome to synthesize expert opinions, which also affect the final model analysis results.
- In this study, three cities in the Yangtze River Basin, namely Wuhan, Nanjing, and Hefei, were selected to quantify the interdependence among the evaluation indicators of urban flood resilience. ANP was used to calculate the weights and priority of the indicators among the different cities. This analysis process can be used as a new evaluation framework that can promote the use of multiple indicators to evaluate urban flood resilience.
- Moreover, through calculation and analysis, it was found that the rescue capacity (V2) plays a leading role in the flood resilience of the three cities, with the highest weight and the largest influence. For Wuhan, water distribution and water resource protection also have a major impact on flood resilience. For the city of Nanjing, reasonable spatial planning and land use are more important, and its water distribution also has a certain influence on the flood resilience. In Hefei, the level of infrastructure investment and public resources occupy relatively important positions, which have a greater impact on urban flood resilience.
Author Contributions
All authors were involved in the production and writing of the manuscript. Investigation, L.Z.; Methodology, J.C.; Writing—original draft, W.X.; Writing—review and editing, D.P. All authors have read and agreed to the published version of the manuscript.
Funding
The research was funded by the National Natural Science Foundation of China [grant number, 71503194]; the Youth Foundation of Education Department of Hubei Province [grant number, B2020312].
Institutional Review Board Statement
Not applicable.
Informed Consent Statement
Informed consent was obtained from all subjects involved in the study.
Data Availability Statement
Some or all data, models, or code that support the findings of this study are available from the corresponding author upon reasonable request.
Conflicts of Interest
The authors declare that they have no conflict of interest.
Appendix A. Unweighted Supermatrix for Compatibility before Convergence of Dimensions
| V1 | V2 | V3 | V4 | V5 | V6 | V7 | V8 | V9 | V10 | V11 | V12 | V13 | ||
| Wuhan | V1 | 0.071 | 0.066 | 0.064 | 0.062 | 0.066 | 0.065 | 0.069 | 0.061 | 0.058 | 0.052 | 0.051 | 0.055 | 0.056 |
| V2 | 0.248 | 0.243 | 0.234 | 0.236 | 0.241 | 0.234 | 0.267 | 0.234 | 0.255 | 0.262 | 0.264 | 0.258 | 0.255 | |
| V3 | 0.061 | 0.059 | 0.058 | 0.058 | 0.057 | 0.058 | 0.062 | 0.056 | 0.053 | 0.049 | 0.047 | 0.047 | 0.048 | |
| V4 | 0.122 | 0.115 | 0.115 | 0.116 | 0.116 | 0.115 | 0.123 | 0.110 | 0.108 | 0.123 | 0.120 | 0.122 | 0.122 | |
| V5 | 0.041 | 0.086 | 0.087 | 0.088 | 0.086 | 0.088 | 0.009 | 0.084 | 0.081 | 0.073 | 0.069 | 0.070 | 0.070 | |
| V6 | 0.131 | 0.126 | 0.125 | 0.125 | 0.126 | 0.125 | 0.136 | 0.148 | 0.143 | 0.174 | 0.203 | 0.191 | 0.193 | |
| V7 | 0.042 | 0.039 | 0.045 | 0.040 | 0.040 | 0.041 | 0.044 | 0.044 | 0.044 | 0.034 | 0.032 | 0.033 | 0.033 | |
| V8 | 0.050 | 0.047 | 0.049 | 0.049 | 0.048 | 0.049 | 0.053 | 0.048 | 0.048 | 0.042 | 0.038 | 0.039 | 0.039 | |
| V9 | 0.029 | 0.028 | 0.028 | 0.028 | 0.028 | 0.028 | 0.030 | 0.027 | 0.027 | 0.024 | 0.023 | 0.025 | 0.024 | |
| V10 | 0.041 | 0.038 | 0.039 | 0.039 | 0.038 | 0.039 | 0.041 | 0.037 | 0.036 | 0.032 | 0.031 | 0.032 | 0.032 | |
| V11 | 0.082 | 0.078 | 0.079 | 0.078 | 0.076 | 0.079 | 0.084 | 0.073 | 0.074 | 0.065 | 0.061 | 0.064 | 0.065 | |
| V12 | 0.027 | 0.026 | 0.026 | 0.026 | 0.026 | 0.026 | 0.028 | 0.027 | 0.025 | 0.022 | 0.020 | 0.020 | 0.021 | |
| V13 | 0.054 | 0.049 | 0.051 | 0.053 | 0.052 | 0.054 | 0.054 | 0.053 | 0.047 | 0.046 | 0.040 | 0.043 | 0.043 | |
| Nanjing | V1 | 0.051 | 0.055 | 0.048 | 0.057 | 0.053 | 0.056 | 0.053 | 0.053 | 0.056 | 0.053 | 0.053 | 0.055 | 0.053 |
| V2 | 0.290 | 0.205 | 0.279 | 0.205 | 0.222 | 0.222 | 0.222 | 0.222 | 0.222 | 0.224 | 0.222 | 0.222 | 0.215 | |
| V3 | 0.033 | 0.037 | 0.035 | 0.036 | 0.036 | 0.036 | 0.036 | 0.036 | 0.036 | 0.036 | 0.036 | 0.036 | 0.035 | |
| V4 | 0.083 | 0.094 | 0.086 | 0.094 | 0.092 | 0.092 | 0.092 | 0.092 | 0.092 | 0.092 | 0.092 | 0.092 | 0.090 | |
| V5 | 0.056 | 0.064 | 0.059 | 0.064 | 0.063 | 0.063 | 0.063 | 0.063 | 0.063 | 0.062 | 0.063 | 0.062 | 0.061 | |
| V6 | 0.066 | 0.077 | 0.070 | 0.077 | 0.075 | 0.074 | 0.075 | 0.075 | 0.074 | 0.075 | 0.075 | 0.075 | 0.073 | |
| V7 | 0.029 | 0.033 | 0.030 | 0.033 | 0.032 | 0.032 | 0.032 | 0.032 | 0.032 | 0.032 | 0.032 | 0.032 | 0.031 | |
| V8 | 0.049 | 0.047 | 0.042 | 0.046 | 0.046 | 0.045 | 0.046 | 0.046 | 0.045 | 0.046 | 0.046 | 0.045 | 0.044 | |
| V9 | 0.113 | 0.128 | 0.116 | 0.128 | 0.125 | 0.125 | 0.125 | 0.125 | 0.125 | 0.125 | 0.125 | 0.125 | 0.122 | |
| V10 | 0.026 | 0.030 | 0.027 | 0.030 | 0.029 | 0.029 | 0.029 | 0.029 | 0.029 | 0.029 | 0.029 | 0.029 | 0.028 | |
| V11 | 0.054 | 0.061 | 0.056 | 0.061 | 0.060 | 0.060 | 0.060 | 0.060 | 0.060 | 0.060 | 0.060 | 0.060 | 0.058 | |
| V12 | 0.103 | 0.117 | 0.106 | 0.117 | 0.114 | 0.114 | 0.114 | 0.114 | 0.114 | 0.114 | 0.114 | 0.114 | 0.140 | |
| V13 | 0.046 | 0.052 | 0.047 | 0.052 | 0.051 | 0.051 | 0.051 | 0.051 | 0.051 | 0.051 | 0.051 | 0.051 | 0.050 | |
| Hefei | V1 | 0.206 | 0.113 | 0.152 | 0.169 | 0.186 | 0.170 | 0.144 | 0.154 | 0.172 | 0.171 | 0.212 | 0.142 | 0.190 |
| V2 | 0.245 | 0.312 | 0.271 | 0.279 | 0.306 | 0.268 | 0.282 | 0.290 | 0.256 | 0.297 | 0.254 | 0.257 | 0.262 | |
| V3 | 0.063 | 0.069 | 0.069 | 0.062 | 0.060 | 0.065 | 0.070 | 0.066 | 0.067 | 0.061 | 0.063 | 0.073 | 0.062 | |
| V4 | 0.032 | 0.037 | 0.035 | 0.036 | 0.031 | 0.033 | 0.037 | 0.033 | 0.034 | 0.032 | 0.033 | 0.037 | 0.033 | |
| V5 | 0.028 | 0.031 | 0.029 | 0.027 | 0.025 | 0.027 | 0.029 | 0.027 | 0.028 | 0.025 | 0.026 | 0.030 | 0.026 | |
| V6 | 0.050 | 0.054 | 0.053 | 0.054 | 0.046 | 0.052 | 0.055 | 0.051 | 0.053 | 0.049 | 0.050 | 0.059 | 0.048 | |
| V7 | 0.036 | 0.042 | 0.039 | 0.037 | 0.034 | 0.039 | 0.041 | 0.037 | 0.038 | 0.035 | 0.036 | 0.042 | 0.035 | |
| V8 | 0.070 | 0.082 | 0.075 | 0.071 | 0.067 | 0.073 | 0.078 | 0.074 | 0.075 | 0.071 | 0.071 | 0.080 | 0.069 | |
| V9 | 0.056 | 0.063 | 0.060 | 0.058 | 0.053 | 0.058 | 0.064 | 0.058 | 0.061 | 0.056 | 0.057 | 0.066 | 0.055 | |
| V10 | 0.017 | 0.018 | 0.019 | 0.020 | 0.016 | 0.018 | 0.020 | 0.018 | 0.019 | 0.017 | 0.017 | 0.019 | 0.017 | |
| V11 | 0.043 | 0.048 | 0.046 | 0.046 | 0.040 | 0.044 | 0.048 | 0.046 | 0.046 | 0.042 | 0.042 | 0.049 | 0.042 | |
| V12 | 0.022 | 0.024 | 0.023 | 0.022 | 0.021 | 0.023 | 0.023 | 0.021 | 0.022 | 0.021 | 0.021 | 0.024 | 0.020 | |
| V13 | 0.134 | 0.106 | 0.130 | 0.120 | 0.113 | 0.131 | 0.110 | 0.124 | 0.128 | 0.122 | 0.119 | 0.120 | 0.140 |
Appendix B. Limit Supermatrix for Compatibility before Convergence of Dimensions
| V1 | V2 | V3 | V4 | V5 | V6 | V7 | V8 | V9 | V10 | V11 | V12 | V13 | ||
| Wuhan | V1 | 0.063 | 0.063 | 0.063 | 0.063 | 0.063 | 0.063 | 0.063 | 0.063 | 0.063 | 0.063 | 0.063 | 0.063 | 0.063 |
| V2 | 0.245 | 0.245 | 0.245 | 0.245 | 0.245 | 0.245 | 0.245 | 0.245 | 0.245 | 0.245 | 0.245 | 0.245 | 0.245 | |
| V3 | 0.056 | 0.056 | 0.056 | 0.056 | 0.056 | 0.056 | 0.056 | 0.056 | 0.056 | 0.056 | 0.056 | 0.056 | 0.056 | |
| V4 | 0.117 | 0.117 | 0.117 | 0.117 | 0.117 | 0.117 | 0.117 | 0.117 | 0.117 | 0.117 | 0.117 | 0.117 | 0.117 | |
| V5 | 0.078 | 0.078 | 0.078 | 0.078 | 0.078 | 0.078 | 0.078 | 0.078 | 0.078 | 0.078 | 0.078 | 0.078 | 0.078 | |
| V6 | 0.140 | 0.140 | 0.140 | 0.140 | 0.140 | 0.140 | 0.140 | 0.140 | 0.140 | 0.140 | 0.140 | 0.140 | 0.140 | |
| V7 | 0.039 | 0.039 | 0.039 | 0.039 | 0.039 | 0.039 | 0.039 | 0.039 | 0.039 | 0.039 | 0.039 | 0.039 | 0.039 | |
| V8 | 0.047 | 0.047 | 0.047 | 0.047 | 0.047 | 0.047 | 0.047 | 0.047 | 0.047 | 0.047 | 0.047 | 0.047 | 0.047 | |
| V9 | 0.027 | 0.027 | 0.027 | 0.027 | 0.027 | 0.027 | 0.027 | 0.027 | 0.027 | 0.027 | 0.027 | 0.027 | 0.027 | |
| V10 | 0.037 | 0.037 | 0.037 | 0.037 | 0.037 | 0.037 | 0.037 | 0.037 | 0.037 | 0.037 | 0.037 | 0.037 | 0.037 | |
| V11 | 0.075 | 0.075 | 0.075 | 0.075 | 0.075 | 0.075 | 0.075 | 0.075 | 0.075 | 0.075 | 0.075 | 0.075 | 0.075 | |
| V12 | 0.025 | 0.025 | 0.025 | 0.025 | 0.025 | 0.025 | 0.025 | 0.025 | 0.025 | 0.025 | 0.025 | 0.025 | 0.025 | |
| V13 | 0.050 | 0.050 | 0.050 | 0.050 | 0.050 | 0.050 | 0.050 | 0.050 | 0.050 | 0.050 | 0.050 | 0.050 | 0.050 | |
| Nanjing | V1 | 0.054 | 0.054 | 0.054 | 0.054 | 0.054 | 0.054 | 0.054 | 0.054 | 0.054 | 0.054 | 0.054 | 0.054 | 0.054 |
| V2 | 0.222 | 0.222 | 0.222 | 0.222 | 0.222 | 0.222 | 0.222 | 0.222 | 0.222 | 0.222 | 0.222 | 0.222 | 0.222 | |
| V3 | 0.036 | 0.036 | 0.036 | 0.036 | 0.036 | 0.036 | 0.036 | 0.036 | 0.036 | 0.036 | 0.036 | 0.036 | 0.036 | |
| V4 | 0.092 | 0.092 | 0.092 | 0.092 | 0.092 | 0.092 | 0.092 | 0.092 | 0.092 | 0.092 | 0.092 | 0.092 | 0.092 | |
| V5 | 0.063 | 0.063 | 0.063 | 0.063 | 0.063 | 0.063 | 0.063 | 0.063 | 0.063 | 0.063 | 0.063 | 0.063 | 0.063 | |
| V6 | 0.075 | 0.075 | 0.075 | 0.075 | 0.075 | 0.075 | 0.075 | 0.075 | 0.075 | 0.075 | 0.075 | 0.075 | 0.075 | |
| V7 | 0.032 | 0.032 | 0.032 | 0.032 | 0.032 | 0.032 | 0.032 | 0.032 | 0.032 | 0.032 | 0.032 | 0.032 | 0.032 | |
| V8 | 0.046 | 0.046 | 0.046 | 0.046 | 0.046 | 0.046 | 0.046 | 0.046 | 0.046 | 0.046 | 0.046 | 0.046 | 0.046 | |
| V9 | 0.125 | 0.125 | 0.125 | 0.125 | 0.125 | 0.125 | 0.125 | 0.125 | 0.125 | 0.125 | 0.125 | 0.125 | 0.125 | |
| V10 | 0.029 | 0.029 | 0.029 | 0.029 | 0.029 | 0.029 | 0.029 | 0.029 | 0.029 | 0.029 | 0.029 | 0.029 | 0.029 | |
| V11 | 0.060 | 0.060 | 0.060 | 0.060 | 0.060 | 0.060 | 0.060 | 0.060 | 0.060 | 0.060 | 0.060 | 0.060 | 0.060 | |
| V12 | 0.116 | 0.116 | 0.116 | 0.116 | 0.116 | 0.116 | 0.116 | 0.116 | 0.116 | 0.116 | 0.116 | 0.116 | 0.116 | |
| V13 | 0.051 | 0.051 | 0.051 | 0.051 | 0.051 | 0.051 | 0.051 | 0.051 | 0.051 | 0.051 | 0.051 | 0.051 | 0.051 | |
| Hefei | V1 | 0.161 | 0.161 | 0.161 | 0.161 | 0.161 | 0.161 | 0.161 | 0.161 | 0.161 | 0.161 | 0.161 | 0.161 | 0.161 |
| V2 | 0.279 | 0.279 | 0.279 | 0.279 | 0.279 | 0.279 | 0.279 | 0.279 | 0.279 | 0.279 | 0.279 | 0.279 | 0.279 | |
| V3 | 0.066 | 0.066 | 0.066 | 0.066 | 0.066 | 0.066 | 0.066 | 0.066 | 0.066 | 0.066 | 0.066 | 0.066 | 0.066 | |
| V4 | 0.034 | 0.034 | 0.034 | 0.034 | 0.034 | 0.034 | 0.034 | 0.034 | 0.034 | 0.034 | 0.034 | 0.034 | 0.034 | |
| V5 | 0.028 | 0.028 | 0.028 | 0.028 | 0.028 | 0.028 | 0.028 | 0.028 | 0.028 | 0.028 | 0.028 | 0.028 | 0.028 | |
| V6 | 0.052 | 0.052 | 0.052 | 0.052 | 0.052 | 0.052 | 0.052 | 0.052 | 0.052 | 0.052 | 0.052 | 0.052 | 0.052 | |
| V7 | 0.038 | 0.038 | 0.038 | 0.038 | 0.038 | 0.038 | 0.038 | 0.038 | 0.038 | 0.038 | 0.038 | 0.038 | 0.038 | |
| V8 | 0.075 | 0.075 | 0.075 | 0.075 | 0.075 | 0.075 | 0.075 | 0.075 | 0.075 | 0.075 | 0.075 | 0.075 | 0.075 | |
| V9 | 0.059 | 0.059 | 0.059 | 0.059 | 0.059 | 0.059 | 0.059 | 0.059 | 0.059 | 0.059 | 0.059 | 0.059 | 0.059 | |
| V10 | 0.018 | 0.018 | 0.018 | 0.018 | 0.018 | 0.018 | 0.018 | 0.018 | 0.018 | 0.018 | 0.018 | 0.018 | 0.018 | |
| V11 | 0.045 | 0.045 | 0.045 | 0.045 | 0.045 | 0.045 | 0.045 | 0.045 | 0.045 | 0.045 | 0.045 | 0.045 | 0.045 | |
| V12 | 0.022 | 0.022 | 0.022 | 0.022 | 0.022 | 0.022 | 0.022 | 0.022 | 0.022 | 0.022 | 0.022 | 0.022 | 0.022 | |
| V13 | 0.122 | 0.122 | 0.122 | 0.122 | 0.122 | 0.122 | 0.122 | 0.122 | 0.122 | 0.122 | 0.122 | 0.122 | 0.122 |
Appendix C. Brief Description of Profiles of the Experts
| Characteristics | n | % | ||
| Experts (n = 8) | Experience | Up to 5 years | 3 | 37.5 |
| 5–10 years | 2 | 25 | ||
| More than 10 years | 3 | 37.5 | ||
| Expertise in | Urban resilience | 2 | 25 | |
| Flood Management | 3 | 37.5 | ||
| Environment, health, and safety | 2 | 25 | ||
| Job position | Academician | 3 | 37.5 | |
| Urban planner | 2 | 25 | ||
| Municipal managers | 3 | 37.5 | ||
Appendix D. Questionnaire for Expert Consultation on Urban Flood Resilience Evaluation Index
Dear Experts:
We are conducting a multidimensional evaluation study on the resilience of urban flood in Wuhan, Nanjing, and Hefei. We sincerely invite you to be a consultant on the subject of “Urban Flood Resilience Evaluation Index”. Please provide valuable opinions and suggestions for the selection of the index system during your busy schedule. The research group has selected the preliminary indicators through literature induction. The main content of this expert consultation is to evaluate and score the primary indicators in terms of importance.
The purpose of this research is to evaluate the resilience of urban floods, select the three cities of Wuhan, Nanjing, and Hefei for empirical research, and analyze the selected research areas based on the evaluation results and provide reasonable policy recommendations.
If you reply within 10 days, we will be very grateful!
All the members of the research group.
2021 February 21
Directions for the Application Form:
- The following is the indicator system initially determined in our research. Please rate the importance of the indicators. Each item is divided into 5 levels according to the importance. They are 5 = most important, 4 = very important, 3 = somewhat important, 2. = not important, 1 = least important. Please rate the relative importance of the indicators and tick the corresponding ☐.
- If you think this indicator is not needed, you can mark “delete” in the edit column.
- If you think the description of the indicator is incorrect, please modify it in the content modification column.
- Additional indicators please fill in the blanks.
| Primary Indicators | Primary Indicators | Content Modification |
Significance
5 4 3 2 1 |
| Economic System | The level of infrastructure investment | ☐ ☐ ☐ ☐ ☐ | |
| Rescue capabilities | ☐ ☐ ☐ ☐ ☐ | ||
| Social security | ☐ ☐ ☐ ☐ ☐ | ||
| Natural Environment | Environmentally sensitive area | ☐ ☐ ☐ ☐ ☐ | |
| Water resource protection | ☐ ☐ ☐ ☐ ☐ | ||
| Water distribution | ☐ ☐ ☐ ☐ ☐ | ||
| Government and Organization | The flood control plan | ☐ ☐ ☐ ☐ ☐ | |
| Rational spatial planning | ☐ ☐ ☐ ☐ ☐ | ||
| Technological Capability | Weather Forecast Overview | ☐ ☐ ☐ ☐ ☐ | |
| Flood resource recovery | ☐ ☐ ☐ ☐ ☐ | ||
| Built Environment | Spatial structure of land use | ☐ ☐ ☐ ☐ ☐ | |
| Public resource level | ☐ ☐ ☐ ☐ ☐ |
References
- Laurien, F.; Hochrainer-Stigler, S.; Keating, A.; Campbell, K.; Mechler, R.; Czajkowski, J. A typology of community flood resilience. Reg. Environ. Chang. 2020, 20, 24. [Google Scholar] [CrossRef] [Green Version]
- China Annual Flood and Drought Disaster Report. Available online: http://www.mwr.gov.cn/sj/#tjgb (accessed on 23 February 2021).
- Min, S.K.; Zhang, X.; Zwiers, F.W.; Hegerl, G.C. Human contribution to more-intense precipitation extremes. Nature 2011, 470, 378–381. [Google Scholar] [CrossRef]
- Yin, J.; Gentine, P.; Sha, Z.; Sullivan, S.C.; Guo, S. Large increase in global storm runoff extremes driven by climate and anthropogenic changes. Nat. Commun. 2018, 9, 4389. [Google Scholar] [CrossRef] [PubMed] [Green Version]
- Cutter, S.L.; Burton, C.G.; Emrich, C.T. Disaster Resilience Indicators for Benchmarking Baseline Conditions. J. Homel. Secur. Emerg. Manag. 2010, 7. [Google Scholar] [CrossRef]
- Sun, H.; Cheng, X.; Dai, M. Regional flood disaster resilience evaluation based on analytic network process: A case study of the Chaohu Lake Basin, Anhui Province, China. Nat. Hazards 2016, 82, 39–58. [Google Scholar] [CrossRef]
- Xu, W.; Zhong, M.; Hong, Y.; Lin, K. Enhancing community resilience to urban floods with a network structuring model. Saf. Sci. 2020, 127, 104699. [Google Scholar] [CrossRef]
- Malhi, G.S.; Das, P.; Bell, E.; Mattingly, G.; Mannie, Z. Modelling resilience in adolescence and adversity: A novel framework to inform research and practice. Transl. Psychiatry 2019, 9, 316. [Google Scholar] [CrossRef] [Green Version]
- Batica, J.; Gourbesville, P. Methodology for Flood Resilience Index Development. In Proceedings of the International Conference on Flood Resilience Experiences in Asia & Europe–ICFR, Exeter, UK, 5–7 September 2013. [Google Scholar]
- Liao, K.-H. A Theory on Urban Resilience to Floods—A Basis for Alternative Planning Practices. Ecol. Soc. 2012, 17, 48. [Google Scholar] [CrossRef]
- Walker, B.; Hollin, C.S.; Carpenter, S.R.; Kinzig, A. Resilience, Adaptability and Transformability in Social-ecological Systems. Ecol. Soc. 2004, 14, 1698–1707. [Google Scholar] [CrossRef]
- Allen, M.; Gillespie-Marthaler, L.; Abkowitz, M.; Camp, J. Evaluating flood resilience in rural communities: A case-based assessment of Dyer County, Tennessee. Nat. Hazards 2020, 101, 173–194. [Google Scholar] [CrossRef]
- Yu, K.J.; Xu, T.; Li, D.H.; Wang, C.L. Research progress on resilience of urban water system. Urban Plan. Forum 2015, 1, 75–83. [Google Scholar]
- Cai, J.M.; Guo, H.; Wang, D.G. A Review of Resilient City Studies Abroad. Prog. Geogr. 2012, 31, 1245–1255. [Google Scholar]
- Pearson, J.; Punzo, G.; Mayfield, M.; Brighty, G.; Parsons, A.; Collins, P.; Jeavons, S.; Tagg, A. Flood resilience: Consolidating knowledge between and within critical infrastructure sectors. Environ. Syst. Decis. 2018, 38, 318–329. [Google Scholar] [CrossRef] [Green Version]
- Heinzlef, C.; Becue, V.; Serre, D. Operationalizing urban resilience to floods in embanked territories—Application in Avignon, Provence Alpes Cte d’azur region. Saf. Sci. 2019, 118, 181–193. [Google Scholar] [CrossRef]
- Liu, G.; Yuan, X.M.; Huang, J.; Wang, H.M. Urban flood resilience assessment based on PSR framework—Take the Su-Xi-Chang region as an example. Resour. Dev. Mar. 2018, 34, 593–598. [Google Scholar]
- Adedeji, T.; Proverbs, D.; Xiao, H.; Cobbing, P.; Oladokun, V. Making Birmingham a Flood Resilient City: Challenges and Opportunities. Water 2019, 11, 1699. [Google Scholar] [CrossRef] [Green Version]
- Lima, C.H.; Lall, U.; Troy, T.; Devineni, N. A climate informed model for nonstationary flood risk prediction: Application to Negro River at Manaus, Amazonia. J. Hydrol. 2015, 522, 594–602. [Google Scholar] [CrossRef]
- Lai, C.; Shao, Q.; Chen, X.; Wang, Z.; Zhou, X.; Yang, B.; Zhang, L. Flood risk zoning using a rule mining based on ant colony algorithm. J. Hydrol. 2016, 542, 268–280. [Google Scholar] [CrossRef]
- Koks, E.; Jongman, B.; Husby, T.; Botzen, W. Combining hazard, exposure and social vulnerability to provide lessons for flood risk management. Environ. Sci. Policy 2015, 47, 42–52. [Google Scholar] [CrossRef]
- Frigerio, I.; Amicis, M.D. Mapping social vulnerability to natural hazards in Italy: A suitable tool for risk mitigation strategies. Environ. Sci. Policy 2016, 63, 187–196. [Google Scholar] [CrossRef]
- Evers, M.; Almoradie, A.; de Brito, M.M. Enhancing Flood Resilience Through Collaborative Modelling and Multi-criteria Decision Analysis (MCDA). In Urban Disaster Resilience and Security; Springer: Berlin/Heidelberg, Germany, 2018; pp. 221–236. [Google Scholar]
- Serre, D.; Heinzlef, C. Assessing and mapping urban resilience to floods with respect to cascading effects through critical infrastructure networks. Int. J. Disaster Risk Reduct. 2018, 30, 235–243. [Google Scholar] [CrossRef]
- Han, S.L.; Li, T.; Zhuang, M.J. Discussion on evaluation index system of urban flood risk management level. China Water Wastewater 2015, 31, 7–10. [Google Scholar]
- Xu, T.; Wang, C.L.; Hong, M. Evaluation of urban waterlogging resilience in China based on grey box model. City Probl. 2015, 4, 2–11. [Google Scholar]
- Wingfield, J.; Bell, M. Improving the Flood Resilience of Buildings through Improved Materials, Methods and Details; CiteSeer: Princeton, NJ, USA, 2005; pp. 1–62. [Google Scholar]
- Huang, J.; Shen, J.W.; Yuan, X.M.; Wang, H.M. Simulation of urban flood toughness based on system dynamics—Take Nanjing as an example. Chin. J. Mech. Eng. 2020, 29, 2519–2529. [Google Scholar]
- Hyun, K.; Marcouiller, D.W.; Woosnam, K.M. Rescaling social dynamics in climate change: The implications of cumulative exposure, climate justice, and community resilience. Geoforum 2018, 96, 129–140. [Google Scholar]
- Cui, P.; Li, D. Measuring the Disaster Resilience of an Urban Community Using ANP-FCE Method from the Perspective of Capitals. Soci. Sci. Q. 2019, 100, 2059–2077. [Google Scholar] [CrossRef]
- Lin, L.; Wu, Z.; Liang, Q. Urban flood susceptibility analysis using a GIS-based multi-criteria analysis framework. Nat. L Hazards 2019, 97, 455–475. [Google Scholar] [CrossRef]
- Seekao, C.; Pharino, C. Assessment of the flood vulnerability of shrimp farms using a multicriteria evaluation and GIS: A case study in the Bangpakong Sub-Basin, Thailand. Environ. Earth Sci. 2016, 75, 308. [Google Scholar] [CrossRef]
- Rehman, S.; Sahana, M.; Hong, H.; Sajjad, H.; Ahmed, B.B. A systematic review on approaches and methods used for flood vulnerability assessment: Framework for future research. Nat. Hazards 2019, 96, 975–998. [Google Scholar] [CrossRef]
- Cao, Q. Study on Management of Urban Waterlogging Disaster in Wuhan. Master’s Thesis, Huazhong University of Science and Technology, Wuhan, China, 2018. [Google Scholar]
- Bruijn, K. Resilience and Flood Risk Management: A Systems Approach Applied to Lowland Rivers; Delft University Press: Delft, The Netherlands, 2005. [Google Scholar]
- Xu, W.; Xiang, L.; Proverbs, D. Assessing Community Resilience to Urban Flooding in Multiple Types of the Transient Population in China. Water 2020, 12, 2784. [Google Scholar] [CrossRef]
- Zhou, L.; Yuan, W. Disaster Management Marching toward Resilient City. Comp. Econ. Soc. Syst. 2017, 5, 22–33. [Google Scholar]
- Xie, F.; Liu, M.; Nie, Q. The interface risk assessment of urban rail transit PPP project based on ISM-ANP-Fuzzy. J. Civ. Eng. Manag. 2018, 35, 167–172. [Google Scholar]
- Attri, R.; Dev, N.; Sharma, V. Interpretive Structural Modelling (ISM) approach: An Overview. Res. J. Manag. Sci 2013, 2, 3–8. [Google Scholar]
- Zhou, X.; Shi, Y.; Deng, X.; Deng, Y. D-DEMATEL: A new method to identify critical success factors in emergency management. Saf. Sci. 2017, 91, 93–104. [Google Scholar] [CrossRef]
- Xu, W.P.; Xiang, L.L. Community resilience evaluation of urban floating population based on population size correlation. Urban Dev. Res. 2020, 27, 94–99. [Google Scholar]
- Wnag, L.F. Network analysis method (ANP) theory and algorithm. Syst. Eng. Theory Pract. 2001, 3, 44–50. [Google Scholar]
- Chang, A.P.; Lin, J.D.; Chou, C.C. Analytic Network Process (ANP)-Selection of the Best Alternative in the Promotion of Participation in Infrastructure Projects. Int. J. Pavement Res. Technol. 2013, 6, 612–619. [Google Scholar]
- Meade, L.M.; Sarkis, J. Analyzing organizational project alternatives for agile manufacturing processes: An analytical network approach. Int. J. Prod. Res. 1999, 37, 241–261. [Google Scholar] [CrossRef]
- Wang, Y.G.; Wang, C.M. Influencing Factors of Airline Safety Performance Based on ISM and ANP. J. Saf. Environ. 2013, 13, 221–226. [Google Scholar]
- Guo, R.P.; Zou, J.Q.; Wang, Q.; Gai, W.Y.; Quan, H.C. Study on flood disaster sensitivity evaluation of Yanbian prefecture based on GIS and AHP technology. Shanxi Archit. 2020, 46, 168–169. [Google Scholar]
- Zhao, Q.F. Resilience Assessment of Urban Waterlogging Disaster and Its Improvement Strategy. Master’s Thesis, Institutes of Technology of Henan, Zhengzhou, China, 2019. [Google Scholar]
- Ren, J.C.; Xie, S.B.; Liu, H.; Sun, B. Study on urban waterlogging control strategy under sponge city background. Water Resour. Plann. Des. 2020, 11, 35–38. [Google Scholar]
- Xiao, N. Urban Waterlogging Elastic Analysis and Prevention Measures Study. Master’s Thesis, Dalian University of Technology, Dalian, China, 2019. [Google Scholar]
Figure 1.
2008–2018: China’s direct economic losses due to floods as a percentage of GDP for that year.
Figure 1.
2008–2018: China’s direct economic losses due to floods as a percentage of GDP for that year.

Figure 2.
Framework of resilience indicators analysis with a network structuring model.

Figure 3.
Map of study area: (A) Wuhan, Hefei, and Nanjing City; (B) the location of study area in China.
Figure 3.
Map of study area: (A) Wuhan, Hefei, and Nanjing City; (B) the location of study area in China.

Figure 4.
Hierarchical structure of urban flood resilience.

Figure 5.
Hierarchical structure of urban flood resilience.

Figure 6.
Comparison of resilience indicators in three cities.


Table 1.
Comparison of the concept of flood resilience at different scales.
| Scale | Concept Definition | Focus |
|---|---|---|
| Single building | The ability of buildings to resist external and internal damage during floods (Bowker and Wallingford, 2005). | Resistance |
| City scale | Urban resilience to floods is defined as a city’s capacity to tolerate flooding and to reorganize should physical damage and socioeconomic disruption occur, so as to prevent deaths and injuries and maintain current socioeconomic identity, and to use cyclical floods as a learning opportunity to prepare cities for catastrophic floods (Liao, 2012). | Resilience and learning ability |
| Watershed scale | The resilience of the system can be defined as: the ability of an area to recover from floods; the resistance of the system can be defined as: the ability to let water flow through without causing floods (De Bruijn, 2005). | Resilience |
| Regional scale | (1) Spatial flood resilience refers to land management and storm runoff management measures based on floodplain zoning and urban greening. (2) Structural flood resilience refers to permanent flood control structures. (3) Social flood resilience refers to the establishment of sound institutions and management systems that consolidate the ability to prepare for and respond to uncertainties, changes, and hazards. (4) Flood resilience refers to the ability to withstand and recover from flood disaster through financial insurance assistance and government agency assistance (Tourbier, 2012). | Social resilience and spatial characteristics |
Table 2.
Satty’s scale.
| Scale of Importance | Linguistic Term | Explanation |
|---|---|---|
| 1 | Equal importance | Two indicators contribute equally to the objective |
| 3 | Moderate importance | Judgment slightly favors one indicator over another |
| 5 | Strong importance | Judgment strongly favors one indicator over another |
| 7 | Very strong | An indicator is favored very strongly over another |
| 9 | Extreme strong | An indicator is favored extremely strongly over another |
| 2, 4, 6, 8 | Represents the intermediate value of the above adjacent judgment | |
Table 3.
Urban flood resilience evaluation index system.
| Dimension | Indicator | Description | Symbol |
|---|---|---|---|
| Economic System | The level of infrastructure investment | Investment in infrastructure construction such as providing services to improve the unfavorable external environment. | V1 |
| Rescue capabilities | Relief and rescue capability. | V2 | |
| Social security | Ensure that citizens with no income, low income, and various accidental disasters can survive. | V3 | |
| Natural Environment | Environmentally sensitive area | High-potential areas for landslides, flooding, and other hazards. | V4 |
| Water resource protection | High-potential areas for landslides, flooding, and other hazards. | V5 | |
| Water distribution | Distribution of rivers, seas, and lakes. | V6 | |
| Government and Organization | The flood control plan | Developed the hardware and software plans to prevent the flood shocks. | V7 |
| Resource allocation capacity | Water resources distribution and regulation Capability. | V8 | |
| Rational spatial planning | Long-term planning and overall planning of space resources and layout. | V9 | |
| Technological Capability | Weather forecast overview | The forecasts and preparedness capacities. | V10 |
| Flood resource recovery | Implement effective flood management and rationally allocate flood resources. | V11 | |
| Built Environment | Spatial structure of land use | Spatial structures of the urban areas and regional areas. | V12 |
| Public resource level | Life-support systems and infrastructure capability. | V13 |
Table 4.
First-level factor division data.
| Influencing Factor Vi | Reachability Set (Ri) | Antecedent Set (Ai) | Intersection Set (Ri ∩ Ai) | |
|---|---|---|---|---|
| V1 | 1 | 1, 4, 13 | 1 | V1 |
| V2 | 2, 5, 6, 7, 10, 11, 12 | 2 | 2 | |
| V3 | 3 | 3, 4, 9, 13 | 3 | V3 |
| V4 | 1, 3, 4, 8, 11, 12 | 4, 9, 13 | 4 | |
| V5 | 5, 10, 12 | 2, 5, 7, 9 | 5 | |
| V6 | 6, 10, 11 | 2, 6, 7, 9, 13 | 6 | |
| V7 | 5, 6, 7, 10, 11, 12 | 2, 7, 9 | 7 | |
| V8 | 8 | 4, 8, 9, 13 | 8 | V8 |
| V9 | 1, 3, 4, 5, 6, 7, 8, 9, 10, 11, 12, 13 | 9 | 9 | |
| V10 | 10 | 2, 5, 6, 7, 9, 10, 13 | 10 | V10 |
| V11 | 11 | 2, 4, 6, 7, 9, 11, 13 | 11 | V11 |
| V12 | 12 | 2, 4, 6, 7, 9, 12, 13 | 12 | V12 |
| V13 | 1, 3, 4, 6, 8, 10, 11, 12, 13 | 13 | 13 |
Table 5.
The index factor weights of the three cities.
| Indicators | Wuhan | Nanjing | Hefei |
|---|---|---|---|
| V1 | 0.063 | 0.054 | 0.161 |
| V2 | 0.245 | 0.222 | 0.279 |
| V3 | 0.056 | 0.036 | 0.066 |
| V4 | 0.117 | 0.092 | 0.034 |
| V5 | 0.078 | 0.063 | 0.028 |
| V6 | 0.140 | 0.075 | 0.052 |
| V7 | 0.039 | 0.032 | 0.038 |
| V8 | 0.047 | 0.046 | 0.075 |
| V9 | 0.027 | 0.125 | 0.059 |
| V10 | 0.037 | 0.029 | 0.018 |
| V11 | 0.075 | 0.060 | 0.045 |
| V12 | 0.025 | 0.116 | 0.022 |
| V13 | 0.050 | 0.051 | 0.122 |
Publisher’s Note: MDPI stays neutral with regard to jurisdictional claims in published maps and institutional affiliations. |
© 2021 by the authors. Licensee MDPI, Basel, Switzerland. This article is an open access article distributed under the terms and conditions of the Creative Commons Attribution (CC BY) license (https://creativecommons.org/licenses/by/4.0/).
Share and Cite
MDPI and ACS Style
Xu, W.; Cong, J.; Proverbs, D.; Zhang, L. An Evaluation of Urban Resilience to Flooding. Water 2021, 13, 2022. https://0-doi-org.brum.beds.ac.uk/10.3390/w13152022
AMA Style
Xu W, Cong J, Proverbs D, Zhang L. An Evaluation of Urban Resilience to Flooding. Water. 2021; 13(15):2022. https://0-doi-org.brum.beds.ac.uk/10.3390/w13152022
Chicago/Turabian StyleXu, Wenping, Jinting Cong, David Proverbs, and Linlan Zhang. 2021. "An Evaluation of Urban Resilience to Flooding" Water 13, no. 15: 2022. https://0-doi-org.brum.beds.ac.uk/10.3390/w13152022
Note that from the first issue of 2016, this journal uses article numbers instead of page numbers. See further details here.