Article

Assessment of Algorithm Performance on Predicting Total Dissolved Solids Using Artificial Neural Network and Multiple Linear Regression for the Groundwater Data

by
Muhammad Umar Farooq
1,
Abdul Mannan Zafar
2,
Warda Raheem
3,
Muhammad Irfan Jalees
1 and
Ashraf Aly Hassan
2,*
1
Institute of Environmental Engineering and Research, University of Engineering and Technology, Lahore 54890, Pakistan
2
Civil and Environmental Engineering Department, United Arab Emirates University, Al-Ain 15551, United Arab Emirates
3
Department of Contracting and Procurement, Water and Sanitation Agency (WASA), Head Office 31-B Zahoor Elahi Rd, Block B Gulberg 2, Lahore 54660, Pakistan
*
Author to whom correspondence should be addressed.
Submission received: 11 May 2022 / Revised: 10 June 2022 / Accepted: 16 June 2022 / Published: 23 June 2022
(This article belongs to the Topic Organic Pollution in Soil and Groundwater)

Abstract

:
Estimating groundwater quality parameters through conventional methods is time-consuming through laboratory measurements for megacities. There is a need to develop models that can help decision-makers make policies for sustainable groundwater reserves. The current study compared the efficiency of multivariate linear regressions (MLR) and artificial neural network (ANN) models in the prediction of groundwater parameters for total dissolved solids (TDS) for three sub-divisions in Lahore, Pakistan. The data for this study were collected every quarter of a year for six years. ANN was applied to investigate the feasibility of feedforward, backpropagation neural networks with three training functions T-BR (Bayesian regularization backpropagation), T-LM (Levenberg–Marquardt backpropagation), and T-SCG (scaled conjugate backpropagation). Two activation functions were used to analyze the performance of algorithmic training functions, i.e., Logsig and Tanh. Input parameters of pH, electrical conductivity (EC), calcium (Ca2+), magnesium (Mg2+), chloride (Cl), and sulfate (SO42−) was used to predict TDS as an output parameter. The computed values of TDS by ANN and MLR were in close agreement with their respective measured values. Comparative analysis of ANN and MLR showed that TDS root means square error (RMSE) for city sub-division and Pearson’s coefficient of correlation (r) for ANN and MLR were 2.9% and 0.981 and 4.5% and 0.978, respectively. Similarly, for the Farrukhabad sub-division, RMSE and r for ANN were 4.9% and 0.952, while RMSE and r for MLR were 5.5% and 0.941, respectively. For the Shahadra sub-division, RMSE was 10.8%, r was 0.869 for ANN, RMSE was 11.3%, and r was 0.860 for MLR. The results exhibited that the ANN model showed less error in results than MLR. Therefore, ANN can be employed successfully as a groundwater quality prediction tool for TDS assessment.

1. Introduction

Groundwater, a valuable natural resource, is used as an essential source of drinking water worldwide [1]. It is a valuable natural resource. Nowadays, the biggest challenge for water resource managers is to predict groundwater quality. Water supply from private and public sector distribution companies cannot perform laboratory measurements regularly due to a lack of resources and technical capabilities in developing countries. According to standardized tests, water test sampling from these companies compromises the water quality at the consumer end. Therefore, proper groundwater resources management is essential for present and future decades [2]. Regular water quality monitoring procedures are very tedious and require expensive laboratory tests. However, the parameters being examined to assure the water quality require authorized standard procedures such as the standard methods for examining water provided by the American Water Association [3]. Therefore, the frequency of these water samplings due to financial issues in developing countries is lower than monitoring the water quality. Groundwater quality is generally conducted by observing different parameters such as TDS, Temp, HCO3, pH, Ca2+, Mg2+, EC, Na+, F, SO42−, Cl, K+, and other pollutants, e.g., metals nutrients, inorganics, and organics.
Water quality data analysis is time-consuming because water quality parameters often have nonlinearities concerning seasonal and spatial trends [4]. Further, the nature of the groundwater system is complex, and it has constantly been exposed to natural and anthropogenic stresses causing deterioration in groundwater quality. Thus, for a well-known groundwater profile, whereas the circumstances at the outset remain unchanged, mathematical models are considered the best tool to forecast and predict groundwater quality [5]. Physically-based models are considered the primary tool for predicting groundwater quality variables. At the same time, they also help understand what processes are taking place in a physical groundwater system. Due to some practical limitations of physical models, an empirical model provides an alternative solution explicitly because they deliver reliable results and are time efficient [6]. Artificial neural network (ANN) models have unique properties that help them predict nonlinear variables that are dynamic [7]. Therefore, ANN is a valuable method for modeling and forecasting groundwater quality parameters to show the best parametric relationships for future forecasting [8,9]. Moreover, MLR is also a vast field, which previously was not explored in detail with a different algorithmic approach for groundwater prediction.
In the last two decades, a significant increase in studies on groundwater quality parameters has been carried out worldwide, and ANN research has gained importance in ecology and water resource engineering fields. A successful ANN model was developed to validate the water quality parameters such as electrical conductivity (EC), SO42−, Cl, and NO3, with already measured values [10]. Another study predicted values of magnesium adsorption ratio, residual sodium carbonate, percent sodium (% Na+), Kelly’s ratio, and sodium adsorption ratio (SAR) of Nanded tehsil for groundwater [11]. Ca2+, pH, Mg2+, total dissolved solids (TDS), EC, Cl, CO32− Na+, K+, HCO3, SO42−, and NO3 were considered parameters for analysis. Abyaneh [12] predicted the water quality parameters using multiple linear regression (MLR) and ANN tool to estimate the chemical oxygen demand (COD) and biochemical oxygen demand (BOD) for a wastewater treatment plant.
Chou et al. [13] estimated the water quality of reservoirs as a tool for management because the adverse effects of reservoir water cause damage to the environment and human life. Chou et al. [13] have approached the tier method in ANN as a suitable option to predict the water quality. Xu et al. [14] used the ANN model as a predictive tool to estimate the recreational water quality based on fecal indicator bacteria (FIB). They found that multi-layer perceptron (MLP-ANN) best-predicted water quality with the shortest computation time. Mojid and Hossain [15] used MLR and ANN for the comparative analysis to estimate solute-transport parameters containing velocity, dispersion coefficient, and retardation factors. Aldhyani et al. [16] estimated the water quality index (WQI) using the ANN model for the parameters such as dissolved oxygen, pH, EC, BOD, NO3, fecal coliform, and total coliform. In their analysis, the nonlinear autoregressive neural network (NARNET) performed better in terms of Pearson’s correlation factor (r) than the long short-term memory (LSTM) algorithm. In this way, extensive and costly methodologies of groundwater quality measurement parameters can be reduced. Therefore, it can be concluded that ANN can be used as a predictive tool to make estimations based on the best algorithm with feasible predictions.
The primary purpose of this study is to examine how effectively neural networks have been applied to solve problems of monitoring water quality by solely predicting the TDS parameter. All parameters were tested as output layers in ANN model predictions, but TDS was the parameter that presents the best optimization results in the dependence of all the other parameters. Therefore, TDS was considered as the output layer. Moreover, predicted TDS values were compared with the real-time TDS values observed at the different tubewell data of Lahore (city, Farrukhabad, and Shahdara sub-divisions). The numerous problems identified in the sampling frequency from the tubewell, testing time, and procedures aim this study with the following objectives; (1) to find the optimized algorithm of ANN for the prediction of complex groundwater data; (2) to select the best method in prediction of the water quality data; (3) to compare the results obtained from ANN and MLR methods for the prediction of TDS and selection of the best-optimized model.

2. Materials and Methods
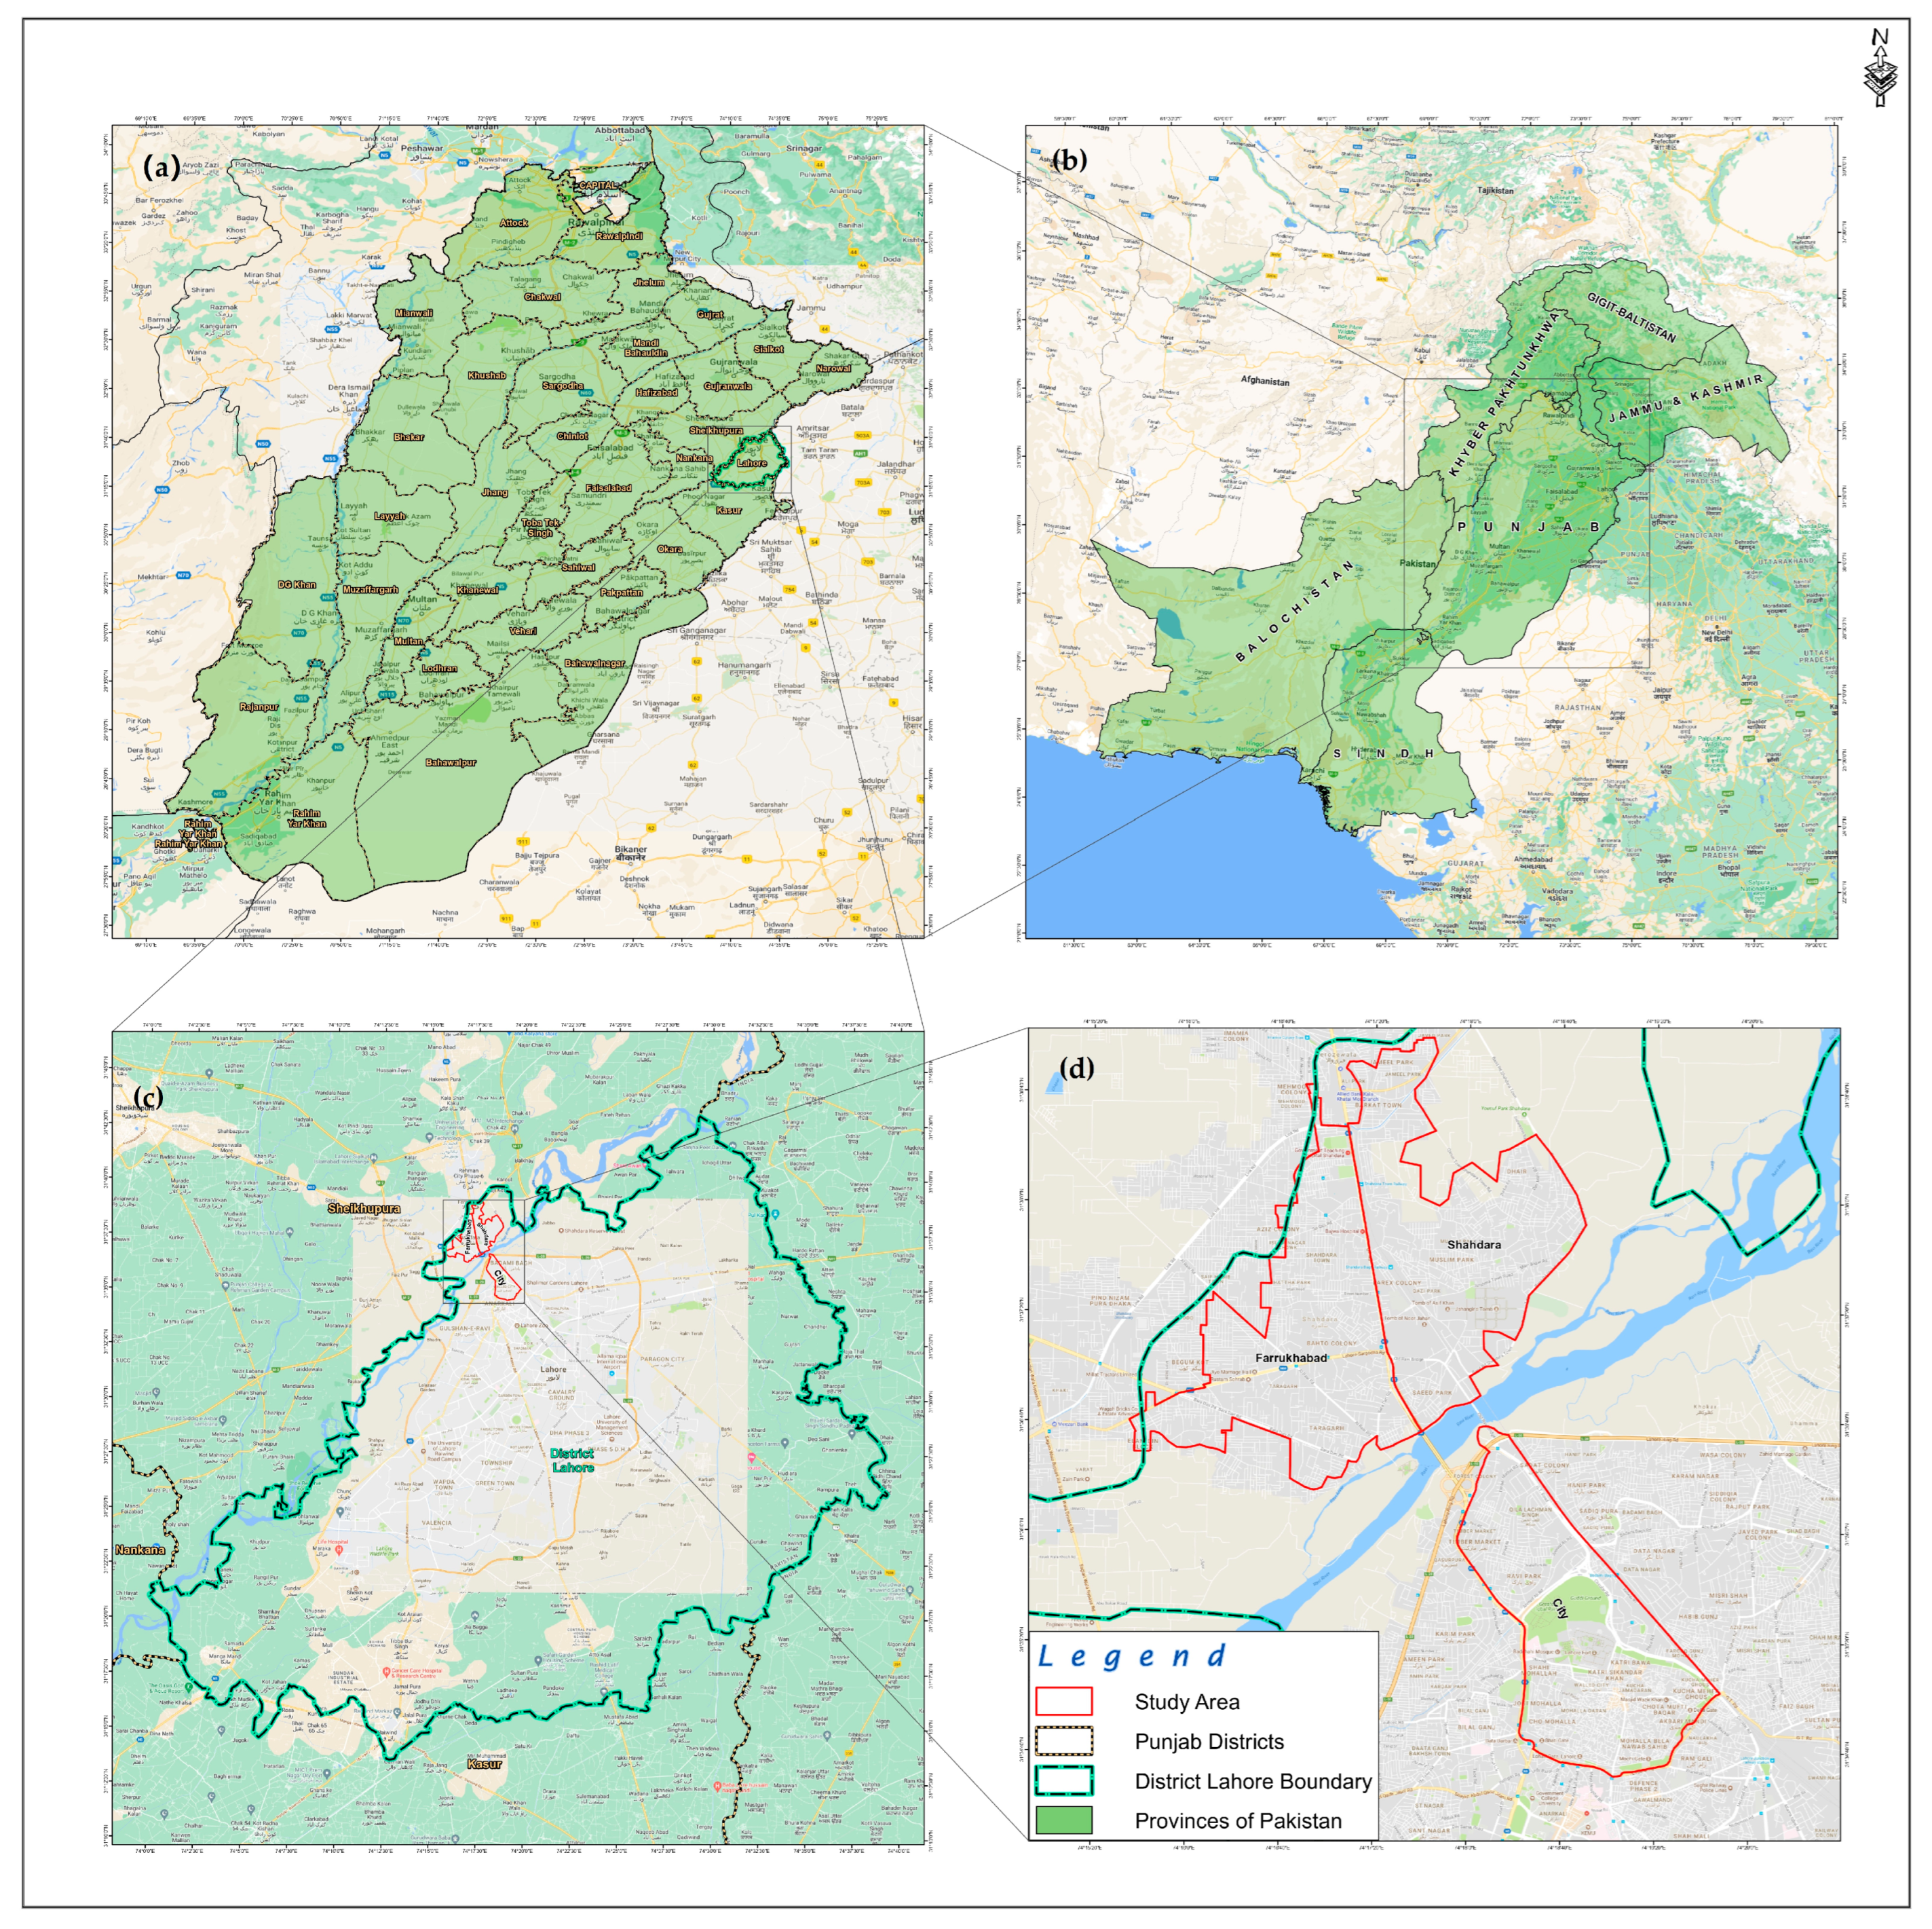
2.1. Study Area

The study was conducted in Lahore, Punjab, Pakistan, see Figure 1a,b. The data was collected from three sub-divisions of Lahore (31°15′–31°45′ N and 74°01′–74°39′ E), i.e., City, Farrukhabad, and Shahdara town as shown in Figure 1c. The three sub-divisions were selected for this study. The study area is spread about 22.14 km2 for three subdivisions with a total number of source tubewell 50, as shown in Table 1. The estimated population of Shahdara town is between 10,000 to 12,000 persons per 22.14 km2 [17]. The groundwater data were obtained for the six years, and the total number of data samples from each subdivision resulted in 1200 for the six years.
The data obtained from these locations were for the pH, TDS, EC, calcium, magnesium, chloride, and sulfate ions. These parameters were tested using American Public Health Association (APHA) standard methods [3]. This study used six-year (2012–2017) testing data for these parameters (Supplementary data—Table S1). The total data points were 1200, as quarterly × six years × 50 tubewells (4 × 6 × 50). The prediction model used this data to estimate the observed and predicted dataset.

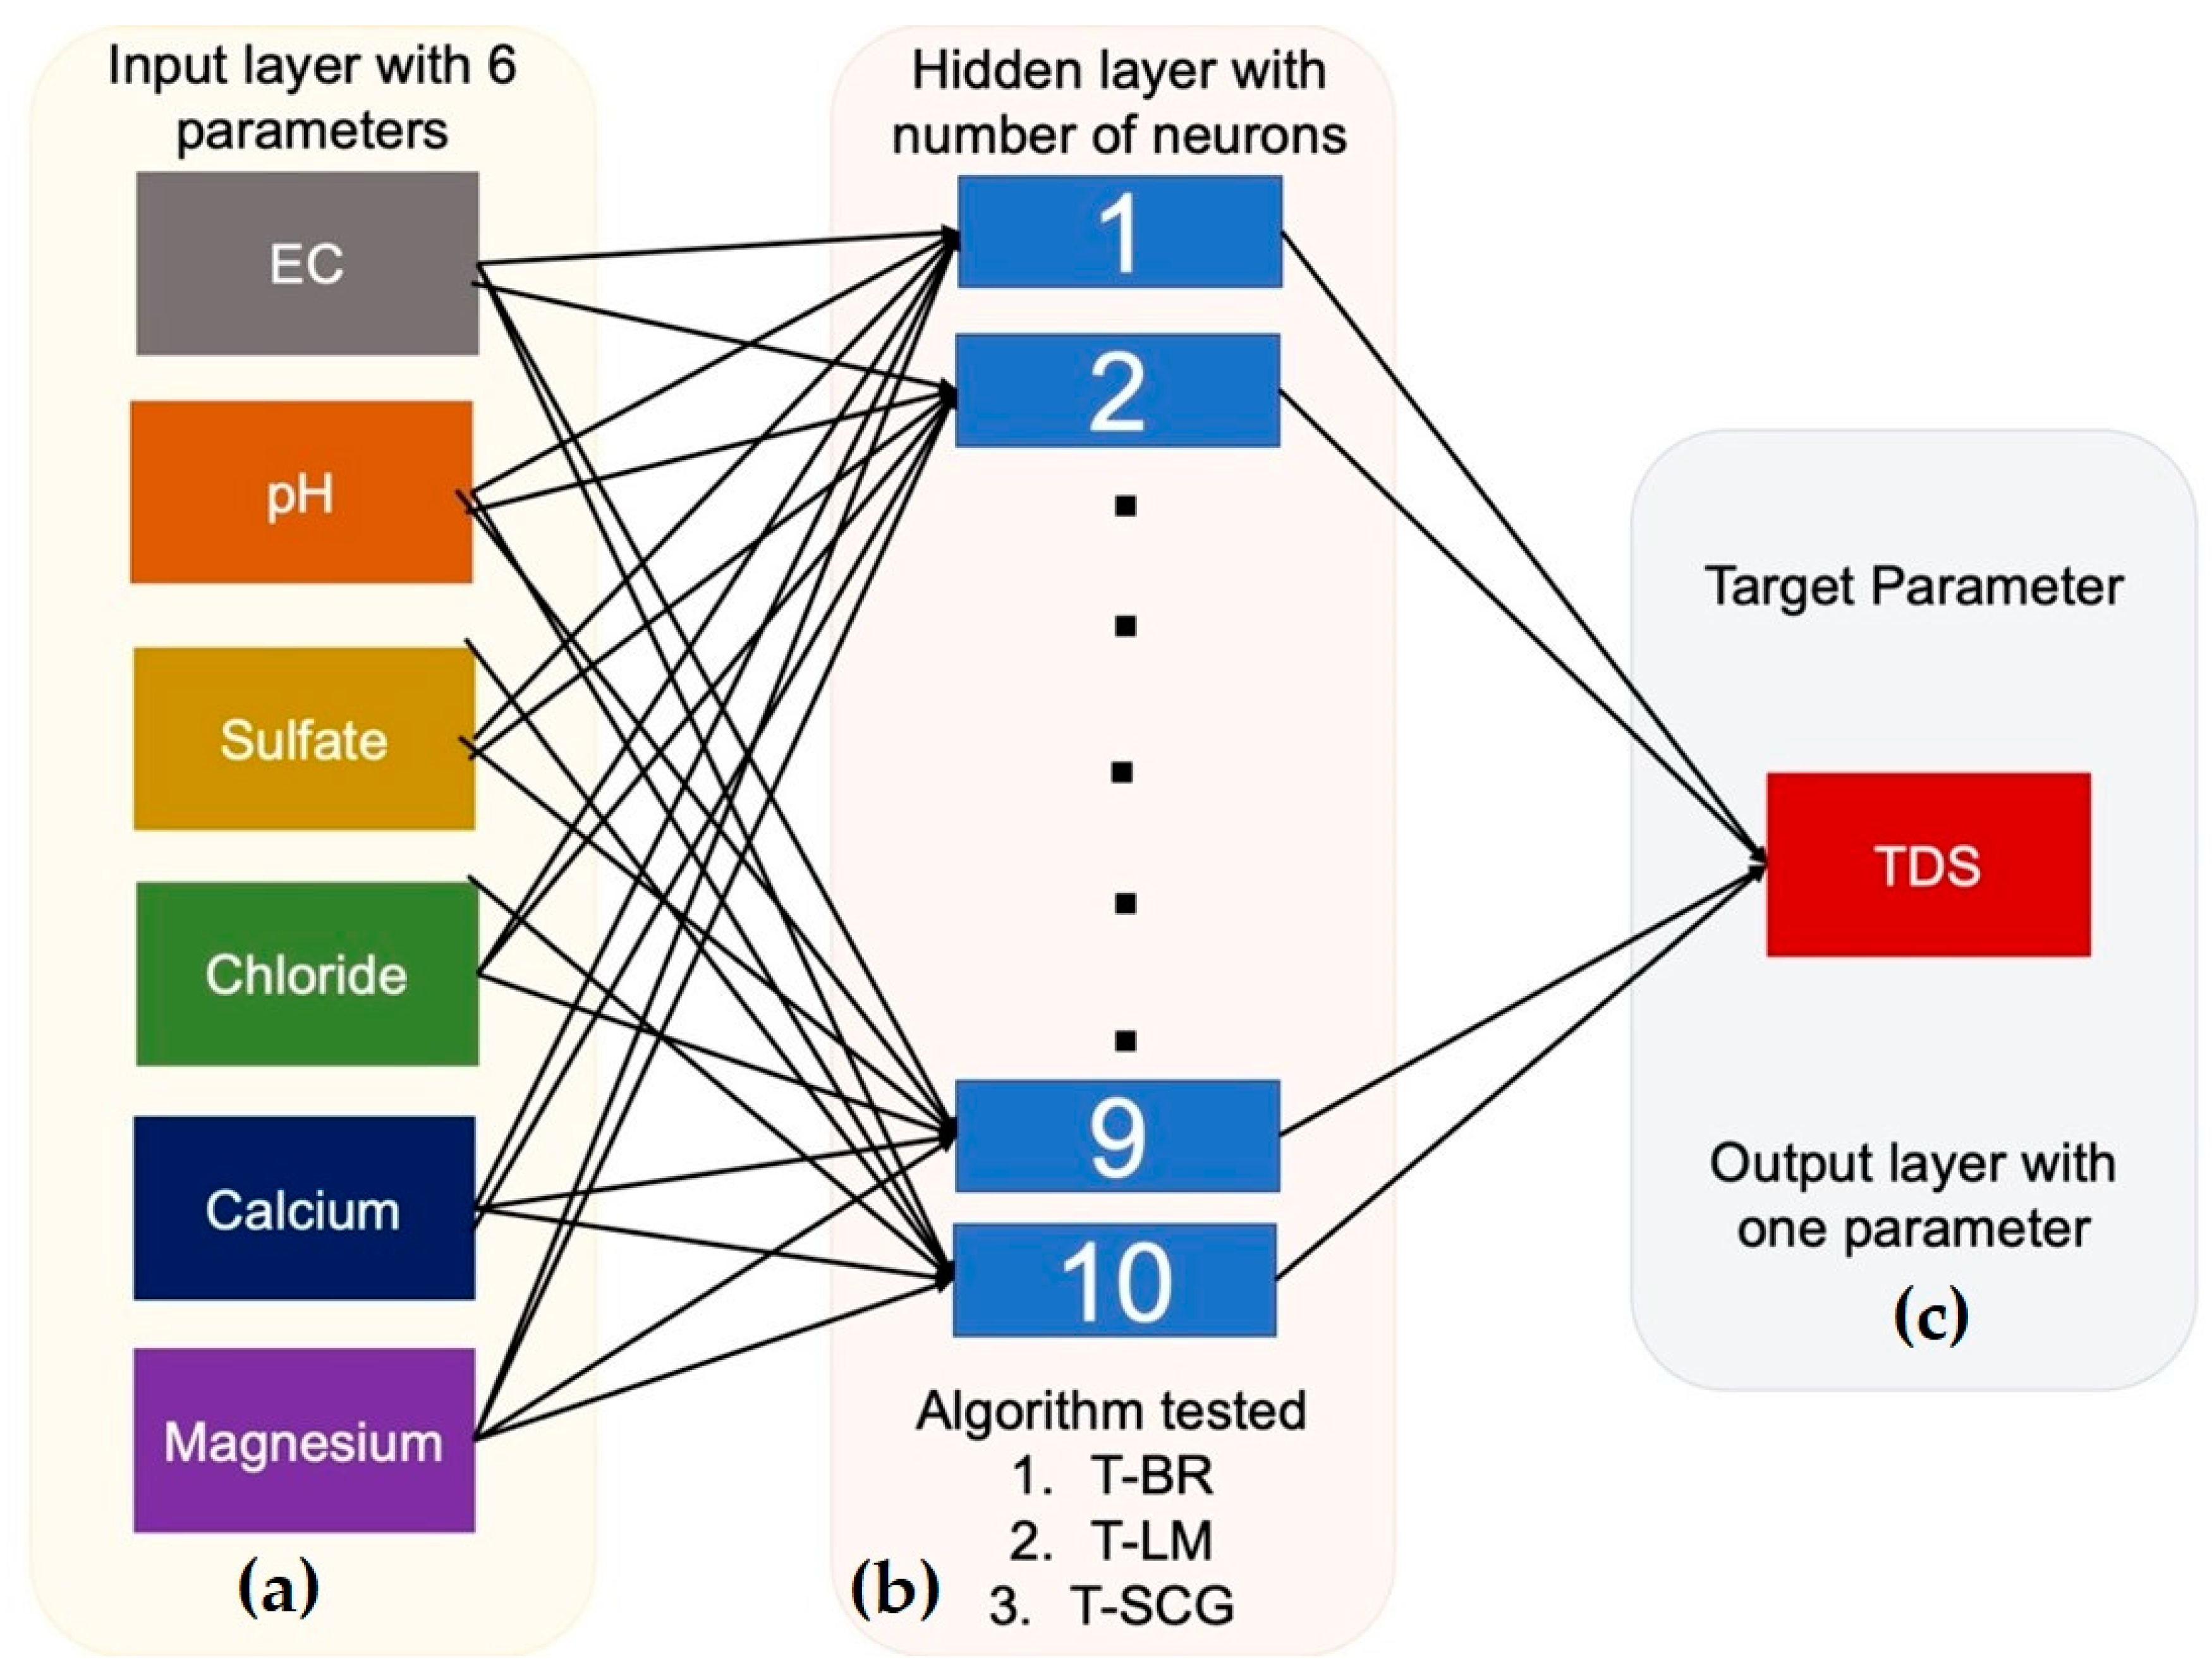
2.2. Artificial Neural Network (ANN) Model Design and Characteristics

The ANN models are widely used in forecasting and prediction as sources of the latest artificial intelligence technology in water resources. ANN models can deal with complex systems such as groundwater. The ANN is a nonlinear model designed to deal with large datasets with multiple variables as input [18,19,20]. Multi-layer perceptron (MLP) is the widely used ANN architectural design that has been used abundantly in hydrological modeling to predict and forecast the dataset [21,22,23,24,25,26]. The current investigation used MLP architecture to predict the TDS values of the groundwater sources. ANN model was developed in MATLAB Simulink (2018a) software using the ‘nntool’ toolbox. Since the groundwater studies are based on complex strata and transport media, this ANN model aimed to see which algorithm is the most suitable for predicting groundwater sources for TDS. Figure 2 explains the MLP architecture of the ANN model currently developed in this study. The MLP model contains three layers, including; (1) an input layer, (2) a hidden (inner) layer, and (3) an output layer. Each neuron computes an output value according to a weighted sum of all inputs based on the activation function [12,27].
In this study, a straightforward MLP model based on three different algorithms was used to predict the outcome, i.e., TDS. One output variable at one simulation was selected as a target parameter to be predicted by the ANN model as a hit and trial method. All the input parameters were tested as output layers one by one. However, the best optimization trials were supported for the TDS parameter by ANN models as a future prediction standard. In the input layer, six parameters, pH, EC, sulfate, calcium, magnesium, and chloride, were used. The input parameter individually was linked to the two to ten hidden layer processing neutrons in the hidden layer. Input data was normalized in 0–1 due to uneven dataset values for better optimization results. According to the ‘weighted’ factor units, these normalized values were transferred to the hidden layer. This factor is different for every scale inside the hidden layer neurons.
This study employed two transfer functions, i.e., Logsig and Tanh functions. These transfer functions were used to optimize the non-linearity in the dataset. Further, three training algorithms, i.e., Bayesian regularization backpropagation (T-BR), Levenberg–Marquardt backpropagation (T-LM), and scaled conjugate backpropagation (T-SCG), were used to train the network. Many trial and error runs were performed to optimize the suitable hidden layers neutrons, activation function, and training functions based on ANN architecture. For the ANN model, 70% of the groundwater dataset was used for training the network, 15% was set for testing the network, and 15% of the dataset was utilized for cross-validation purposes. The validation dataset was demonstrated against an unknown dataset for the optimized model.

2.3. Multiple Linear Regression (MLR) Models

Based on the datasets, statistical analysis, for example, linear regression models, can be the best tool for assessing the feasible relationship between dependent and independent variables of different sample sizes [12,28]. MLR is a commonly used tool to identify the linearity in one dependent and multiple independent variables. MLR is a tool based on the least square method. It is better to obtain the least values in the sum of squares errors for the observed and predicted dataset for the best results. Therefore, in this study MLR system was tested on SPSS (Version 20.0, IBM, New York, NY, USA). The same dataset for ANN and MLR was used to evaluate the best output results.

2.4. Assessment of ANN and MLR Forecasting

To assess the models to predict groundwater quality, the criteria of coefficient of correlation (r) and root mean square error (RMSE) were applied. The correlation coefficient (r) is very common to estimate the goodness of fit for regression models [12,28]. For calculating the coefficient of correlation ‘r’, the following equation was used for the dataset;
r = Σ ( X i X ¯ ) ( Y i Y ¯ ) Σ ( X i X ¯ ) 2 ( Y i Y ¯ ) 2
where Xi and Yi are the ith value of the observed and predicted values, respectively, X ¯ ,   Y ¯ are the mean values of Xi and Yi, and n is the number of data points Equation (2). Similarly, root means square error (RMSE) is the square root of the second derivative, or the quadratic mean, of the discrepancies between anticipated and observed values. When the computations are performed on the data sample used for the estimate, these deviations are residuals. When computed out-of-sample, they are referred to as errors (or prediction errors). Because RMSE is a scale-dependent estimation, it is used to evaluate predicting errors of various models for a specific dataset rather than between datasets. In the results and discussion RMSE has been used to compare the ANN and MLR performance. RMSE for the study was calculated based on the following Equation (2), while RMSE % was calculated using Equation (3);
R M S E = 1 n i = 1 n ( X i Y i ) 2
R M S E   % = R M S E ( i = 1 N C o u n t i N ) × 100

3. Results and Discussion

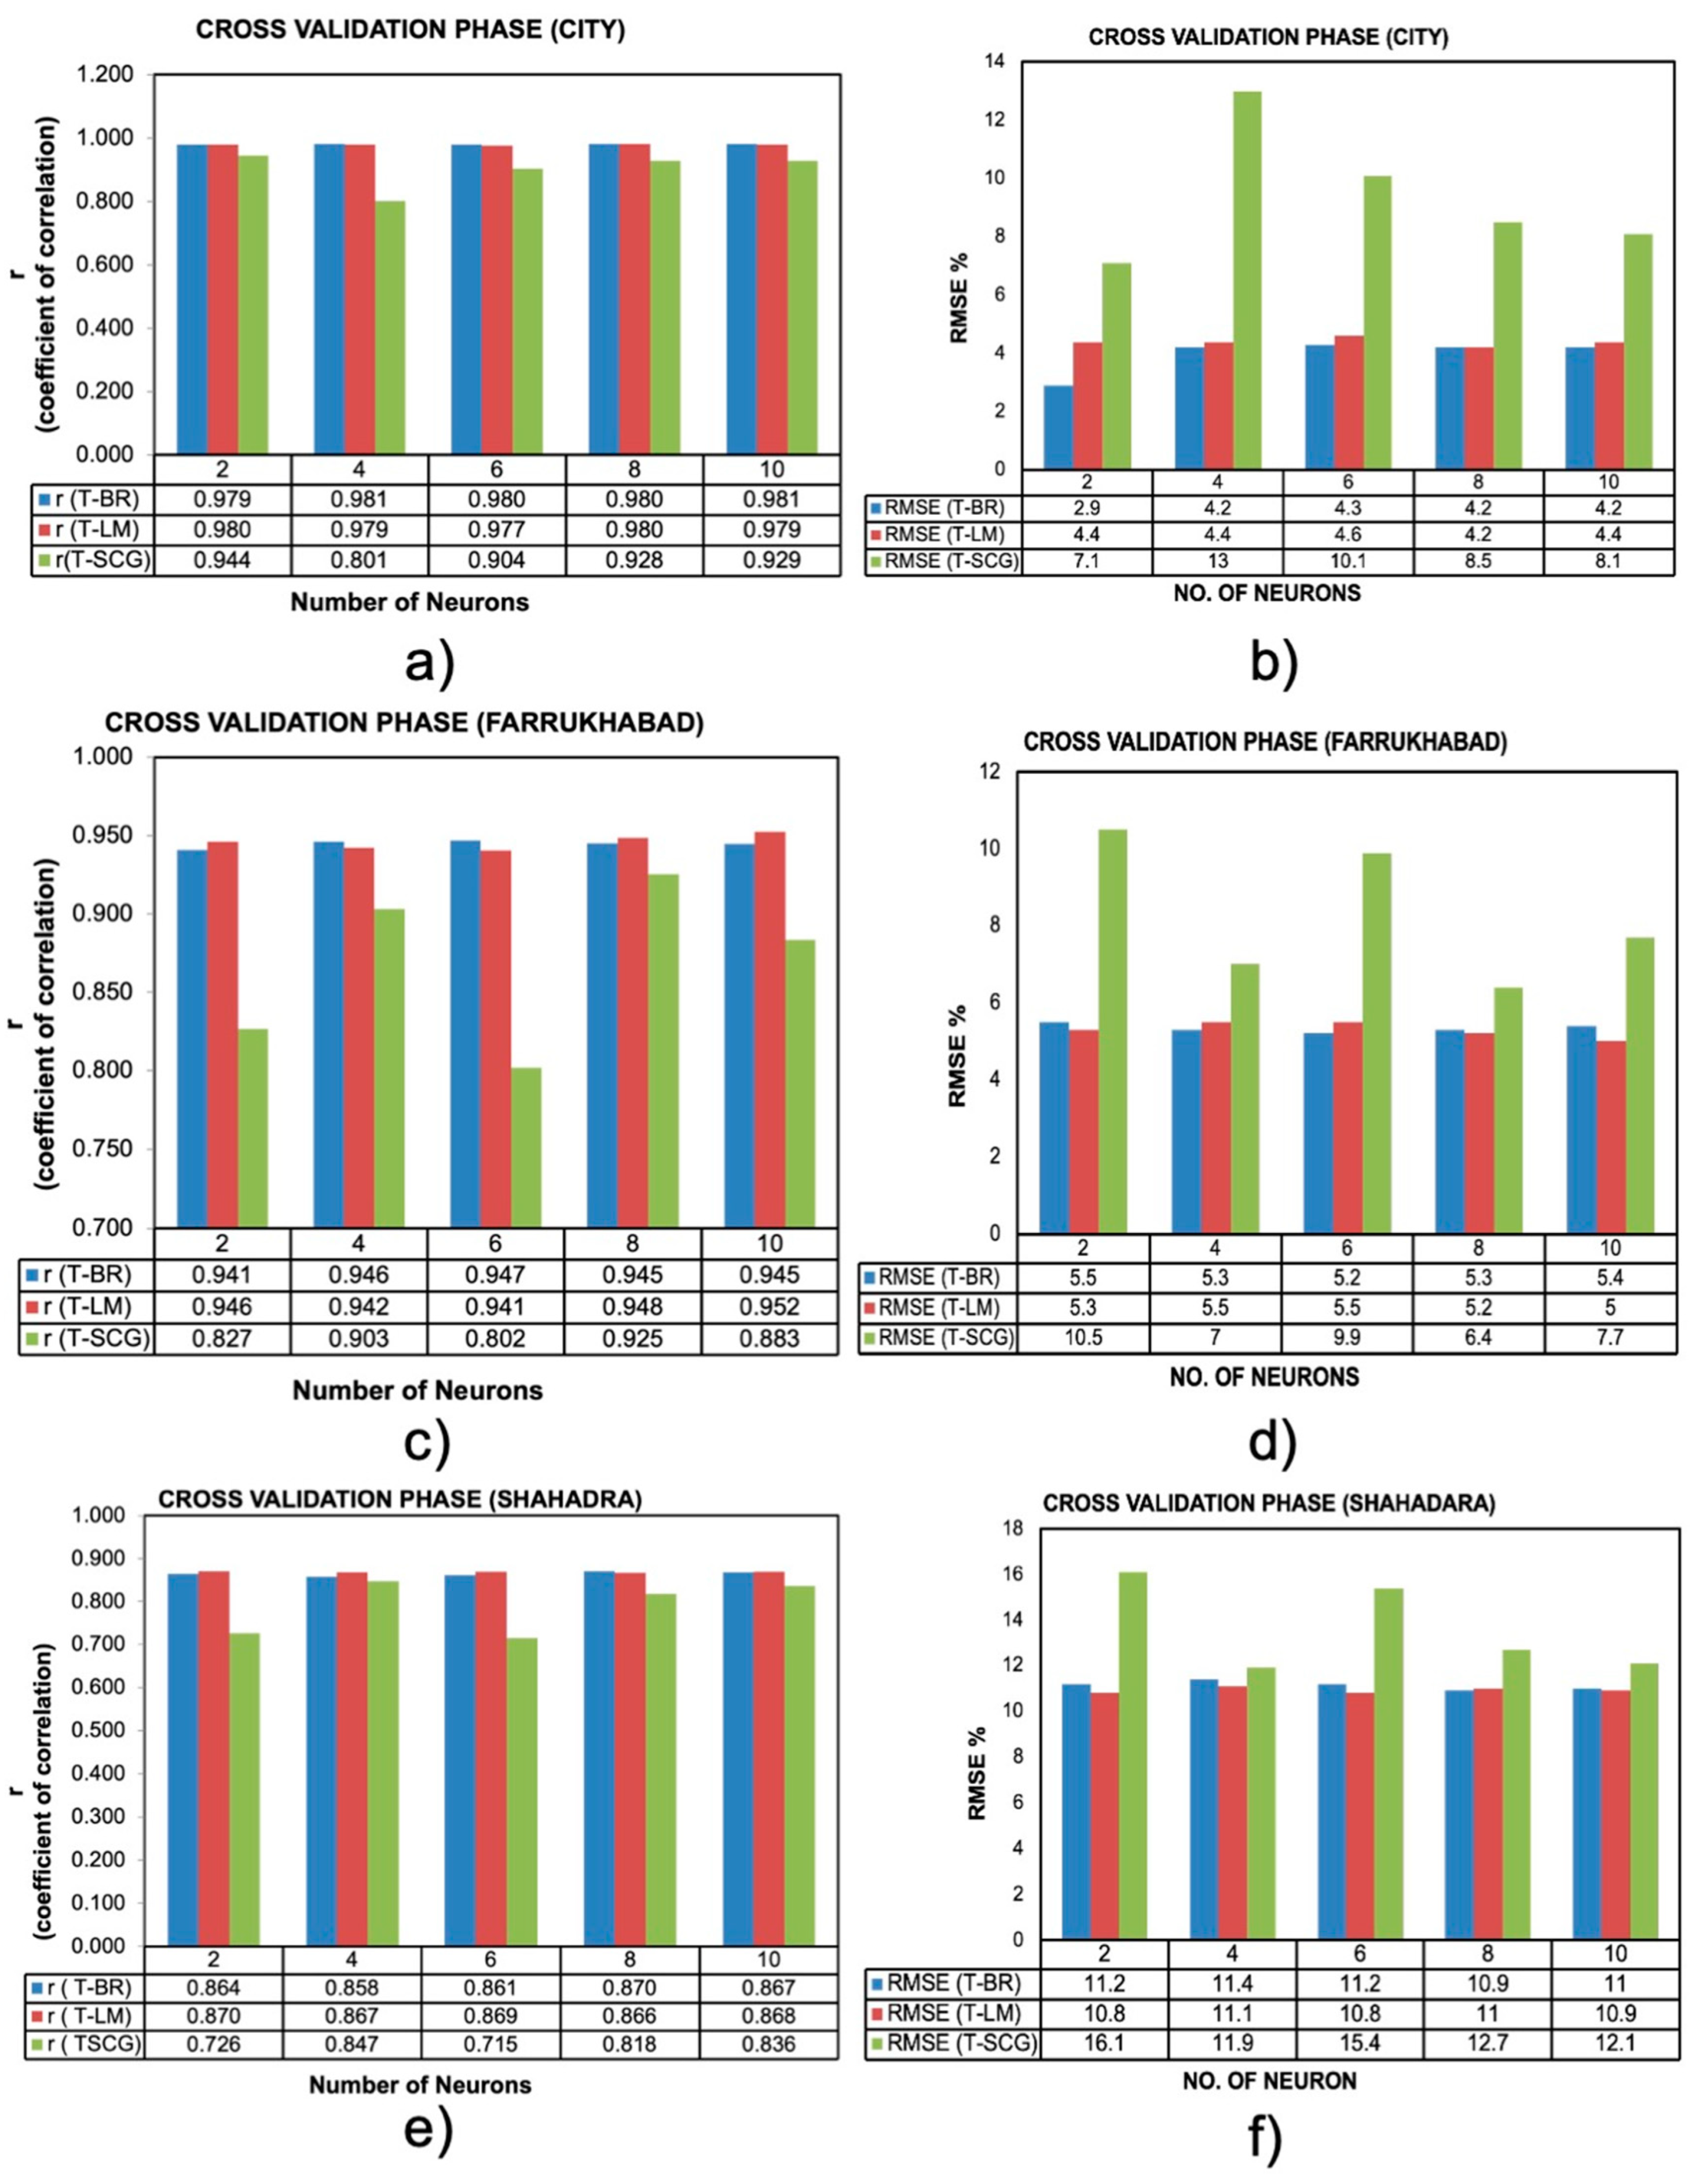
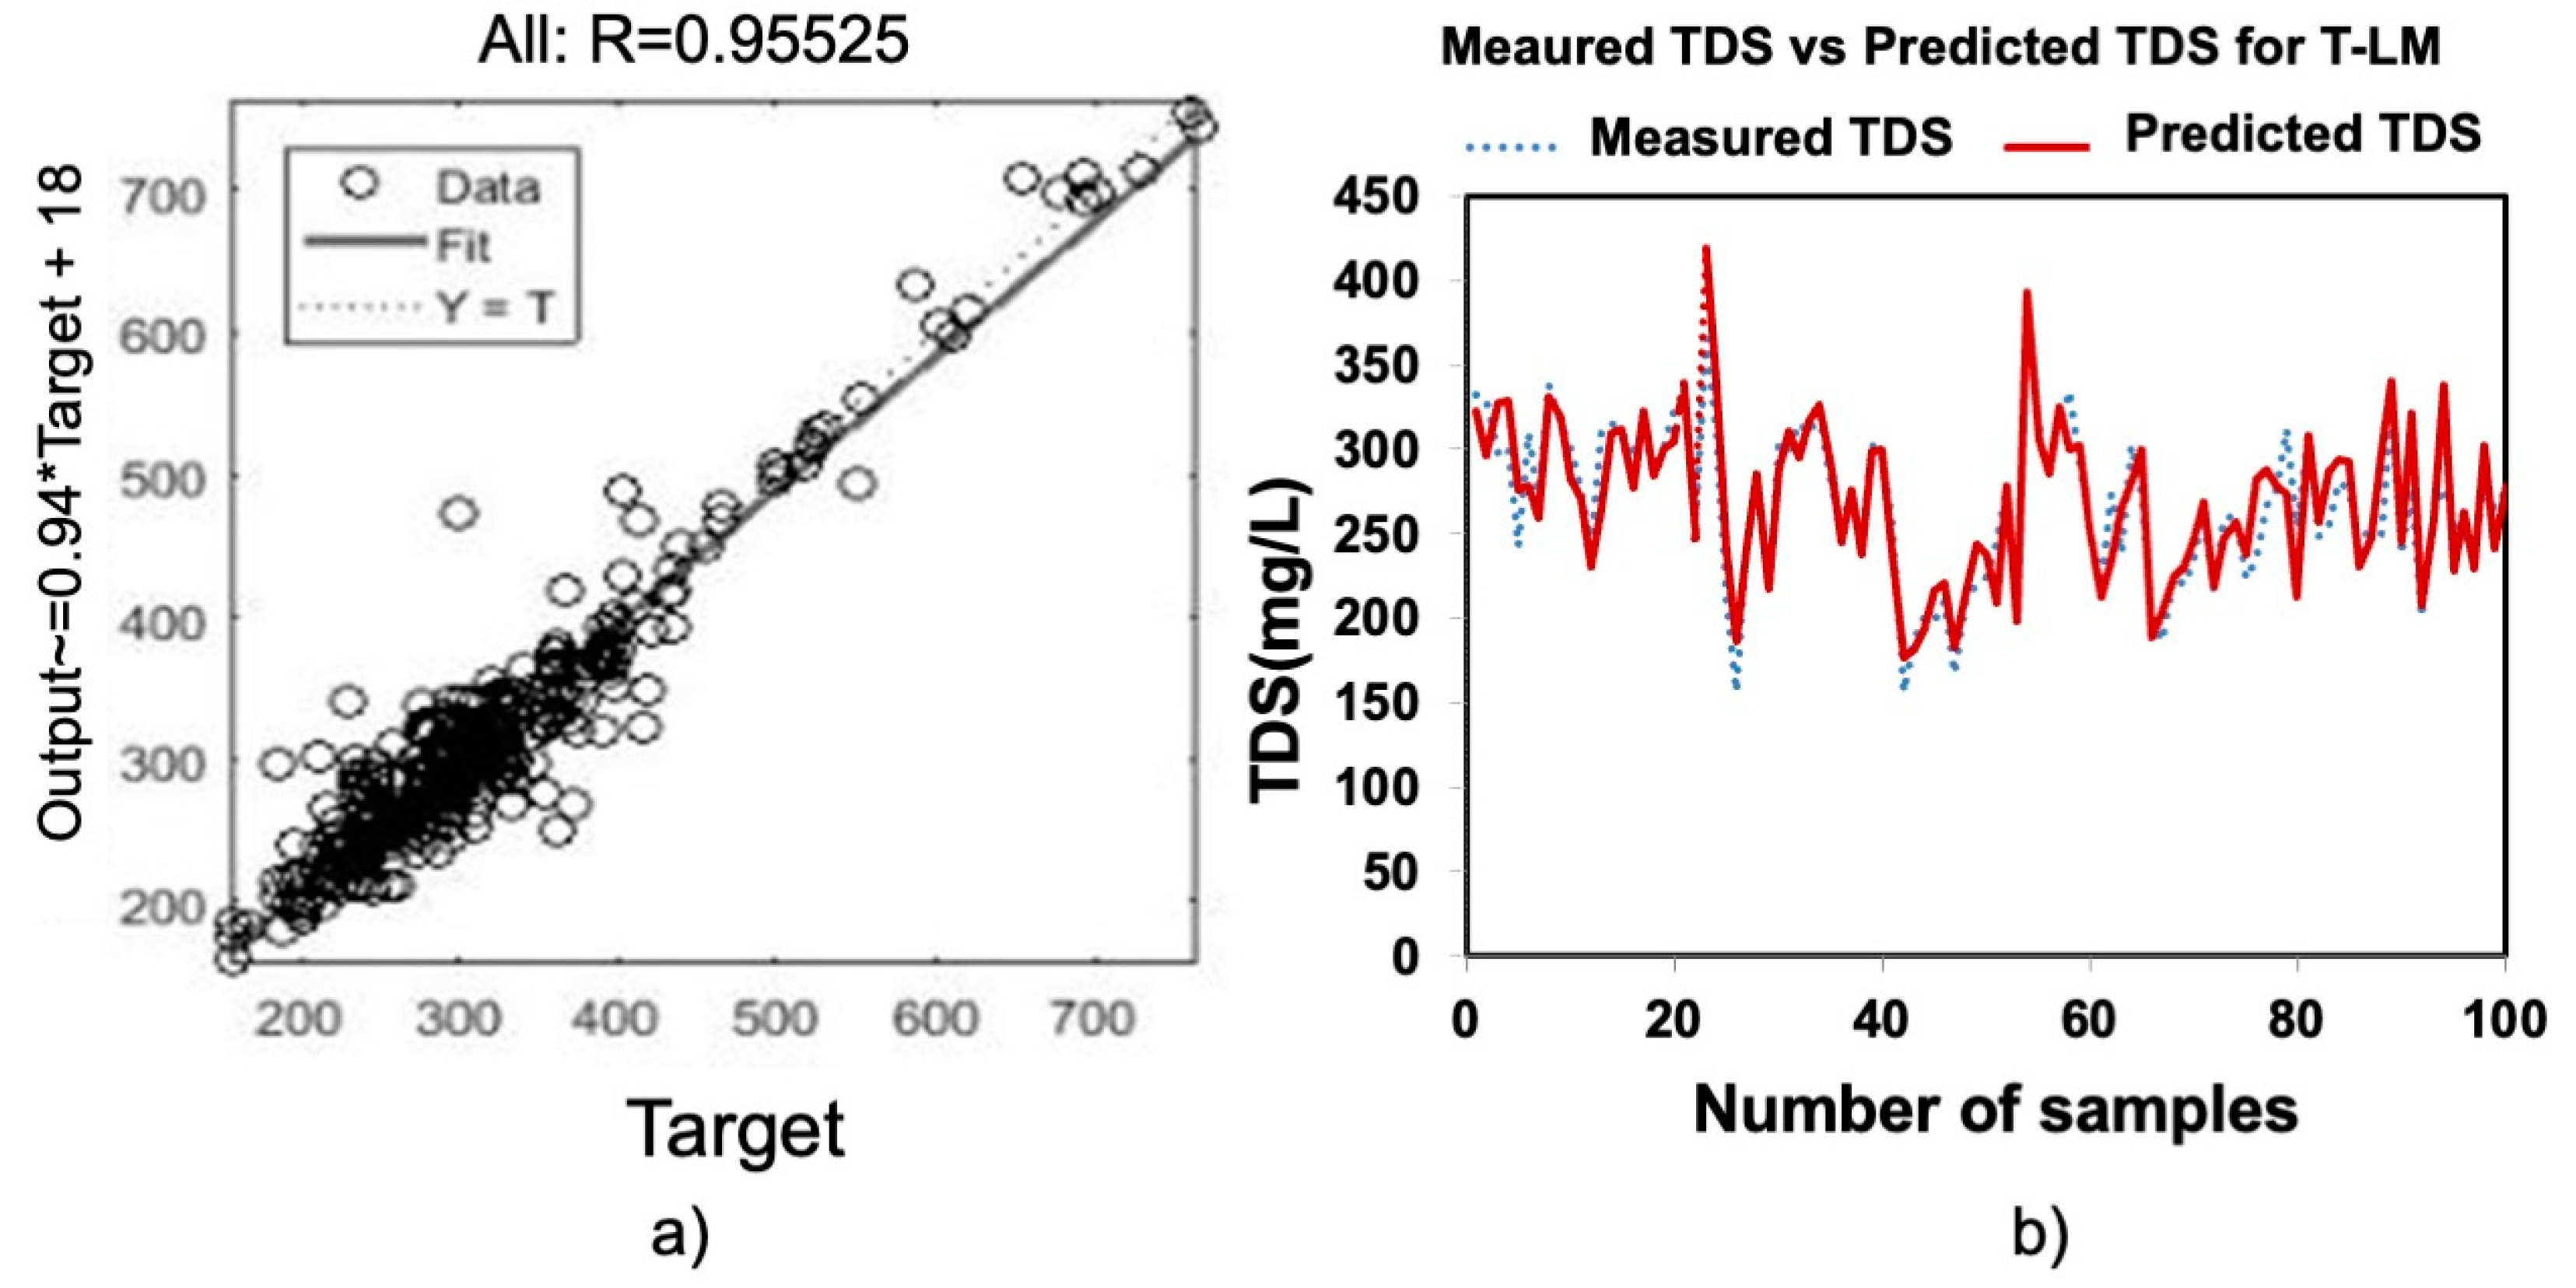
3.1. Cross-Validation of the ANN Model Performance Using Three Different Algorithms

The evaluation of ANN was employed using statistical criteria, i.e., r and RMSE, in the validation phase of the model performance. A sensitivity analysis was performed on three different algorithms, i.e., T-BR, T-LM, and T-SCG, with different numbers of neurons, i.e., 2, 4, 6, 8, and 10. Each algorithm was tested in different neurons to evaluate the best-optimized algorithm for r and RMSE. All these computations were performed in the same settings of the input-hidden-output layer (6-‘Hidden layer neurons’-1). The Logsig and Tanh transfer functions were also analyzed during the cross-validation analysis. Due to its fast convergence speed and good output results, the Tanh function was considered and implemented in all analyses performed during ANN. Therefore, the Tanh transfer function was utilized in the analysis during the sensitivity of three different algorithms. The cross-validation of the ANN model is shown in Figure 3. Figure 3a,b indicates the r and RMSE during the cross-validation of the Lahore city sub-division for the ANN model, respectively. In the Lahore city sub-division, the r-value of 0.981 was highest for the T-BR algorithm in 4 and 10 neurons. Similarly, the r-value was 0.979 for two neurons in the hidden layer for the same sub-division. The lowest RMSE value was obtained in 2 neurons under the same T-BR algorithm, i.e., 2.9%. However, due to lower RMSE, the value of 2.9% was selected to perform the T-BR algorithm’s ANN model for TDS prediction.
Similarly, in the Farrukhabad sub-division, T-LM was the best algorithm during the validation phase, Figure 3c,d. The highest r-value of 0.952 was obtained for ten neurons in the hidden layer. The lowest RMSE of 5% was also obtained in 10 neurons. Therefore, for the Farrukhabad sub-division, ten neurons supported the hidden layer ANN model. The studies found that reducing the number of neurons in the hidden layer can produce better results. Khatri et al. [29] used four neurons in the hidden layer to analyze the influent parameters of pH, BOD, COD, total suspended solids (TSS), and total Kjeldahl nitrogen (TKN), ammonium nitrogen (AN), and total phosphorus (TP). They used a smaller number of neurons in the hidden layer for better optimization of the feedforward ANN model. However, it might not be necessary because we have analyzed a low to a high number of neurons in the hidden layer for the cross-validation phase. Our results found that even with a high number of neurons, a suitable algorithm can perform better for predicting results.
Figure 3e,f represents the Shahdara sub-division statistical evaluation for r and RMSE. The highest r-value of 0.870 was achieved for T-LM in 2 neurons. However, there was no significant difference in 2 neurons and 6 neurons for the Shahdara sub-division. Since the difference in the r-value was less, we have selected six neurons as general criteria in all the prediction studies for the Shahdara sub-division. Similarly, the RMSE value for the Shahdara sub-division was less for 2 and 6 neurons in T-LM, i.e., 10.8%. Therefore, we have selected the T-LM algorithm based on six neurons for the Shahdara sub-division in all analyses. In this study, for city sub-division 6-2-1 MLP ANN model was selected for all the predictions of TDS values. Similarly, in Farrukhabad, the 6-10-1 MLP ANN model was applied in further groundwater data analyses. The Shahdara sub-division 6-6-1 layout of MLP-ANN was selected for all the groundwater sample data.

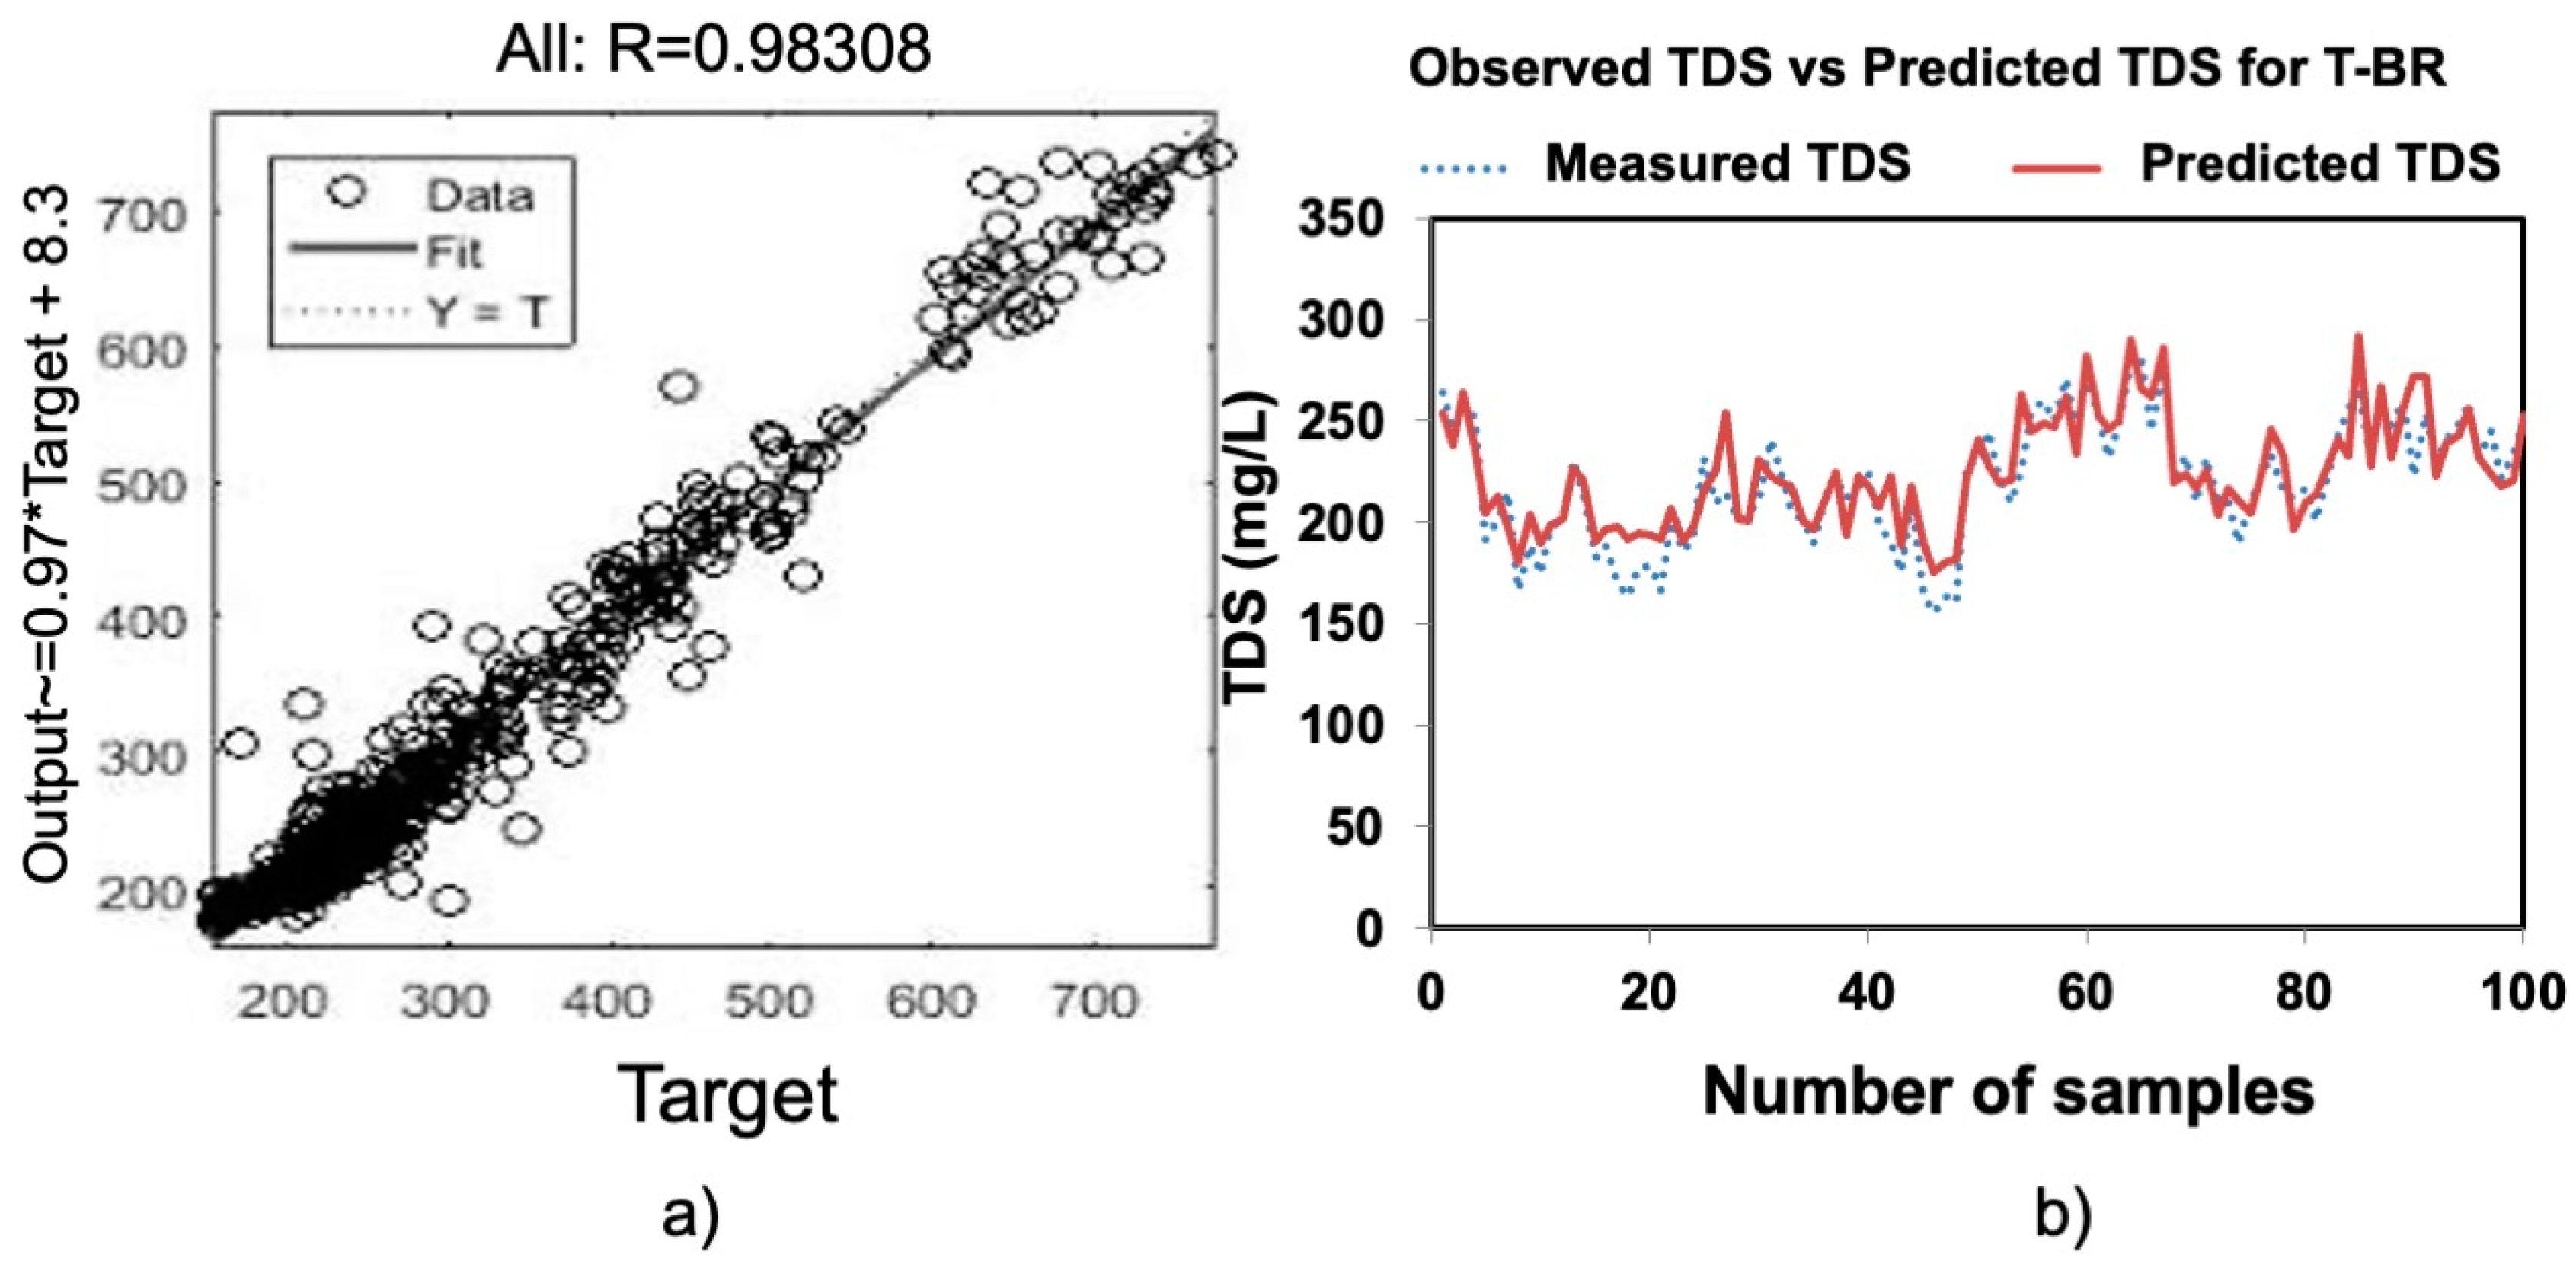
3.2. Prediction by ANN Model for Three Sub-Divisions

TDS was measured for the three algorithms, and after several trials, the best-optimized RMSE and r values were considered. For this reason, the three sub-divisions of Lahore exhibited different algorithm choices for different regions. Figure 4a exhibits the Lahore city sub-division results for observed and predicted TDS values with the goodness of fit value r to be approx. ~0.983. Figure 4b shows the actual observed data from the tubewells of several locations and predicted values provided by the ANN prediction model. The predicted values agreed that the ANN model did not exaggerate the dataset, and the predicted values were within the observation dataset. Bayesian regularization backpropagation (T-BR) was the best algorithm for the Lahore city subdivision. In Figure 4b, only 100 data points were shown to compare the difference between the two results out of 1200 data points.
Qishlaqi et al. [30] observed the field measurements and compared them with ANN for estimating water quality parameters, but they used calcium ion as the target compound. The maximum r-value of 0.85 was achieved in their study. Egbueri and Agbasi [31] used a comparison study of MLR and ANN on parameters such as pH, TDS, EC, total hardness, modified heavy metal index (MHMI), pollution load index (PLI), and synthetic pollution index (SPI) in their study to evaluate the groundwater quality. Their results indicated that for estimation of EC, TDS, and total hardness, MLR performed better than the ANN prediction model. If ANN can be optimized, it can be used in predicting the groundwater quality based on TDS, as in this study. Nasr and Zahran [32] evaluated TDS (salinity) based on one input parameter (pH) on groundwater data for irrigation purposes. In their results, the best suitable r-values were obtained, i.e., 0.64, 0.67, and 0.90 for training, validation, and testing, respectively, and can be used as a prediction model for water salinity.
Figure 5a indicates the r-value of Farrukhabad, which was approx. ~0.955. This indicates that the overall prediction model was successfully implemented on the training, validation, and testing dataset. Figure 5b shows the observed and predicted TDS value comparison. The Farrukhabad sub-division using Levenberg–Marquardt backpropagation (T-LM) supported the ANN model with the most optimization and minimum computation time. Therefore, the worked model has shown the output results in 2.01 s. If the model takes longer, the ANN model results might be compromised.
T-LM algorithm worked best for the Shahdara sub-division, as shown in Figure 6a, with an overall r-value of 0.88. Figure 6b shows the data points of 100 samples to compare measured and observed TDS values. An underestimation of the TDS parameter by ANN prediction was observed in the other two sub-divisions, i.e., Figure 4b and Figure 5b. Maedeh et al. [33] investigated the TDS parameter for the groundwater in Tehran Plain. They found that for their model, Levenberg–Marquardt (LM) was the most suitable algorithm with a higher r-value up to 0.96. Our study obtained the best model performance for T-BR and T-LM for three sub-divisions with the lowest RMSE and highest r values.

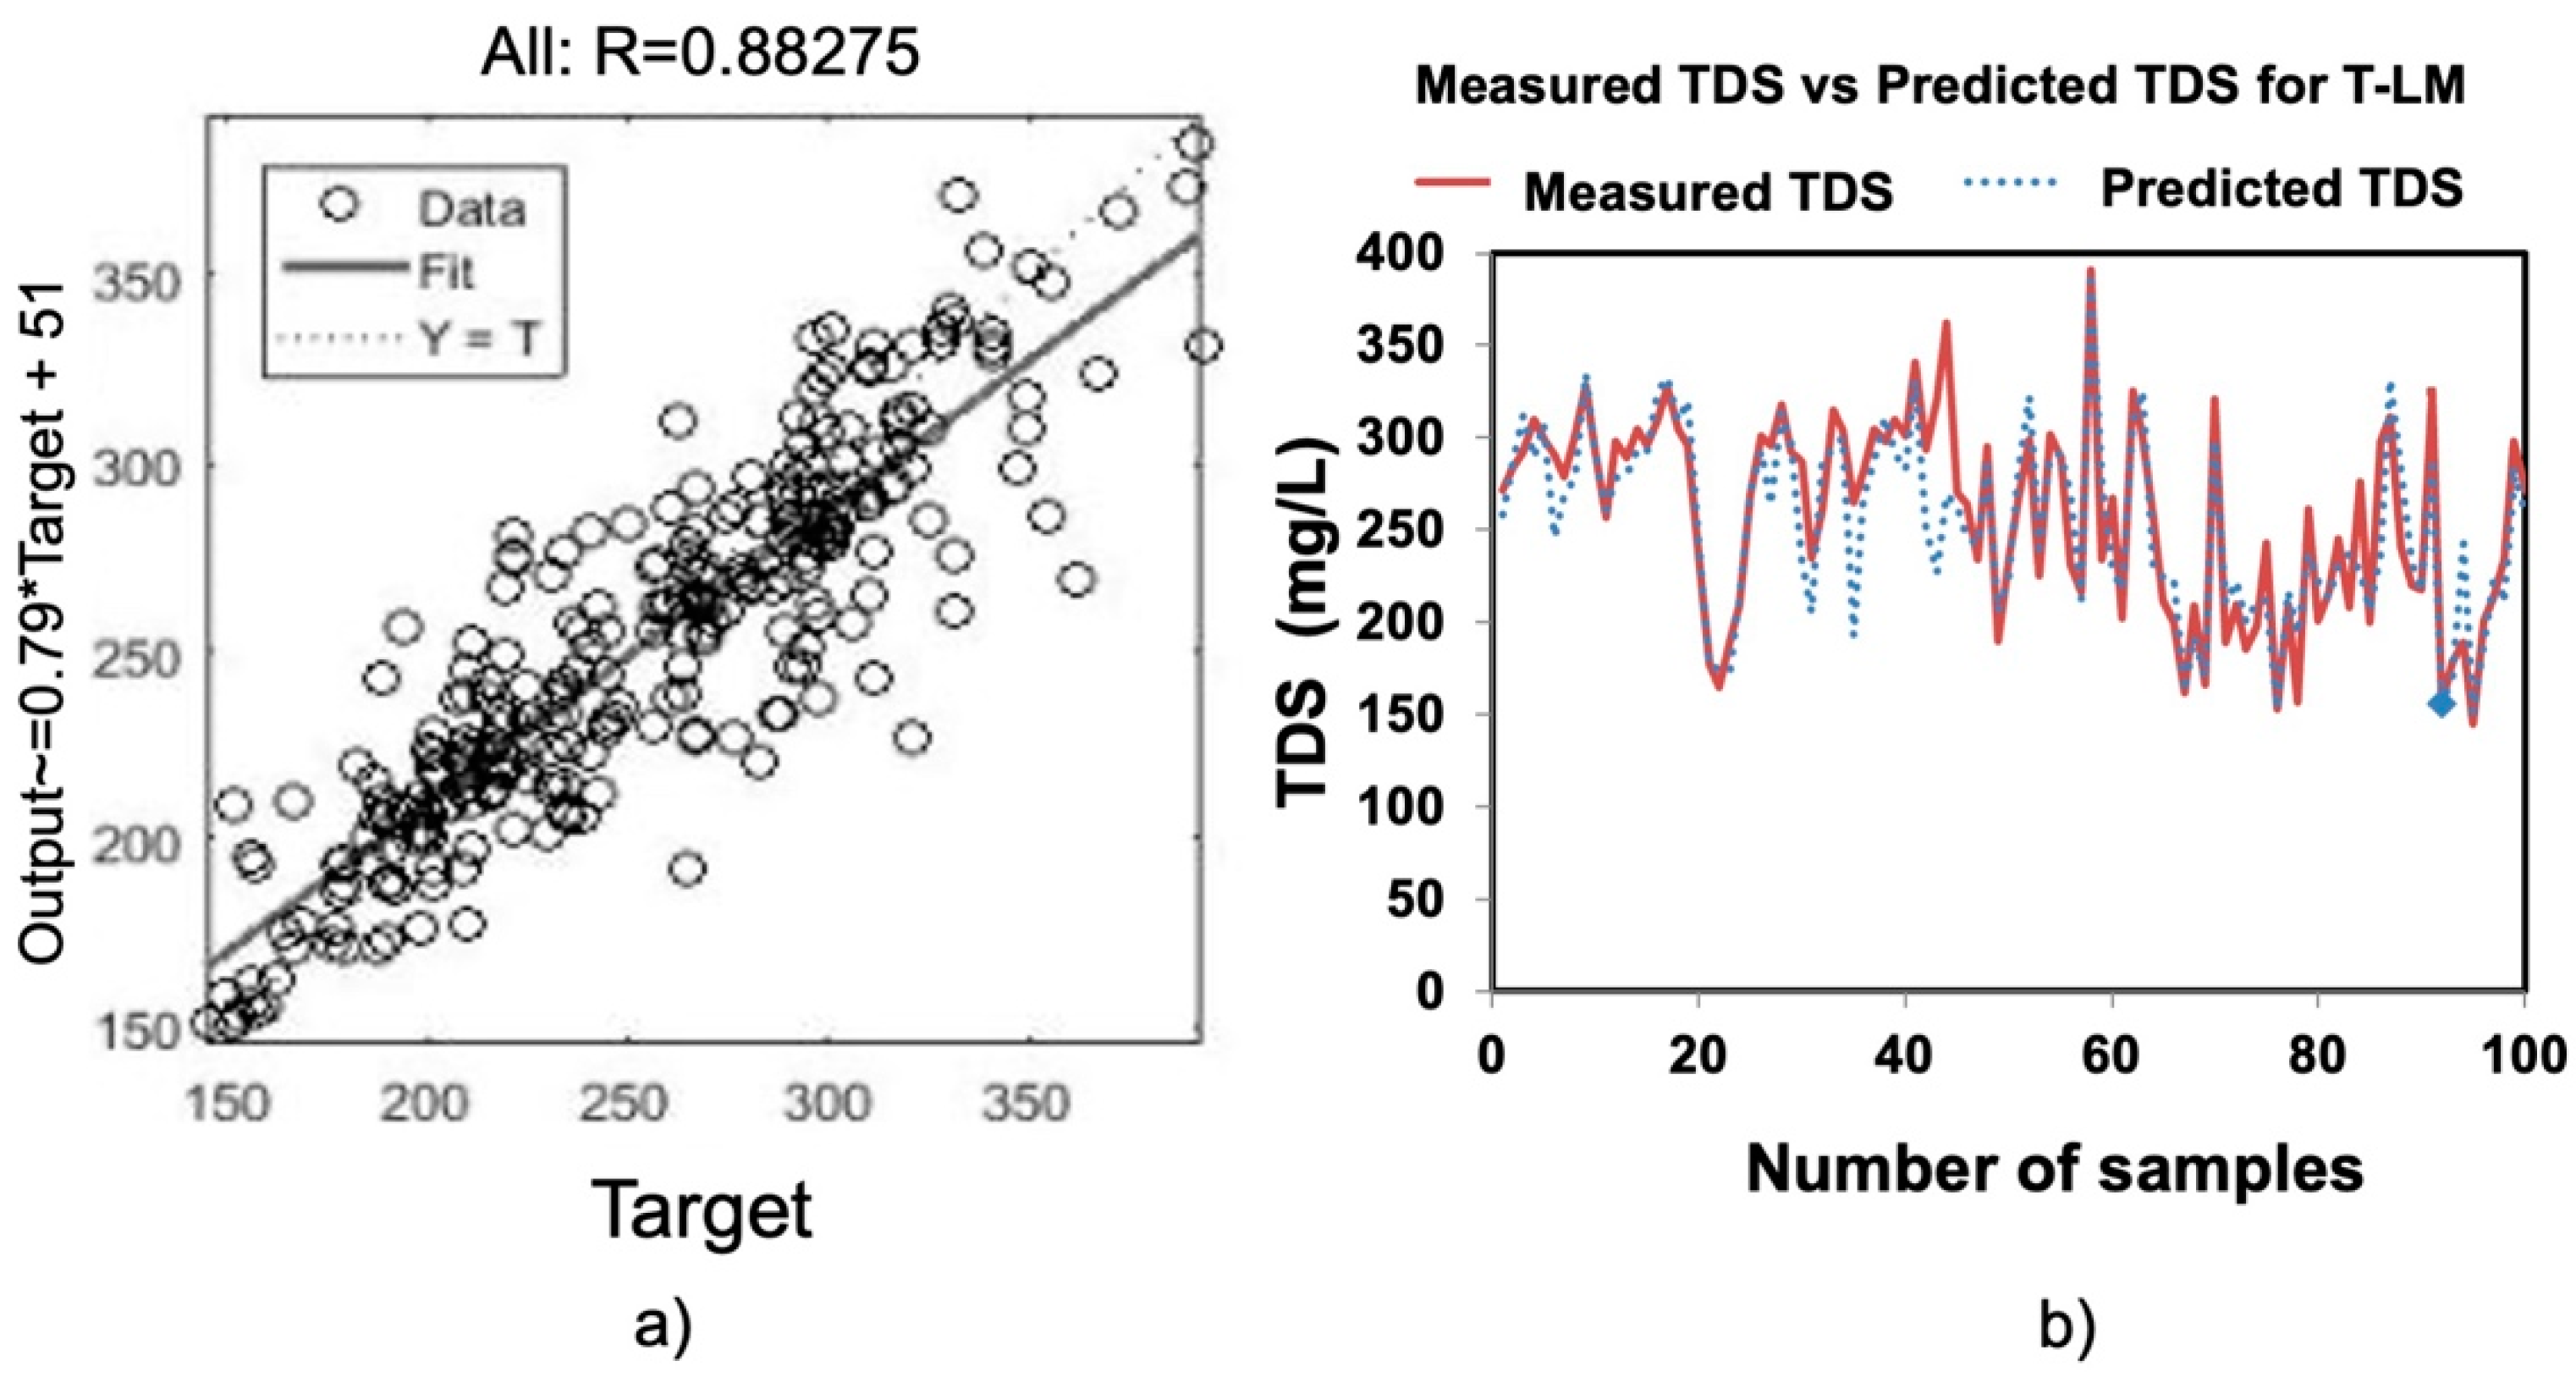
3.3. Prediction Using MLR

After the ANN, MLR was also performed for the same data to evaluate the efficiency of both tools for predictions. The MLR results were also evaluated based on the RMSE and r-value of the three sub-divisions of the study area, as shown in Table 2. In comparison to ANN, the MLR model consumed more computation time. The r-value for the city sub-division was 0.001 less than the r-value computed by ANN. For the Farrukhabad sub-division, the r-value from MLR was 0.941, while it was computed at 0.955 by ANN. Similarly, the Shahdara sub-division r-value was 0.860, and from ANN, it was 0.868.
A detailed representation of MLR results was shown in Supplementary Data in Figures S1–S3. Both models portrayed exceptional prediction of TDS values for the groundwater in the studied area. However, the ANN prediction can be considered better as there is the freedom to select hidden layers, transfer functions, algorithms, feedforward, and backpropagation methods of data. Therefore, a comprehensive study of parameters can better predict groundwater quality monitoring and assessment.

4. Research Limitation and Implication

The ANN results showed better performance in our study compared to MLR. However, it requires a validation and verification process to check the feasibility of models. The data-driven models require continuous data as input, and the model performance can be improved with time. After models get more accurate with time, water resource managers can only depend on the prediction models even if the real-time data is not available. Groundwater depletion may differ water quality parameters over time in the near future. Therefore, laboratory tests cannot be ignored completely. However, the frequency of sampling can be reduced once the prediction models get verified and validated through the data.
In this study, only three sub-divisions of Lahore were considered. However, a similar study for other parts of Lahore can also be performed to develop a large-scale prediction model for Lahore. There are many limitations in federal and regulatory departments. The most common limitations are the availability of the data. Mostly the government institutions are reluctant to share the data to make studies work on modeling. Similarly, implementation of models at the governmental scale can be an additional problem due to a lack of expertise in the fields. Therefore, the expertise in modeling can be improved as the reliability and adaptability of these tools will increase in organizations.

5. Conclusions

From the current study, the ANN model showed the Bayesian regularization (T-BR) as the best training algorithm for the City sub-division. For Farrukhabad and Shahdara sub-division, Lavenberg–Marquardt (T-LM) exhibited the best training algorithm for actual measured and normalized data sets. TDS prediction of City sub-division has shown better results of RMSE = 2.9% and coefficient of correlation r = 0.979 with best architecture of ANN 6-2-1 (input-hidden-output) MLP model. Farrukhabd sub-division was found with the lowest RMSE = 4.9% and r = 0.952 with the best architecture of ANN 6-10-1. Similarly, TDS prediction in the Shahadra sub-division has shown promising results with RMSE = 10.8% and a correlation coefficient of 0.869 with the suitable architecture of ANN 6-6-1. Contamination profile and dependent variables can vary in time in the dependence of distinct economic activities that can be initialized after establishing the predictive models. It is concluded that the results of RMSE and coefficient of correlation r of the ANN model for three sub-divisions have shown better performance than MLR. The validated ANN model for predicting groundwater quality parameter TDS is conducted with the actual measured TDS value for the year 2019 for the study area. The ANN model predicted TDS which was in close agreement with the actual observation of TDS. Hence, it is recommended to monitor the physicochemical parameters of groundwater quality using ANN as a forecasting tool. Similarly, in the same city of Lahore, different algorithms performed better in terms of performance and accuracy. For the management of water resources, ANN has been found as an efficient and time-saving modeling technique.

Supplementary Materials

The following supporting information can be downloaded at: https://0-www-mdpi-com.brum.beds.ac.uk/article/10.3390/w14132002/s1. Figure S1: MLR RMSE result of city sub-division; Figure S2: MLR RMSE result of Farrukhabad sub-division; Figure S3: MLR RMSE result of Shahdara sub-division; Table S1: Sampling frequency of selected ground water sources; Table S2: Results for 45 developed models of ANN for study area; Table S3: Predicted value of groundwater data from measured value of TDS.

Author Contributions

Conceptualization, M.U.F., M.I.J. and A.M.Z.; methodology, A.M.Z.; software, W.R.; validation, A.A.H., M.U.F., M.I.J. and A.M.Z.; formal analysis, W.R. and M.I.J.; investigation, W.R. and A.M.Z.; resources, W.R. and A.M.Z.; data curation, W.R.; writing—original draft preparation, W.R. and A.M.Z.; writing—review and editing, M.U.F., M.I.J. and A.A.H.; visualization, A.M.Z.; supervision, M.U.F.; project administration, A.A.H.; funding acquisition, A.A.H. All authors have read and agreed to the published version of the manuscript.

Funding

This work was supported by the National Water Center and United Arab Emirates University [grant number G00003661].

Institutional Review Board Statement

Not applicable.

Informed Consent Statement

Not applicable.

Data Availability Statement

Data will be available upon request to the corresponding author.

Acknowledgments

We thank Water and Sanitation Agency (WASA) Lahore for the data provision from 2012 to 2017.

Conflicts of Interest

The authors declare no conflict of interest.

References

  1. Chitsazan, M.; Rahmani, G.; Neyamadpour, A. Forecasting Groundwater Level by Artificial Neural Networks as an Alternative Approach to Groundwater Modeling. J. Geol. Soc. India 2015, 85, 98–106. [Google Scholar] [CrossRef]
  2. Khaki, M.; Yusoff, I.; Islami, N.; Hussin, N.H. Artificial Neural Network Technique for Modeling of Groundwater Level in Langat Basin, Malaysia. Sains Malays. 2016, 45, 19–28. [Google Scholar]
  3. Baird, R.B. Standard Methods for the Examination of Water and Wastewater, 23rd ed.; Water Environment Federation: Alexandria, VA, USA; American Public Health Association: Washington, DC, USA, 2017. [Google Scholar]
  4. Sakizadeh, M. Artificial Intelligence for the Prediction of Water Quality Index in Groundwater Systems. Model. Earth Syst. Environ. 2016, 2, 8. [Google Scholar] [CrossRef]
  5. Lohani, A.K.; Krishan, G. Application of Artificial Neural Network for Groundwater Level Simulation in Amritsar and Gurdaspur Districts of Punjab, India. J. Earth Sci. Clim. Chang. 2015, 6, 1. [Google Scholar]
  6. Lohani, A.K.; Goel, N.K.; Bhatia, K.K.S. Improving Real Time Flood Forecasting Using Fuzzy Inference System. J. Hydrol. 2014, 509, 25–41. [Google Scholar] [CrossRef]
  7. Agarwal, A.; Lohani, A.K.; Singh, R.D.; Kasiviswanathan, K.S. Radial Basis Artificial Neural Network Models and Comparative Performance. J. Indian Water Resour. Soc. 2013, 33, 1–8. [Google Scholar]
  8. Lohani, A.K.; Kumar, R.; Singh, R.D. Hydrological Time Series Modeling: A Comparison between Adaptive Neuro-Fuzzy, Neural Network and Autoregressive Techniques. J. Hydrol. 2012, 442, 23–35. [Google Scholar] [CrossRef]
  9. Lohani, A.K.; Goel, N.K.; Bhatia, K.K.S. Comparative Study of Neural Network, Fuzzy Logic and Linear Transfer Function Techniques in Daily Rainfall-runoff Modelling under Different Input Domains. Hydrol. Processes 2011, 25, 175–193. [Google Scholar] [CrossRef]
  10. Kheradpisheh, Z.; Talebi, A.; Rafati, L.; Ghaneian, M.T.; Ehrampoush, M.H. Groundwater Quality Assessment Using Artificial Neural Network: A Case Study of Bahabad Plain, Yazd, Iran. Desert 2015, 20, 65–71. [Google Scholar]
  11. Wagh, V.M.; Panaskar, D.B.; Muley, A.A.; Mukate, S.V.; Lolage, Y.P.; Aamalawar, M.L. Prediction of Groundwater Suitability for Irrigation Using Artificial Neural Network Model: A Case Study of Nanded Tehsil, Maharashtra, India. Model. Earth Syst. Environ. 2016, 2, 1–10. [Google Scholar] [CrossRef]
  12. Zare Abyaneh, H. Evaluation of Multivariate Linear Regression and Artificial Neural Networks in Prediction of Water Quality Parameters. J. Environ. Health Sci. Eng. 2014, 12, 40. [Google Scholar] [CrossRef] [PubMed] [Green Version]
  13. Chou, J.-S.; Ho, C.-C.; Hoang, H.-S. Determining Quality of Water in Reservoir Using Machine Learning. Ecol. Inform. 2018, 44, 57–75. [Google Scholar] [CrossRef]
  14. Xu, T.; Coco, G.; Neale, M. A Predictive Model of Recreational Water Quality Based on Adaptive Synthetic Sampling Algorithms and Machine Learning. Water Res. 2020, 177, 115788. [Google Scholar] [CrossRef] [PubMed]
  15. Mojid, M.A.; Hossain, A.B.M.Z. Comparative Performance of Multiple Linear Regression and Artificial Neural Network Models in Estimating Solute-Transport Parameters. SAINS TANAH-J. Soil Sci. Agroclimatol. 2021, 18, 27–35. [Google Scholar] [CrossRef]
  16. Aldhyani, T.H.H.; Al-Yaari, M.; Alkahtani, H.; Maashi, M. Water Quality Prediction Using Artificial Intelligence Algorithms. Appl. Bionics Biomech. 2020, 2020, 6659314. [Google Scholar] [CrossRef]
  17. Sabir, M. Patterns of Distribution of Population in South Asia: A Study of Pakistan (1972–1981). J. Indian Stud. 2016, 2, 55–74. [Google Scholar]
  18. Jimeno-Sáez, P.; Senent-Aparicio, J.; Cecilia, J.M.; Pérez-Sánchez, J. Using Machine-Learning Algorithms for Eutrophication Modeling: Case Study of Mar Menor Lagoon (Spain). Int. J. Environ. Res. Public Health 2020, 17, 1189. [Google Scholar] [CrossRef] [Green Version]
  19. Fogelman, S.; Zhao, H.; Blumenstein, M.; Zhang, S. Estimation of Oxygen Demand Levels Using UV–Vis Spectroscopy and Artificial Neural Networks as an Effective Tool for Real-Time, Wastewater Treatment Control. In Proceedings of the 1st Australian Young Water Professionals Conference, Sydney, Australia, 15–17 February 2006; pp. 15–17. [Google Scholar]
  20. Zaqoot, H.A.; Hamada, M.; Miqdad, S. A Comparative Study of Ann for Predicting Nitrate Concentration in Groundwater Wells in the Southern Area of Gaza Strip. Appl. Artif. Intell. 2018, 32, 727–744. [Google Scholar] [CrossRef]
  21. Leahy, P.; Kiely, G.; Corcoran, G. Structural Optimisation and Input Selection of an Artificial Neural Network for River Level Prediction. J. Hydrol. 2008, 355, 192–201. [Google Scholar] [CrossRef]
  22. Mosavi, A.; Ozturk, P.; Chau, K. Flood Prediction Using Machine Learning Models: Literature Review. Water 2018, 10, 1536. [Google Scholar] [CrossRef] [Green Version]
  23. Karami, H.; Ghazvinian, H.; Dehghanipour, M.; Ferdosian, M. Investigating the Performance of Neural Network Based Group Method of Data Handling to Pan’s Daily Evaporation Estimation (Case Study: Garmsar City). J. Soft Comput. Civ. Eng. 2021, 5, 1–18. [Google Scholar]
  24. Patle, G.T.; Chettri, M.; Jhajharia, D. Monthly Pan Evaporation Modelling Using Multiple Linear Regression and Artificial Neural Network Techniques. Water Supply 2020, 20, 800–808. [Google Scholar] [CrossRef]
  25. Dehghanipour, M.H.; Karami, H.; Ghazvinian, H.; Kalantari, Z.; Dehghanipour, A.H. Two Comprehensive and Practical Methods for Simulating Pan Evaporation under Different Climatic Conditions in Iran. Water 2021, 13, 2814. [Google Scholar] [CrossRef]
  26. Chen, N.; Li, X.; Shi, H.; Hu, Q.; Zhang, Y.; Hou, C.; Liu, Y. Modeling Evapotranspiration and Evaporation in Corn/Tomato Intercropping Ecosystem Using a Modified ERIN Model Considering Plastic Film Mulching. Agric. Water Manag. 2022, 260, 107286. [Google Scholar] [CrossRef]
  27. Dawson, C.W.; Abrahart, R.J.; Shamseldin, A.Y.; Wilby, R.L. Flood Estimation at Ungauged Sites Using Artificial Neural Networks. J. Hydrol. 2006, 319, 391–409. [Google Scholar] [CrossRef] [Green Version]
  28. Razi, M.A.; Athappilly, K. A Comparative Predictive Analysis of Neural Networks (NNs), Nonlinear Regression and Classification and Regression Tree (CART) Models. Expert Syst. Appl. 2005, 29, 65–74. [Google Scholar] [CrossRef]
  29. Khatri, N.; Khatri, K.K.; Sharma, A. Prediction of Effluent Quality in ICEAS-Sequential Batch Reactor Using Feedforward Artificial Neural Network. Water Sci. Technol. 2019, 80, 213–222. [Google Scholar] [CrossRef]
  30. Qishlaqi, A.; Kordian, S.; Parsaie, A. Field Measurements and Neural Network Modeling of Water Quality Parameters. Appl. Water Sci. 2017, 7, 523. [Google Scholar] [CrossRef] [Green Version]
  31. Egbueri, J.C.; Agbasi, J.C. Data-Driven Soft Computing Modeling of Groundwater Quality Parameters in Southeast Nigeria: Comparing the Performances of Different Algorithms. Environ. Sci. Pollut. Res. 2022, 29, 38346–38373. [Google Scholar] [CrossRef]
  32. Nasr, M.; Zahran, H.F. Using of PH as a Tool to Predict Salinity of Groundwater for Irrigation Purpose Using Artificial Neural Network. Egypt. J. Aquat. Res. 2014, 40, 111–115. [Google Scholar] [CrossRef] [Green Version]
  33. Maedeh, P.A.; Mehrdadi, N.; Bidhendi, G.R.N.; Abyaneh, H.Z. Application of Artificial Neural Network to Predict Total Dissolved Solids Variations in Groundwater of Tehran Plain, Iran. Int. J. Environ. Sustain. 2013, 2, 10–20. [Google Scholar]
Figure 1. (a) Map of Lahore districts, (b) map of Pakistan, (c) three sub-divisions used in this study, and (d) identification of tubewell on the city sub-division of Lahore.
Water 14 02002 g001
Figure 2. ANN architecture was used in this study with three layers as; (a) input layer, (b) hidden layer, and (c) output layer.
Water 14 02002 g002
Figure 3. Comparison analysis of convergence speeds for the three algorithms (Tables S2 and S3), i.e., T-BR, T-LM, and T-SCG, based on several neurons during the validation phase by correlation coefficient (r) in (a,c,e) and root mean squared error (RMSE) in (b,d,f).
Water 14 02002 g003
Figure 4. (a) Overall prediction dataset for TDS of the Lahore city sub-division and (b) comparison of measured and predicted TDS values.
Water 14 02002 g004
Figure 5. (a) Overall prediction dataset for TDS of the Farrukhabad sub-division and (b) comparison of measured and predicted TDS values.
Water 14 02002 g005
Figure 6. (a) Overall prediction dataset for TDS of the Shahadara sub-division and (b) comparison of measured and predicted TDS values.
Water 14 02002 g006
Table 1. Selected groundwater sources.
Sr. No.Name of Sub-DivisionNo. of Sources
1City25
2Farrukhabad14
3Shahdara11
Total50
Table 2. Multiple linear regression (MLR) analysis of the groundwater data obtained from three sub-divisions of Lahore.
Sr. No.Name of Sub-DivisionRMSEr
1City4.5%0.978
2Farrukhabad5.5%0.941
3Shahdara11.3%0.860
Publisher’s Note: MDPI stays neutral with regard to jurisdictional claims in published maps and institutional affiliations.

