Article

Bismuth-Chitosan Nanocomposite Sensors for Trace Level Detection of Ni(II) and Co(II) in Water Samples

by
Mohsen Pilevar
1,
Jae-Hoon Hwang
1,
Jordan Stanberry
2,
Vasileios Anagnostopoulos
2,
Karin Chumbimuni-Torres
2 and
Woo Hyoung Lee
1,*
1
Department of Civil, Environmental, and Construction Engineering, University of Central Florida, Orlando, FL 32816, USA
2
Department of Chemistry, University of Central Florida, Orlando, FL 32816, USA
*
Author to whom correspondence should be addressed.
Submission received: 14 December 2021 / Revised: 14 January 2022 / Accepted: 17 January 2022 / Published: 20 January 2022

Abstract

:
Trace minerals play an essential role in methane production via anaerobic digestion (AD). It is important to monitor Ni(II) and Co(II) concentrations and the Ni/Co concentration ratio for the rapid diagnosis of the ecological status or activity of methanogens in AD. Electrochemical detection of Ni(II) and Co(II) was investigated by coating the Bi-chitosan nanocomposite on a glassy carbon electrode (GCE) via the electrodeposition technique. A square-wave adsorptive cathodic stripping voltammetry technique (SWAdCSV) was applied and optimized when dimethylglyoxime (DMG) was used as the chelating agent for Ni(II) and Co(II) measurements. The SWAdCSV results showed that the current peaks for Co(II) detection are 6.1 times greater than the current peaks for Ni(II) measurements, probably due to the different affinity of DMG molecules between Ni(II) and Co(II). DMG molecules demonstrated higher selectivity toward Co(II) cations compared to Ni(II). The modified Bi-chitosan GCE developed in this study showed a relatively wide range of the Ni(II) and Co(II) concentrations (2–100 µg L−1) with a limit of detection of 3.6 µg L−1 for Ni(II) and 2.4 µg L−1 for Co(II), respectively. The developed sensor was applied to Ni(II) and Co(II) spiked natural water samples and showed good performance of detection with 12 consecutive measurements. Overall, the fabricated sensor showed excellent sensitivity toward Ni(II) and Co(II) in natural water samples.

1. Introduction

Ni and Co are well-known essential trace minerals for methane production in anaerobic digestion (AD). Many studies have investigated the effect of these trace metals (i.e., Ni(II) and Co(II)) supplementation on methane production yield in AD processes [1,2,3,4,5,6]. Although their concentrations highly depend on the substrate type, operating temperature (mesophilic or thermophilic), digestion operating mode (mono or co-digestion), and the type of methanogens, the typical concentrations of Ni(II) and Co(II) in anaerobic digesters are between 0.2 to 2 mg L−1 for Ni(II), and 0.1 to 5 mg L−1 for Co(II), respectively [3]. On the other hand, Ni(II) and Co(II) can also be utilized by sulfate-reducing bacteria (SRB) in AD systems which produce H2S as a byproduct, thus deteriorating methanogenesis [7]. The competition between SRB and methanogens can inhibit methanogenesis, suppressing methane production under the dominant SRB condition [8]. It has been reported that the optimal methane yield is typically obtained at a Ni/Co ratio of 1 [1], or in some cases at 5 [2]. Thus, it is important to monitor Ni(II) and Co(II) concentrations and the Ni/Co concentration ratio for the rapid diagnosis of the ecological status or activity of methanogens in AD.
Inductively coupled plasma mass spectrometry (ICP-MS), atomic absorption spectrometry (AAS), and flame atomic absorption spectrometry (FAAS) are the most common methods used for Ni(II) and Co(II) detection [9]. However, they often require sophisticated, large, and expensive instruments, highly trained technicians, transportation of samples to centralized laboratories for analyses, and considerably time-consuming efforts. Electrochemical methods can often provide an alternative for heavy metal detection, as they are fast, simple, and reliable methods, and suitable for field applications [10,11]. Among them, the stripping voltammetry technique is known for in situ detection of heavy metal ions with high sensitivity and a limit of detection (LOD) in the order of 10−9 to 10−12 mol L−1 [12,13]. In particular, the anodic stripping voltammetry (ASV) technique has been widely used to detect various heavy metal ions, including Pb, Zn, and Hg [10,14,15]. The ASV technique relies on the formation of amalgams of heavy metal ions on the surface of a working electrode at a certain negative deposition potential. Target heavy metal ions are released from amalgams into the electrolyte when ASV is applied on the working electrode, generating associated current peaks which are proportional to the heavy metal ion concentrations. However, when the analyte reacts irreversibly or forms intermetallic compounds, or is unable to form an amalgam, such as Ni(II) and Co(II) [16,17,18], the ASV technique is less effective for trace metal measurements. In addition, the ASV method could face some limitations when dealing with metal ions with similar redox potentials. For example, Ni(II) and Co(II) have very close redox potential values (e.g., −0.26 V for Ni(II) and −0.28 V for Co(II) [19]) which make it difficult to measure them simultaneously due to overlapped peaks during ASV measurements.
The adsorptive cathodic stripping voltammetry technique (AdCSV) can be an alternative approach to detecting heavy metal ions which rely on the formation of target metal complexes with a chelating agent on the surface of the working electrode [20,21]. During the stripping voltammetry measurements, the complexes are accumulated onto the surface of the working electrode. Several metal ions, such as vanadium [22], molybdenum [23], nickel, and cobalt [24] have been successfully detected by the AdCSV technique. For Ni(II) and Co(II) measurements, it has been reported that Ni(II) and Co(II) demonstrate different potential windows when they form a complex with the chelating agent [25]. Dimethylglyoxime (DMG) [26] and nioxime [27] have been used as chelating agents that can form complexes with Ni(II) and Co(II). Among them, DMG is one of the most commonly used ligands coordinating nickel and cobalt ions, forming Ni(II)-DMG and Co(II)-DMG complexes due to its sensitivity and stability [28,29].
The hanging mercury drop electrode (HMDE) and mercury film electrode (MFE) were the first working electrodes used in AdCSV for trace metal measurements [30]. However, hazardous environmental effects of metallic mercury and mercury salts increased the demand for less toxic substrates that could offer comparable performance to MFEs in the case of stripping voltammetry measurements [31]. Bismuth (Bi) has been used as a replacement for the Hg electrode due to its environmentally benign nature [32]. Bismuth film electrodes (BiFEs), coated by ex situ [33,34,35] and in situ electroplating techniques [27,36], have been widely used for the detection of Ni(II) and Co(II) in water. Gold electrodes (AuEs) [37] have also been used for Ni(II) and Co(II) detection using the AdCSV technique. However, some of the reported electrodes (e.g., Nafion-graphene dimethylglyoxime modified GCE) are complicated to fabricate [38]. Moreover, one of the major challenges associated with the electrochemical detection of Ni(II) and Co(II) using AdCSV is a relatively narrow linear range of sensors (up to 10 or 20 µg L−1) [29,31].
In this study, a Bi-chitosan nanocomposite sensor was newly fabricated for trace level detection of Ni(II) and Co(II) in water using AdCSV. To improve the working range of Ni(II) and Co(II) detection, while keeping the LOD low, chitosan as a biopolymer was integrated into Bi-film due to its excellent film-forming ability and adhesion [39]. The chitosan was electrochemically co-deposited with Bi, which simplifies the fabrication step. The developed sensor was then characterized to investigate electron transfer properties. The operational parameters for AdCSV, such as deposition potential, frequency, amplitude, and deposition time were evaluated for both Ni(II) and Co(II) detection under various conditions. The optimal DMG concentration was also determined to improve the sensitivity toward Ni(II) and Co(II). Possible interference of other heavy metals on sensor performance was evaluated, and finally, the developed sensor was applied to natural water samples to evaluate field applicability. The developed sensor can be applied for Ni(II) and Co(II) measurements in real AD samples to further assess the microbial activity of methanogens in AD.

2. Experimental Section

2.1. Chemicals and Reagents

All chemicals in this study, including Ni (SN70-100) and Co (AA88060AE) standard stock solutions (1000 mg L−1), were of analytical reagent grade and purchased from Thermo Fisher Scientific. Deionized (DI) water was used for the preparation of the solutions. In a preliminary test, there was no stripping current peak observed with nioxime as a chelating agent, and thus, this study focused on the optimization of Ni(II) and Co(II) detection using DMG. A 0.1 M solution of DMG (18-610-242, Thermo Scientific. Waltham, MA, USA) was prepared by dissolving an appropriate amount of DMG in 70% ethanol. 0.1 M ammonia buffer solution (pH 9.2, NH4Cl) was used as the supporting electrolyte for Ni and Co measurements [40].

2.2. Apparatus

All electrochemical measurements were conducted using an electrochemical analyzer (CH Instruments, Inc., Austin, TX, USA). A three-electrode electrochemical configuration was used for all the measurements. An Ag/AgCl electrode (NC9753402, CH Instruments) was used as the reference electrode, and a platinum wire (NC9918143, CH Instruments) was used as the counter electrode, respectively. All the experiments were conducted in a 5 mL voltammetric cell (CHI220, CH Instruments) at room temperature (Figure S1). N2 gas was bubbled to provide stirring and deoxygenation conditions during the deposition step.
Electrochemical impedance spectroscopy (EIS) measurements were performed using a potentiostat (PalmSens4, PalmSens BV, Houten, the Netherlands) to evaluate the charge transfer resistance at the electrode/electrolyte interface. All EIS measurements were carried out by a three-electrode system under a polarization potential of −400 mV vs. Ag/AgCl, in the presence of a 10 mM potassium ferricyanide (K3[Fe(CN)6]) with a frequency range of 0.1 to 100,000 Hz [11]. Ni(II) and Co(II) concentrations in test samples were validated using a single quadrupole ICP-MS (iCAP-RQ, Thermo Scientific, Waltham, MA, USA) [11].

2.3. Fabrication of Bi-Chitosan Modified GCE Sensor

A glassy carbon electrode (GCE) was used for Bi-chitosan film fabrication. First, a Bi-chitosan electroplating solution was prepared by dissolving 0.1 M Bi nitrate (Bi(NO3)3) and 24 mg of chitosan powder (18-601-571, Thermo Scientific. Waltham, MA, USA) in 20 mL of 0.1 M acetic acid (pH 4.5) [11]. The solution was continuously stirred for 24 h to ensure a well-mixed condition. The GCE (3 mm in diameter, CH Instruments) was polished with slurries of alumina powder (1, 0.3, and 0.05 µm) (4010081, Buehler, Lake Bluff, IL, USA) and rinsed with DI water. Next, it was cleaned using a sonicator (Branson 2800, Branson Ultrasonics, Brookfield, CT, USA) for 2 min in ethanol and ultra-pure water. Then, it was left to dry for 2 h at room temperature prior to the electroplating step. The electrodeposition of Bi and chitosan on the polished GCE as a working electrode was conducted using a potentiostat (PalmSens4, PalmSens BV) with the PSTrace 5.8 software at −100 mA cm−2 for 60 s under stirring. The final Bi-chitosan nanocomposite GCE sensor was left to dry and stored under ambient conditions before use. As a control GCE sensor, a chitosan-modified GCE was prepared by following the same electroplating procedure with the fabrication of Bi-chitosan-GCE excluding Bi only.

2.4. SWAdCSV Analysis

For the electrochemical Ni(II) and Co(II) detection using the developed Bi-chitosan-GCE sensor, the square-wave adsorptive cathodic stripping voltammetry technique (SWAdCSV) was performed using an electrochemical analyzer (CH Instruments, Inc.). A 5 mL of 0.1 M ammonia buffer (pH 9.2) was used as the supporting electrolyte solution. Five different concentrations of DMG (0.01, 0.04, 0.1, 0.2, and 0.5 mM) were evaluated to determine the optimal concentration as a chelating agent in the test solution. For SWAdCSV, a deposition potential was applied for an initial deposition time of 90 s under deoxygenation and stirring (N2(g) bubbling). The N2 gas bubbling was then stopped for the equilibrium step (e.g., 15 s) and the SWAdCSV was then conducted by applying a negative direction square-wave scan from −0.7 to −1.2 V under different SWAdCSV operational parameters (e.g., frequency, amplitude, and step potential) [40]. Between measurements, the sensor was cleaned by applying −1.0 V and −1.3 V for Ni(II) and Co(II) measurements, respectively, for 60 s to remove remnants of metal-DMG complexes that may have been deposited on the electrode surface in the previous measurement. The cleaning step showed no effect on the reproducibility of the sensor. All measurements were conducted in triplicate, and data were expressed in terms of the mean ± standard deviation (SD). LOD was calculated using the following Equation (1) [41]:
CL = 3 × SB/b
where CL is the detection limit (µg L−1), SB signifies the standard deviation of blank signals, and b is the slope of the calibration curves, which is known as the sensor sensitivity (µA (µg L−1)−1).

3. Results and Discussion

3.1. Metal-DMG Complex Formation and Reduction in SWAdCSV Analysis

The formation of the Ni-DMG and Co-DMG complex is known as the chelation reaction, in which electron pairs are donated to the metal cations by nitrogen atoms of the DMG molecule (Figure S2) [29,38]. Consequently, one proton will be detached from the oxime group (RR′C = NOH) on each of the DMG molecules (Equation (2), where M represents Ni or Co). Afterward, the metal-DMG complexes will be adsorbed on the surface of the working electrode (Equation (3)) [42]. At pH values lower than 5, a disturbance in the equilibrium of the reaction can occur, causing the dissolution of the metal-DMG complexes [43,44]. Hence, it is important to maintain a pH above 5 for the chelation reaction [43].
The electrochemical detection of Ni(II) and Co(II) via the SWAdCSV technique consists of two steps: accumulation (Equation (3)) and reduction (followed by stripping) (Equation (4)). The subsequent electrochemical reduction of the metal-DMG complex involves overall reduction of both the central metal ions (Ni(II) or Co(II)) and the surrounding ligands in a reduction process (Equation (4)) giving rise to 2,3 bis-hydroxylamine-butane (DHAB), known as the products of DMG reduction. In contrast to the square-wave anodic stripping voltammetry (SWASV) technique, the stripping step in the SWAdCSV technique is a result of the reduction of the adsorbed metal-DMG complex, leading to the departure of both central metal ions (Ni(II) or Co(II)) and ligands from the complex (Equation (4)) [45].
  M 2 + + 2 ( DMG ) H 2   + 2 OH [ M ( ( DMG ) H ) 2 ] + 2 H 2 O
[ M ( ( DMG ) H ) 2 ] [ M ( ( DMG ) H ) 2 ] adsorbed  
[ M ( ( DMG ) H ) 2 ] adsorbed + 10 e + 10 H +   M 0 + 2 DHAB
Each metal-DMG complex is composed of one central metal (Ni(II) or Co(II)) connected to two glyoxime ligands (Figure S2b) [38]. Ma et al. (1997) suggested that the reduction of the metal-DMG complex (Equation (4)) consists of two steps [45]: the reduction of the central metal ion, requiring two electrons, and the reduction of glyoxime ligands, requiring eight electrons (four electrons for each of two glyoxime ligands) (Figure S2b) [46]. Therefore, 10 electrons are needed for the reduction of a metal-DMG complex (Equation (4)).

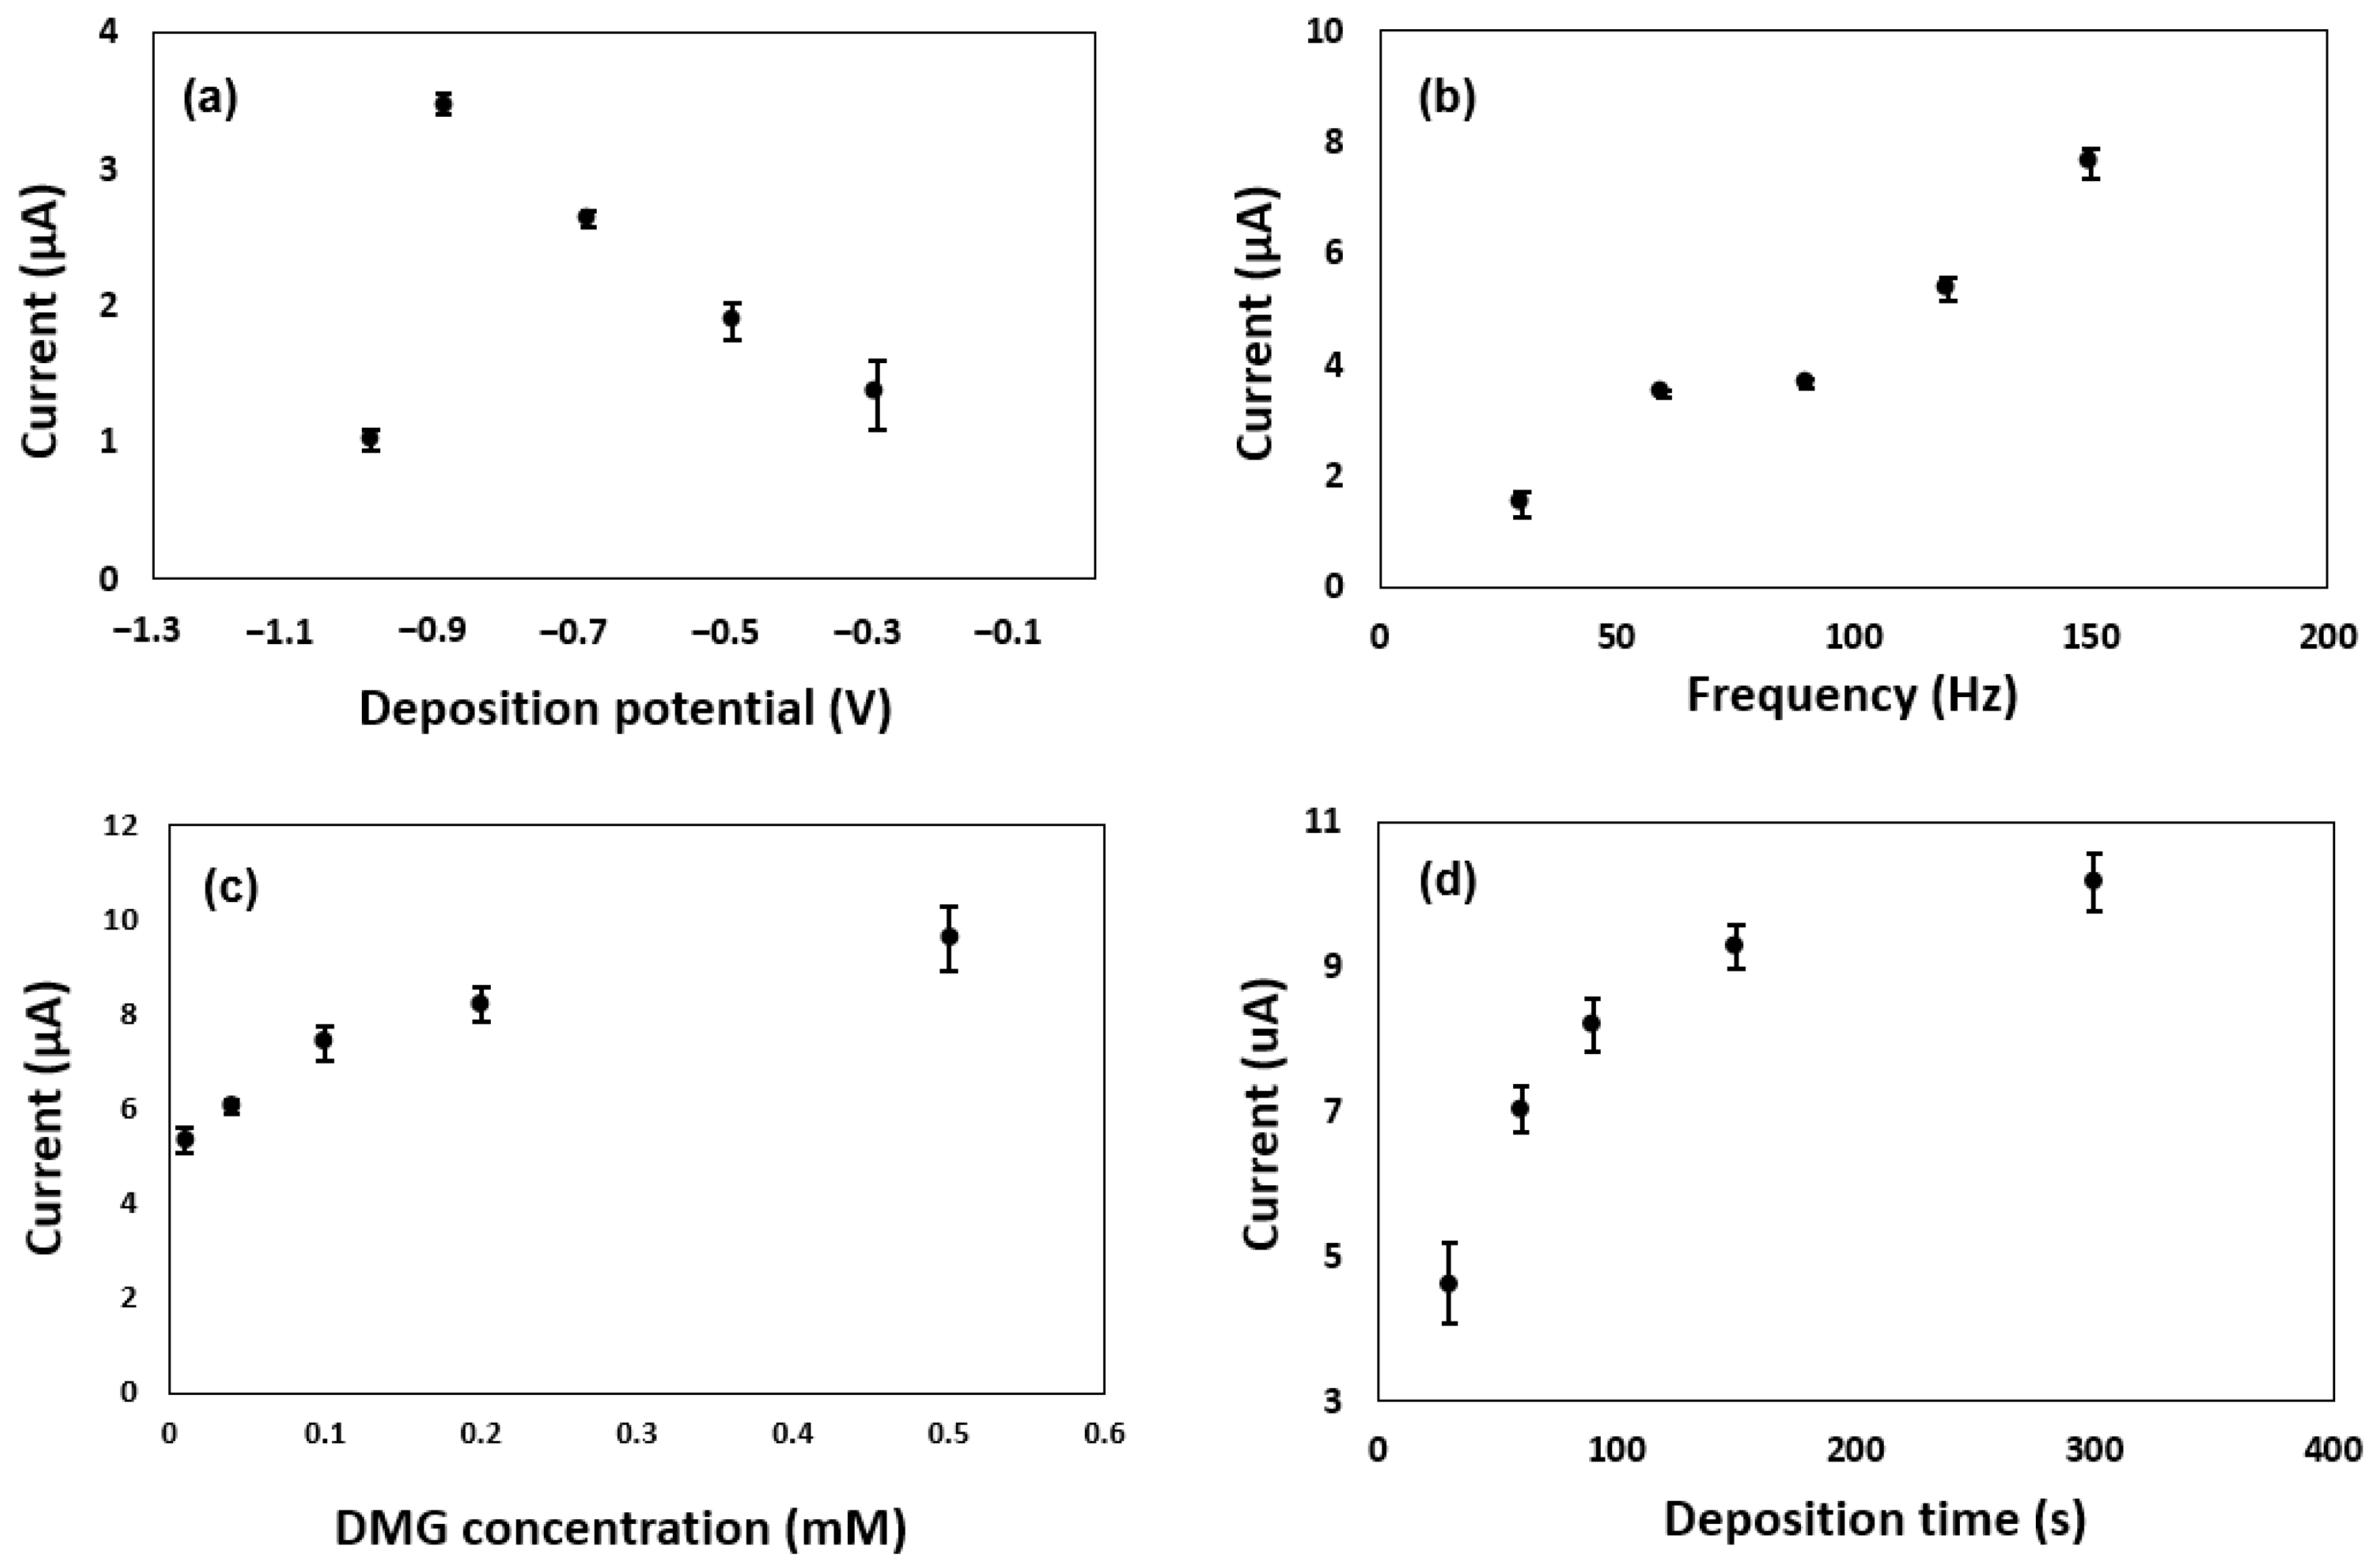
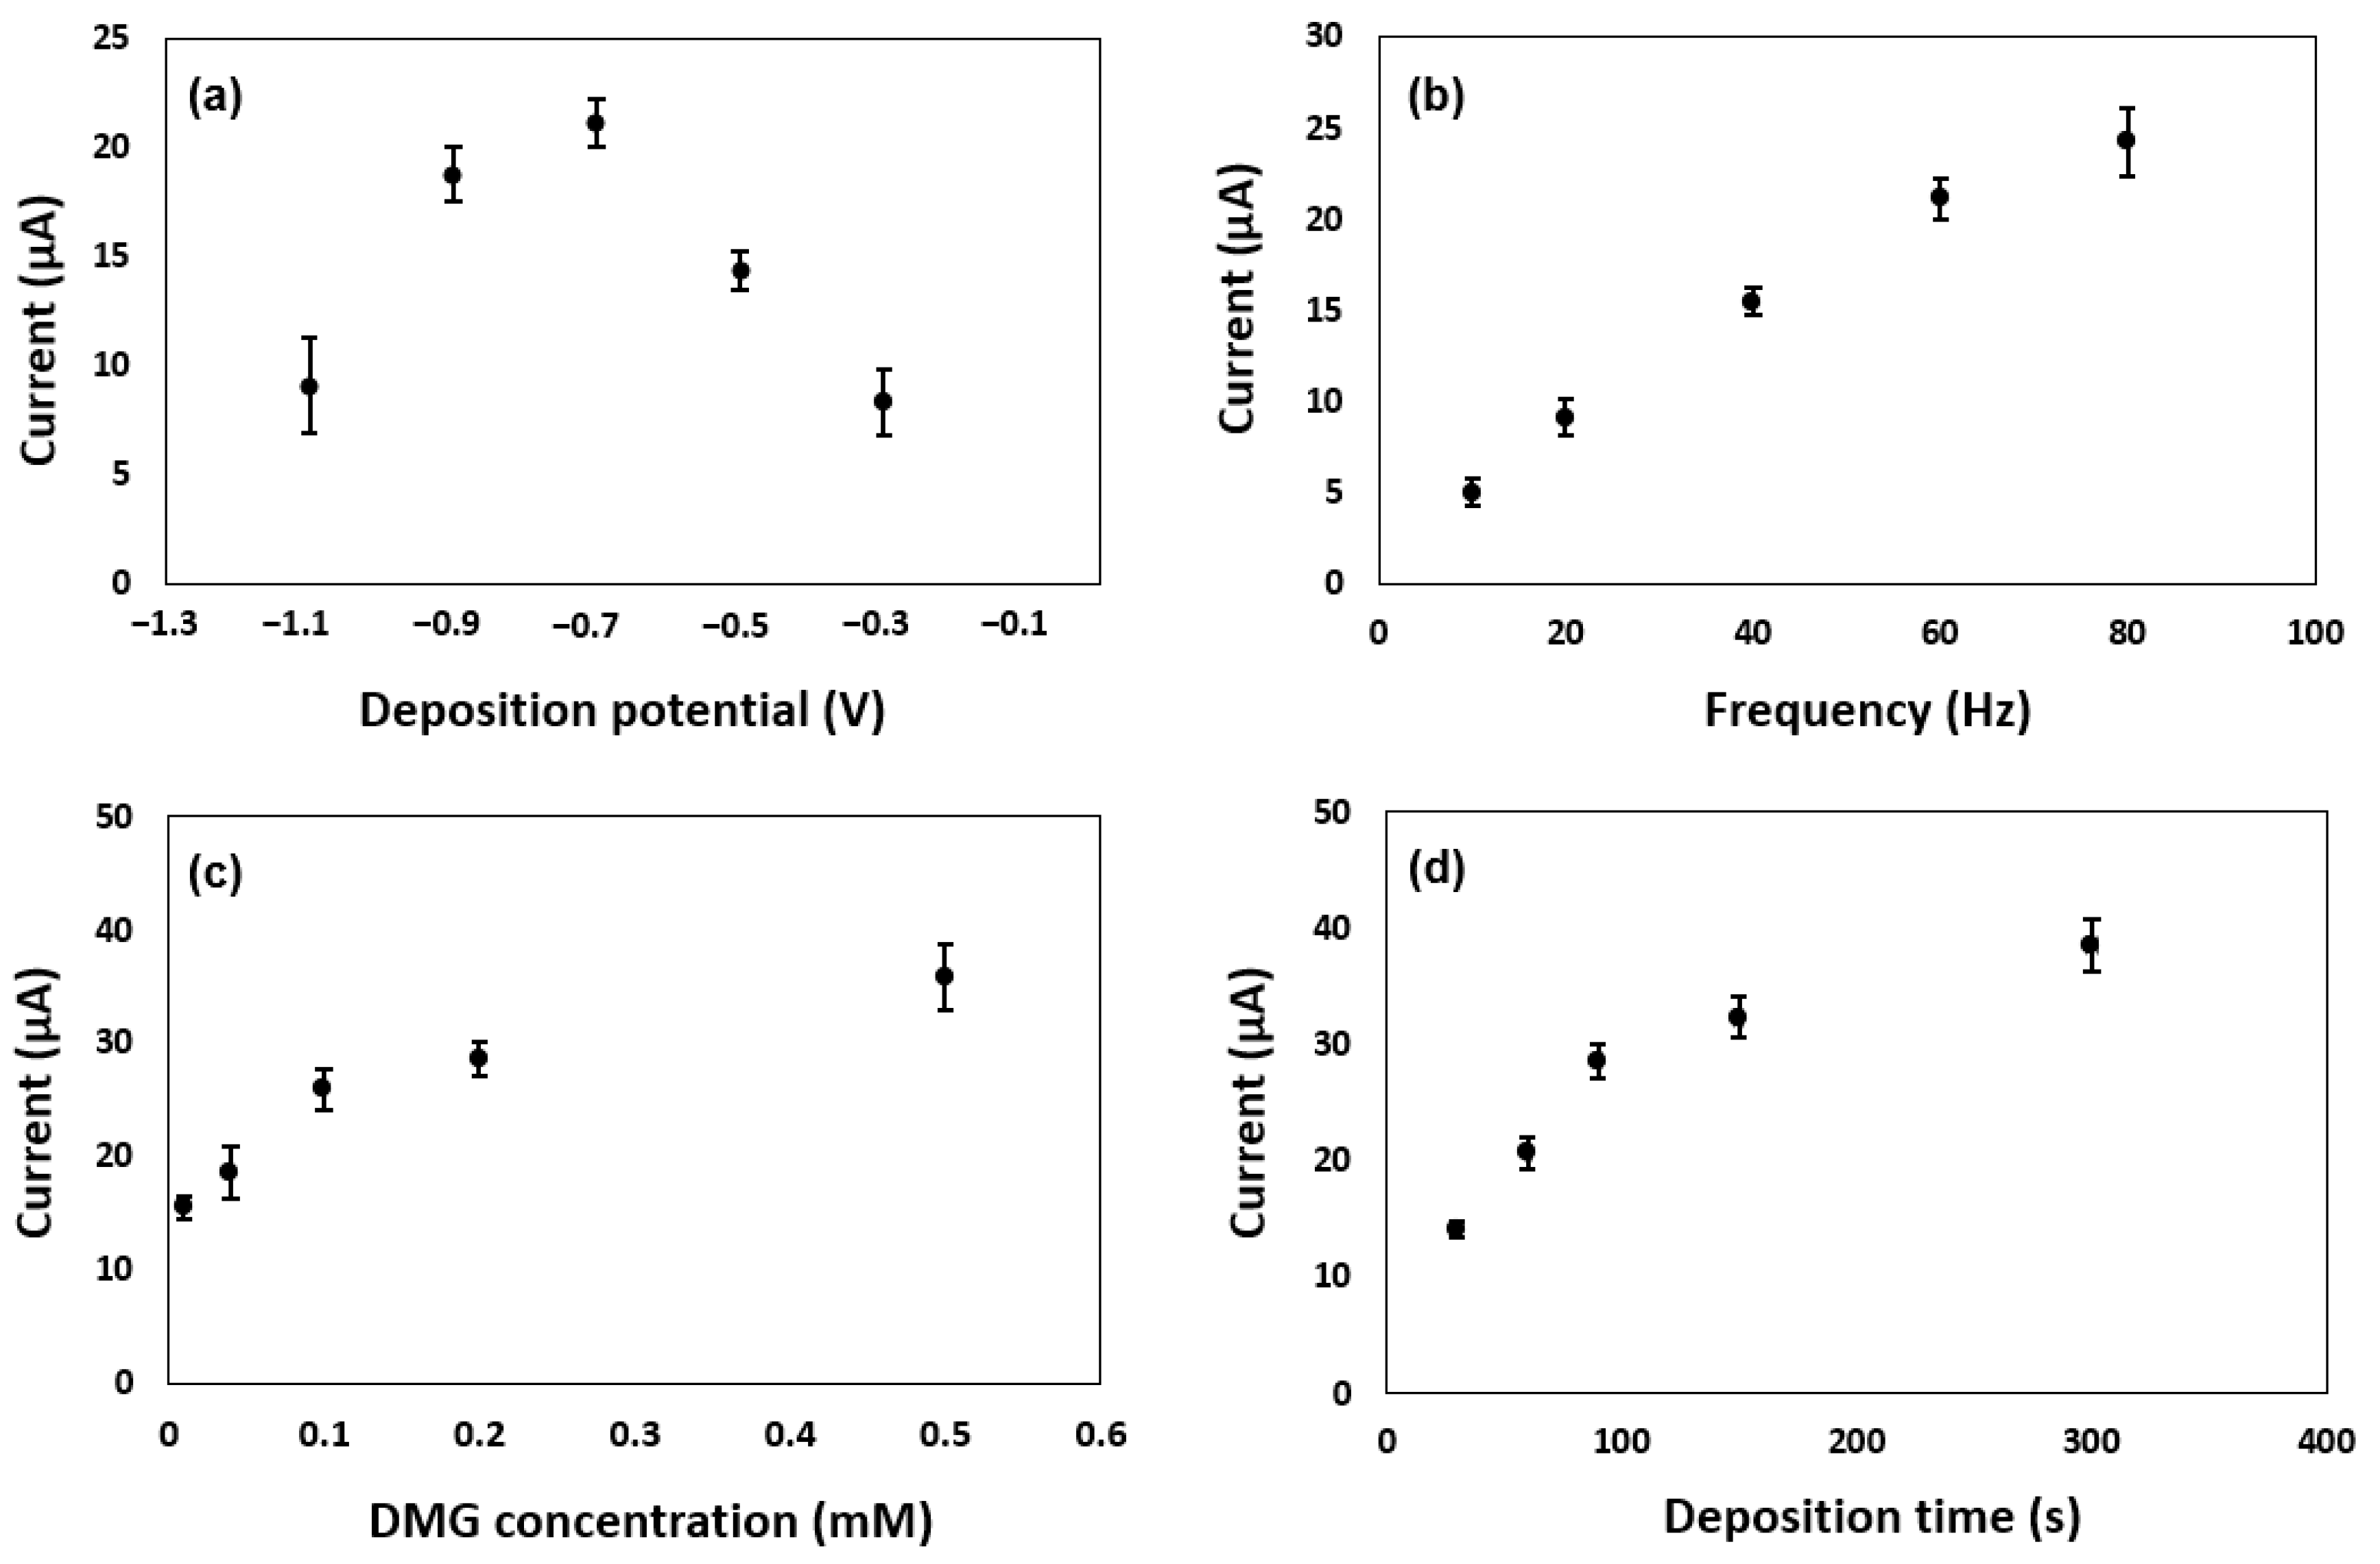
3.2. Optimization of SWAdCSV Operational Parameters for Heavy Metal Detection

Deposition potential, frequency, amplitude, DMG concentration, and deposition time are important operational parameters in SWAdCSV analysis for Co(II) and Ni(II) detection. The effects of these operational parameters on the detection of Ni-DMG and Co-DMG complexes using the newly developed Bi-chitosan-GCE sensor were investigated to determine the optimal operational condition of each parameter. All the measurements were conducted at a fixed concentration of Ni(II) or Co(II) at 50 µg L−1 in a 0.1 M ammonia buffer solution (pH 9.2). The initial operational parameters were set as follows: 15 s equilibrium time, 90 s deposition time, 60 Hz frequency, 25 mV amplitude, and DMG concentration of 0.2 mM. Then, the effect of different deposition potentials was first investigated in the range of −0.3 to −1.1 V. The deposition potential is related to the accumulation of metal-DMG complexes on the sensor surface. As shown in Figure 1a and Figure 2a, the highest current peaks for the reduction of the Ni(II) and Co(II)-DMG complex were obtained at deposition potentials of −0.9 and −0.7 V, respectively, where the highest number of metal-DMG complexes are adsorbed on the surface of Bi-chitosan-GCE, providing the maximum stripping peak current. Therefore, −0.9 and −0.7 V were chosen as the optimal deposition potentials for Ni(II) and Co(II), respectively. Several studies have suggested similar deposition potentials in the range between −0.7 and −0.9 V for Ni(II) and Co(II) measurements using SWAdCSV [25,38]. The SWAdCSV results showed that the current peak for Co(II)detection is 6.1 times greater than the current peak for Ni(II) measurements, probably due to the different affinity of DMG molecules toward Ni(II) and Co(II).
As demonstrated in Figure 1b and Figure 2b, a higher frequency significantly improved the stripping peak current. In general, high values of frequency and amplitude can cause significant drawbacks in sensing, such as ambient noise, which can cause higher standard deviations and current overload during measurements. In the range of acceptable standard deviation of the current peaks, 120 and 60 Hz were chosen as an optimal frequency for Ni(II) and Co(II) measurements, respectively. As an optimal amplitude, 50 mV was used (Figure S3) for both Ni(II) and Co(II) detection. With the selected deposition potential, frequency, and amplitude on stripping peak currents of Ni(II) and Co(II), the effect of DMG concentration on Ni(II) and Co(II) detection was investigated with different DMG concentrations of 0.01, 0.04, 0.1, 0.2, and 0.5 mM. Since the formation of the metal-DMG complex is highly dependent on the availability of DMG molecules (i.e., (DMG)H anionic form), it is expected to have a peak current that is proportional to DMG molecules in the test solution. As demonstrated in Figure 1c and Figure 2c, with higher concentrations of DMG up to 0.5 mM, greater signal outputs were obtained for Ni(II) (1.8 times greater at 0.5 mM compared to 0.01 mM) and Co(II) (2.3 times greater at 0.5 mM compared to 0.01 mM) detection. However, it was found that adding higher concentrations of DMG (above 0.2 mM) can reduce the sensor stability with higher standard deviations. Moreover, DMG reduction peaks is another challenge, as it would occur in the same position as Ni(II) peaks at higher concentrations of DMG (above 0.5 mM) [40]. The Ni-DMG peak was not as clear as the peak obtained at lower DMG concentrations due to the signal interference by DMG molecules. Overall, the DMG concentration of 0.2 mM was chosen as the optimal DMG concentration for both Ni(II) and Co(II) measurements because of the reduced stability of the sensor at DMG concentrations above 0.2 mM.
Next, the sensor performance was investigated under different deposition times, ranging from 30 s to 300 s. It was expected that longer deposition times provide more opportunity for metal complexes to be accumulated on the sensor surface, which leads to higher current peaks and lower LOD. As illustrated in Figure 1d and Figure 2d, increasing the deposition time from 30 to 150 s significantly improved the peak currents. This indicates that the accumulation of the metal-DMG complexes on the sensor surface is a relatively fast phenomenon that does not require a long deposition period. Although longer deposition times (>150 s) slightly increased the current peaks, this could increase the total detection time. Therefore, a deposition time of 120 s was chosen as the optimal deposition time for the detection of both Ni(II) and Co(II) via the SWAdCSV technique.
Overall, deposition potential of −0.9 V, frequency of 120 Hz, amplitude of 50 mV, DMG concentration of 0.2 M, and deposition time of 120 s was selected for the detection of Ni(II), while a deposition potential of −0.7 V, frequency of 60 Hz, amplitude of 50 mV, DMG concentration of 0.2 M, and deposition time of 120 s was selected for the detection of Co(II) using Bi-chitosan-GCE (Table S1).

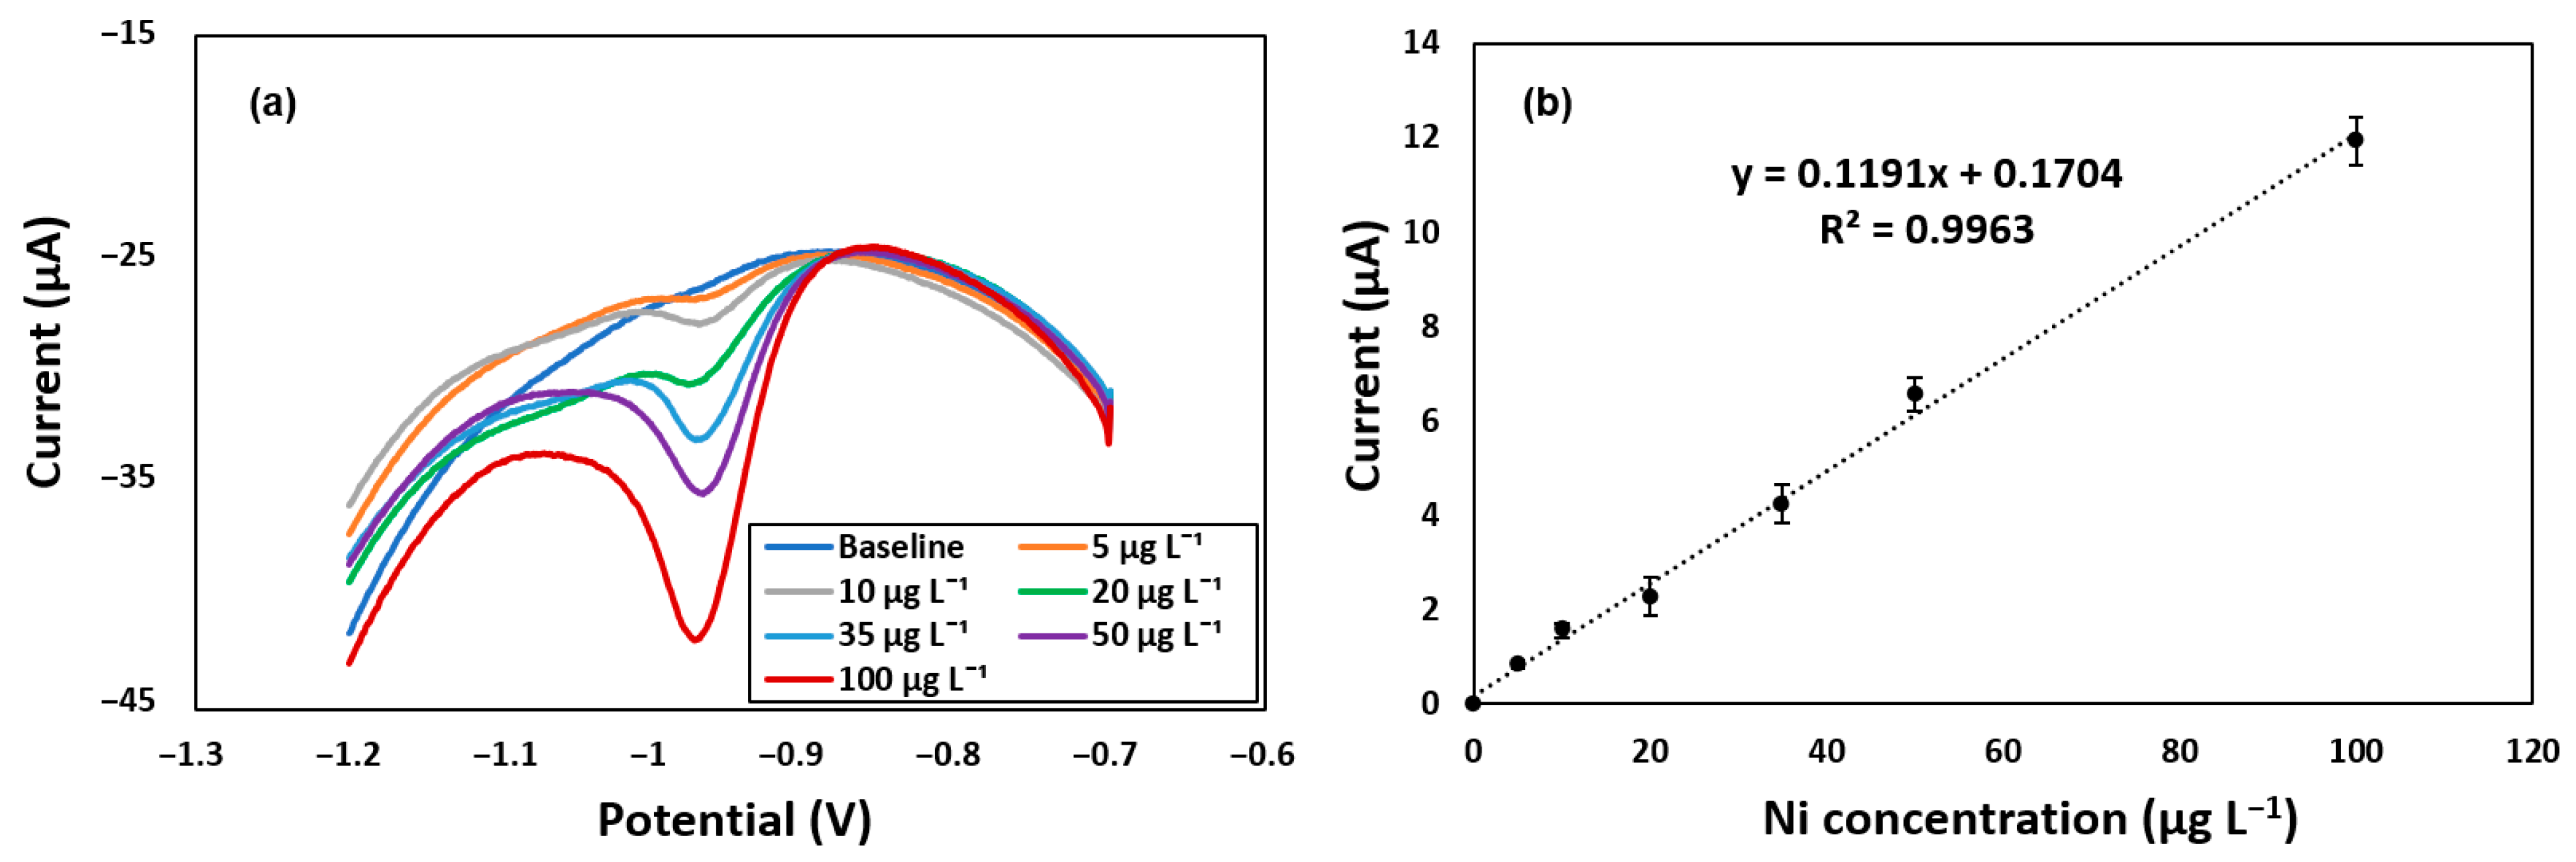
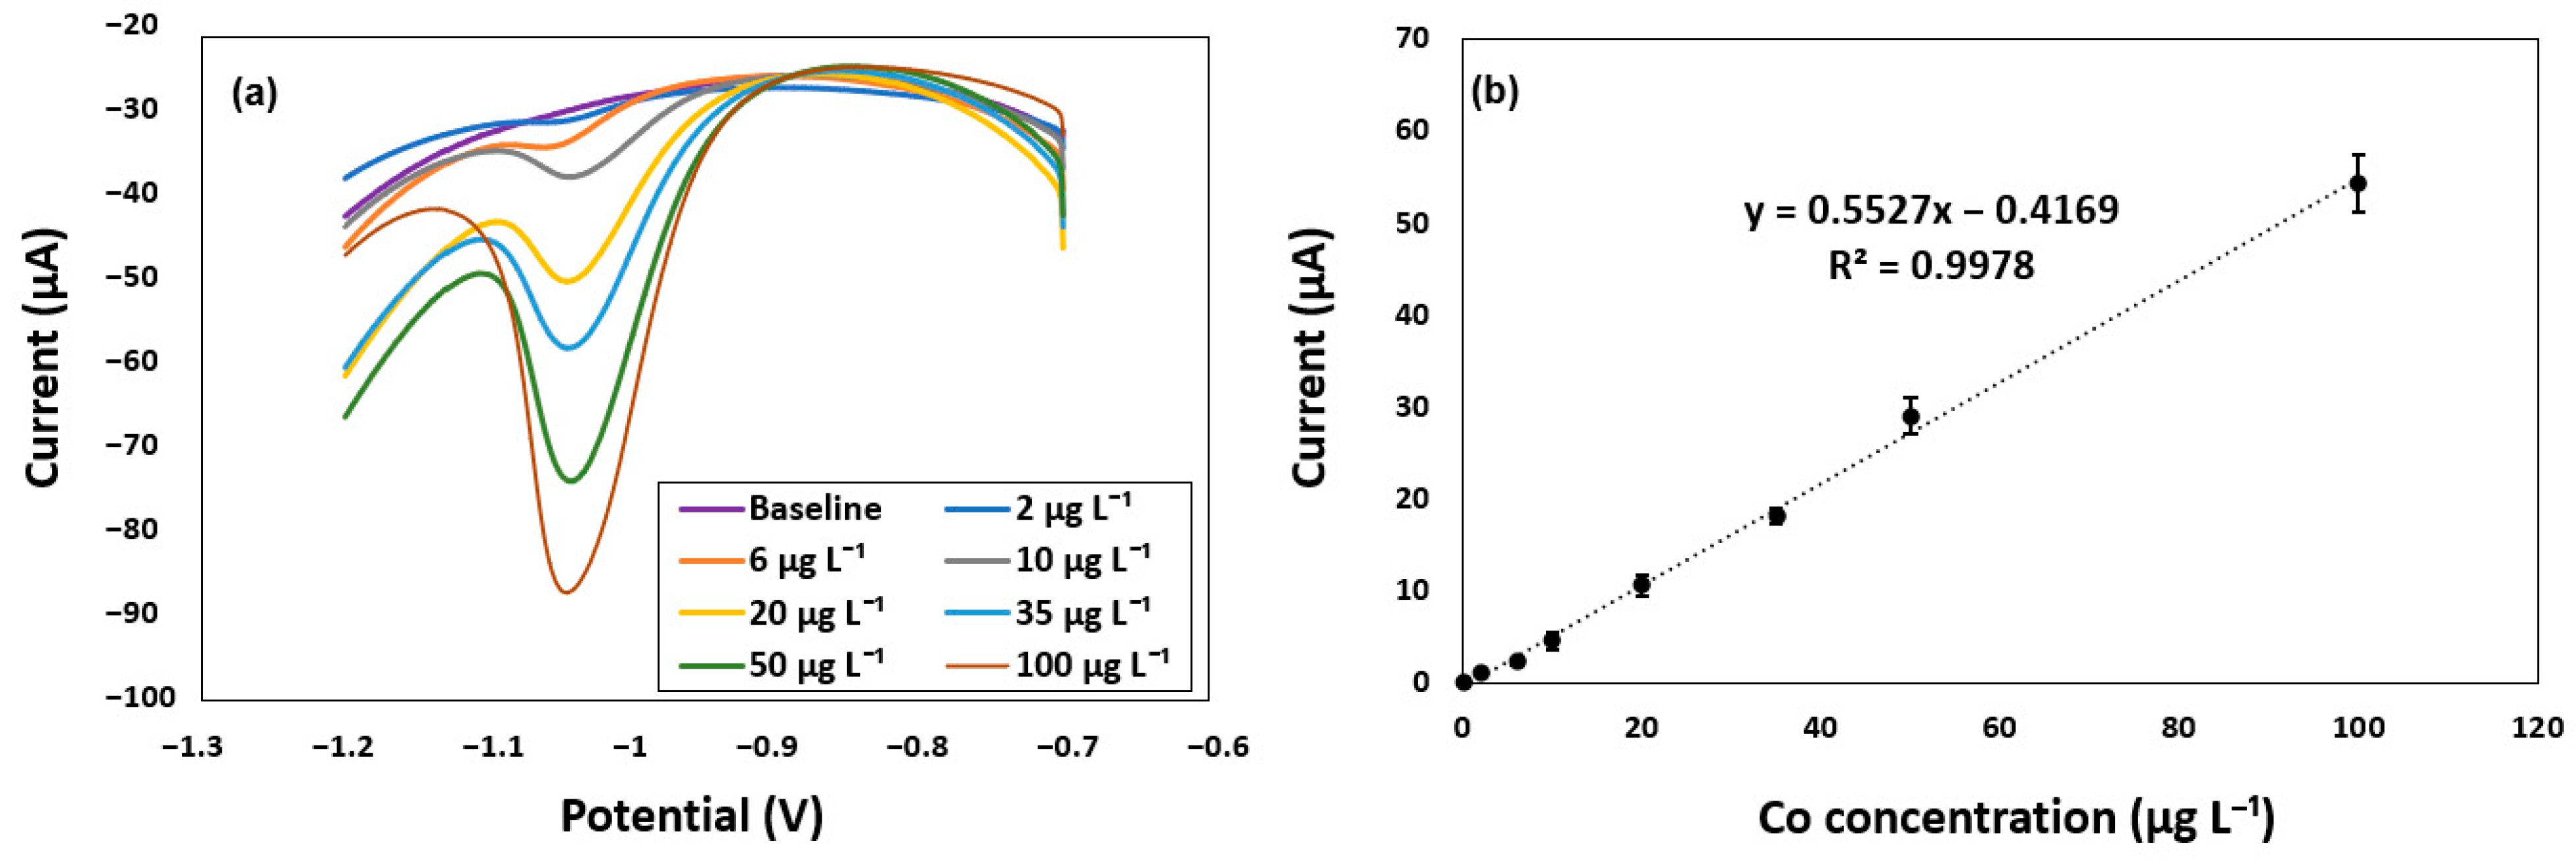
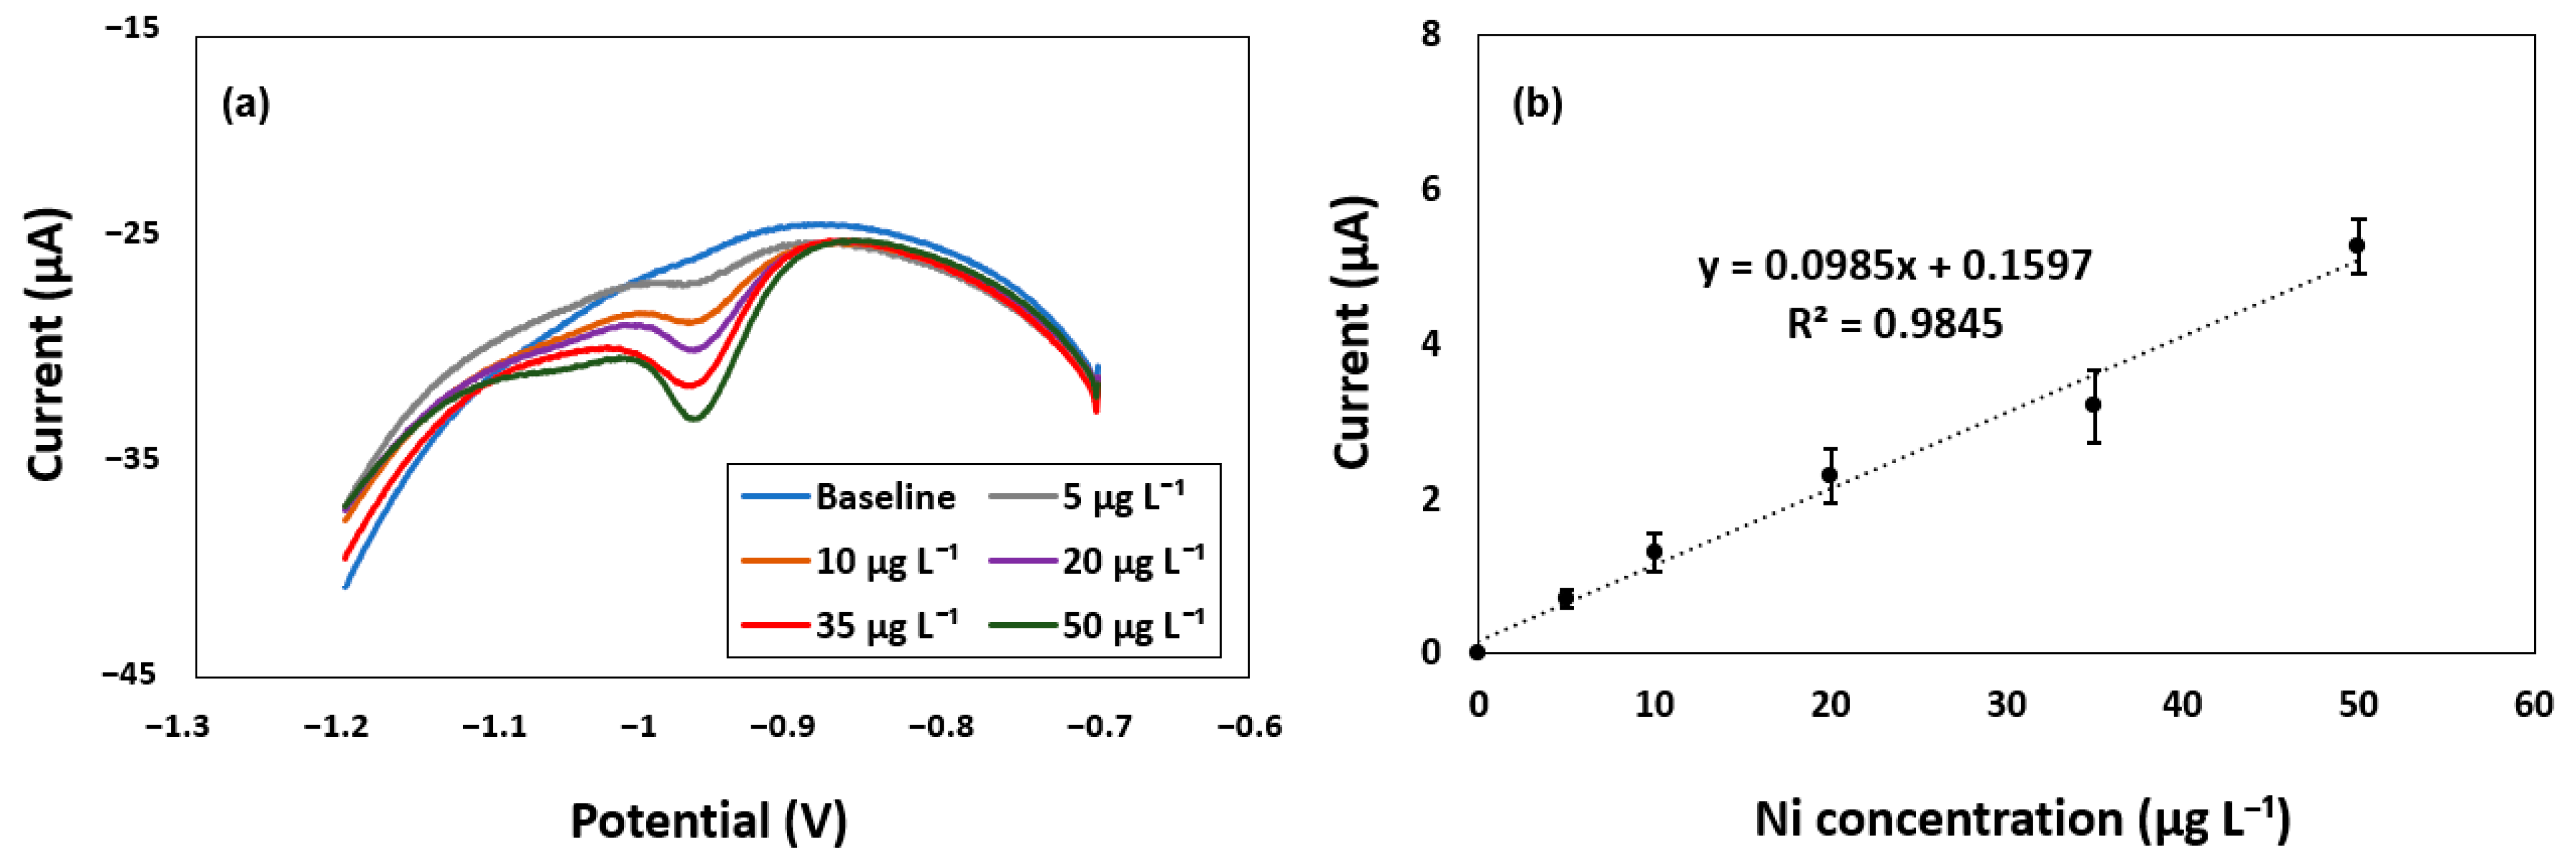
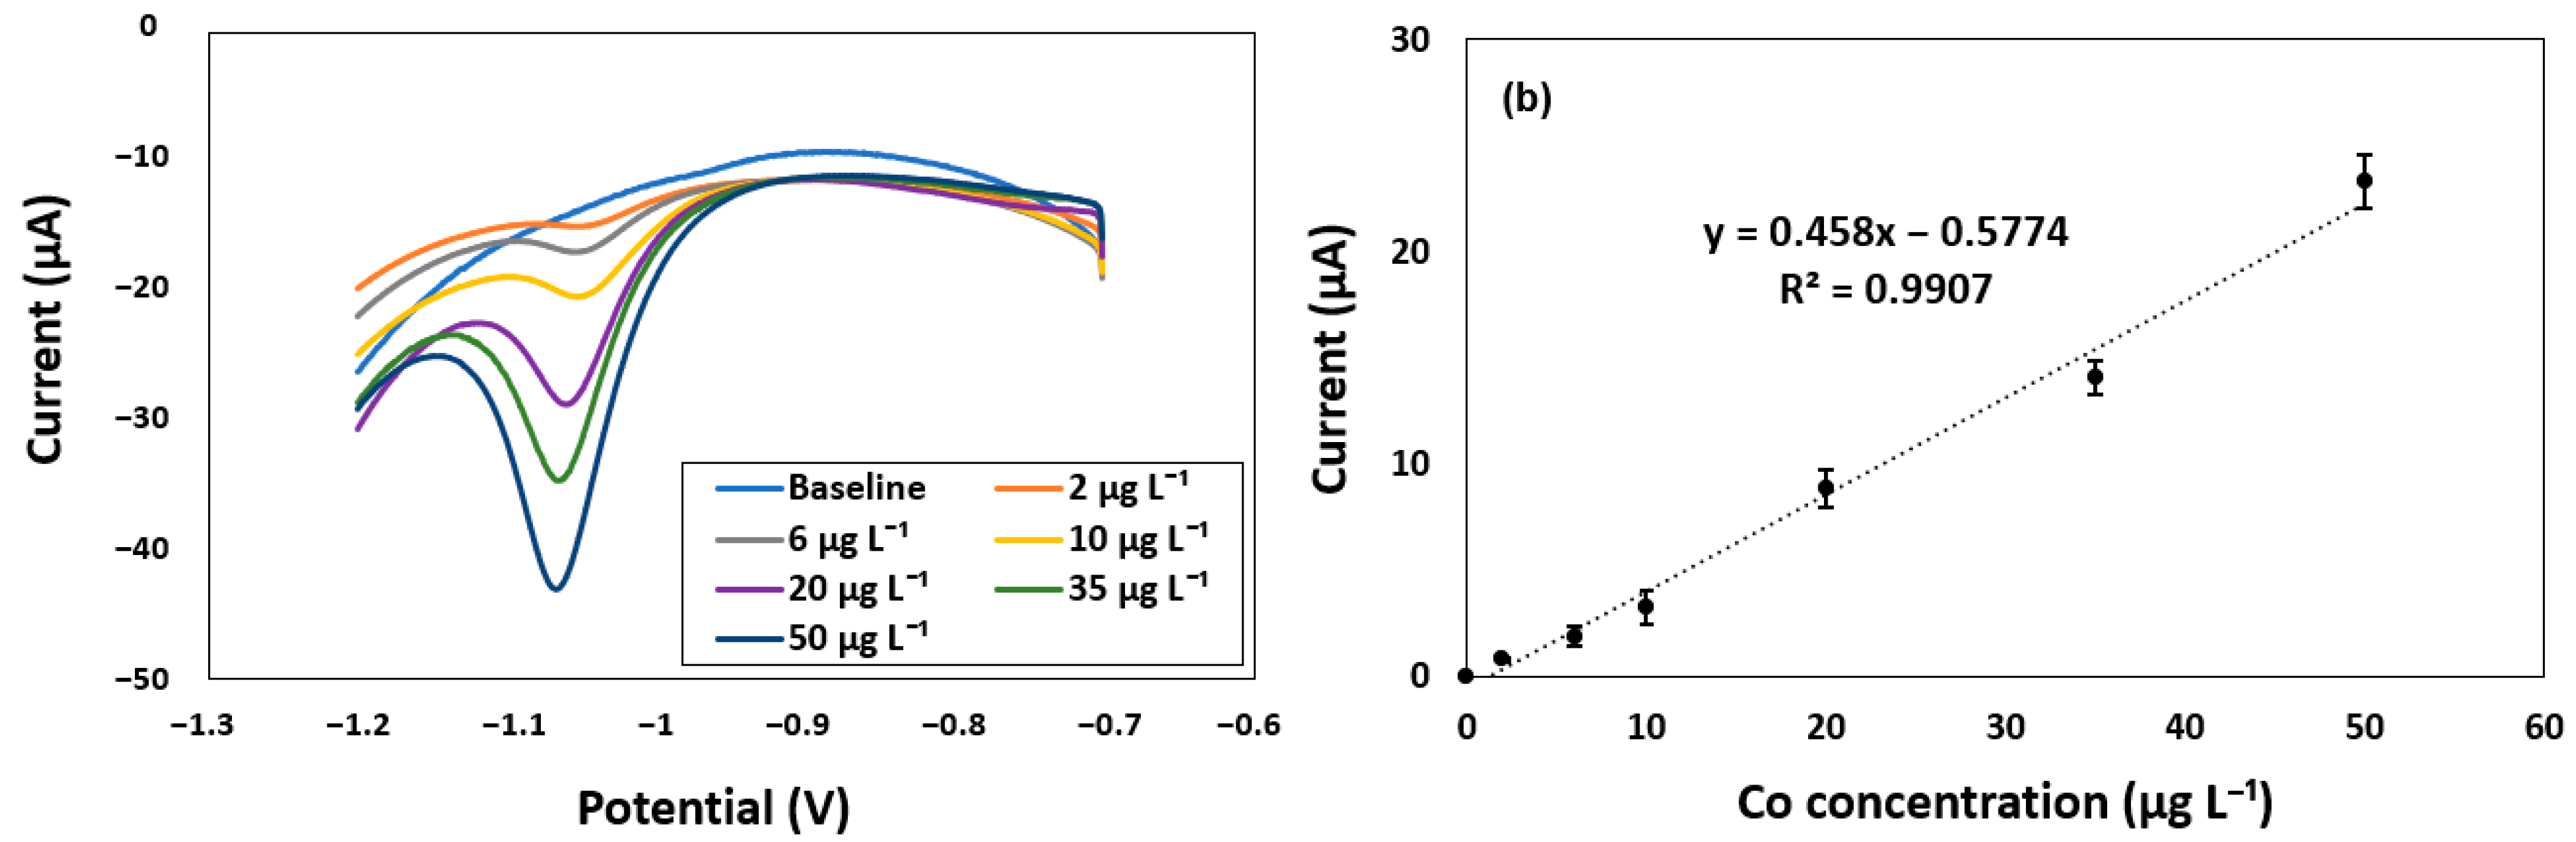
3.3. Sensor Performance Evaluation of the Modified Bi-Chitosan GCE

Under the optimal SWAdCSV operational conditions, clear peaks were observed for Ni(II) and Co(II) at −0.96 and −1.06 V, respectively (Figure 3 and Figure 4). The corresponding concentrations were then plotted and used to construct calibration curves for Ni(II) and Co(II) in ammonia buffer (0.1 M). The corresponding calibration plots and correlation coefficients were Ip = 0.1191x + 0.1704 (R2 = 0.99) for Ni(II), and Ip = 0.5527x − 0.4169 (R2 = 0.99) for Co(II), respectively. When ammonia buffer solution was used as the supporting electrolyte, LOD was determined to be 3.67 µg L−1 for Ni(II)and 2.42 µg L−1 for Co(II), respectively (Table 1). The developed Bi-chitosan GCE sensor demonstrated excellent stability with RSD of 3.2% and 2.9% for Ni(II) and Co(II), respectively (Table S2). The calibration results and peak currents for Ni(II) and Co(II) indicate that the sensor shows a higher sensitivity toward Co(II) (0.552 µA (µg L−1)−1) compared to Ni(II) (0.119 µA (µg L−1)−1. It seems that DMG molecules have higher selectivity toward Co(II) cations compared to Ni(II).
Table 1 shows the comparison of Ni(II) and Co(II) detection between the modified Bi-chitosan GCE sensor and other sensors previously reported [25,33,37,38,40,47,48,49,50,51]. Most of the previously published studies showed the detection at a lower range of Ni(II) and Co(II) concentrations (e.g., <60 µg L−1) (Table 1). Soares et al. (2013) reported that the Bi vibrating electrode faced a significant reduction in peak currents Ni(II) in concentrations above 10 µg L−1 [40]. Even for those which have a higher concentration range of Ni (II) (~600 µg L−1), LOD was relatively high (e.g., 18–30 µg L−1). However, the modified Bi-chitosan GCE developed in this study showed a relatively wider range of Ni(II) and Co(II) concentrations (2–100 µg L−1) with lower LOD (3.6 µg L−1 for Ni(II) and 2.4 µg L−1 for Co(II), respectively) compared to previous works (Table 1).

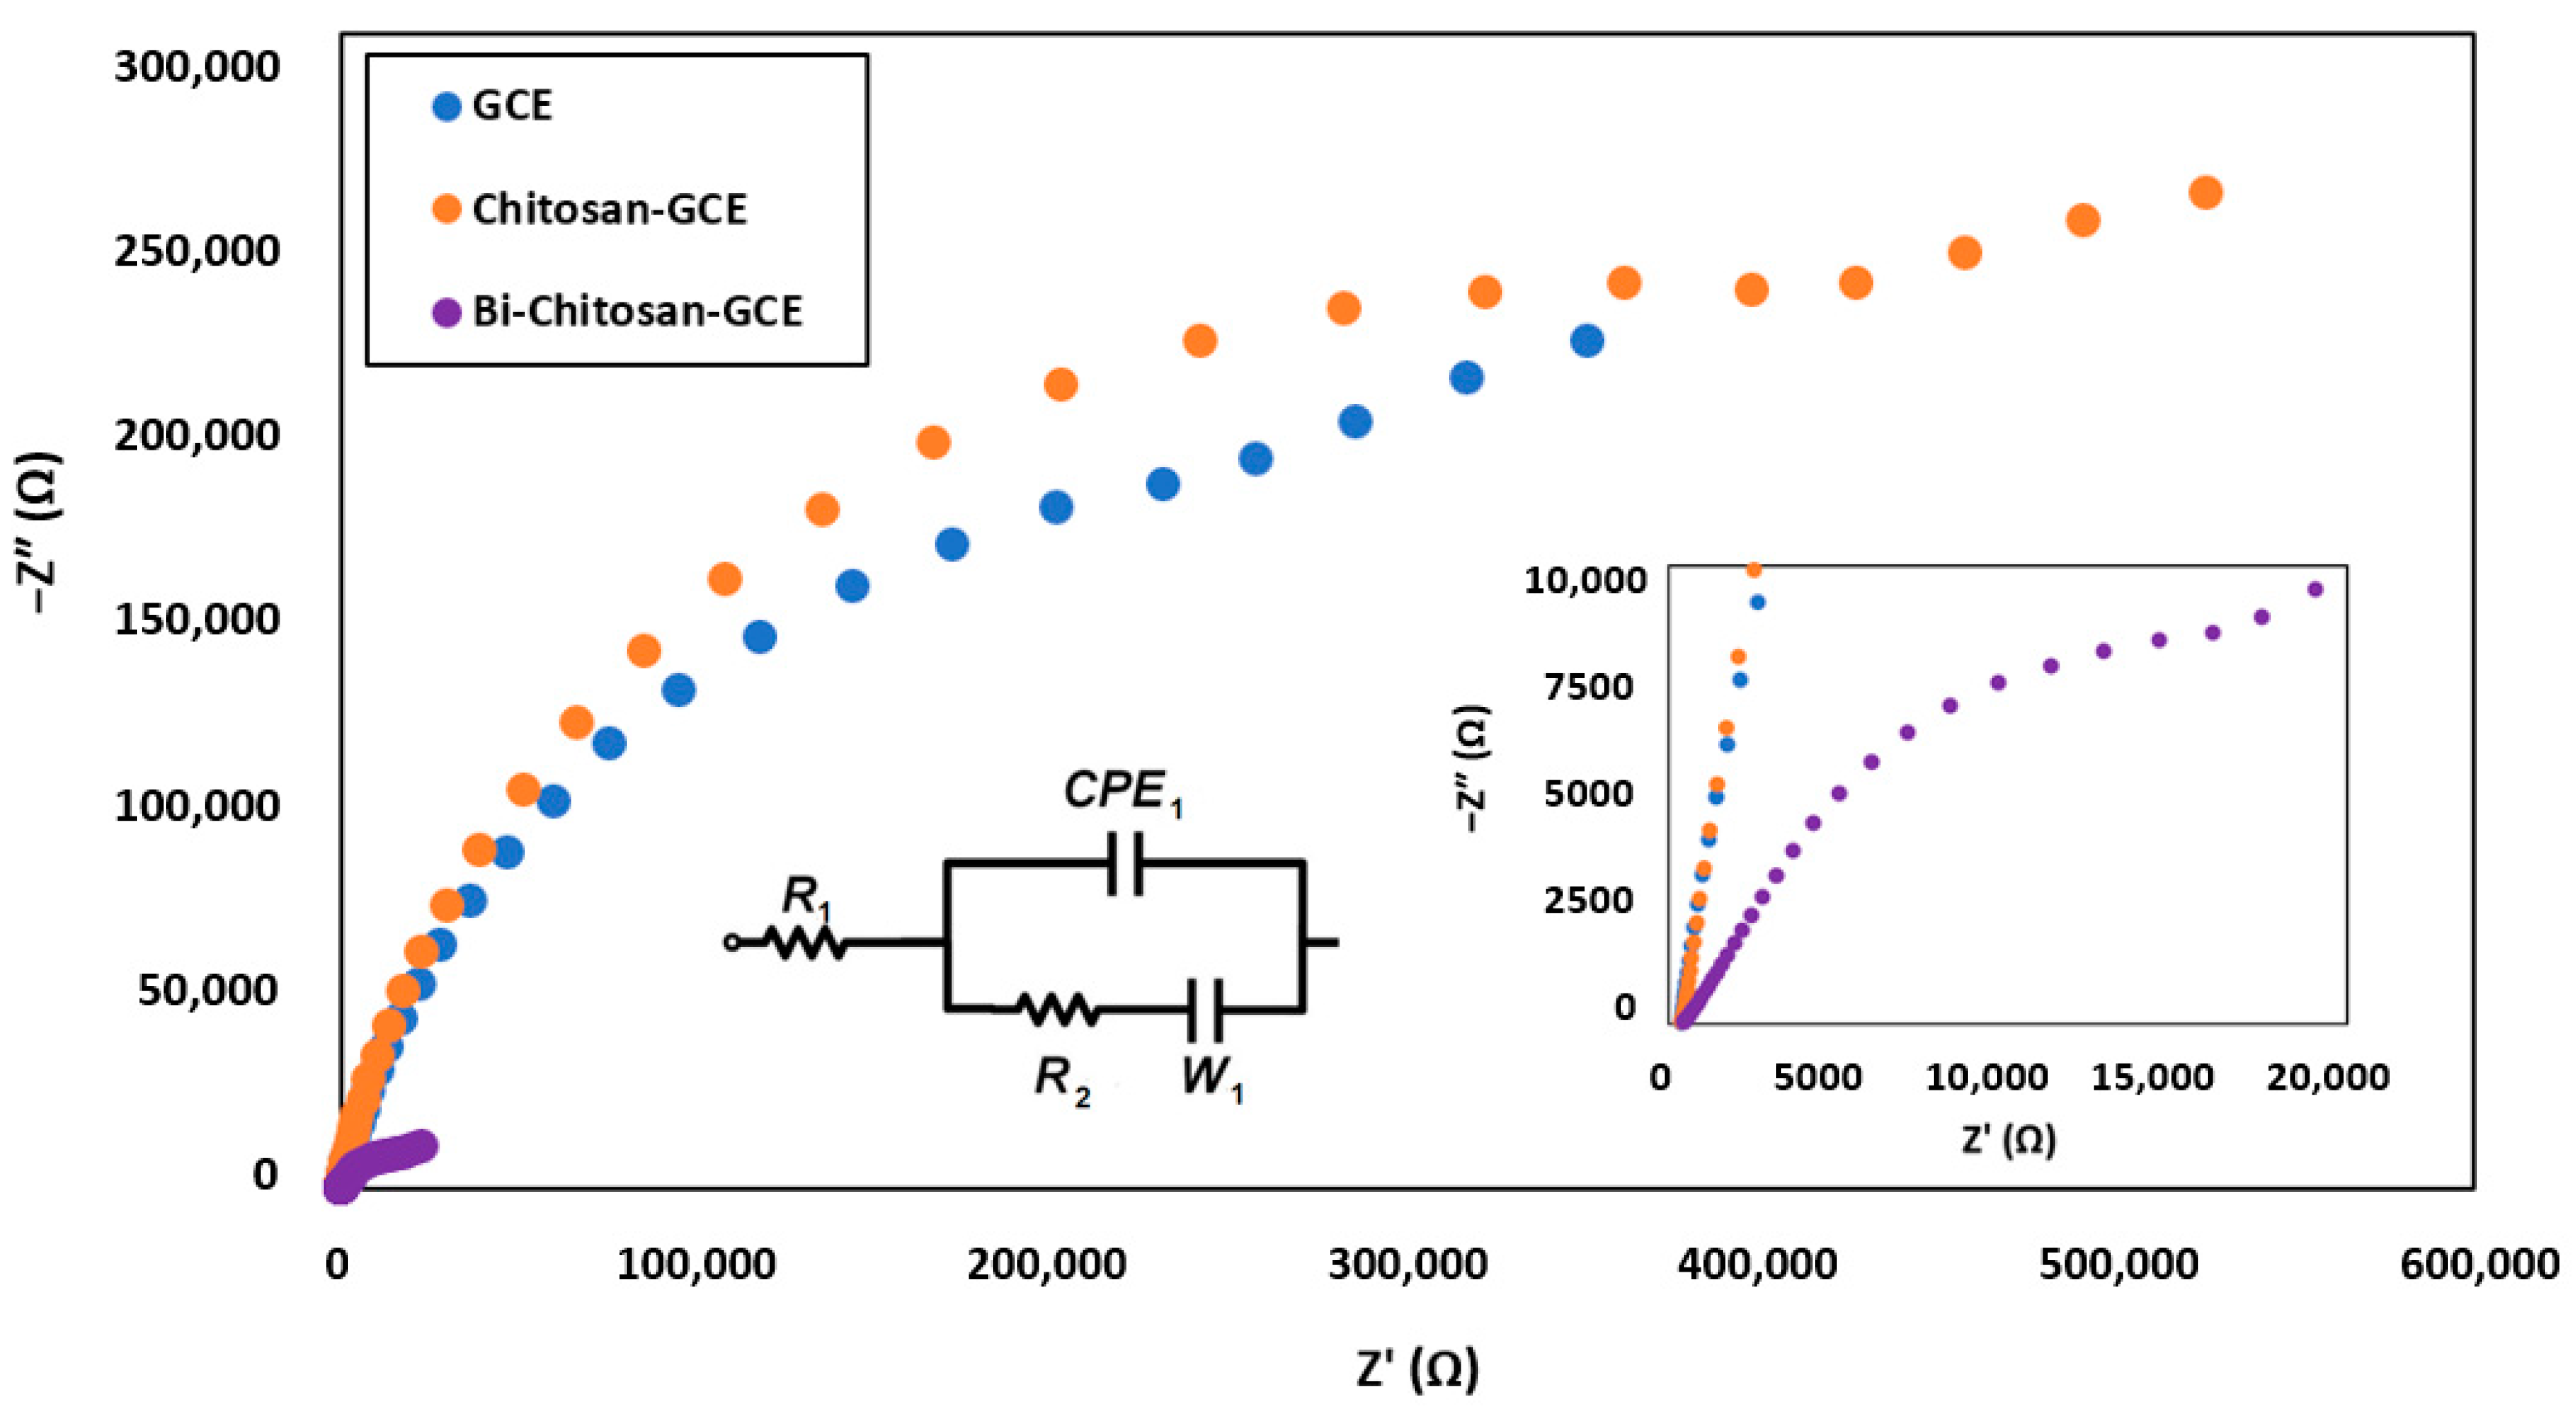
3.4. Electron Transfer of the Modified Bi-Chitosan GCE Sensor

The electron transfer properties of the developed modified Bi-chitosan GCE sensor were investigated using EIS measurement. Bare GCE and chitosan-GCE were compared for reference purposes. Typically, impedance spectra (i.e., Nyquist plot) consist of semi-circular and linear regions, which represent electron transfer and diffusion processes, respectively. It is known that charge transfer resistance across the interface electrode/electrolyte is proportional to the diameter of the arc of the Nyquist plot at a constant bias potential [52]. As shown in the Nyquist plot (Figure 5), considerable changes in the diameter of the semicircle were observed upon electrode modification. For example, the charge transfer resistance of the bare GCE was increased when chitosan was coated on the surface of the electrode, indicating the hindering effects of the chitosan for the charge transfer process on the surface of the chitosan-GCE. However, chitosan as a biopolymer is proven to be an excellent organic material for electrode coating, since it offers the great film-forming ability, good biocompatibility, and adhesion [53]. Moreover, studies have shown that chitosan not only improves the mechanical integrity of sensing films [54], but also has the potential to form various complex composite materials [55]. Hence, along with Bi-coating on the GCE, the Bi-chitosan nanocomposite material was expected to demonstrate an electrically conductive composite material with higher chemical stability compared to bare GCE and chitosan-GCE. As illustrated in Figure 5, the charge transfer resistance was considerably decreased when the chitosan-GCE surface was modified with Bi, which demonstrates a higher electrochemical activity and enhanced electron transfer kinetics across the electrode/electrolyte interface of the Bi-chitosan-GCE. Overall, the high sensitivity of the Bi-chitosan nanocomposite sensor toward Ni(II)-DMG and Co(II)-DMG complexes can be justified by comparing the Nyquist plot (Figure 5) and reduction of metal-DMG complexes (Equations (2)–(4)). As shown in Equation (4), a total of 10 electrons are required for electrochemical reduction of each metal-DMG complex adsorbed on the sensor surface. Sensors with lower charge transfer resistance (i.e., a smaller semi-circular region) can provide better conditions (higher electron transfer properties) for electrochemical reduction of the complexes, which would facilitate the stripping of both central metal and ligands in the metal-DMG complexes. Equivalent circuits for impedance spectra of each EIS measurement (i.e., GCE, chitosan-GCE, and Bi-chitosan-GCE) were modeled by data fitting via “EIS Spectrum Analyzer” software, which is shown in Figure 5. The fitted data for all circuit elements of Bi-chitosan-GCE (Table S3) are also reported.

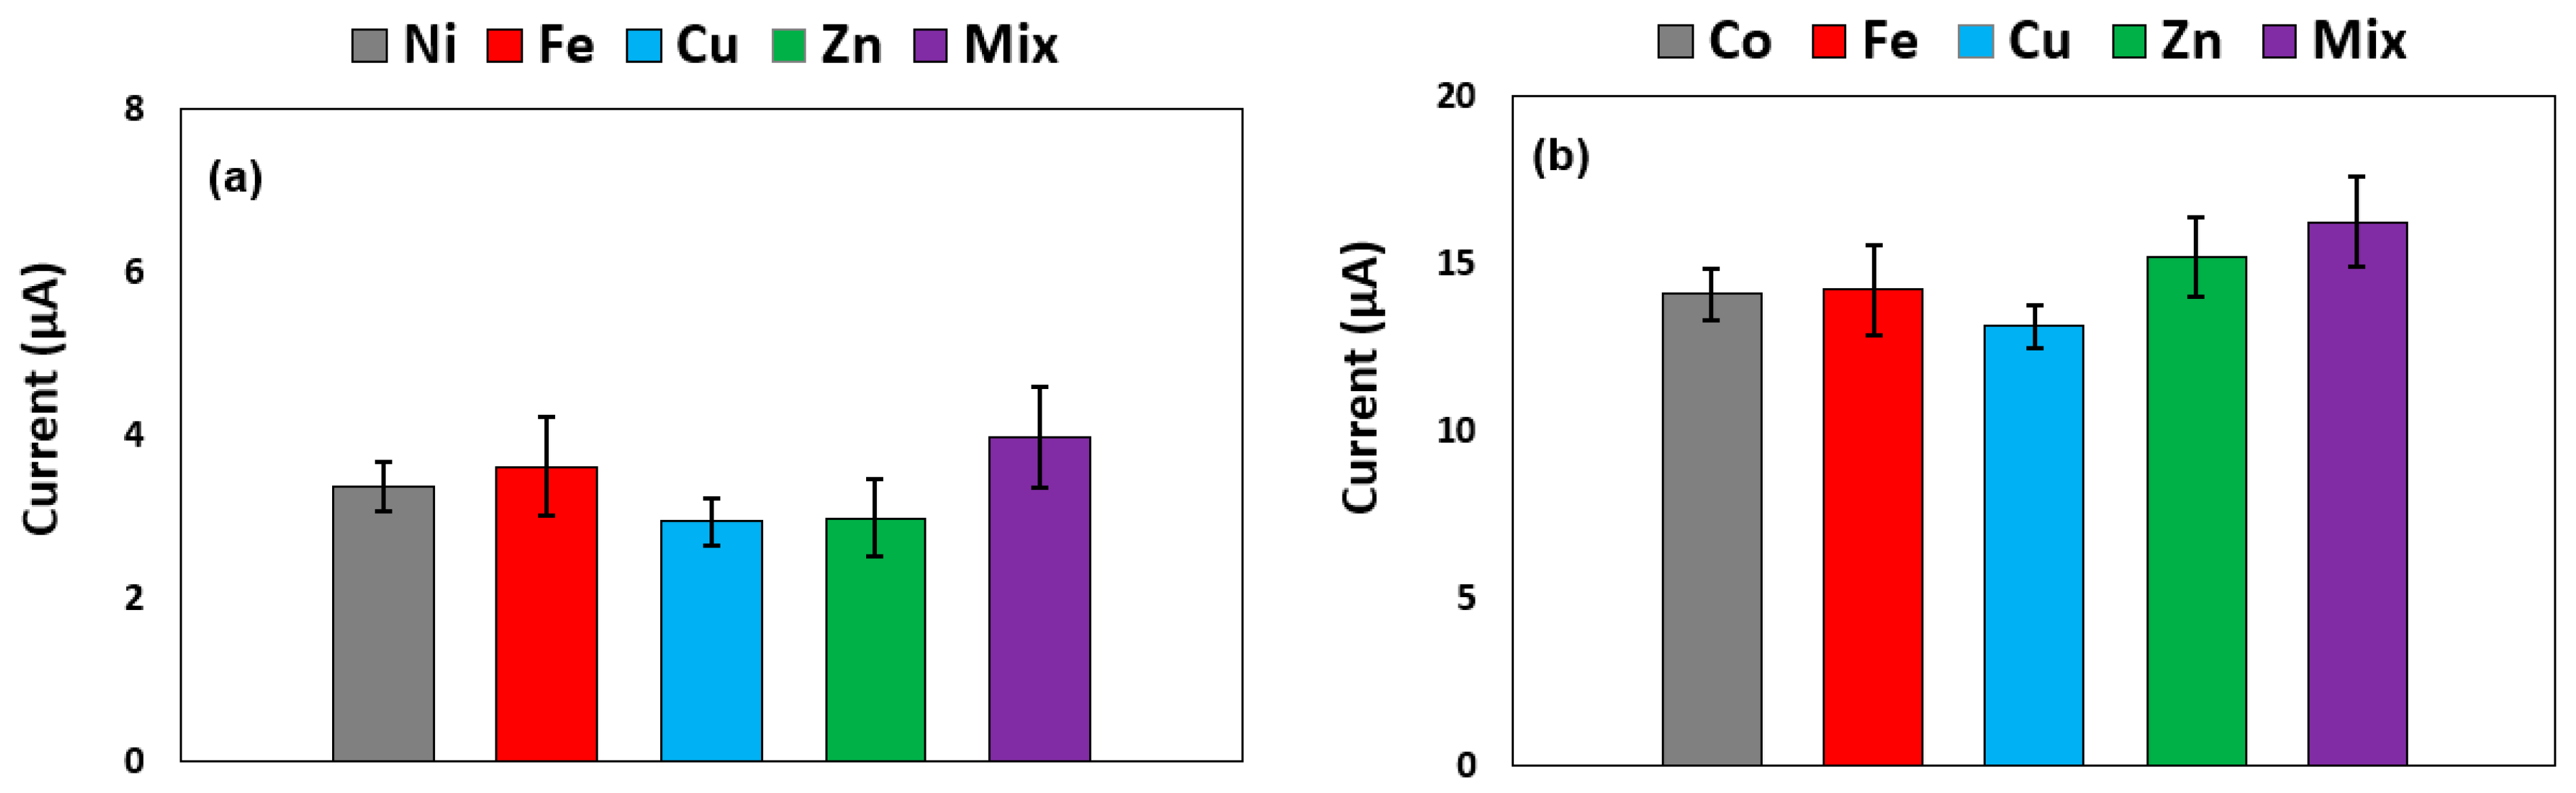
3.5. Possible Ion Interference in Ni(II) and Co(II) Detection

Fe, Ni, Co, Zn, Cu, Se, Mo, and Cu are common trace metals found in the anaerobic digestion process [56]. However, DMG, the chelating agent used in this study, not only reacts with Ni(II) and Co(II), but can also form complexes with several other metals, such as Fe(II), Zn(II), and Cu(II) [57,58], potentially interfering with the sensor performance for electrochemical detection of Ni(II) and Co(II). Hence, different concentrations of Fe(II), Zn(II), and Cu(II) were added to the test solutions containing Ni(II) (or Co(II)) to observe possible changes in sensor signals (i.e., peak current). First, measurements were conducted at a fixed concentration of 35 µg L−1 Ni(II) (or Co(II)) to record the current peaks without any possible interference. Then, 70 µg L−1 of Fe(II), Zn(II), and Cu(II) were added to the standard solution individually, or a mixture of 70 µg L−1 of Fe(II), Zn(II), and Cu(II) was added to the solution. It was found that the addition of these metal ions (twice higher concentration than Ni (II) and Co(II)) showed no significant effects on the current peaks of Ni(II) and Co(II) (Figure 6). With regards to Ni(II) measurements, the addition of Fe(II), Zn(II), Cu(II), and the mixture of all three metals caused a 6.8%, 13.9%, 13.0%, and 17.5% change in signals, respectively, while the Co(II) measurements demonstrated a 0.9%, 8.0%, 6.8%, and 15.4% current change when Fe(II), Zn(II), Cu(II), and a mixture of all three metals were added, respectively. This indicates that the developed sensor can detect Ni(II) and Co(II) in the presence of other metal ions found in water samples with an acceptable range of accuracy (>82%).
The pH of the supporting electrolyte plays a crucial role in the chelation reaction between target metal ions (e.g., Ni(II) and Co(II)) and DMG molecules. Hence, the impact of electrolyte pH on electrochemical detection of Ni(II) and Co(II) was investigated by changing the pH of the supporting electrolyte from 6.5 to 11.5. No output signal was recorded at pH levels lower than 8.5, indicating limitations in the formation and accumulation of metal complexes at a lower pH < 8.5. The current peaks for both Ni(II) and Co(II) were increased when electrolyte pH was increased from 8.5 to 11.5 (Figure S4). As illustrated in the chelation reaction (Equation (2)), it is expected that higher pH will facilitate the formation of metal-DMG complexes which leads to a higher peak current of metal-DMG measurements. However, at pH values above 9.5, the standard deviations also increased, indicating that pH 9.5 would be an appropriate pH for the measurement of Ni(II) and Co(II) using metal-DMG molecules.

3.6. Application to Natural Water Samples

The sensor performance was further evaluated by applying for natural water samples collected from a local lake located in Orlando, Florida, USA. First, the pH of the lake water samples was adjusted to pH 9.2 using the ammonia buffer solution (0.1 M) for SWAdCSV measurements. It was found that the initial concentration of Ni(II) and Co(II) in the lake water samples was 3.0 µg L−1 and 0 µg L−1, respectively, using ICP-MS. By spiking pre-calculated amounts of Ni(II) and Co(II), two calibration curves were constructed for Ni(II) and Co(II) detection. As demonstrated in Figure 7 and Figure 8 and Table S2, well-defined peak currents were obtained at −0.96 V for Ni(II) and −1.06 V for Co(II) in the range of 2 to 50 µg L−1. For natural samples, the sensitivity and LOD were 0.098 µA (µg L−1)−1 and 5.02 µg L−1, respectively, for Ni(II) measurements, while the sensitivity and LOD were 0.458 µA (µg L−1)−1 and 3.25 µg L−1, respectively, for Co(II) measurements. Slightly lower sensitivity and higher LOD were obtained in natural water samples compared to the ammonia buffer solution only. Moreover, the dynamic linear range of the Bi-chitosan nanocomposite sensor was reduced to 50 µg L−1, while the linear range of 100 µg L−1 was previously achieved when ammonia buffer solution was used as the supporting electrolyte for the measurements. The decline in the sensitivity, LOD, and linear range of the fabricated sensor can be due to the presence of unknown interfering components inside the natural water sample [59,60]. This suggests that every calibration curve needs to be constructed for a different water body.
The sensor reproducibility was then investigated using Ni(II) (or Co(II)) spiked natural water samples (35 µg L−1). Ni(II) and Co(II) concentrations in test natural water samples were validated with ICP-MS. Twelve consecutive measurements (n = 12) with stable peak currents were obtained with the Bi-chitosan-GCE for the natural water samples, indicating that the reproducibility of the fabricated sensor is acceptable with great stability for Ni(II) (<1.4% error) and Co(II) (<3.2% error) detection in water samples (Figure S5).

4. Conclusions

In this study, a Bi-chitosan-GCE sensor was newly developed for Ni(II) and Co(II) detection in water using SWAdCSV. DMG was used as the chelating agent for forming NI(II)- or Co(II)-DMG complexes under alkaline conditions (pH 9.2). The electrochemical reduction of the metal-DMG complex involves the current peaks which are proportional to Ni(II) and Co(II) concentrations in water. The developed sensor showed good sensitivity and a wider dynamic linear range (up to 100 µg L−1) in measuring Ni(II) and Co(II), while offering a lower LOD of 3.6 µg L−1 for Ni(II) and 2.4 µg L−1 for Co(II), respectively, compared to previous reports. The developed sensor was also applied to natural water samples and demonstrated excellent stability and reproducibility (n = 12) for both Ni(II) and Co(II) measurements in natural water samples. Although the addition of possibly interfering metal ions (e.g., Fe(II), Zn(II), Cu(II)) at twice higher concentrations than Ni (II) and Co(II) showed no significant effects on the current peaks of Ni(II) and Co(II) using SWAdCSV, it is highly recommended to construct every new calibration curve for accurate Ni(II) and Co(II) measurements in a different water body. In terms of future directions, it is expected that the developed Bi-chitosan-GCE can be used for on-site measurements of Ni(II) and Co(II) in natural and engineered water systems including the AD systems for indirect health monitoring of the process. Moreover, the fabricated sensor can be utilized to construct new calibration curves for simultaneous measurements of Ni(II) and Co(II) in real water bodies.

Supplementary Materials

The following supporting information can be downloaded at: https://0-www-mdpi-com.brum.beds.ac.uk/article/10.3390/w14030302/s1, Figure S1: Experimental setup for electrochemical detection of Ni(II) and Co(II) using SWAdCSV technique; Figure S2: Schematic illustration of (a) metal-chelate complex formation, (b) reduction of glyoxime ligands [33,46]; Figure S3: Optimization of amplitude in the detection of: (a) Ni(II), (b) Co(II). SWAdCSV was performed in 0.1 M ammonia buffer solution at pH 9.2 containing 50 µg L−1 of Ni(II) or Co(II); Figure S4: Impact of electrolyte pH on the stripping peak currents of (a) Ni(II) and (b) Co(II). Ni(II) and Co(II) concentration was fixed at 35 µg L−1; Figure S5: Reproducibility of the Bi-chitosan nanocomposite sensor for the detection of Ni(II) and Co(II) in the natural water samples; Table S1: Optimal SWAdCSV operational conditions for Ni and Co measurements using Bi-chitosan-GCE sensor; Table S2: Optimum values for fitted equivalent circuit elements for Bi-chitosan-GCE EIS measurement; Table S3: Summary of sensor performance in ammonia buffer solution and natural water sample.

Author Contributions

Conceptualization, W.H.L. and J.-H.H.; Formal analysis, W.H.L. and M.P.; Funding acquisition, W.H.L.; Investigation, M.P.; Methodology, M.P., W.H.L. and J.-H.H.; Project administration, W.H.L.; Supervision, W.H.L.; Validation, J.S., V.A. and K.C.-T.; Writing—original draft, M.P.; Writing—review & editing, M.P., W.H.L. and J.-H.H. All authors have read and agreed to the published version of the manuscript.

Funding

This research was funded by the Ministry of Land, Infrastructure, and Transport grant number [21UGCP-B157945-02].

Institutional Review Board Statement

Not applicable.

Informed Consent Statement

Not applicable.

Data Availability Statement

The data presented in this study are available on request from the corresponding author.

Acknowledgments

This work was supported by the Korea Agency for Infrastructure Technology Advancement (KAIA) grant funded by the Ministry of Land, Infrastructure, and Transport (Grant Number: 21UGCP-B157945-02). All authors have consented to the acknowledgement.

Conflicts of Interest

The authors declare no conflict of interest.

References

  1. Molaey, R.; Bayrakdar, A.; Sürmeli, R.Ö.; Çalli, B. Influence of trace element supplementation on anaerobic digestion of chicken manure: Linking process stability to methanogenic population dynamics. J. Clean. Prod. 2018, 181, 794–800. [Google Scholar] [CrossRef]
  2. Capson-Tojo, G.; Moscoviz, R.; Ruiz, D.; Santa-Catalina, G.; Trably, E.; Rouez, M.; Crest, M.; Steyer, J.-P.; Bernet, N.; Delgenès, J.-P. Addition of granular activated carbon and trace elements to favor volatile fatty acid consumption during anaerobic digestion of food waste. Bioresour. Technol. 2018, 260, 157–168. [Google Scholar] [CrossRef] [PubMed]
  3. Yazdanpanah, A.; Ghasimi, D.S.; Kim, M.G.; Nakhla, G.; Hafez, H.; Keleman, M. Impact of trace element supplementation on mesophilic anaerobic digestion of food waste using Fe-rich inoculum. Environ. Sci. Pollut. Res. 2018, 25, 29240–29255. [Google Scholar] [CrossRef]
  4. Du, N.; Li, M.; Zhang, Q.; Ulsido, M.D.; Xu, R.; Huang, W. Study on the biogas potential of anaerobic digestion of coffee husks wastes in Ethiopia. Waste Manag. Res. 2021, 39, 291–301. [Google Scholar] [CrossRef]
  5. Bougrier, C.; Dognin, D.; Laroche, C.; Rivero, J.A.C. Use of trace elements addition for anaerobic digestion of brewer’s spent grains. J. Environ. Manag. 2018, 223, 101–107. [Google Scholar] [CrossRef]
  6. Takashima, M.; Shimada, K.; Speece, R.E. Minimum requirements for trace metals (iron, nickel, cobalt, and zinc) in thermophilic and mesophilic methane fermentation from glucose. Water Environ. Res. 2011, 83, 339–346. [Google Scholar] [CrossRef] [PubMed]
  7. Liu, Y.; Serrano, A.; Wyman, V.; Southam, G.; Vaughan, J.; Villa-Gomez, D. Ni Stress to Sulphate Reducing Bacteria Enhances Ni Complexation: Opportunity for Ni-Co Separation from wastewater. In Proceedings of the 16th World Congress on Anaerobic Digestion, Delft, The Netherlands, 23–27 June 2019. [Google Scholar]
  8. Harada, H.; Uemura, S.; Momonoi, K. Interaction between sulfate-reducing bacteria and methane-producing bacteria in UASB reactors fed with low strength wastes containing different levels of sulfate. Water Res. 1994, 28, 355–367. [Google Scholar] [CrossRef]
  9. Jiang, H.; Qin, Y.; Hu, B. Dispersive liquid phase microextraction (DLPME) combined with graphite furnace atomic absorption spectrometry (GFAAS) for determination of trace Co and Ni in environmental water and rice samples. Talanta 2008, 74, 1160–1165. [Google Scholar] [CrossRef] [PubMed]
  10. Hwang, J.-H.; Fox, D.; Stanberry, J.; Anagnostopoulos, V.; Zhai, L.; Lee, W.H. Direct Mercury Detection in Landfill Leachate Using a Novel AuNP-Biopolymer Carbon Screen-Printed Electrode Sensor. Micromachines 2021, 12, 649. [Google Scholar] [CrossRef]
  11. Hwang, J.-H.; Pathak, P.; Wang, X.; Rodriguez, K.L.; Cho, H.J.; Lee, W.H. A novel bismuth-chitosan nanocomposite sensor for simultaneous detection of Pb (II), Cd (II) and Zn (II) in wastewater. Micromachines 2019, 10, 511. [Google Scholar] [CrossRef] [Green Version]
  12. Lu, Y.; Liang, X.; Niyungeko, C.; Zhou, J.; Xu, J.; Tian, G. A review of the identification and detection of heavy metal ions in the environment by voltammetry. Talanta 2018, 178, 324–338. [Google Scholar] [CrossRef]
  13. Abollino, O.; Malandrino, M.; Berto, S.; La Gioia, C.; Maruccia, V.; Conca, E.; Ruo Redda, A.; Giacomino, A. Stripping voltammetry for field determination of traces of copper in soil extracts and natural waters. Microchem. J. 2019, 149, 104015. [Google Scholar] [CrossRef]
  14. Hwang, J.-H.; Wang, X.; Zhao, D.; Rex, M.M.; Cho, H.J.; Lee, W.H. A novel nanoporous bismuth electrode sensor for in situ heavy metal detection. Electrochim. Acta 2019, 298, 440–448. [Google Scholar] [CrossRef]
  15. Hwang, J.-H.; Wang, X.; Pathak, P.; Rex, M.M.; Cho, H.J.; Lee, W.H. Enhanced electrochemical detection of multiheavy metal ions using a biopolymer-coated planar carbon electrode. IEEE Trans. Instrum. Meas. 2019, 68, 2387–2393. [Google Scholar] [CrossRef]
  16. Taylor, R.; Humffray, A. Electrochemical studies on glassy carbon electrodes: I. Electron transfer kinetics. J. Electroanal. Chem. Interfacial Electrochem. 1973, 42, 347–354. [Google Scholar] [CrossRef]
  17. Adenier, A.; Chehimi, M.M.; Gallardo, I.; Pinson, J.; Vilà, N. Electrochemical oxidation of aliphatic amines and their attachment to carbon and metal surfaces. Langmuir 2004, 20, 8243–8253. [Google Scholar] [CrossRef] [PubMed]
  18. Mardegan, A. Advanced Materials for Inorganic Pollutants Electroanalysis. Ph.D. Thesis, Università Ca’ Foscari Venezia, Venice, Italy, 2013. [Google Scholar]
  19. Standard Electrode Potentials. Available online: http://www.benjamin-mills.com/chemistry/ecells.htm#top (accessed on 13 October 2021).
  20. Brett, C.M.A.; Oliveira Brett, A.M.C.F.; Pereira, J.L.C. Adsorptive stripping voltammetry of cobalt and nickel in flow systems at wall-jet electrodes. Electroanalysis 1991, 3, 683–689. [Google Scholar] [CrossRef]
  21. Paneli, M.G.; Voulgaropoulos, A. Applications of adsorptive stripping voltammetry in the determination of trace and ultratrace metals. Electroanalysis 1993, 5, 355–373. [Google Scholar] [CrossRef]
  22. Li, H.; Smart, R.B. Catalytic stripping voltammetry of vanadium in the presence of dihydroxynaphthalene and bromate. Anal. Chim. Acta 1996, 333, 131–138. [Google Scholar] [CrossRef]
  23. Piech, R.; Baś, B.; Kubiak, W.W. The cyclic renewable mercury film silver based electrode for determination of molybdenum(VI) traces using adsorptive stripping voltammetry. Talanta 2008, 76, 295–300. [Google Scholar] [CrossRef]
  24. Kapturski, P.; Bobrowski, A. The silver amalgam film electrode in catalytic adsorptive stripping voltammetric determination of cobalt and nickel. J. Electroanal. Chem. 2008, 617, 1–6. [Google Scholar] [CrossRef]
  25. Morfobos, M.; Economou, A.; Voulgaropoulos, A. Simultaneous determination of nickel (II) and cobalt (II) by square wave adsorptive stripping voltammetry on a rotating-disc bismuth-film electrode. Anal. Chim. Acta 2004, 519, 57–64. [Google Scholar] [CrossRef]
  26. Kokkinos, C.; Economou, A.; Raptis, I.; Efstathiou, C.E.; Speliotis, T. Novel disposable bismuth-sputtered electrodes for the determination of trace metals by stripping voltammetry. Electrochem. Commun. 2007, 9, 2795–2800. [Google Scholar] [CrossRef]
  27. Korolczuk, M.; Rutyna, I.; Tyszczuk, K. Adsorptive stripping voltammetry of nickel at an in situ plated bismuth film electrode. Electroanalysis 2010, 22, 1494–1498. [Google Scholar] [CrossRef]
  28. Worsfold, P.; Townshend, A.; Poole, C.F.; Miró, M. Encyclopedia of Analytical Science; Elsevier: Amsterdam, The Netherlands, 2019. [Google Scholar]
  29. Cardoso, W.S.; Dias, V.L.; Costa, W.M.; de Araujo Rodrigues, I.; Marques, E.P.; Sousa, A.G.; Boaventura, J.; Bezerra, C.W.; Song, C.; Liu, H.; et al. Nickel-dimethylglyoxime complex modified graphite and carbon paste electrodes: Preparation and catalytic activity towards methanol/ethanol oxidation. J. Appl. Electrochem. 2009, 39, 55–64. [Google Scholar] [CrossRef]
  30. Economou, A.; Fielden, P. Applications, potentialities and limitations of adsorptive stripping analysis on mercury film electrodes. TrAC Trends Anal. Chem. 1997, 16, 286–292. [Google Scholar] [CrossRef]
  31. Wang, J.; Lu, J.; Hocevar, S.B.; Farias, P.A.; Ogorevc, B. Bismuth-coated carbon electrodes for anodic stripping voltammetry. Anal. Chem. 2000, 72, 3218–3222. [Google Scholar] [CrossRef] [PubMed]
  32. Pathak, P.; Hwang, J.-H.; Li, R.H.; Rodriguez, K.L.; Rex, M.M.; Lee, W.H.; Cho, H.J. Flexible copper-biopolymer nanocomposite sensors for trace level lead detection in water. Sens. Actuators B Chem. 2021, 344, 130263. [Google Scholar] [CrossRef]
  33. Legeai, S.; Bois, S.; Vittori, O. A copper bismuth film electrode for adsorptive cathodic stripping analysis of trace nickel using square wave voltammetry. J. Electroanal. Chem. 2006, 591, 93–98. [Google Scholar] [CrossRef]
  34. Economou, A.; Voulgaropoulos, A. Stripping Voltammetry of Trace Metals at Bismuth-Film Electrodes by Batch-Injection Analysis. Electroanalysis 2010, 22, 1468–1475. [Google Scholar] [CrossRef]
  35. Economou, A.; Voulgaropoulos, A. On-line stripping voltammetry of trace metals at a flow-through bismuth-film electrode by means of a hybrid flow-injection/sequential-injection system. Talanta 2007, 71, 758–765. [Google Scholar] [CrossRef]
  36. Rutyna, I.; Korolczuk, M. Catalytic adsorptive stripping voltammetry of cobalt in the presence of nitrite at an in situ plated bismuth film electrode. Electroanalysis 2011, 23, 637–641. [Google Scholar] [CrossRef]
  37. Mardegan, A.; Dal Borgo, S.; Scopece, P.; Moretto, L.; Hočevar, S.; Ugo, P. Simultaneous Adsorptive Cathodic Stripping Voltammetric Determination of Nickel (II) and Cobalt (II) at an In Situ Bismuth-Modified Gold Electrode. Electroanalysis 2013, 25, 2471–2479. [Google Scholar] [CrossRef]
  38. Pokpas, K.; Jahed, N.; Baker, P.G.; Iwuoha, E.I. Complexation-based detection of nickel (II) at a graphene-chelate probe in the presence of cobalt and zinc by adsorptive stripping voltammetry. Sensors 2017, 17, 1711. [Google Scholar] [CrossRef] [PubMed] [Green Version]
  39. Švancara, I.; Prior, C.; Hočevar, S.B.; Wang, J. A decade with bismuth-based electrodes in electroanalysis. Electroanalysis 2010, 22, 1405–1420. [Google Scholar] [CrossRef]
  40. Alves, G.M.; Magalhães, J.M.; Soares, H.M. Simultaneous determination of nickel and cobalt using a solid bismuth vibrating electrode by adsorptive cathodic stripping voltammetry. Electroanalysis 2013, 25, 1247–1255. [Google Scholar] [CrossRef]
  41. Miller, J.N. Basic statistical methods for analytical chemistry. Part 2. Calibration and regression methods. A review. Analyst 1991, 116, 3–14. [Google Scholar] [CrossRef]
  42. Scholz, F. Voltammetric techniques of analysis: The essentials. ChemTexts 2015, 1, 1–24. [Google Scholar] [CrossRef] [Green Version]
  43. Godycki, L.E.; Rundle, R. The structure of nickel dimethylglyoxime. Acta Crystallogr. 1953, 6, 487–495. [Google Scholar] [CrossRef] [Green Version]
  44. Bambenek, M.A.; Pflaum, R. The reaction of nickel with dioximes. Inorg. Chem. 1963, 2, 289–292. [Google Scholar] [CrossRef]
  45. Ma, F.; Jagner, D.; Renman, L. Mechanism for the electrochemical stripping reduction of the nickel and cobalt dimethylglyoxime complexes. Anal. Chem. 1997, 69, 1782–1784. [Google Scholar] [CrossRef] [PubMed]
  46. Baxter, L.A.; Bobrowski, A.; Bond, A.M.; Heath, G.A.; Paul, R.L.; Mrzljak, R.; Zarebski, J. Electrochemical and spectroscopic investigation of the reduction of dimethylglyoxime at mercury electrodes in the presence of cobalt and nickel. Anal. Chem. 1998, 70, 1312–1323. [Google Scholar] [CrossRef]
  47. Kokkinos, C.; Economou, A.; Raptis, I.; Speliotis, T. Disposable lithographically fabricated bismuth microelectrode arrays for stripping voltammetric detection of trace metals. Electrochem. Commun. 2011, 13, 391–395. [Google Scholar] [CrossRef]
  48. Ruhlig, D.; Schulte, A.; Schuhmann, W. An electrochemical robotic system for routine cathodic adsorptive stripping analysis of Ni2+ ion release from corroding NiTi shape memory alloys. Electroanal. Int. J. Devoted Fundam. Pract. Asp. Electroanal. 2006, 18, 53–58. [Google Scholar] [CrossRef]
  49. Bing, C.; Deen, R.; Khang, G.N.; Sai, C.L.; Kryger, L. Chemical accumulation and voltammetric determination of traces of nickel (II) at glassy carbon electrodes modified with dimethyl glyoxime containing polymer coatings. Talanta 1999, 49, 651–659. [Google Scholar] [CrossRef]
  50. Tartarotti, F.O.; de Oliveira, M.F.; Balbo, V.R.; Stradiotto, N.R. Determination of nickel in fuel ethanol using a carbon paste modified electrode containing dimethylglyoxime. Microchim. Acta 2006, 155, 397–401. [Google Scholar] [CrossRef]
  51. Ferancová, A.; Hattuniemi, M.K.; Sesay, A.M.; Räty, J.P.; Virtanen, V.T. Rapid and direct electrochemical determination of Ni (II) in industrial discharge water. J. Hazard. Mater. 2016, 306, 50–57. [Google Scholar] [CrossRef]
  52. Kang, X.; Wang, J.; Wu, H.; Aksay, I.A.; Liu, J.; Lin, Y. Glucose oxidase–graphene–chitosan modified electrode for direct electrochemistry and glucose sensing. Biosens. Bioelectron. 2009, 25, 901–905. [Google Scholar] [CrossRef]
  53. Yin, K.; Cui, Z.; Yang, X.; Zhu, S.; Li, Z.; Liang, Y. Nanocrystal Bismuth Telluride Electrocatalysts for Highly Efficient Oxygen Reduction. J. Electrochem. Soc. 2015, 162, H785. [Google Scholar] [CrossRef]
  54. Alipoori, S.; Rouhi, H.; Linn, E.; Stumpfl, H.; Mokarizadeh, H.; Esfahani, M.R.; Koh, A.; Weinman, S.T.; Wujcik, E.K. Polymer-Based Devices and Remediation Strategies for Emerging Contaminants in Water. ACS Appl. Polym. Mater. 2021, 3, 549–577. [Google Scholar] [CrossRef]
  55. Webster, A.; Halling, M.D.; Grant, D.M. Metal complexation of chitosan and its glutaraldehyde cross-linked derivative. Carbohydr. Res. 2007, 342, 1189–1201. [Google Scholar] [CrossRef]
  56. Ariunbaatar, J.; Esposito, G.; Yeh, D.H.; Lens, P.N. Enhanced anaerobic digestion of food waste by supplementing trace elements: Role of selenium (VI) and iron (II). Front. Environ. Sci. 2016, 4, 8. [Google Scholar] [CrossRef] [Green Version]
  57. Shaker, S.A. Preparation and spectral properties of mixed-ligand complexes of VO (IV), Ni (II), Zn (II), Pd (II), Cd (II) and Pb (II) with dimethylglyoxime and N-Acetylglycine. E-J. Chem. 2010, 7, S580–S586. [Google Scholar] [CrossRef] [Green Version]
  58. Burger, K.; Ruff, I.; Ruff, F. Some theoretical and practical problems in the use of organic reagents in chemical analysis—IV: Infra-red and ultra-violet spectrophotometric study of the dimethylglyoxime complexes of transition metals. J. Inorg. Nucl. Chem. 1965, 27, 179–190. [Google Scholar] [CrossRef]
  59. Mahmoud, M.E.; Kenawy, I.; Hafez, M.A.; Lashein, R. Removal, preconcentration and determination of trace heavy metal ions in water samples by AAS via chemically modified silica gel N-(1-carboxy-6-hydroxy) benzylidenepropylamine ion exchanger. Desalination 2010, 250, 62–70. [Google Scholar] [CrossRef]
  60. Available online: https://www.elgalabwater.com/impurities (accessed on 26 November 2021).
Figure 1. Optimization of SWAdCSV operating parameters for Ni(II) detection: (a) deposition potential, (b) frequency, (c) DMG concentration, and (d) deposition time. SWAdCSV was performed in 0.1 M ammonia buffer solution at pH 9.2 containing 50 µg L−1 of Ni(II).
Water 14 00302 g001
Figure 2. Optimization of SWAdCSV operating parameters for Co(II) detection: (a) deposition potential, (b) frequency, (c) DMG concentration, and (d) deposition time. SWAdCSV was performed in 0.1 M ammonia buffer solution at pH 9.2 containing 50 µg L−1 of Co(II).
Water 14 00302 g002
Figure 3. Characterization and evaluation of the Bi-chitosan sensor for Ni(II) detection. (a) SWAdCSV with various Ni(II) concentrations (5–100 µg L−1) and (b) a corresponding calibration curve. Deposition time is 120 s with a deposition potential of −0.9 V, frequency of 120 Hz, amplitude of 50 mV, and DMG concentration of 0.2 mM.
Water 14 00302 g003
Figure 4. Characterization and evaluation of the Bi-chitosan sensor for Co(II) detection. (a) SWAdCSV with various Co(II) concentrations (2–100 µg L−1) and (b) a corresponding calibration curve. Deposition time is 120 s with a deposition potential of −0.7 V, frequency of 60 Hz, amplitude of 50 mV, and DMG concentration of 0.2 mM.
Water 14 00302 g004
Figure 5. Nyquist diagrams of a bare GCE, a chitosan-GCE, and a Bi-chitosan-GCE sensor. (Inset: data in the range between 0 to 20,000 Z′ (Ω)).
Water 14 00302 g005
Figure 6. Possible interference of other metal ions on sensor performance for the detection of (a) Ni(II) and (b) Co(II). Ni(II) and Co(II) concentration was fixed at 35 µg L−1. 70 µg L−1 of Fe(II), Zn(II), and Cu(II) were added to the standard solution individually, or a mixture of 70 µg L−1 of Fe(II), Zn(II), and Cu(II) was added to the solution.
Water 14 00302 g006
Figure 7. Characterization and evaluation of the Bi-chitosan sensor for Ni(II) detection in real natural water samples. (a) SWAdCSV with various Ni(II) concentrations (5–50 µg L−1) and (b) a corresponding calibration curve. Deposition time is 120 s with a deposition potential of −0.9 V, frequency of 120 Hz, amplitude of 50 mV, and DMG concentration of 0.2 mM.
Water 14 00302 g007
Figure 8. Characterization and evaluation of the Bi-chitosan sensor for Co(II) detection in real natural water samples. (a) SWAdCSV with various Co(II) concentrations (2–50 µg L−1) and (b) a corresponding calibration curve. Deposition time is 120 s with a deposition potential of −0.7 V, frequency of 60 Hz, amplitude of 50 mV, and DMG concentration of 0.2 mM.
Water 14 00302 g008
Table 1. Comparison of Ni(II) and Co(II) detection between the modified Bi-chitosan GCE sensor and other sensors previously reported.
Metal IonsElectrode SubstrateAnalytical MethodDeposition Time (s)Linear Range
(µg L−1)
LOD a (Ni(II))
(µg L−1)
LOD (Co(II))
(µg L−1)
Ref.
Ni(II) & Co(II) bSolid Bi vibrating electrodeSWAdCSV c30Up to10 0.6 1[39]
Ni(II) & Co(II) bBi-modified GCESWAdCSV120N/A d0.10.07[28]
Ni(II) & Co(II)Bi-modified Gold electrodeSWAdCSV120N/A0.0980.058[29]
Ni(II) Sputtered Bi-film micro disk arraySWAdCSV60Up to 60 2.7 - [47]
Ni(II)Copper Bi-film electrodeSWAdCSV6005.9–59 6 -[35]
Ni(II)Bi modified GCESWAdCSV300Up to 100.1 -[48]
Ni(II)polyvinyl chloride-polyaniline- dimethylglyoxime-GCE (PVC-PA-DMG-GCE)SWAdCSV12018–180 18-[49]
Ni(II)dimethylglyoxime-carbon paste electrode (DMG-CPE)DPAdCSV e150080–60027-[50]
Ni(II)dimethylglyoxime-Nafion-screen sprinted electrode (DMG-N/SPE)DPAdCSV12060–50030-[51]
Ni(II)nafion-graphene dimethylglyoxime-GCE (NGr-DMG-GCE)SWAdCSV2402–201.5-[40]
Ni(II)Bi-chitosan modified GCESWAdCSV120Up to 100 3.6 -This study
Co(II)Bi-chitosan modified GCESWAdCSV120Up to 100 -2.4This study
a LOD; limit of detection, b simultaneous detection of Ni and Co, c SWAdCSV; square-wave adsorptive cathodic stripping voltammetry, d N/A; not applicable, e DPAdCSV: differential pulse adsorptive cathodic stripping voltammetry.
Publisher’s Note: MDPI stays neutral with regard to jurisdictional claims in published maps and institutional affiliations.

