
Impacts of Flood Disturbance on the Dynamics of Basin-Scale Swimming Fish Migration in Mountainous Streams


1
River Basin Research Center, Gifu University, Gifu 501-1193, Japan
2
Regional Adaptation Research Center, Gifu University, Gifu 501-1193, Japan
*
Author to whom correspondence should be addressed.
Water 2022, 14(4), 538; https://0-doi-org.brum.beds.ac.uk/10.3390/w14040538
Submission received: 11 January 2022
/
Revised: 4 February 2022
/
Accepted: 8 February 2022
/
Published: 12 February 2022
(This article belongs to the Special Issue Research on Hydraulics of Migration Route of Aquatic Animals)
Abstract
:This study investigated the response of sweetfish (Plecoglossus altivelis), a species that migrates dynamically throughout a river basin, to two flood events during the summer of 2020 in the Nagara River, located in the central region of Japan. By combining multiple environmental DNA (eDNA) surveys and hydrological modeling, the spatiotemporal distribution of P. altivelis throughout a mountainous river basin was captured and analyzed. The eDNA concentrations at 42 sites in the Nagara River Basin were analyzed five times from August to early October 2020. In addition, Rainfall–Runoff–Inundation model calculations were performed using 1-km resolution precipitation data as input values to analyze the magnitude of the flood disturbance at the eDNA sites. The daily specific discharge Qs (m3/s/km2) was employed as an index of the flood magnitude. The calculation period included Flood Events 1 and 2 with 52 and 38 days of precipitation reaching 1923 and 528 mm, respectively. The results of the eDNA analysis showed that, immediately after Flood Event 1, the spatial distribution of P. altivelis was unevenly distributed in the upper reaches of the Nagara River and some of its tributaries. Subsequently, the distribution expanded to the entire mainstem. The distribution of the maximum daily specific discharge suggested that the river segments with high eDNA concentrations of P. altivelis immediately after the high-magnitude flood event were those with a relatively low intensity of flood disturbance compared with those in the other connected river segments and tributaries. The results of this study indicate that the resilience of riverine communities to extreme floods is supported by the continuity and connectivity between the mainstem and its tributaries in mountainous river basins.
1. Introduction
Flow fluctuation is one of the most universal phenomena in rivers [1] and is a critical factor that determines the characteristics of river ecosystems [2]. Human activities, such as dam construction, affect natural flow regimes, with their effects varying depending on the species of plants and animals [3]. Flood disturbances have a strong impact on the diversity of riverine ecosystems. From mountain streams to lowland rivers, riverine fishes have a life history adapted to flooding [4,5]; however, extreme flood events can also eliminate individual organisms and significantly alter the biota [3,6,7,8]. Riverine fishes are known to use various locations as refuges during floods [9]. In a river with a gentle gradient, the inundation area with a low flow velocity is used as a refuge [10], whereas, in a steep mountainous stream, the external forces acting on the streambed by floods are large, limiting the space for organisms to take refuge. Stable boulders in streams may serve as refuges from floods [11]. In addition, tributaries serve as important refuge areas during mainstream floods [12]. Although some information at limited spatial scales is available on flood refuges for fish in mountainous streams, the migration patterns of highly mobile fishes within a river basin in response to flood disturbance have not been investigated at the river basin scale.
In recent years, the environmental DNA (eDNA) analysis method has made it easier to determine the distribution of species using simple water sampling [13,14]. In addition, a quantitative evaluation of the abundance of freshwater fishes using eDNA analysis has been reported [15]. However, eDNA concentration is an unstable indicator that fluctuates depending on the environmental conditions [16]. To properly interpret the results of the eDNA analysis, the complex and dynamic environments from which eDNA is sampled need to be considered for accurate biological interpretation [17]. One solution to this problem is the integration of eDNA analysis with hydrological observations and models, which has the potential to create new values for understanding and better managing river ecosystems [17,18].
Therefore, we proposed a pioneering approach that combines multiple eDNA surveys and hydrological modeling to capture and analyze fish migration in response to flood disturbance throughout a mountainous river basin, focusing on the sweetfish Plecoglossus altivelis as a model species. Multiple eDNA surveys were conducted before and after flood events to capture the response of organisms to flood disturbances. To accurately estimate the degree of flood disturbance acting on each river segment in a river system, hydrological model calculations were performed using high spatiotemporal resolution precipitation data as the input values. This combination was applied to determine the relationship between flood disturbance and the spatiotemporal distribution of highly mobile organisms at the river basin scale, illustrating how the swimming fish P. altivelis responded to the flood event that occurred during the summer of 2020 in the Nagara River Basin, located in the central region of Japan. The results of this study will help to enhance our understanding of the resilience of riverine communities to floods. In addition, this approach may be applicable for analyzing the impact of climate change and human activities on the resilience of river ecosystems.
2. Materials and Methods
2.1. Study River
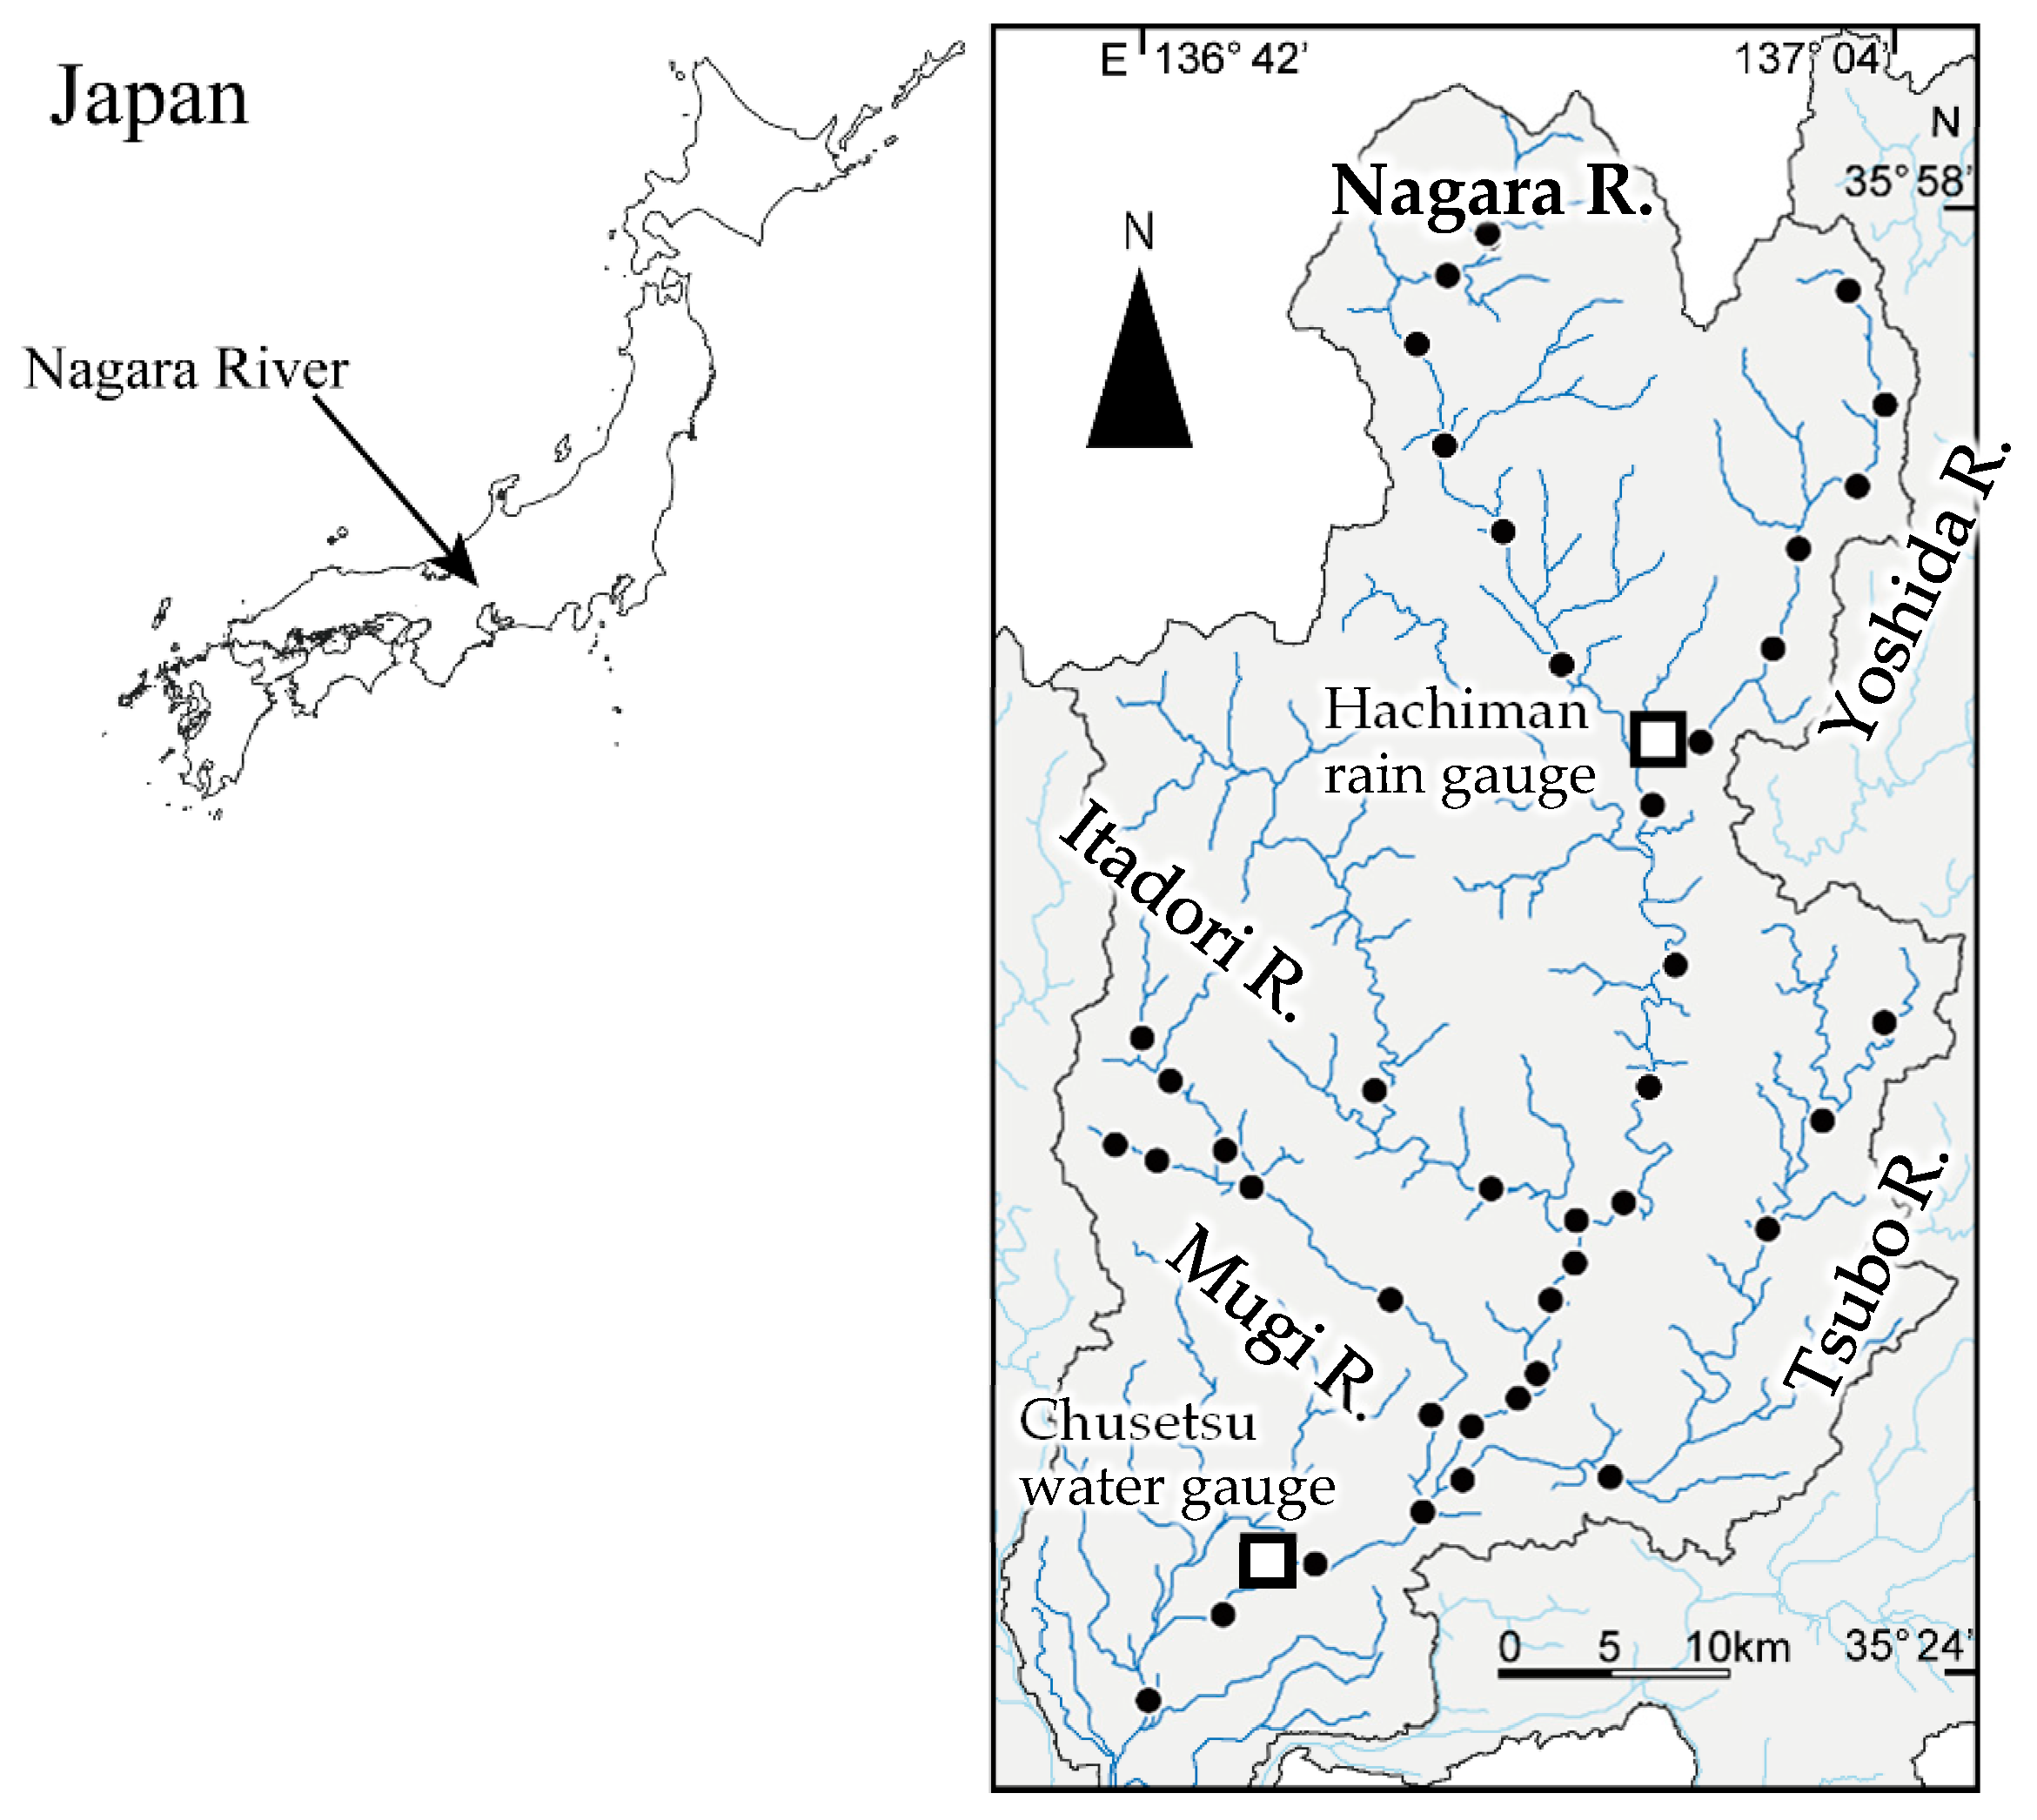
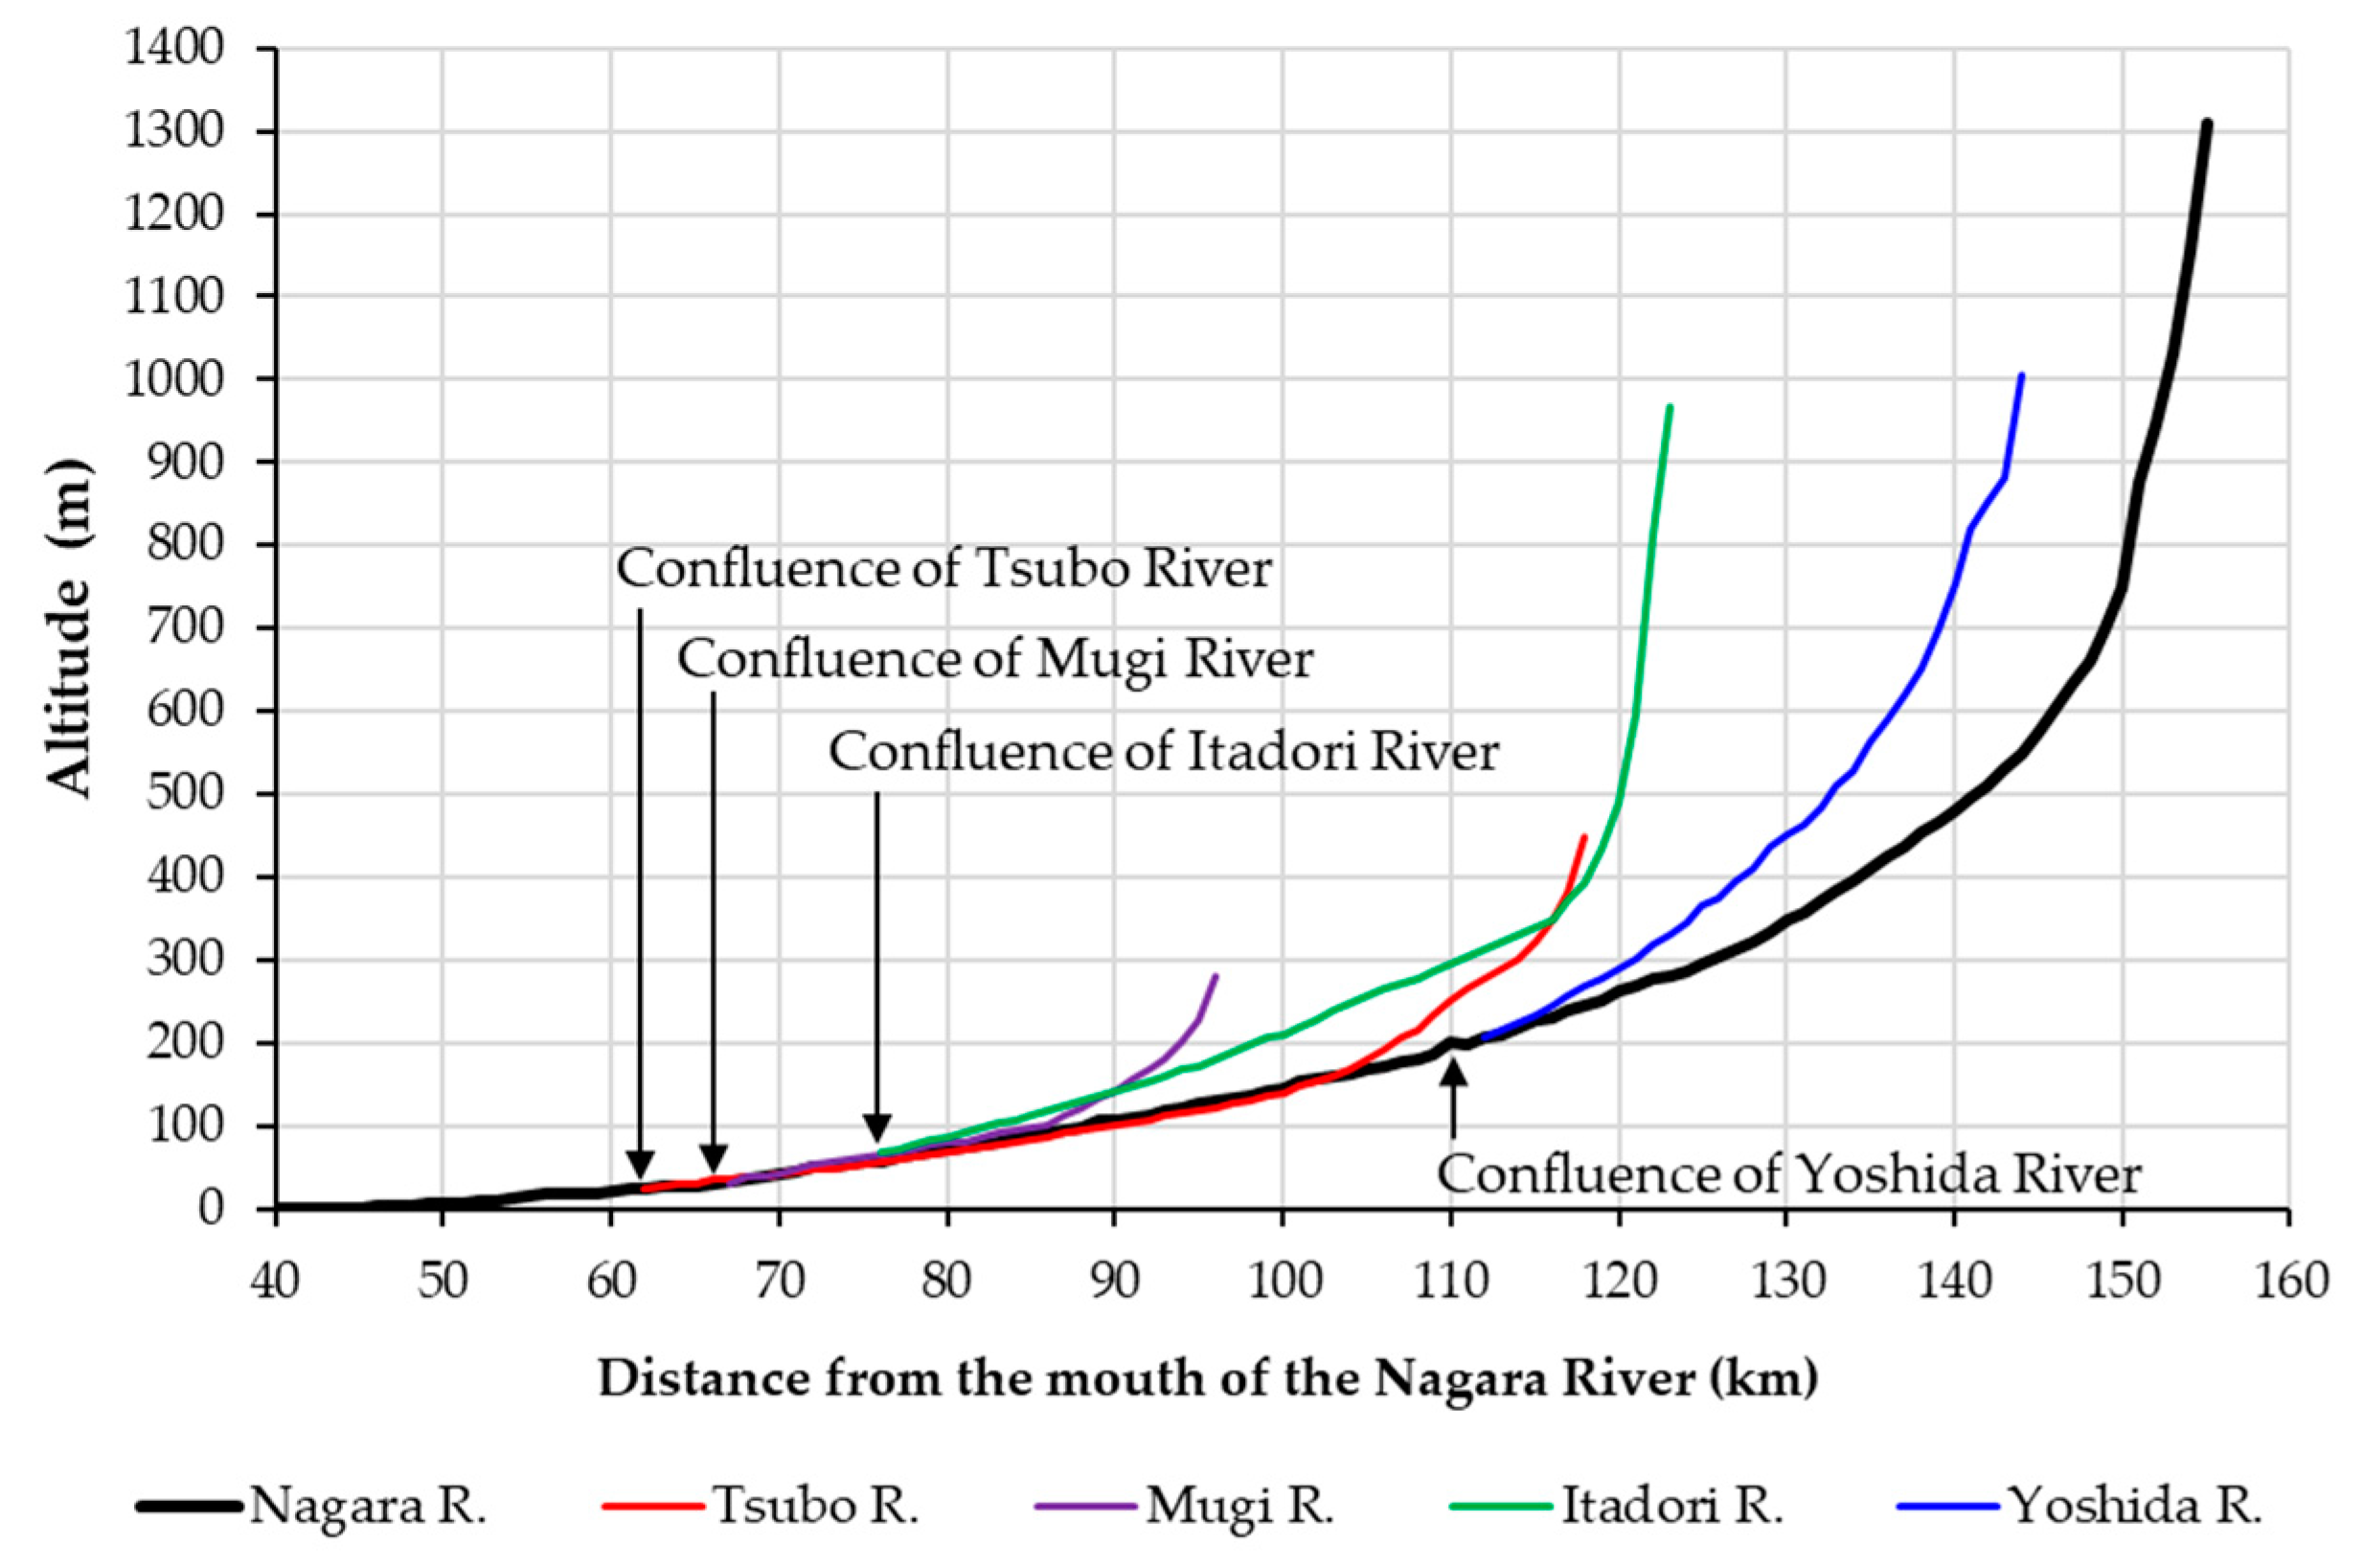
The study was conducted in a middle–upper segment > 42.0 km from the mouth of the Nagara River (mainstem) and in its four main tributaries (Yoshida, Itadori, Mugi, and Tsubo Rivers) in Central Japan (Figure 1). The entire channel length of the Nagara River is 166 km, and its basin area is 1985 km2. The highest point within the watershed is Mt. Dainichi at 1709 m. The longitudinal profiles of the mainstem and the four major tributaries are shown in Figure 2. The sections at approximately 42.0–53.0, 53.0–75.0, and >75.0 km of the Nagara River flow through the alluvial fan, valley bottom plain, and mountain area, respectively. The average bed slope of the alluvial fan and valley bottom plain section is approximately 1/560. The bed slope of the mountain area section ranges from 1/250 to 1/10. Among the four main tributaries, the Yoshida River and the upstream sections of the Itadori River have steeper slopes. The bed material in most of the sections where eDNA surveys were conducted consisted of boulders and gravels. In the section from the valley bottom plain to the alluvial fan of the mainstem, gravel–sand bars are formed and widely appear under normal water conditions. Boulders are particularly common in the upper reaches. There were no dams in the study section of the mainstem of the Nagara River. Therefore, upstream fish migration was ensured through the mainstem. Several check dams with fish passages were present in the Yoshida and Mugi Rivers.
This region and P. altivelis were designated a “globally important agricultural heritage system” by the UN Food and Agricultural Organization in 2015 for their value in combining livelihood, nature, and culture [19]. Plecoglossus altivelis is an amphidromous fish that uses rivers and coastal areas during its annual lifespan. They spend their larval to juvenile stages in estuaries and coastal areas in the winter and migrate to upstream rivers in the spring [20,21]. Furthermore, they have one of the highest swimming abilities among swimming fish. The ratio of their critical swimming speed is 3.1–8.0 times their body length, and the mean ratio is approximately five times their body length [22]. These fish use the middle and upper reaches of rivers as their main habitat during summer growth and feed on algae attached to boulders and cobbles. Mid-October to the end of November is the spawning season in the recent Nagara River, and the main spawning site is located in the alluvial fan section. There are six fishery cooperatives in the study rivers. They release plenty of hatchery-raised P. altivelis juveniles (approximately 10 cm in standard length) in each of their territories every year from April to June, mainly in May. Therefore, both natural and hatchery fish are widely distributed in the Nagara River system during the early summer.
2.2. Flood Events
Japan is located in the Asian monsoon region, where relatively high flows are observed between June and July (East Asian rainy season) and between September and October (typhoon season). From November to May, the flows are relatively low and stable. The precipitation in 2020 was record-breaking, especially in June and July, when torrential rainfall was observed over a wide area of Japan.
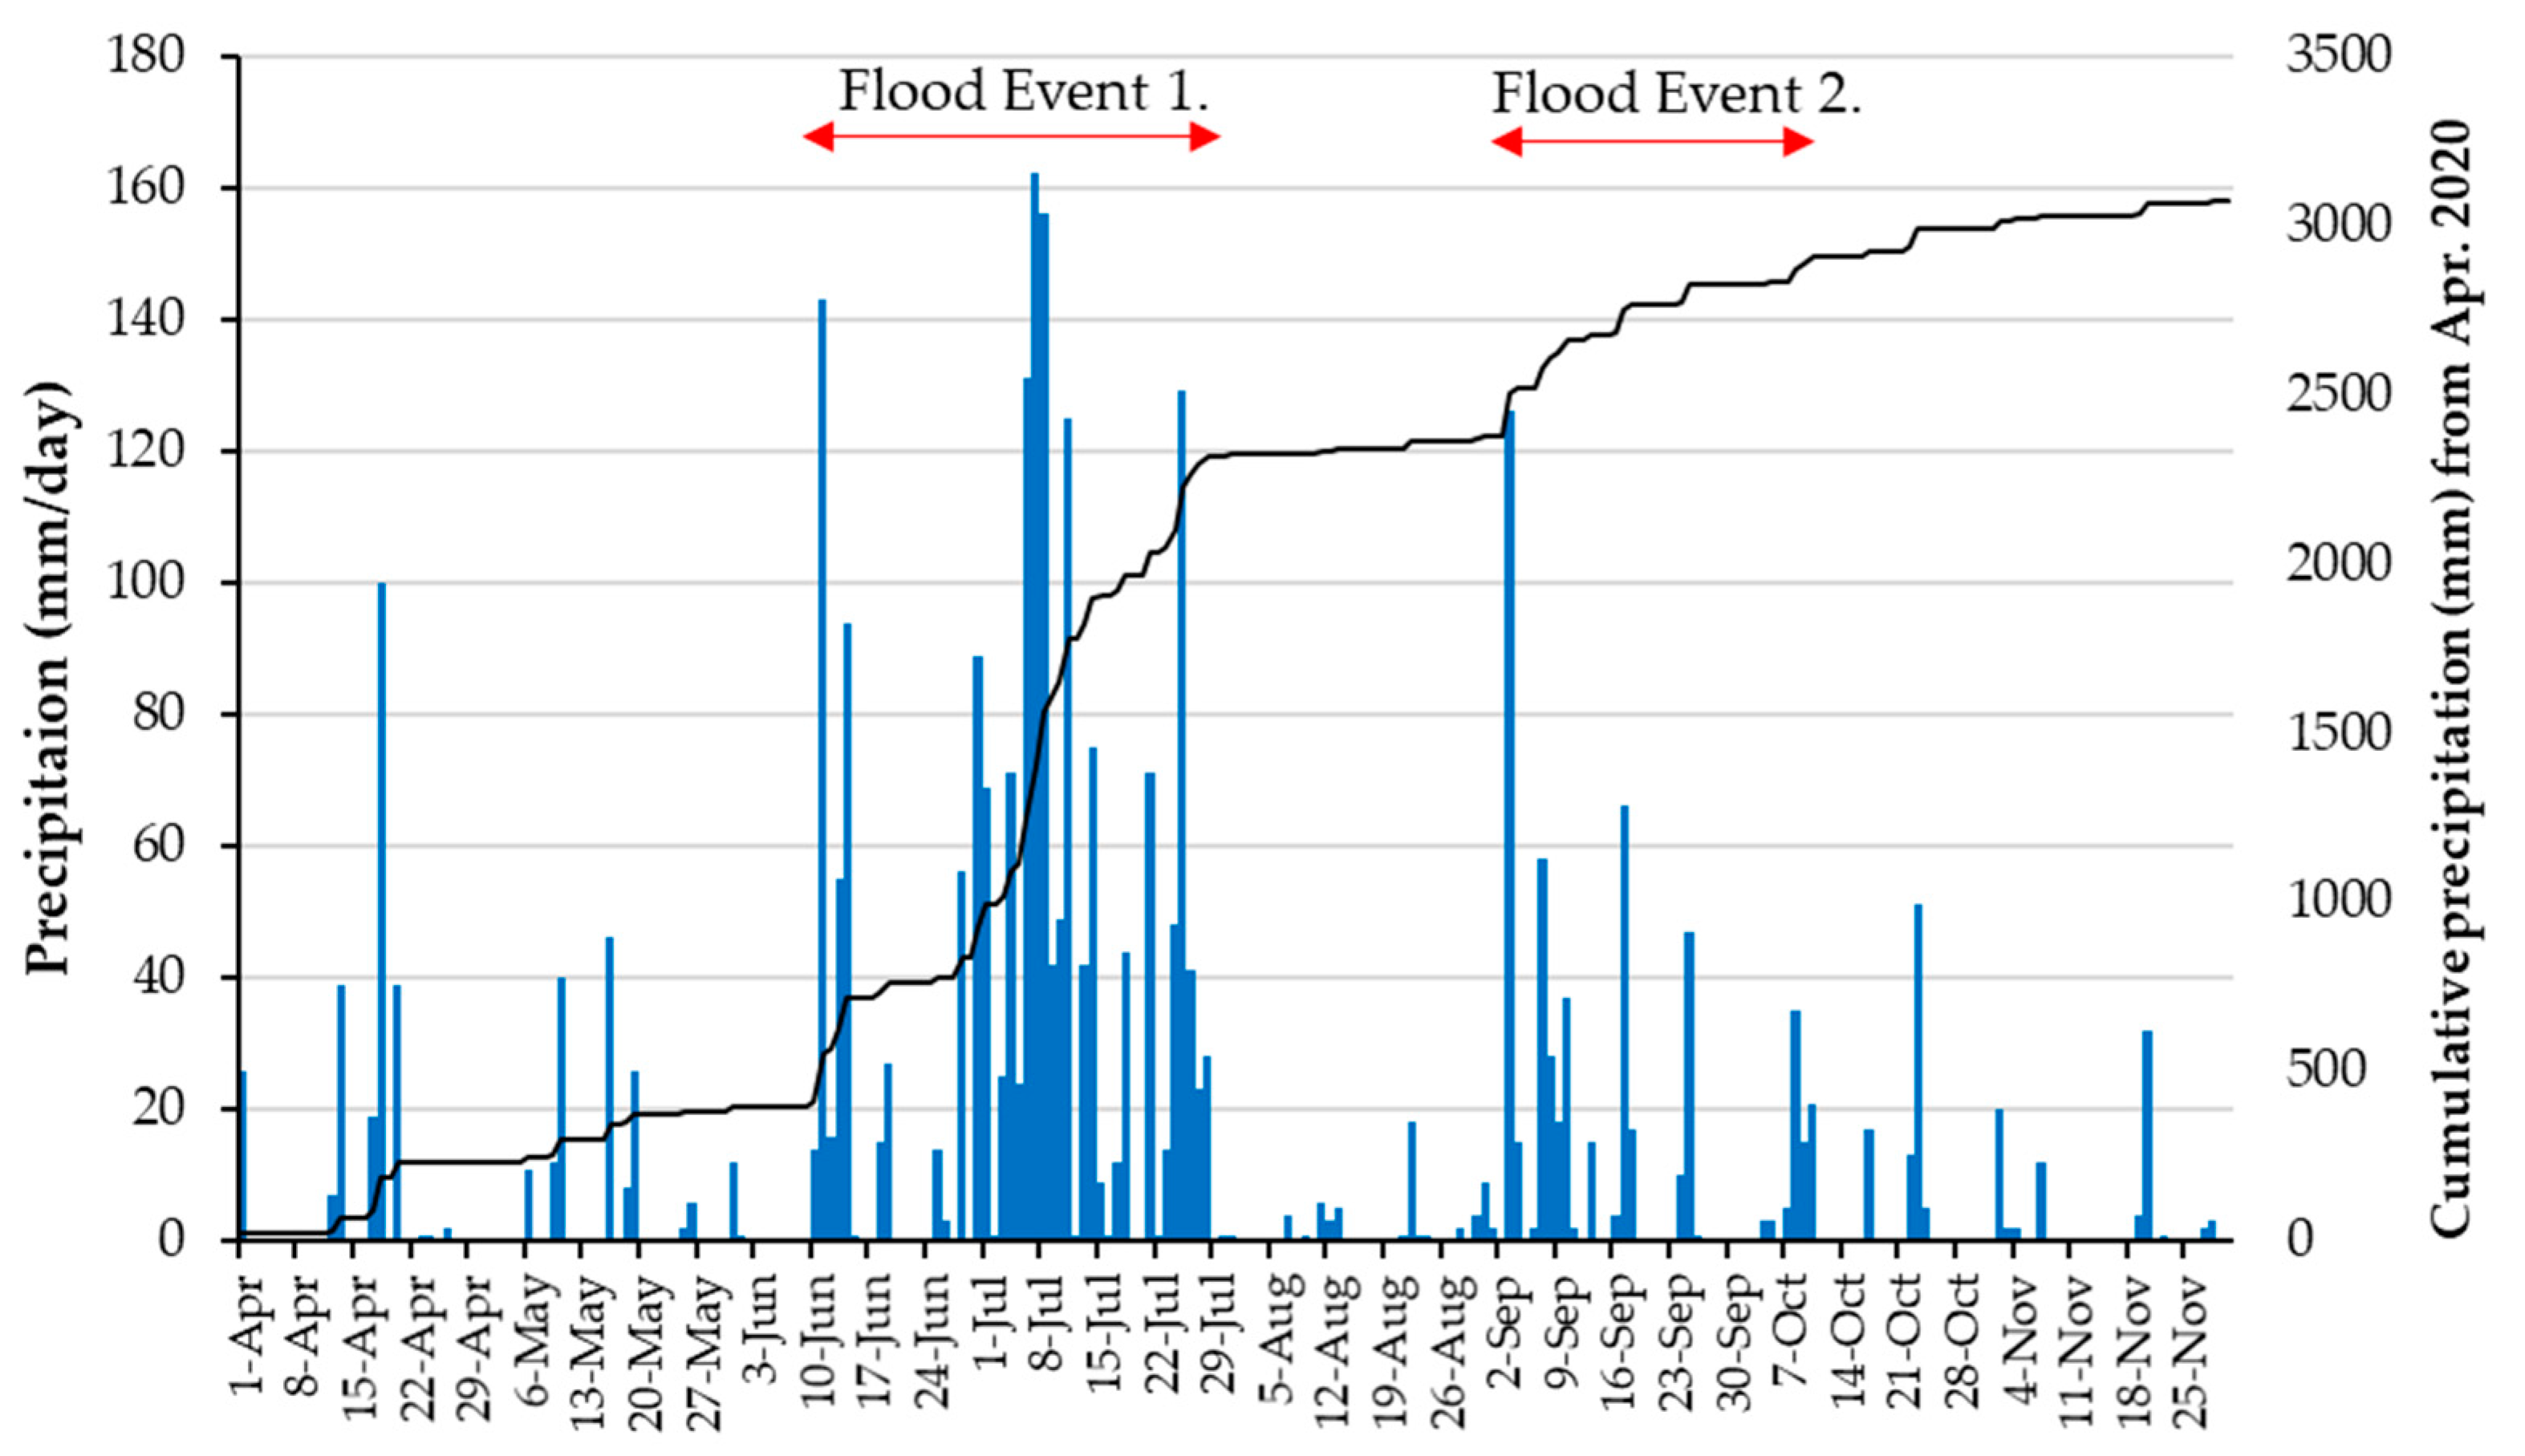
The precipitation observation record at the Hachiman rain gauge located upstream of the Nagara River Basin (Figure 1) is shown in Figure 3. In the 52 days from 10 June to 30 July, 1923 mm of precipitation was observed, which was more than three times that of the normal June and July precipitation at the site. In the Nagara River, intermittent rains during this period caused flooding that lasted for approximately two months. The Yoshida River, one of the main tributaries, experienced heavy runoff in early July (Figure 4). Precipitation was low in August, and strong rainfall due to typhoons was observed several times in September. In total, 528 mm of precipitation was observed in 38 days, from 2 September to 10 October. In this study, these two flood events were defined as Flood Events 1 and 2, respectively.
The effects of “extreme” Flood Event 1 and less severe Flood Event 2 on P. altivelis, which were distributed throughout the Nagara River Basin before the flood event, were analyzed by eDNA survey and a hydrological model analysis.
2.3. eDNA Sampling
The sampling sites were chosen to examine the spatiotemporal distributions of P. altivelis in the Nagara River system immediately after Flood Event 1. Water was sampled for the eDNA assay from 42 sites (mainstem, 20; Yoshida River, 6; Itadori River, 3; Tsubo River, 5; and Mugi River, 8) on each of five sampling days: 11 August, 25 August, 14 September, 23 September, and 6 October (Figure 1). It took two days (those above and the following days) to sample water from the 42 sites. The sampling period corresponded to the summer growing season and just before the autumn spawning season.
We collected 1-L water samples using a polypropylene bottle from the water surfaces at a location with a current velocity of approximately 50 cm/s. Benzalkonium chloride solution (0.1% w/v) was added to the bottles to preserve the eDNA [23]. The samples were stored in a cooler box, along with a 1-L distilled water blank, placed in a laboratory, and refrigerated.
2.4. DNA Filtration, Extraction, and Quantitative Real-Time PCR
The water samples were pulled by vacuum through a 0.7-µm membrane filter (47-mm GF/F glass fiber; GE Healthcare, Little Chalfont, UK) within 2 days of sampling. The cooler blank was then filtered simultaneously. A filtered “equipment blank” (1-L DNA-free water) was incorporated before and after each sample filtration day. The “cooler blank” and “equipment blank” were negative controls, and their DNA levels were measured to identify any DNA contamination from field preparation and transportation, filter equipment, or background sources. The filters were placed in a light-shielding bag and stored at −20 °C until eDNA extraction. DNA extraction was performed according to the method described by Doi et al. [14]. The final volume of each extracted DNA sample was 100 μL, and all samples were stored at −20 °C until the PCR assay.
The eDNA of P. altivelis was quantified via real-time TaqMan PCR (qPCR) using the PikoReal Real-Time PCR system (Thermo Fisher Scientific, Waltham, MA, USA). Mitochondrial cytochrome b gene fragments (131 bp) were amplified and quantified with a TaqMan probe using the following primers: Paa-CytB-Forward: 5′-CCTAGTCTCCCTGGCTTTATTCTCT-3′, Paa-CytB-Reverse: 5′-GTAGAATGGCGTAGGCGAAAA-3′, and Paa-CytB-Probe: 5′-FAM-ACTTCACGGCAGCCAACCCCC-TAMRA-3′. The species-specificity of the primer/probe set was confirmed by Yamanaka and Minamoto [13]. Each TaqMan reaction mixture contained 900 nM of each primer (Paa-CytB—Forward and Reverse), 125-nM Paa-CytB-Probe, 10-µL qPCR Master Mix (TaqMan Environmental Master Mix 2.0; Life Technologies, Carlsbad, CA, USA), 0.4-µL uracil N-glycosylase (Thermo Fisher Scientific), and 4-µL DNA solution. The total reaction mixture volume was 20 µL, which included DNA-free water. The PCR conditions were as follows: 50 °C for 2 min, 95 °C for 10 min, and 55 cycles of 95 °C for 15 s and 60 °C for 1 min. There were three replicates per water sample. Four no-template controls were included in each PCR run. The limit of detection of the qPCR was one copy per reaction, with an average of three replicates. A standard curve was constructed using a dilution series of 10,000 (n = 2), 1000 (n = 2), 100 (n = 2), and 10 copies (n = 2) per PCR reaction. The R2 values of the standard curves ranged from 0.956 to 0.995. The standard samples were the target DNA cloned into the plasmids.
2.5. Rainfall–Runoff–Inundation Model
The Rainfall–Runoff–Inundation (RRI) model [24] was employed to calculate the flow discharge time series at any point on a river that constitutes the Nagara River system. The model is a two-dimensional grid-based model that considers water movement on both slopes and river channels. The model calculation requires rasterized topographic information, as well as distributional rainfall input. In this study, HydroSHEDS [25] with 15-s (approximately 450 m) resolution, provided by the World Wildlife Fund [26], was applied for topographic information. Radar/Rain gauge-Analyzed Precipitation (RA) data from the Japan Meteorological Agency were used as the rainfall input. This dataset is created by combining radar precipitation and ground precipitation, and it represents 1-km grid precipitation with some accuracy [27], even in areas where rain gauges have not been installed. The RRI model, a type of distributed runoff analysis model, was used for the calculations in this study. Any model that can calculate the river discharge at any point in the watershed using the spatiotemporal distribution of rainfall as an input value can be adopted as an alternative method.
The RRI model requires the operator to set the parameters for the calculations. Most of the variables are provided by RRI_BUILDER, a GUI application for setting up RRI models. In this study, nine sets of parameters were set for each grid, depending on the combination of land cover and soil, which were automatically set by RRI_BUILDER. Calibration was performed using RA data from 2018 to set the appropriate parameters. The model parameters were based on the values given in the RRI model manual [24], and only the Manning’s roughness on the slope cells and soil depths were varied in several patterns to find the preferred parameter settings (Table 1).
The calculation results were output as a flow time series at a specified point. The calculation results were calibrated and validated by calculating the Nash–Sutcliffe model efficiency coefficient (NSE) and the coefficient of determination (R2) using the daily discharge data from the Japan Ministry of Land, Infrastructure, Transport and Tourism at the Chusetsu water gauging station, located near the downstream of the study area (Figure 1). The calculation period was from January to December 2020. However, because the RRI model cannot handle both snow accumulation and snowmelt, only the calculation results from April to November, excluding the period when snow accumulation was observed in the Nagara River Basin, were considered in this study.
2.6. Hydrologic Index of Flood Magnitude
The disturbance regime caused by flow fluctuation can be treated quantitatively by decomposing it into five components: magnitude, frequency, duration, timing, and rate of change [1,28]. Olden and Poff [29] calculated 171 hydrological indicators from 420 sites and 36 years of flow data in the U.S. and identified 26 important indicators. These hydrological indices are calculated from the daily discharge (m3/s). As the flow discharge of a river is affected by the size of the river, there are methods to ensure that the size of the river does not affect the analysis results, such as dividing the flow rate by the average value or dividing the flow rate by the catchment area and treating it as a specific discharge [29]. As the purpose of this study was to examine flood disturbances at several sites within the same river basin for a relatively short period of time, specific discharge was used to calculate the hydrological indices in this study.
Among the five components of flood disturbance, we focused only on the magnitude. The reason for this was to examine the effect of the flood event immediately before the survey on the spatial distribution of the eDNA concentration. The maximum daily specific discharge Qsmax (m3/s/km2) during the flood event was used as an indicator of the flood magnitude.
2.7. Analysis
The relationships between the eDNA concentrations at 42 eDNA sites and the index of flood magnitude were examined for two flood events. The eDNA surveys conducted on 11 August and 6 October were used to determine the spatial distribution of P. altivelis after the two flood events. As the variation in eDNA concentration had a range of several orders of magnitude, it was treated as an index on a logarithmic scale. To understand the impact of flood disturbance on the spatial distribution of P. altivelis, we aggregated the 42 eDNA sites into eight segments; that is, four mainstream segments of the Nagara River (S1–4, numbered from upstream) and four main tributaries (Yoshida, Itadori, Mugi, and Tsubo Rivers). The relationship between eDNA concentrations and flood disturbance indices in the eight river segments was examined.
3. Results
3.1. Spatiotemporal Change in eDNA Concentrations of P. altivelis
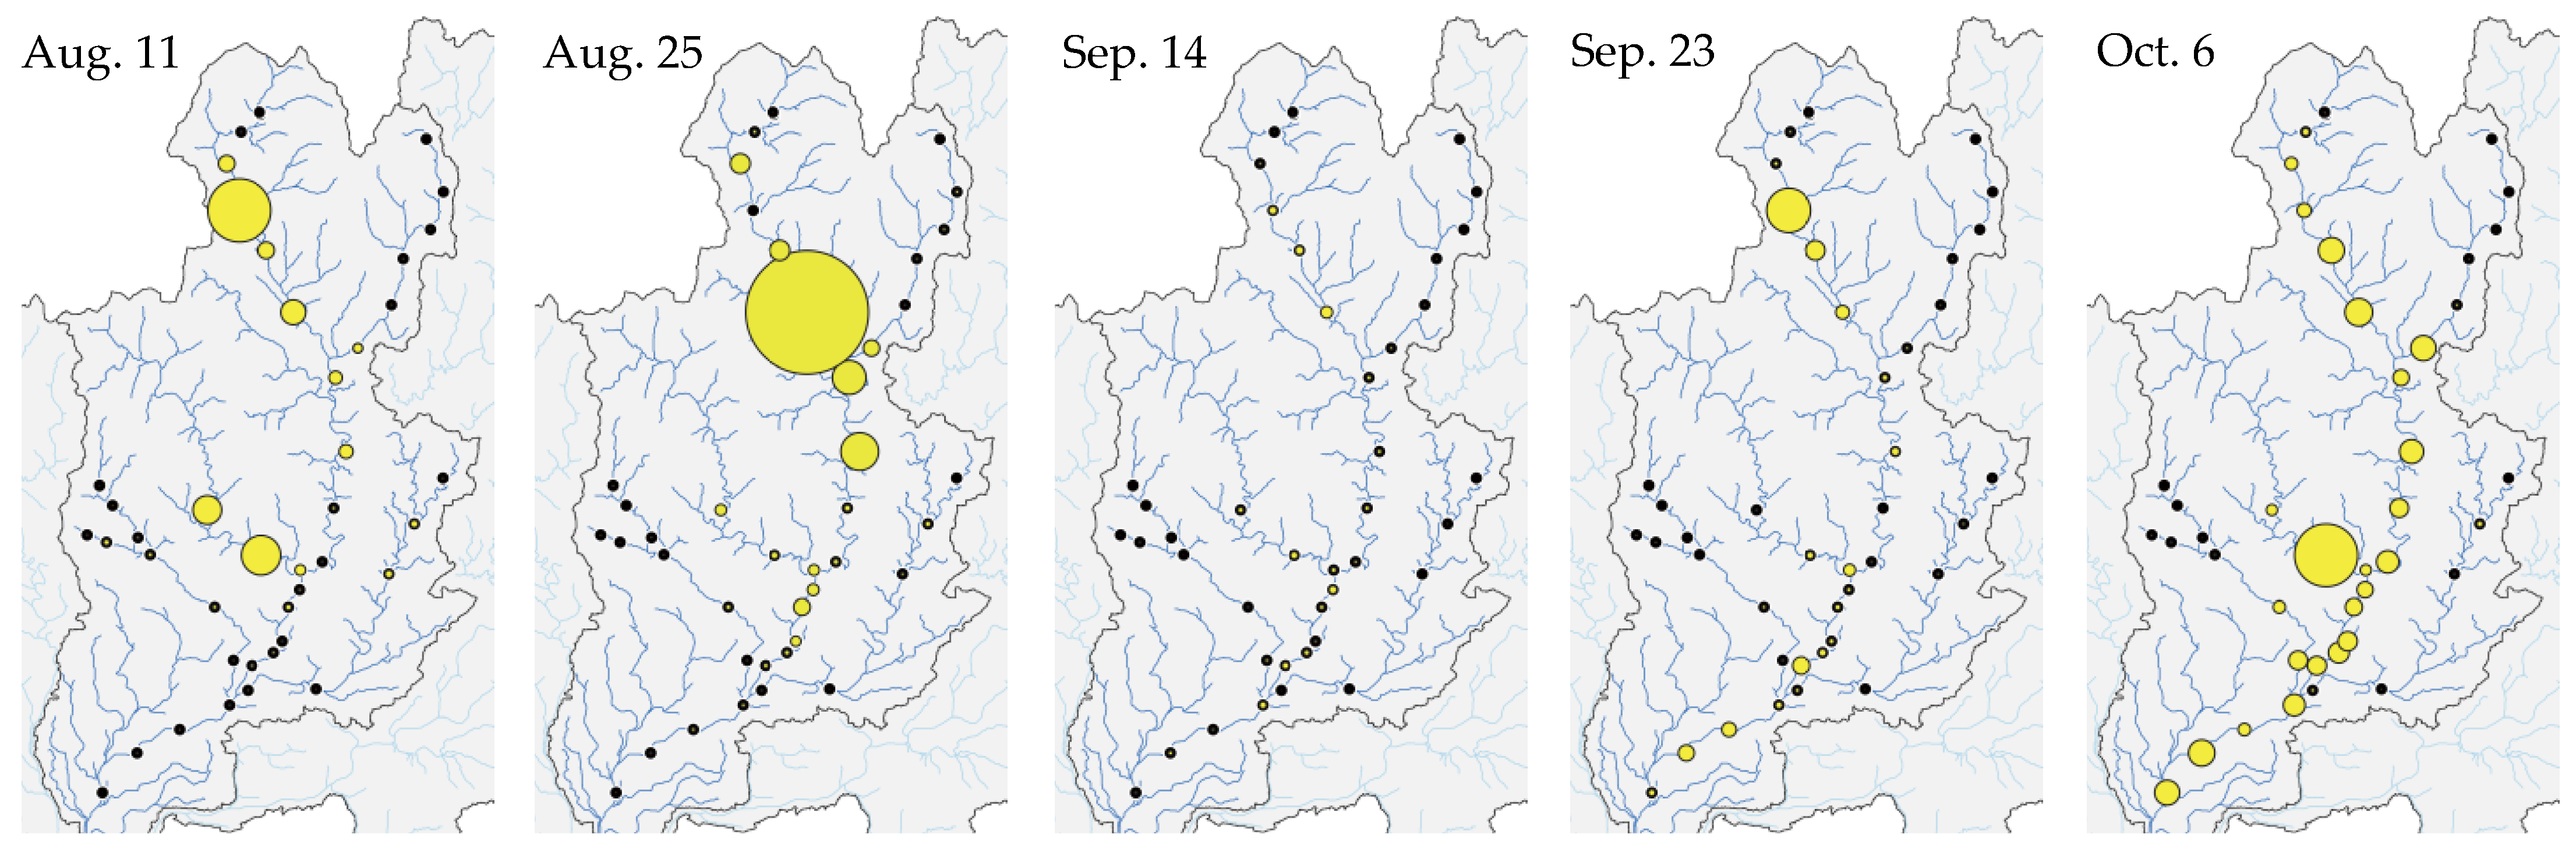
The eDNA concentrations of P. altivelis changed spatially and temporally in the Nagara River Basin (Figure 5). On 11 August, after Flood Event 1, relatively high eDNA concentrations were detected in the upper segment of the mainstem and in the Itadori River. On 25 August, relatively high eDNA concentrations extended to the mainstem immediately downstream of the confluences with the Yoshida and Itadori Rivers.
During September, which was mostly included in Flood Event 2, eDNA tended to be distributed throughout the mainstem, although the eDNA concentrations were particularly low due to dilution caused by high river flows. On 6 October, the eDNA concentrations were evenly high throughout the mainstem in normal flow after Flood Event 2.
3.2. RRI Model Calculation Results
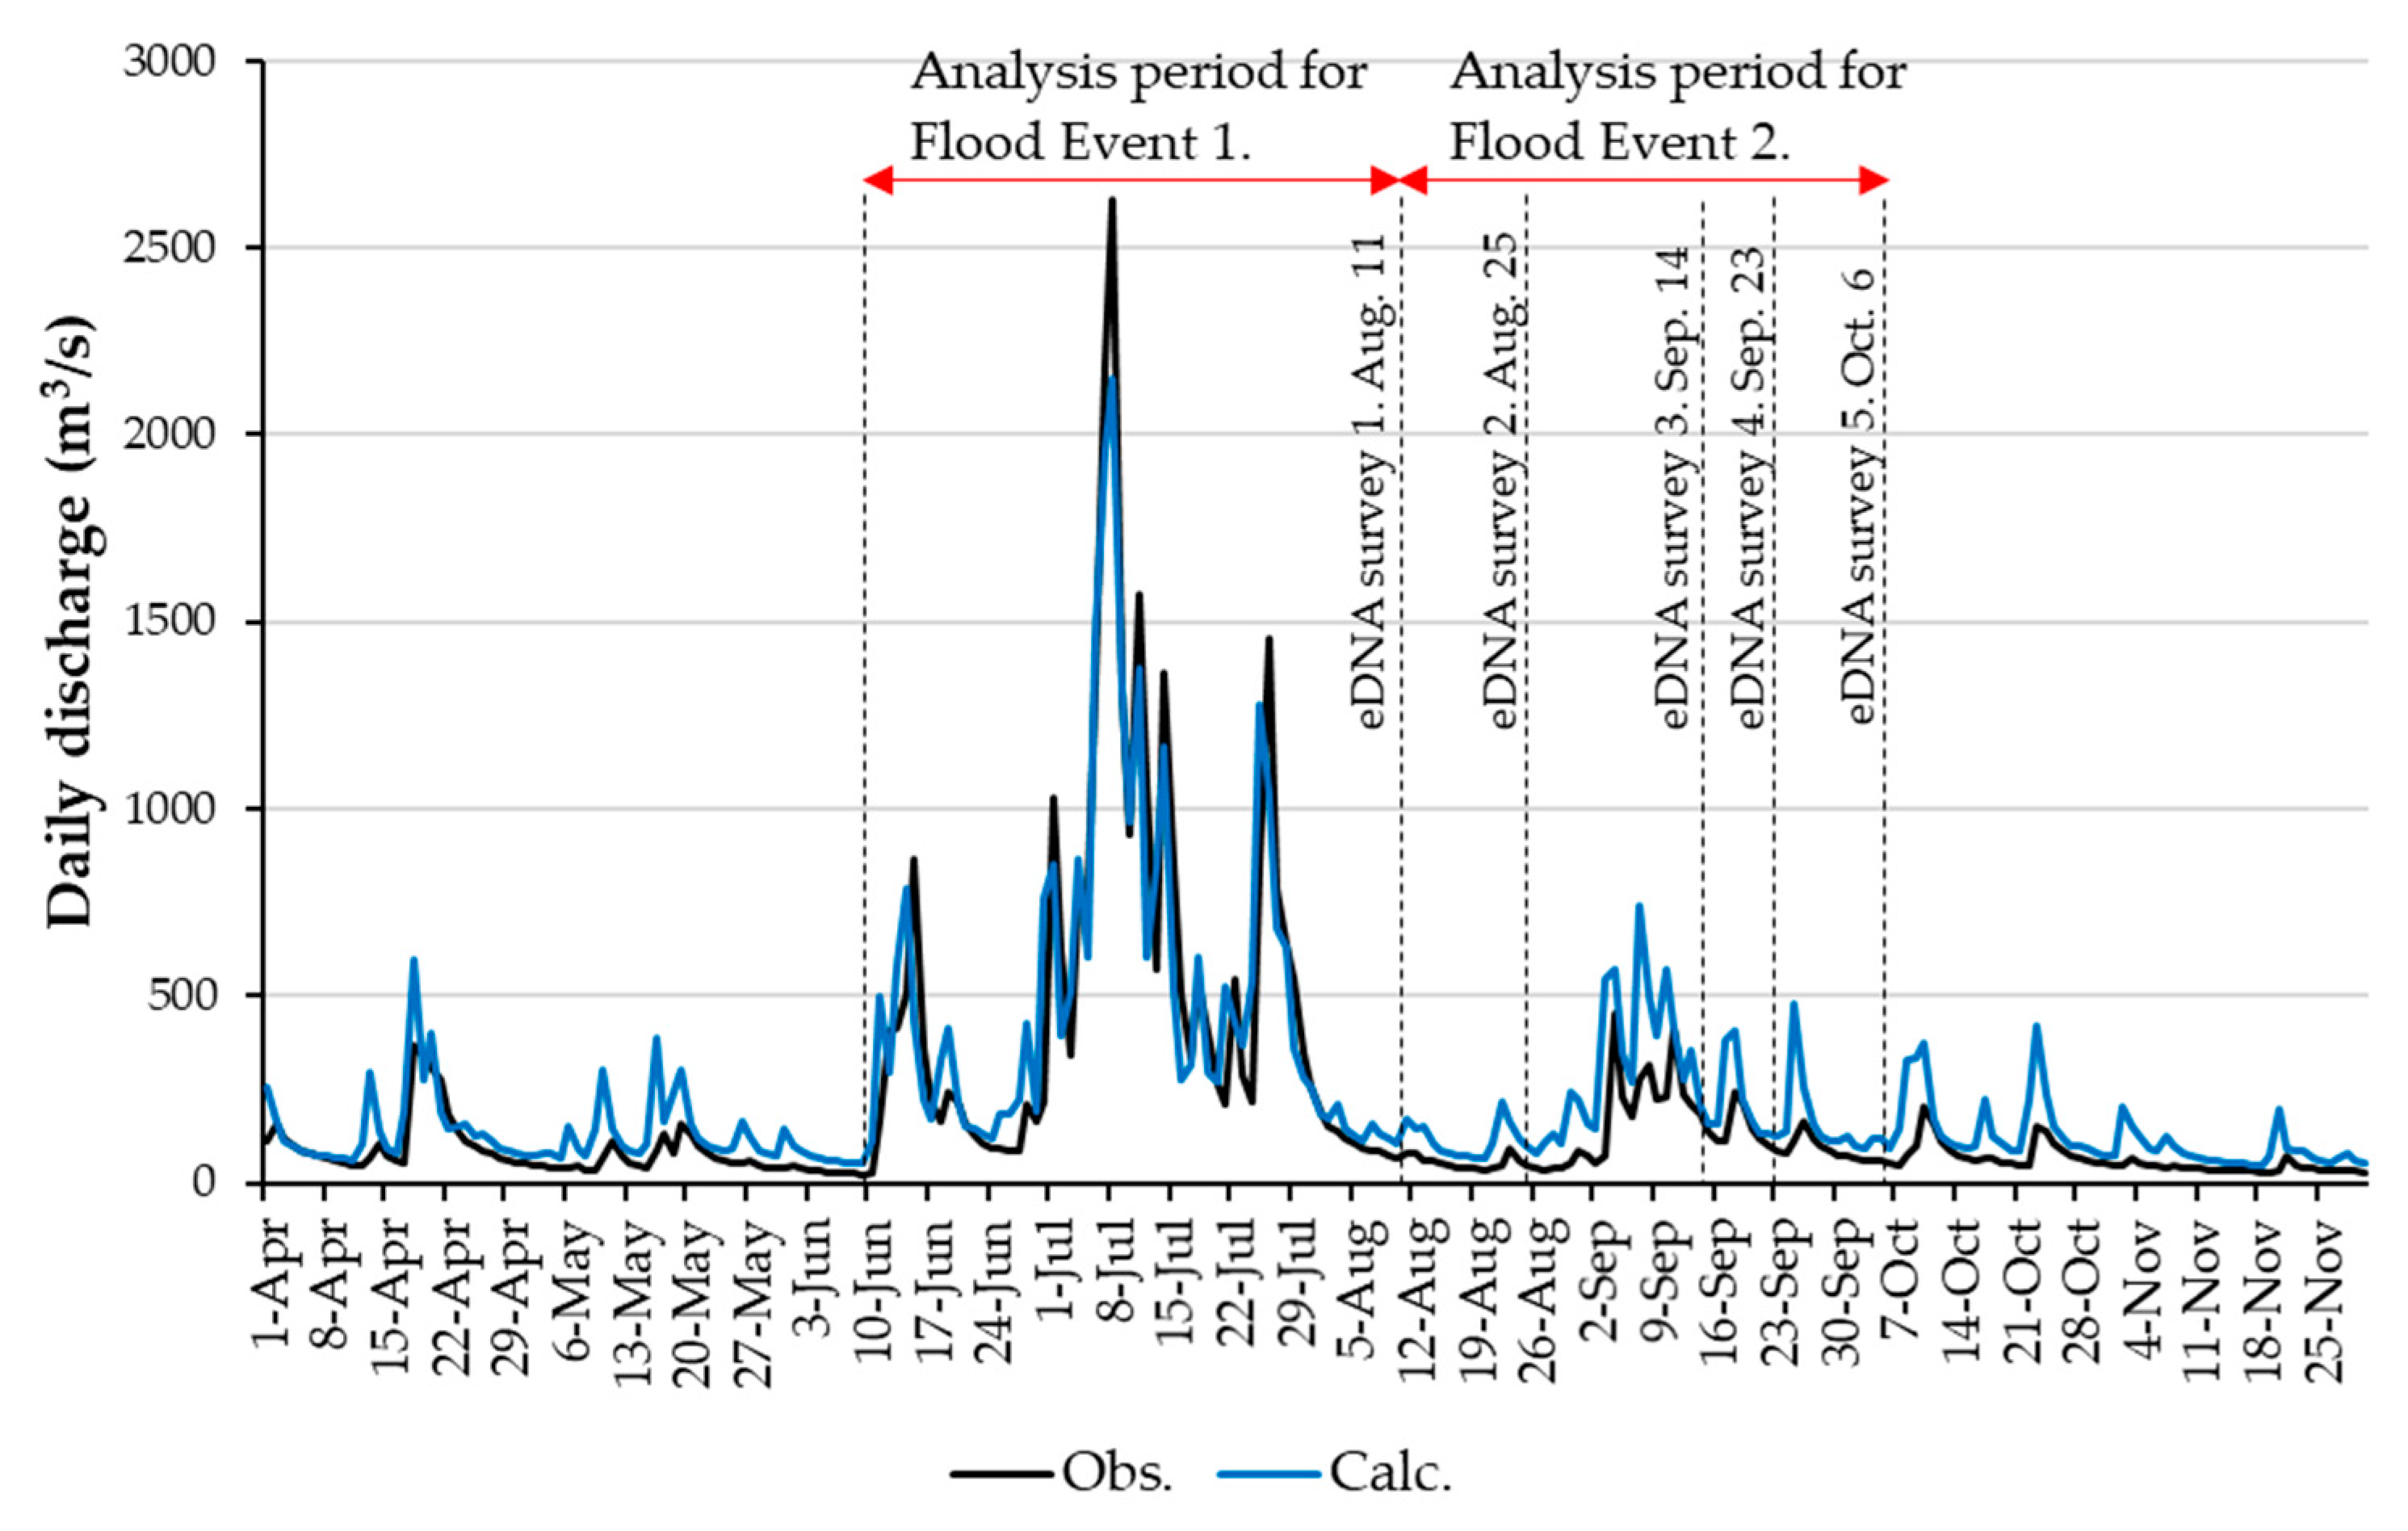
The river flow of the Nagara River system in 2020 was calculated with high accuracy using the RRI model with RA data. The daily discharge hydrograph observed at the Chusetsu water gauging station and the RRI model calculation results at the same location are shown in Figure 6. The calculated discharge was slightly underestimated for Flood Event 1 with very heavy rainfall. Conversely, for Flood Event 2, which was a small-to-medium-sized flood event, the calculated results were slightly larger than the observed values. The NSE and R2 values were 0.83 and 0.88, respectively, indicating that the reproduced calculation results were sufficiently accurate. The spatial resolution of the RA data used as input for the RRI model calculation was 1 km, suggesting that the flow time series of each tributary constituting the Nagara River system was also calculated with sufficient accuracy.
3.3. Flood Magnitude Index
The time series of the daily discharge at the 42 eDNA sites calculated by the RRI model was divided by the watershed area A (km2) of each site and converted into a time series of daily specific discharge Qs (m3/s/km2). The analysis periods of the flood magnitude index corresponding to the two flood events were 62 days from 10 June to 10 August for Flood Event 1 and 56 days from 11 August to 5 October for Flood Event 2 (Figure 6). The maximum daily specific discharge Qsmax during the flood events was calculated.
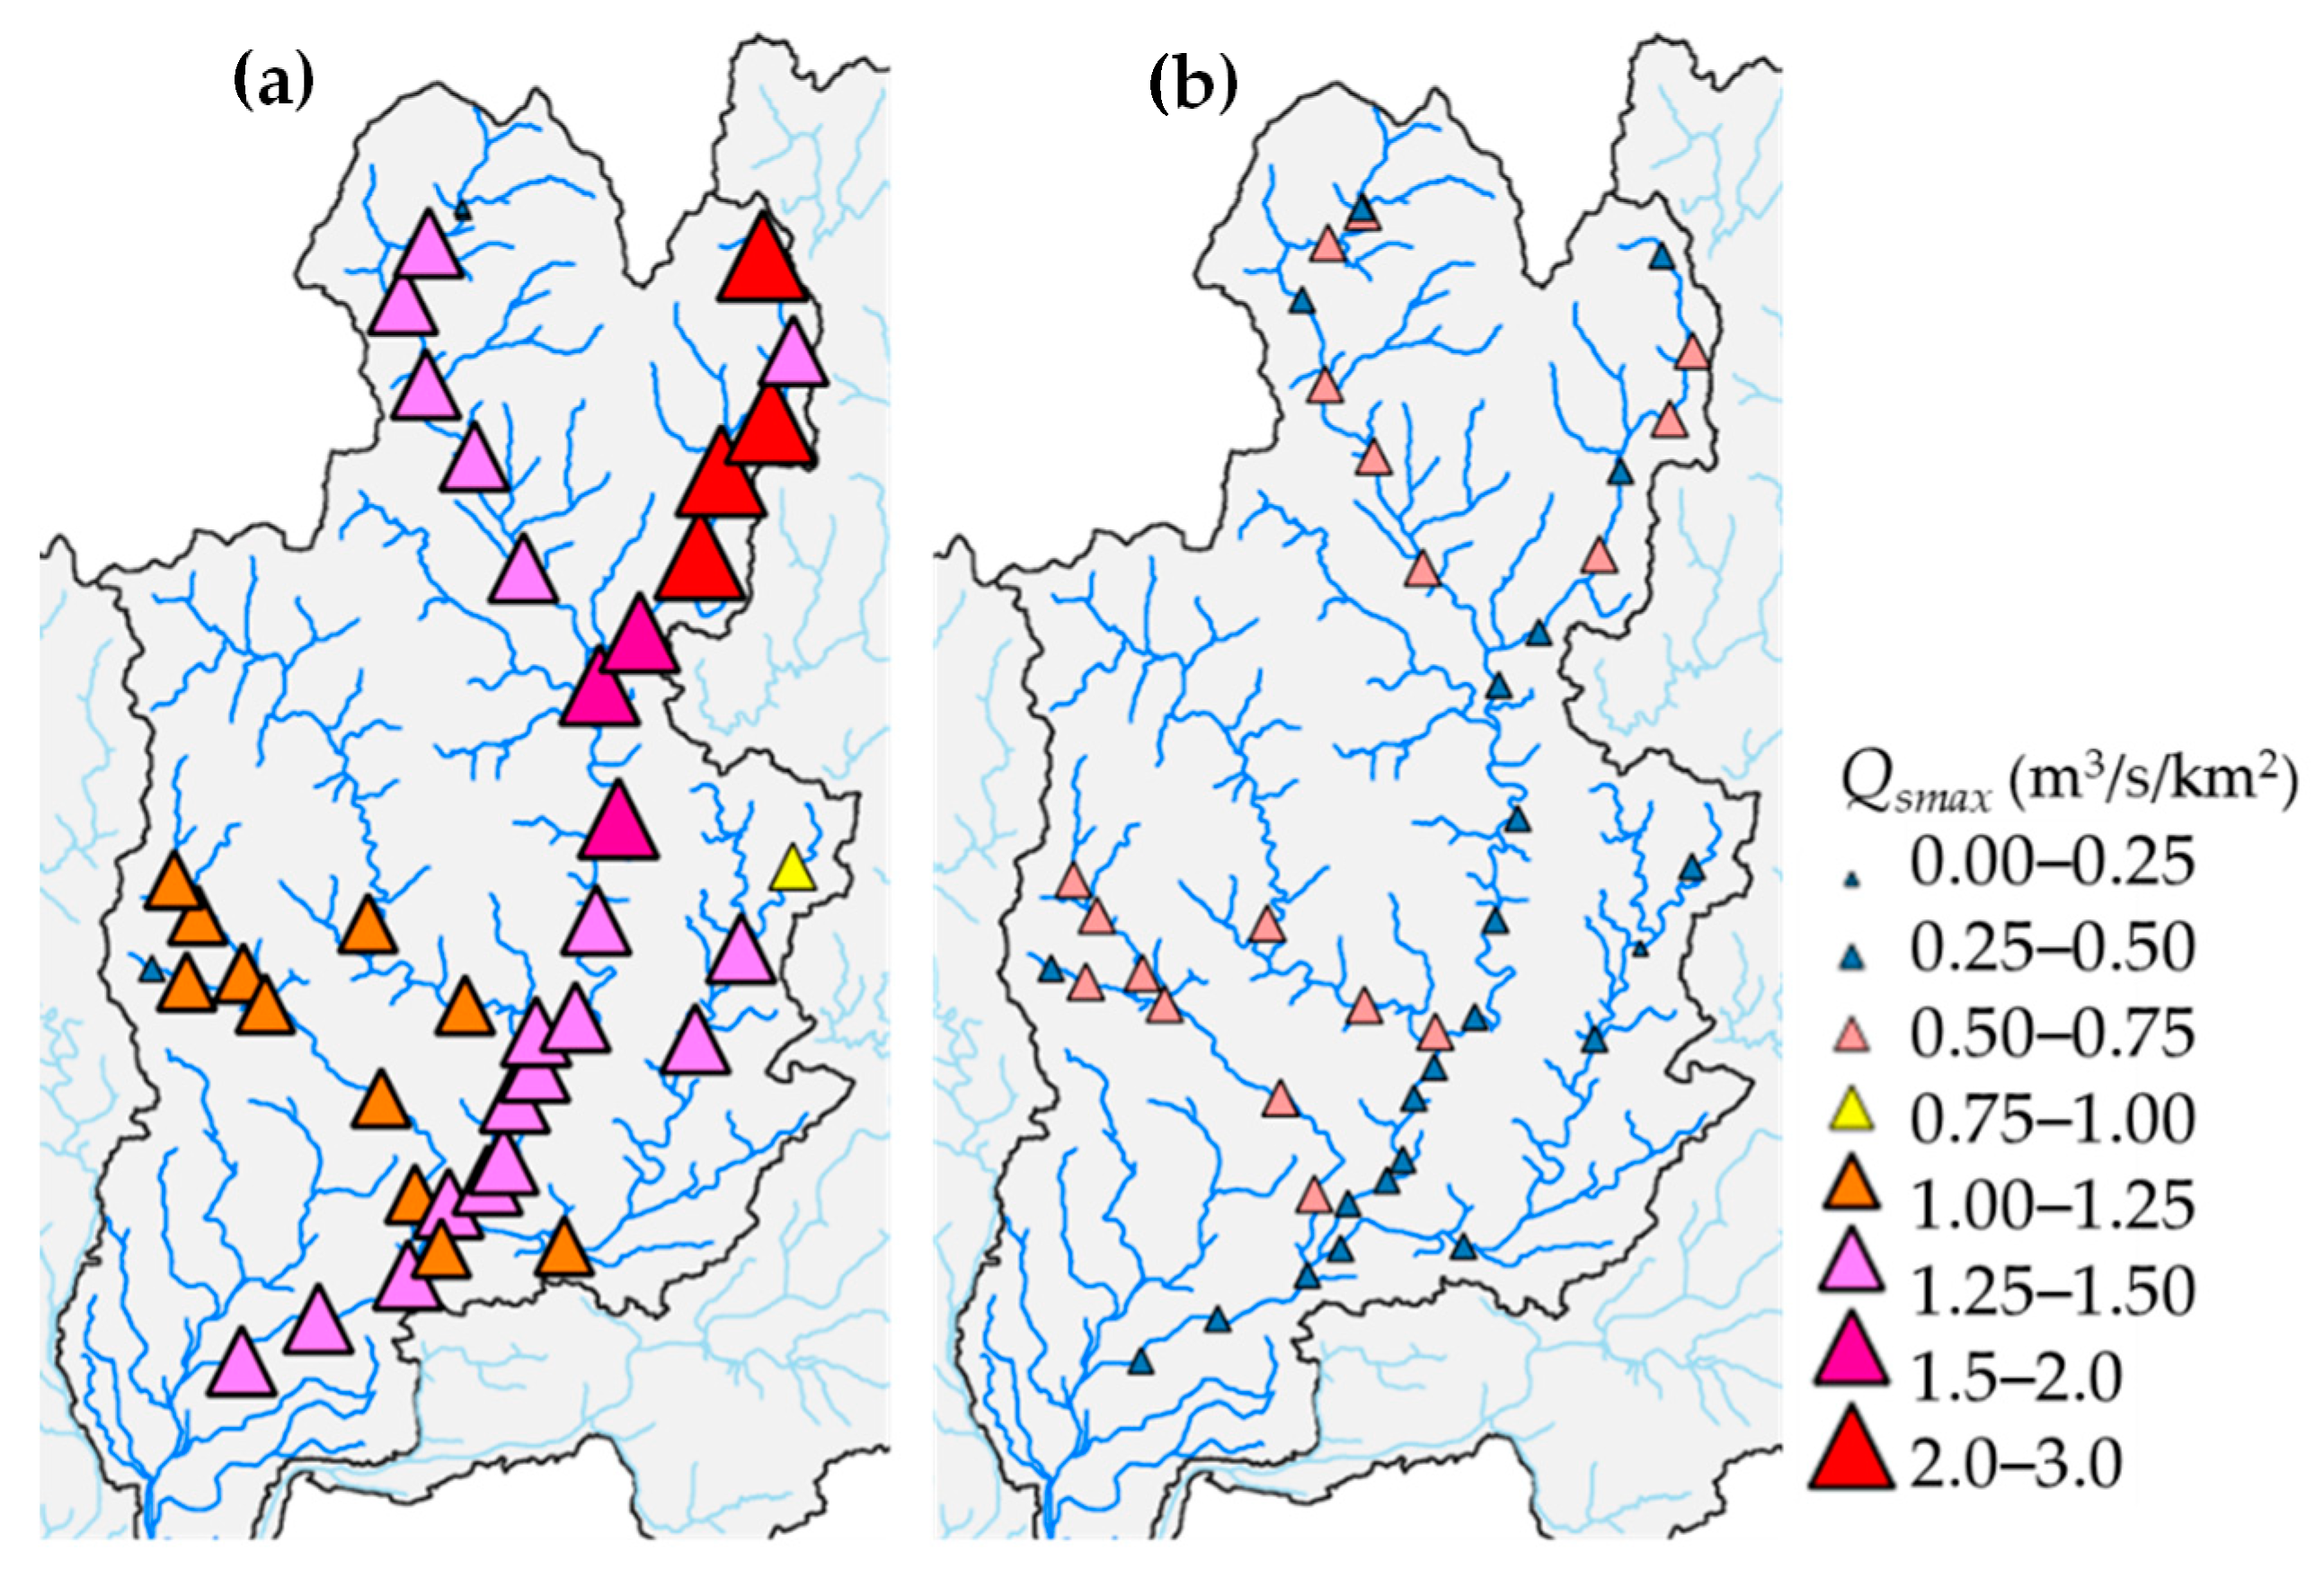
The Qsmax values for the two flood events are shown in Figure 7. The maximum value of Qsmax in Flood Event 1 was 2.11 at the Yoshida River, and the mean value for the 42 sites was 1.37 (Figure 7a). Focusing on the four main tributaries, it was confirmed that the Yoshida River had the highest flood magnitude, followed by the Tsubo River, and the Itadori and Mugi Rivers had relatively low magnitudes. On the mainstem segments of the Nagara River, it was confirmed that the flood magnitude was higher downstream of the confluence with the Yoshida River than that upstream of the confluence. The maximum value of Qsmax for Flood Event 2 was 0.75 at the Mugi River, and the mean value of the 42 sites was 0.50 (Figure 7b). The flood magnitude of the mainstem segment of the Nagara River tended to be slightly lower than that of the main tributaries. The overall flood magnitude was lower than that of Flood Event 1.
3.4. Relationship between eDNA Concentration and Flood Magnitude Index
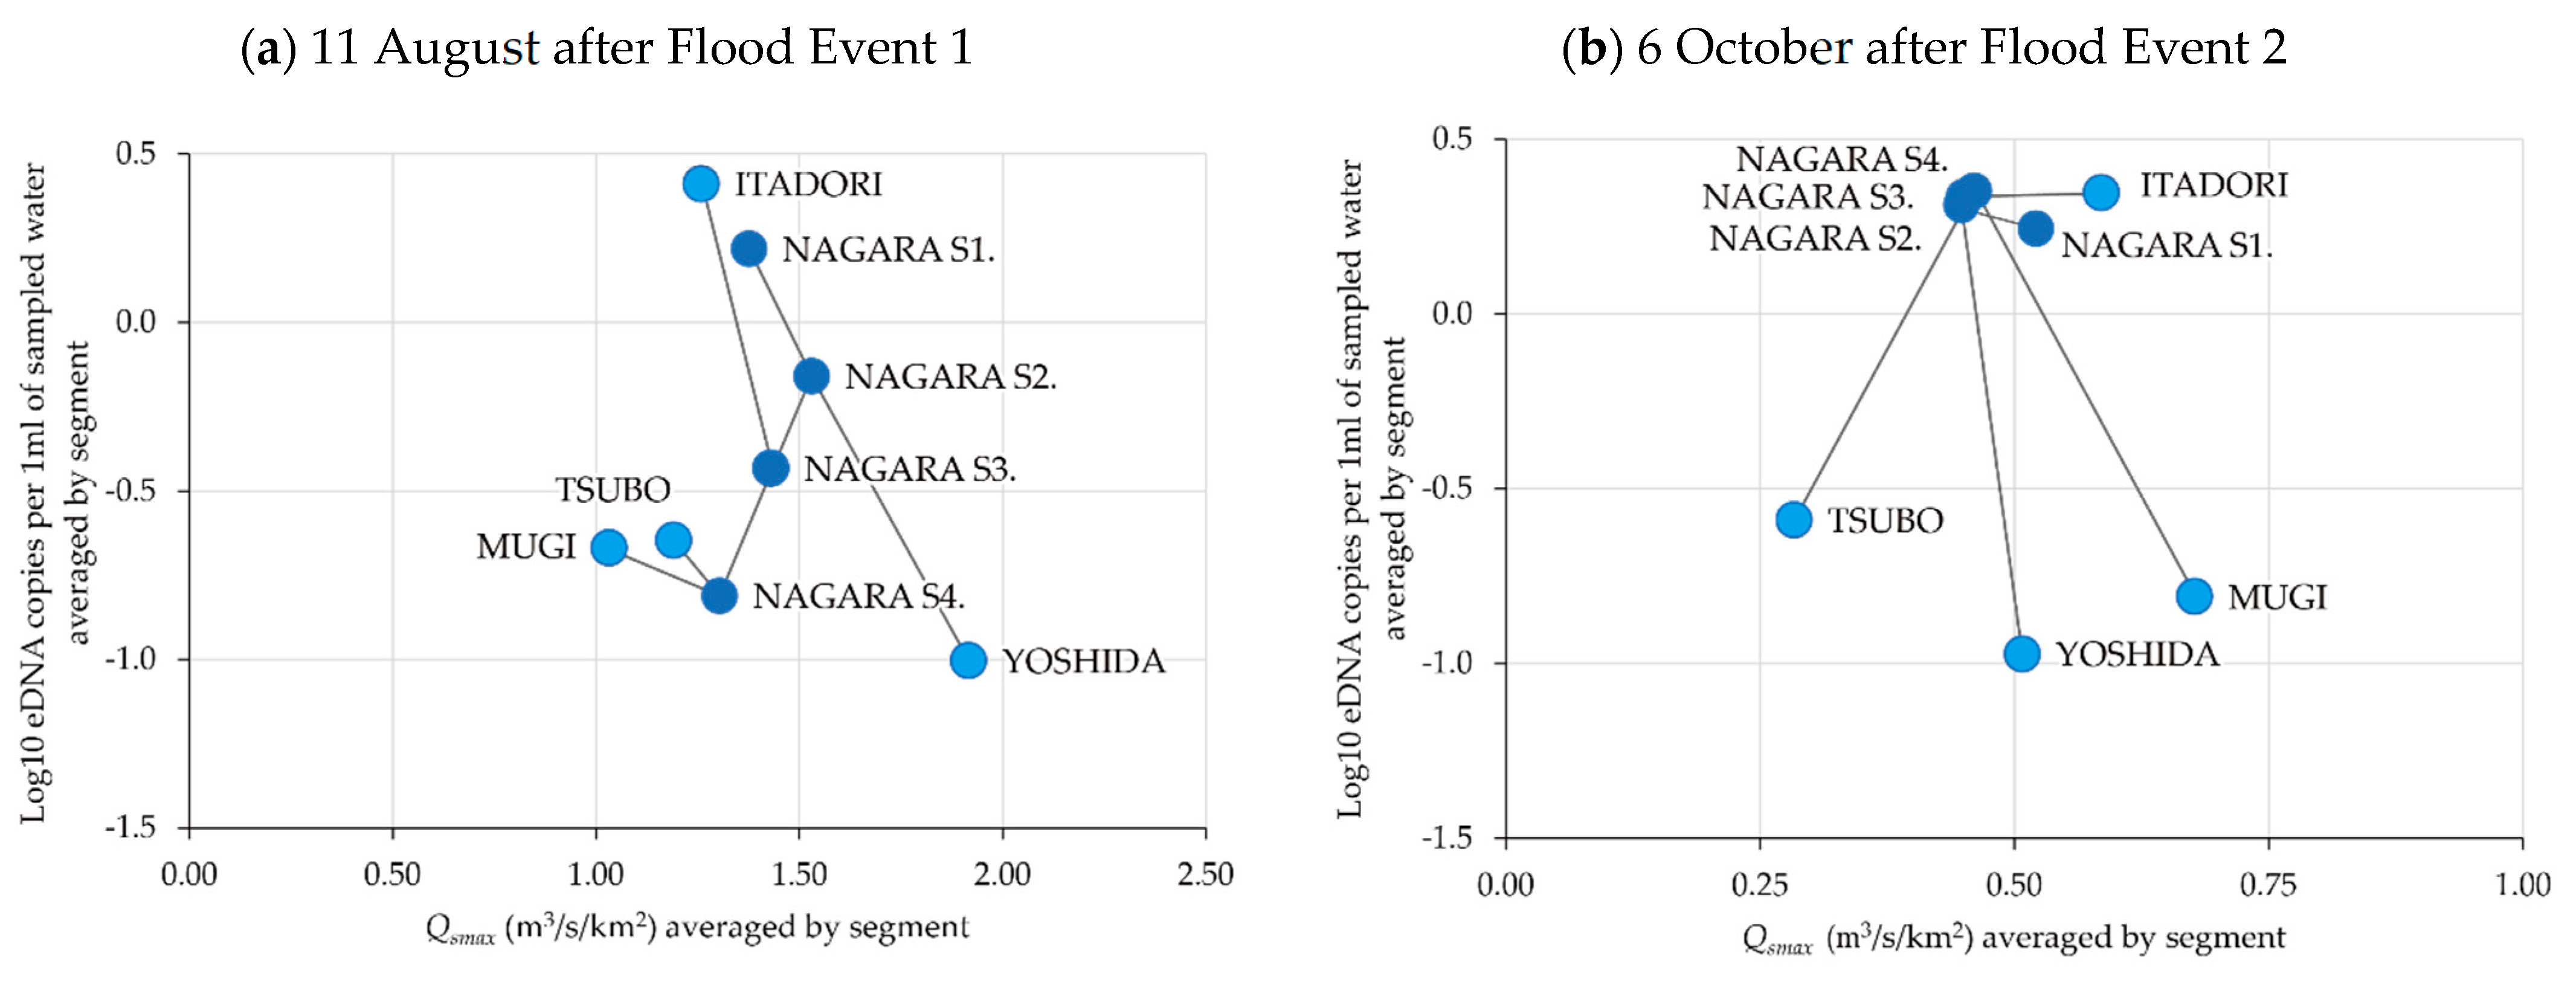
The relationships between the eDNA concentrations and average Qsmax in the eight river segments examined are shown in Figure 8. The mainstem segments of the Nagara River were numbered 1–4 from upstream to downstream. The connection between the four main tributaries and the four mainstem segments is also shown in the schematic image in Figure 9.
The mean eDNA concentration varied among the river segments after Flood Event 1 (Figure 8a). The relationship between Nagara S1 and the Yoshida River located in the upper reaches and Nagara S2 located downstream of their confluence illustrated that the higher the flood magnitude, the lower the average eDNA concentration. Similarly, focusing on the relationship between Nagara S2 and the Itadori River and Nagara S3 downstream of their confluence, higher average eDNA concentrations were found in the Itadori River, which had the lowest flood magnitude. After Flood Event 2 (Figure 8b), a different trend was observed. The eDNA concentrations in the entire mainstem of the Nagara River and in the Itadori River became uniform. Conversely, the eDNA concentrations in the Yoshida, Mugi, and Tsubo Rivers, which were low immediately after Flood Event 1 (Figure 8a), remained low after Flood Event 2.
4. Discussion
The combined approach of multiple eDNA surveys and hydrological modeling showed that it is possible to capture and analyze fish migration in response to flood disturbances in the mountainous river basin. The biased spatial distribution of P. altivelis after Flood Event 1 with record precipitation could be explained by the magnitude of the flood disturbance. This result suggests that the fish moved between the directly connecting segments to evacuate from prolonged and high-intensity floods (Figure 8a). After that, P. altivelis were widely redistributed in the segments of the mainstem, presumably because the mainstem has more available habitat than the tributaries. Moreover, floods of lesser magnitude might not affect the spatial distribution of P. altivelis (Figure 8b). In addition, several small tributaries flow into the mainstem of the Nagara River. It is possible that individuals who took refuge in these tributaries returned to the mainstem, where they could find more habitats. The behavior of the P. altivelis population evacuated from the swollen segment to the other segment was compatible with the observations by Koizumi et al. [12]. However, there was insufficient material to determine whether floods induce migratory behavior in P. altivelis, using the magnitude of the maximum specific discharge as a threshold. Although the specific discharge is useful for making comparisons between sites with different catchment areas, the magnitude of the external forces acting on the streambed cannot be defined solely by the specific discharge.
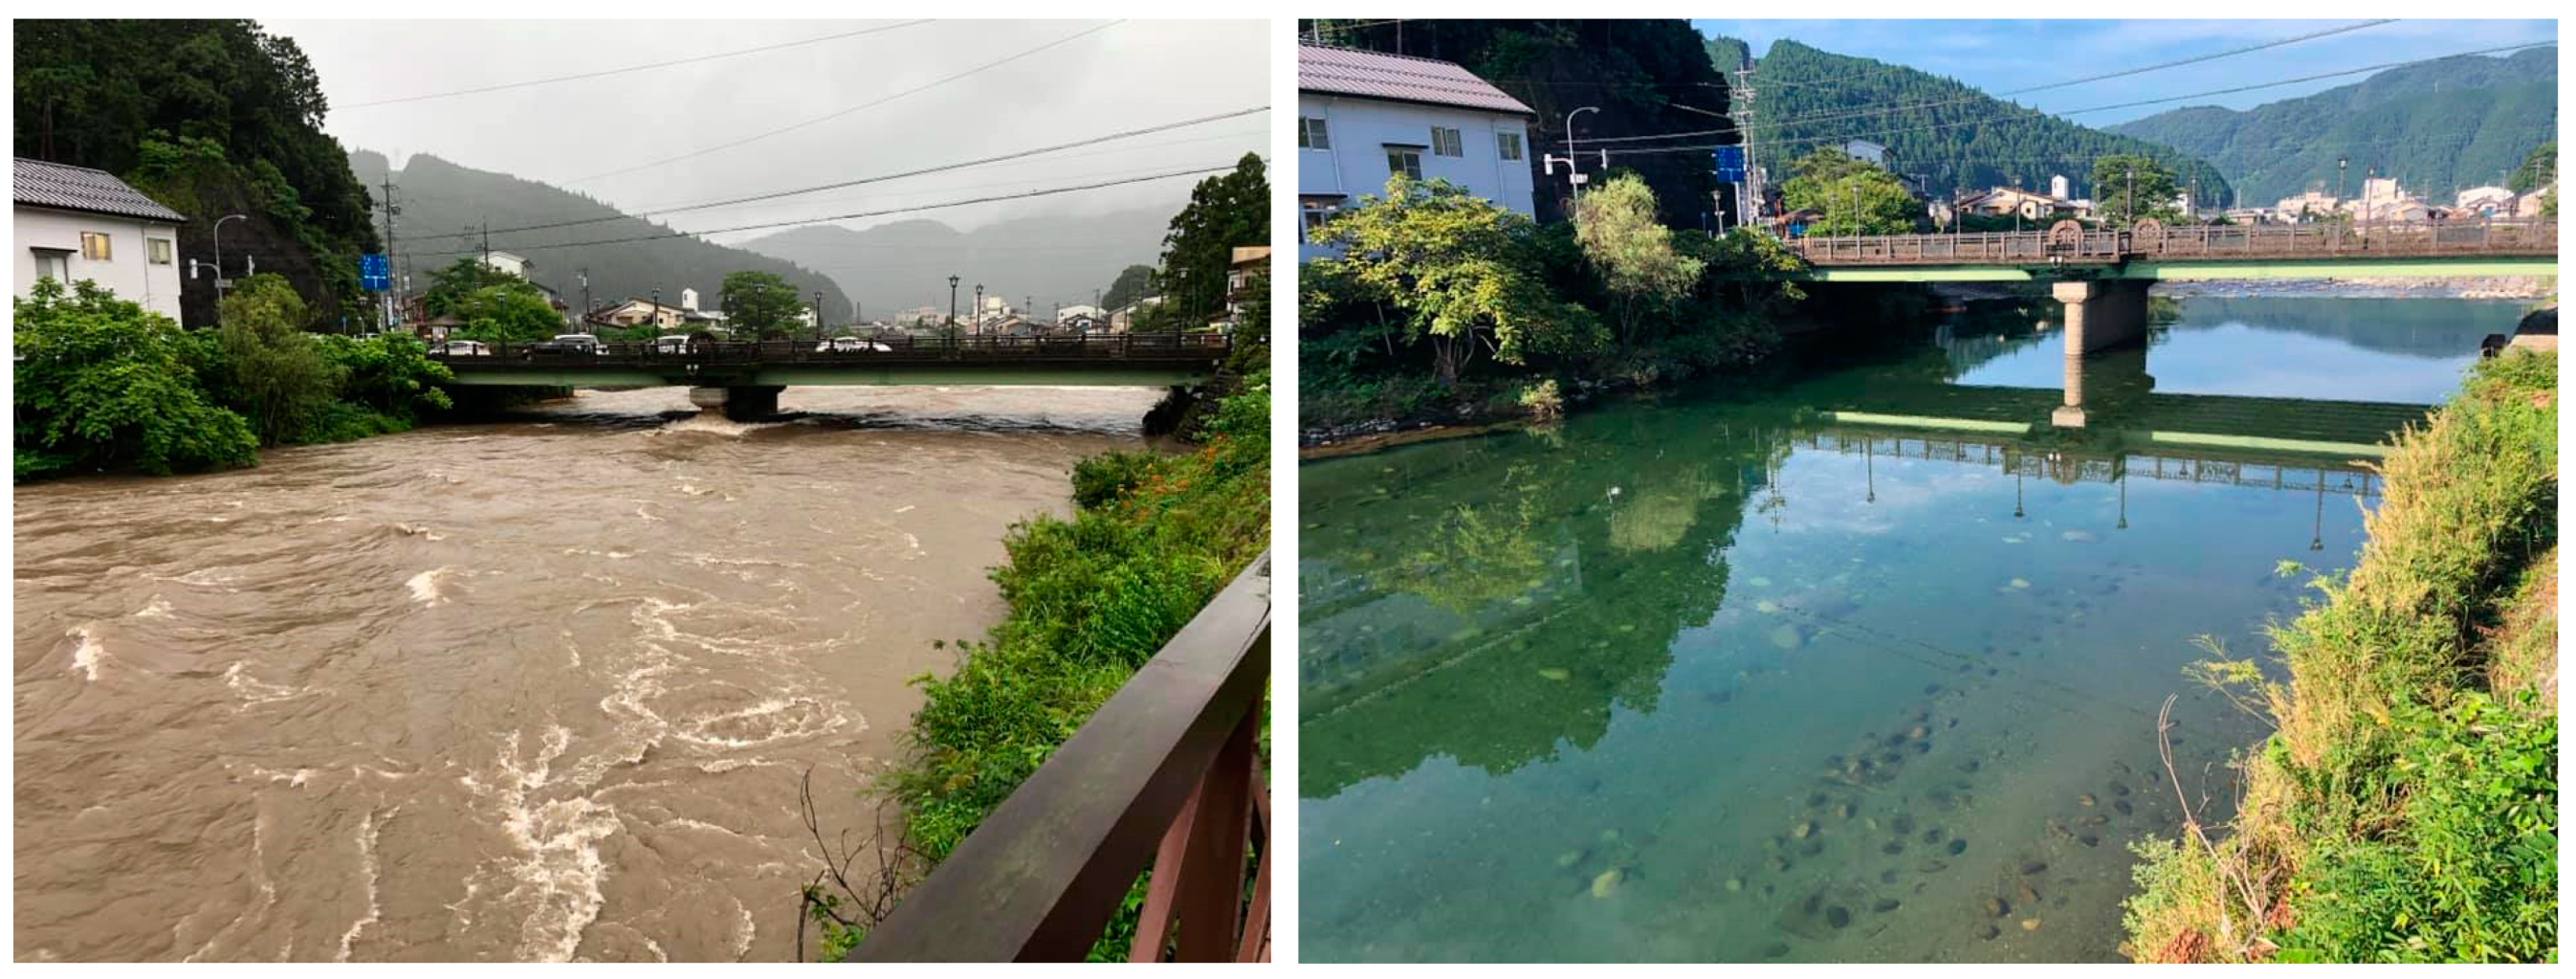
The response to floods may differ among fish species based on their ecology and biological characteristics. Plecoglossus altivelis is known to avoid turbid water and evacuate turbid sections [30]. The Yoshida River, which had the lowest eDNA concentration after Flood Event 1, showed high turbidity during the flood (Figure 4). In addition, turbidity inhibits the growth of attached algae, which is the dominant food resource for P. altivelis. Therefore, if the flood period is long, P. altivelis populations may move as a “habitat shift” due to a decline in attached algae rather than “evacuation” from floods. Thus, some ecological factors may be contained in our results of the relationship between flood disturbance indices and eDNA concentrations. Future studies integrating the approaches of this study and conventional ecological works can highly progress the understanding of riverine fish ecology.
The results of this study indicate that the resilience of riverine communities to extreme floods is supported by the continuity and connectivity between the mainstem and its tributaries in mountainous river basins. The resilience of riverine ecosystems will become more important as the magnitude and frequency of floods are projected to increase as a result of climate change [31]. Hydrological model calculations using climate model products as input values may reveal the impact of climate change on riverine ecosystems via its impact on flow regimes. The integration of eDNA analysis with hydrological observations and models has the potential to create new values for understanding and better managing river ecosystems.
Author Contributions
Conceptualization, M.H.; eDNA survey and analysis, S.N.; hydrological model calculation and analysis, M.H.; and writing and editing, M.H. and S.N. All authors have read and agreed to the published version of the manuscript.
Funding
This research was supported by the Environment Research and Technology Development Fund JPMEERF20202004 of the Environmental Restoration and Conservation Agency of Japan.
Data Availability Statement
Not applicable.
Acknowledgments
This study was conducted in collaboration with researchers from Gifu University, Gifu Prefecture, and the Public Works Research Institute. We thank Ryoji Fujii of the Gifu Research Institute for Fisheries and Aquatic Environments for their valuable advice and information and Tsuguki Komori for providing the photographs.
Conflicts of Interest
The authors declare no conflict of interest.
References
- Poff, N.L.; Allan, J.D.; Bain, M.B.; Karr, J.R.; Prestegaard, K.L.; Richter, B.D.; Sparks, R.E.; Stromberg, J.C. The natural flow regime. BioScience 1997, 47, 769–784. [Google Scholar] [CrossRef]
- Resh, V.H.; Brown, A.V.; Covich, A.P.; Gurtz, M.E.; Li, H.W.; Minshall, G.W.; Reice, S.R.; Sheldon, A.L.; Wallace, J.B.; Wissmar, R.C. The role of disturbance in stream ecology. J. N. Am. Benthol. Soc. 1988, 7, 433–455. [Google Scholar] [CrossRef]
- Lytle, D.A.; Poff, N.L. Adaptation to natural flow regimes. Trends Ecol. Evol. 2004, 19, 94–100. [Google Scholar] [CrossRef] [PubMed]
- Swanson, F.J.; Johnson, S.L.; Gregory, S.V.; Acker, S.A. Flood disturbance in a forested mountain landscape: Interactions of land use and floods. BioScience 1998, 48, 681–689. [Google Scholar] [CrossRef] [Green Version]
- King, A.J.; Humphries, P.; Lake, P.S. Fish recruitment on floodplains: The roles of patterns of flooding and life history characteristics. Can. J. Fish. Aquat. Sci. 2003, 60, 773–786. [Google Scholar] [CrossRef]
- Matthews, W.J. Fish faunal structure in an Ozark stream: Stability, persistence and a catastrophic flood. Copeia 1986, 1986, 388–397. [Google Scholar] [CrossRef]
- Lake, P.S. Disturbance, patchiness, and diversity in streams. J. N. Am. Benthol. Soc. 2000, 19, 573–592. [Google Scholar] [CrossRef] [Green Version]
- Milner, A.M.; Robertson, A.L.; McDermott, M.J.; Klaar, M.J.; Brown, L.E. Major flood disturbance alters river ecosystem evolution. Nat. Clim. Chang. 2013, 3, 137–141. [Google Scholar] [CrossRef] [Green Version]
- Sedell, J.R.; Reeves, G.H.; Hauer, F.R.; Stanford, J.A.; Hawkins, C.P. Role of refugia in recovery from disturbances: Modern fragmented and disconnected river systems. Environ. Manag. 1990, 14, 711–724. [Google Scholar] [CrossRef]
- Schwartz, J.S.; Herricks, E.E. Fish use of stage-specific fluvial habitats as refuge patches during a flood in a low-gradient Illinois stream. Can. J. Fish. Aquat. Sci. 2005, 62, 1540–1552. [Google Scholar] [CrossRef]
- Gwo, H.O.; Huang, Y.S.; Ueda, H. Site fidelity of and habitat use by the Formosan landlocked salmon (Oncorhynchus masou formosanus) during typhoon season in Chichiawan Stream, Taiwan as assessed by nano-tag radio telemetry. Zool. Stud. 2009, 48, 460–467. [Google Scholar]
- Koizumi, I.; Kanazawa, Y.; Tanaka, Y. The fishermen were right: Experimental evidence for tributary refuge hypothesis during floods. Zool. Sci. 2013, 30, 375–379. [Google Scholar] [CrossRef] [PubMed] [Green Version]
- Minamoto, T.; Yamanaka, H.; Takahara, T.; Honjo, M.N.; Kawabata, Z.I. Surveillance of fish species composition using environmental DNA. Limnology 2012, 13, 193–197. [Google Scholar] [CrossRef] [Green Version]
- Yamanaka, H.; Minamoto, T. The use of environmental DNA of fishes as an efficient method of determining habitat connectivity. Ecol. Indic. 2016, 62, 147–153. [Google Scholar] [CrossRef] [Green Version]
- Doi, H.; Inui, R.; Akamatsu, Y.; Kanno, K.; Yamanaka, H.; Takahara, T.; Minamoto, T. Environmental DNA analysis for estimating the abundance and biomass of stream fish. Freshw. Biol. 2017, 62, 30–39. [Google Scholar] [CrossRef]
- Barnes, M.A.; Turner, C.R.; Jerde, C.L.; Renshaw, M.A.; Chadderton, W.L.; Lodge, D.M. Environmental conditions influence eDNA persistence in aquatic systems. Environ. Sci. Technol. 2014, 48, 1819–1827. [Google Scholar] [CrossRef] [PubMed]
- Harrison, J.B.; Sunday, J.M.; Rogers, S.M. Predicting the fate of eDNA in the environment and implications for studying biodiversity. Proc. R. Soc. B 2019, 286, 20191409. [Google Scholar] [CrossRef] [PubMed]
- Pilliod, D.S.; Laramie, M.B.; MacCoy, D.; Maclean, S. Integration of eDNA-based biological monitoring within the US Geological Survey’s National Streamgage Network. J. Am. Water Resour. Assoc. 2019, 55, 1505–1518. [Google Scholar] [CrossRef] [Green Version]
- GIAHS Globally Important Agricultural Heritage Systems. Available online: https://www.fao.org/giahs/giahsaroundtheworld/en/ (accessed on 5 January 2022).
- Mouri, G.; Shinoda, S.; Oki, T. Estimating Plecoglossus altivelis altivelis migration using a mass balance model expressed by hydrological distribution parameters in a major limpid river basin in Japan. Ecol. Model. 2010, 221, 2808–2815. [Google Scholar] [CrossRef]
- Murase, I.; Iguchi, K.I. High growth performance in the early ontogeny of an amphidromous fish, Ayu Plecoglossus altivelis altivelis, promoted survival during a disastrous river spate. Fish. Manag. Ecol. 2021, 1–9. [Google Scholar] [CrossRef]
- Izumi, M.; Sugimoto, A.; Marui, A.; Azuma, N. Field experiment on the critical swimming speed of natural fingering sweetfish (Plecoglossus altivelis altivelis) during initial period of upstream river migration. J. JSCE 2021, 9, 63–70. [Google Scholar] [CrossRef]
- Yamanaka, H.; Minamoto, T.; Matsuura, J.; Sakurai, S.; Tsuji, S.; Motozawa, H.; Hongo, M.; Sogo, Y.; Kakimi, N.; Teramura, I.; et al. A simple method for preserving environmental DNA in water samples at ambient temperature by addition of cationic surfactant. Limnology 2017, 18, 233–241. [Google Scholar] [CrossRef] [Green Version]
- Rainfall-Runoff-Inundation (RRI) Model. Available online: https://www.pwri.go.jp/icharm/research/rri/index.html (accessed on 5 January 2022).
- Lehner, B.; Verdin, K.; Jarvis, A. New global hydrography derived from spaceborne elevation data. Eos Trans. AGU 2008, 89, 93–94. [Google Scholar] [CrossRef]
- HydroSHEDS. Available online: https://www.hydrosheds.org/ (accessed on 5 January 2022).
- Ishizaki, H.; Matsuyama, H. Distribution of the annual precipitation ratio of radar/raingauge-analyzed precipitation to AMeDAS across Japan. SOLA 2018, 14, 192–196. [Google Scholar] [CrossRef] [Green Version]
- Richter, B.D.; Baumgartner, J.V.; Braun, D.P.; Powell, J. A spatial assessment of hydrologic alteration within a river network. Regul. Rivers Res. Manag. 1998, 14, 329–340. [Google Scholar] [CrossRef]
- Olden, J.D.; Poff, N.L. Redundancy and the choice of hydrologic indices for characterizing streamflow regimes. River Res. Appl. 2003, 19, 101–121. [Google Scholar] [CrossRef]
- Mori, T.; Kato, Y.; Takagi, T.; Onoda, Y.; Kayaba, Y. Turbid water induces refuge behaviour of a commercially important ayu: A field experiment for interstream movement using multiple artificial streams. Ecol. Freshw. Fish 2018, 27, 1015–1022. [Google Scholar] [CrossRef]
- Harada, M.; Maruya, Y.; Kojima, T.; Matsuoka, D.; Nakagawa, Y.; Kawahara, S.; Araki, F. Flood frequency analysis and impact assessment for climate change in the Nagara River basin. J. JSCE 2020, 8, 79–86. [Google Scholar] [CrossRef]
Figure 1.
Location of the Nagara River Basin (Left) and the Nagara River and its four main tributaries (Right). The black dots indicate the environmental DNA survey sites in this study. The flow observation data used for the validation of the hydrological model were obtained from the Chusetsu water gauging station located in the downstream of the Nagara River. The precipitation data from the Hachiman rain gauge located at the upstream of the basin are shown in Figure 3.

Figure 2.
Longitudinal profiles of the mainstem and four main tributaries of the Nagara River system. The sections at approximately 42.0–53.0, 53.0–75.0, and >75.0 km of the Nagara River flow through the alluvial fan, valley bottom plain, and mountain area, respectively.
Figure 2.
Longitudinal profiles of the mainstem and four main tributaries of the Nagara River system. The sections at approximately 42.0–53.0, 53.0–75.0, and >75.0 km of the Nagara River flow through the alluvial fan, valley bottom plain, and mountain area, respectively.

Figure 3.
Precipitation at Hachiman rain gauge (April–November 2020). Blue bars show daily precipitation (mm/day) and black line shows cumulative precipitation (mm) from April 2020. In the 52 days from 10 June to 30 July, a total of 1923 mm of precipitation was observed. In this study, this precipitation was defined as Flood Event 1. Another 528 mm of precipitation was observed in the 38 days from 2 September to 10 October, defined as Flood Event 2.

Figure 4.
Scenes during and after the flooding of the Yoshida River near the confluence with the Nagara River. This point is also near the Hachiman rain gauge. These photographs were taken by Tsuguki Komori on 6 July and 18 August 2020, respectively.
Figure 4.
Scenes during and after the flooding of the Yoshida River near the confluence with the Nagara River. This point is also near the Hachiman rain gauge. These photographs were taken by Tsuguki Komori on 6 July and 18 August 2020, respectively.

Figure 5.
eDNA concentrations of Plecoglossus altivelis changed spatially and temporally in the Nagara River Basin (11 August–6 October 2020). The black dots show the eDNA survey points. The sizes of the yellow circles indicate the eDNA concentrations of P. altivelis.
Figure 5.
eDNA concentrations of Plecoglossus altivelis changed spatially and temporally in the Nagara River Basin (11 August–6 October 2020). The black dots show the eDNA survey points. The sizes of the yellow circles indicate the eDNA concentrations of P. altivelis.

Figure 6.
Daily flow hydrograph (black line) and Rainfall–Runoff–Inundation model calculation results (blue line) for the Chusetsu water gauging station (April–November 2020). The Nash–Sutcliffe model efficiency coefficient and coefficient of determination values were 0.83 and 0.88, respectively, indicating that the reproduced calculation results were sufficiently accurate. In the figure, the days when environmental DNA (eDNA) surveys were conducted are indicated by dotted lines.

Figure 7.
Maximum daily specific discharge Qsmax (m3/s/km2) in the two flood events: (a) Flood Event 1 and (b) Flood Event 2.
Figure 7.
Maximum daily specific discharge Qsmax (m3/s/km2) in the two flood events: (a) Flood Event 1 and (b) Flood Event 2.

Figure 8.
Relationship between the environmental DNA (eDNA) concentration and flood magnitude index at the river segments on 11 August after Flood Event 1 (a) and 6 October after Flood Event 2 (b). The mainstem segments of the Nagara River are numbered 1–4 from upstream to downstream. The connection between the four main tributaries and the mainstem segments is also shown as a schematic image (Figure 9).

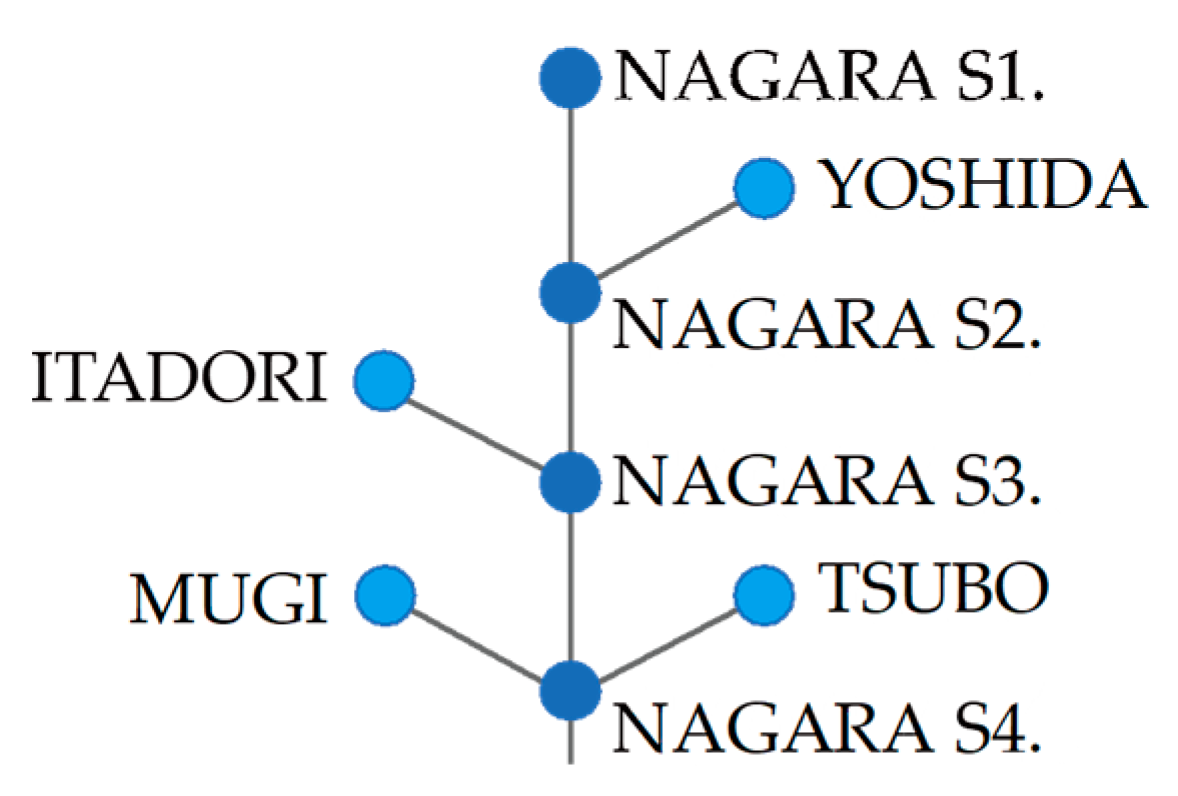
Figure 9.
Schematic image of segment connection. These plots show the connection relationships between the four major tributaries (light blue) and four mainstem segments of the Nagara River (blue) plotted in Figure 8.
Figure 9.
Schematic image of segment connection. These plots show the connection relationships between the four major tributaries (light blue) and four mainstem segments of the Nagara River (blue) plotted in Figure 8.


Table 1.
List of parameters of the Rainfall–Runoff–Inundation model.
| Explanation | Value | Determination |
|---|---|---|
| Manning’s roughness in river channel | 0.030 | Default value |
| Manning’s roughness on slope cells | 0.500 | By calibration |
| Soil depths (m) | 1.000 | By calibration |
Publisher’s Note: MDPI stays neutral with regard to jurisdictional claims in published maps and institutional affiliations. |
© 2022 by the authors. Licensee MDPI, Basel, Switzerland. This article is an open access article distributed under the terms and conditions of the Creative Commons Attribution (CC BY) license (https://creativecommons.org/licenses/by/4.0/).
Share and Cite
MDPI and ACS Style
Harada, M.; Nagayama, S. Impacts of Flood Disturbance on the Dynamics of Basin-Scale Swimming Fish Migration in Mountainous Streams. Water 2022, 14, 538. https://0-doi-org.brum.beds.ac.uk/10.3390/w14040538
AMA Style
Harada M, Nagayama S. Impacts of Flood Disturbance on the Dynamics of Basin-Scale Swimming Fish Migration in Mountainous Streams. Water. 2022; 14(4):538. https://0-doi-org.brum.beds.ac.uk/10.3390/w14040538
Chicago/Turabian StyleHarada, Morihiro, and Shigeya Nagayama. 2022. "Impacts of Flood Disturbance on the Dynamics of Basin-Scale Swimming Fish Migration in Mountainous Streams" Water 14, no. 4: 538. https://0-doi-org.brum.beds.ac.uk/10.3390/w14040538
Note that from the first issue of 2016, this journal uses article numbers instead of page numbers. See further details here.