
Assessment of the Impact of Loss-of-Retention Fees on Green Infrastructure Investments


Faculty of Environmental Engineering and Energy, Politechnika Krakowska, 31-155 Krakow, Poland
*
Author to whom correspondence should be addressed.
Water 2022, 14(4), 560; https://0-doi-org.brum.beds.ac.uk/10.3390/w14040560
Submission received: 30 November 2021
/
Revised: 31 January 2022
/
Accepted: 9 February 2022
/
Published: 12 February 2022
(This article belongs to the Special Issue Urban Green and Blue Infrastructure: Current Issues, Challenges, and Opportunities)
Abstract
:Urbanization leads to the growth of impervious surfaces, which increases surface runoff, causing pluvial and flash flood phenomena. Furthermore, it significantly limits the infiltration of stormwater into the ground; this, in turn, reduces groundwater supply, ultimately intensifying drought effects. In order to adapt urbanized areas to climate change, the objective is to stop these unfavorable processes and strive for recreating the natural water cycle through developing decentralized stormwater management practices on private properties. An important management instrument that motivates property owners to invest is economic incentives, such as stormwater or impact fees associated with a system of rebates/discounts that depend on the applied stormwater runoff reduction solutions. Herein, we analyze a new economic instrument—a fee for reducing natural field retention—which is planned to be introduced in Poland. We assessed the incentive and funding (income-generating) function of the fee based on the example of the Sudół river catchment in Krakow, Poland. The research involved conducting simulation calculations and assessing the incentive impact through calculating investment Net Present Value (NPV), which is the investor’s response to the proposed economic incentives included in the structure of the fee and the rebate system. This study demonstrated errors and loopholes in the suggested fee rules—too low rates that prevent achieving profitability (negative NPV) for small-scale stormwater retention practices, and incorrect conditions that enable obtaining discounted fees. We also estimated the fee rate that ensures investment profitability.
1. Introduction
The issues of urbanization and area sealing lead to the intensification of water-related hazards; the risk of river floods, as well as stormwater and flash floods, increases, particularly in urbanized areas [1]. These phenomena are largely caused by intensive runoff of surface stormwater and snowmelt. On the one hand, they are the outcome of increased intensity and frequency of torrential rains; on the other hand, urban floods are also—perhaps even primarily—caused by the effect of buildings and increased area sealing, which significantly limit precipitation infiltration, evapotranspiration, and bioretention [2]. This, in turn, leads to increased and accelerated surface runoff, which causes flooding or an overflowing sewage system [3,4,5], and is more polluted than natural surface runoff [6,7]. The impact of urbanization is particularly evident in the case of minor rainfall events. Urbanization significantly affects high flow sensitivity in the case of short-term rainfall [8]. This means that urbanization directly leads to increased frequency of urban flooding, even if there are no changes in the temporal rainfall variability [9,10,11,12,13,14,15,16].
There are a number of concepts covering a sustainable approach to stormwater management (e.g., water-sensitive urban design (WSUD), low-impact development (LID), sustainable urban drainage systems (SUDS), and sponge cities) based on, among others, the ideas of mimicking nature, restoring pre-development dynamics, and encouraging ecosystem development [3,17,18]. It is necessary to strive for, first of all, solving the issue at the source—land development should be accompanied by solutions that enable detaining precipitation within a property—using green infrastructure (GI).
LID technologies can be implemented on the basis that both the functionality and structure of large-scale watershed systems are reliable [19]. It is difficult to address macro-scale problems when applying LID technology to a small area [20]. Recently, the introduction of LID systems has been abandoned in favor of the large-scale implementation of SUDSs and WSUDs to reduce the impacts of urban development [20,21]. A sustainable urban drainage system (SUDS) aims to reduce the level of pollution and the volume of stormwater runoff from urban areas. In many cities and settlements, SUDSs are replacing traditional stormwater drains. SUDS projects are resilient and nature-based solutions, and are thus an alternative to traditional rainwater management [22,23]. LIDs can be considered cost-effective water-recycling networks [24]. WSUDs provide an opportunity for sustainable urban water management, combining water infrastructure with urban design [25].
Sponge cities are a response to rainwater management. The implementation of the sponge city method should incorporate holistic perspectives that combine green infrastructure with grey infrastructure [20]. It includes elements such as enhancing sustainable urban drainage [22,26,27], promoting decentralized wastewater treatment plants [28,29], implementing ecological base flow [30,31], enhancing aquatic biodiversity [32,33], and developing urban open spaces and integrating rainwater-retention urban space areas [34]. In the sponge city method, the priority is to manage rainwater on the investment site. This relieves the pressure on the sewerage network and offsets the negative effects of rapid drainage from properties. However, it results in a necessity to retain rainwater in tanks in most investments. With a small plot size, it is possible to use rain gardens in a container, while, within the construction of an entire housing estate, it is possible to have extensive dry and wet gardens. Watering the greenery with rainwater works well virtually everywhere where communal greenery is planned.
There are numerous papers on the environmental benefits of stormwater management, applying such solutions as the use of green roofs [35,36,37], filter strips with vegetation [38,39], bioretention [15], and porous surfaces [40]. Permeable areas may facilitate temporary stormwater retention and infiltration into the soil, acting as natural runoff buffers [41].
A solution to this issue is an approach based on a number of actions, not only technical, but also non-technical, which include financial instruments that motivate property owners to limit property development and manage stormwater in a sustainable manner [42,43]. The development of other, non-technical instruments, especially administrative and legal, regarding the principles and restrictions in terms of land development, as well as educational activities, are, of course, strong support for limiting stormwater runoff [44,45].
Financial incentive instruments include various types of tax reductions (property tax, stormwater fees, and other taxes) and financing (subsidies, grants, cost shares, and reductions in interest rates) [46,47,48,49,50,51]. These types of instruments reduce investment costs (financing and permission tax reduction) or long-term payments, such as taxes and other fees (tax reduction), and motivate property owners to undertake investments in reducing rainwater runoff [17,18,42,52,53]. A recent review paper of the incentives for green roofs and green walls indicated that, in many European countries, as well as in North and South America, the most frequently used financial incentive is stormwater fee reduction [54]. Stormwater fees are common in the U.S. and Canada, as shown by the latest survey from 2021 [55]. Research on stormwater fees has been the subject of many analyses of their impact on the development of green infrastructure, which proved their effectiveness; for example: (1) the assessment of stormwater fees in Germany (also noted as imperviousness fees) [56,57,58] showed a 10% decrease in the impervious area in Munich [56]; (2) Qiao et al., in two research papers [17,45], analyzed the governance factors of sustainable stormwater management and recommended the use of stormwater fees as an important incentive; and (3) analyses of stormwater fees in Poland were conducted in terms of their impact on the economic efficiency of green infrastructure [59,60,61], and they were also mentioned as important factors in the development of sustainable stormwater management [62,63]. Thurston et al. analyzed auctions and fees as incentive methods, and concluded that relatively minimal financial incentives could encourage homeowners to retain stormwater runoff on their property [47]. The stormwater fees of eight countries across all continents were described by Tasca et al. [58], who analyzed their structure and the reasons for their introduction, and concluded that collecting stormwater fees is an effective mechanism for financing stormwater management, and that levying fees is a way to draw residents’ attention to their impact on water resources. However, it can only attract people’s attention when the fees are substantial compared to other expenses [58].
Stormwater fee rates and rebates are a significant problem, as there are many approaches to fee construction. For a broad list of stormwater fee rates and their fairness in the U.S. and Canada, see the 2021 survey mentioned above [55]. Kertesz et al. conducted research on the policies of several cities in the U.S., where the stormwater fee rebate system was analyzed and associated with the runoff reductions achieved, indicating large discrepancies [64]. Models for determining the rates of stormwater fees to cover the costs of running the stormwater system include those reported in the studies by Abebe et al. and Tacsa et al. [65,66]. In Poland, the analyzed loss–of–retention fees are to be more of an incentive, rather than constituting the income of enterprises responsible for stormwater management, and instead only the entity responsible for river maintenance and flood risk management. Therefore, the structure of the fee should be analyzed precisely in terms of the motivation for users. The motivational role of financial instruments (tax reduction) depends on the rates and the system of rebates. The problem of low rates and, therefore, low benefits for investors and insufficient motivation to invest was noticed in the studies [49,58,60], indicating that this may require the inclusion of other additional incentives, such as grants and education and advisory programs [67,68,69].
The economic assessment of the efficiency of investments in green infrastructure results from the balance of the costs and benefits they cause; the costs include mainly easy–to–evaluate capital costs and maintenance costs. In this case, the benefits of GI projects are numerous: health benefits (air quality improvement, heat island abatement, increased greenness that improves mental and physical health, and reduced noise pollution), climate benefits (reduced flooding, water quality improvement and protection, water savings, energy/fuel savings, greenhouse gas reduction, and sequestration), and community livability (amenity/esthetic improvement, increased property value, community cohesion, environmental equity, and access to nature) [49,70,71,72]. The listed social and environmental benefits come from the fact that many blue–green infrastructure measures involve the restoration or creation of ecosystems that deliver ecosystem services [71,73]. Ecosystem services in urban areas provided by blue–green infrastructure deliver benefits in four areas: (1) provisioning, (2) regulating, (3) supporting, and (4) cultural [74]. In the literature related to the economic assessment of green infrastructure, the valuation of benefits is often carried out through the valuation of ecosystem services [75,76,77,78]. A comprehensive assessment of all of the social and environmental benefits generated by green infrastructure is a public/social profitability assessment. However, it is also important to look from a private investor’s point of view (property owner), which is carried out through the assessment of financial feasibility. A financial feasibility assessment considers individual/private costs and benefits, the balance of which determines the feasibility of the investment considered by the investor; the return is generated sufficiently to compensate the investor for the expenses related to the project [79]. The calculation of the financial profitability for private investors allows us to determine the necessary levels of incentives that could increase the profitability of investments and encourage investors to undertake projects. There is a lack of such feasibility studies, most of which can be found in the profitability analyses of rainwater harvesting systems (RHSs), while other green infrastructure measures are rarely analyzed. Examples of feasibility studies of RHSs include: the financial appraisal of RHSs from the arena rooftop of Filton Airfield in the U.K. [80] and payback period estimation and RHSs for single-family residences in Porto and Alma in Portugal, with a sensitivity analysis of the water price [81]. Both case studies showed that water tariffs play a significant role in the profitability of RHSs.
Research into larger systems, considering the impact of their scale on cost-effective-ness, includes a case study of RHSs for multi-story buildings in Spain with a life-cycle costing approach [82], another Spanish study of the feasibility of a different organization of RHSs for several types of residential buildings [83], and a profitability assessment of RHSs for small and large commercial buildings in Malaysia in terms of the net present value, return on investment, cost–benefit ratio, and payback period [84]. All of these economic analyses showed that, depending on the water price scenarios, larger systems are more profitable than smaller ones, with the Spanish studies emphasizing the advantage of economies of scale [82,83]. Other RHS feasibility studies include the assessment of community RHSs in Bangladesh (with an analysis of climate change in the form of increased rainfall) [85], and Australian and Kenyan RHS analyses, showing that cost-effectiveness should take into account rising water prices in response to climate change and increasing water scarcity [86].
Feasibility studies for other types of green infrastructure projects are rarer in the literature, conducted, among others, by Malinowski et al. on the effectiveness of stormwater fee credits as an incentive for the implementation of GI measures on private commercial property. The net present value was calculated for various levels of capital investment and annual maintenance costs, and private benefits included potential revenues/benefits from five municipal incentive schemes (existing utility subsidies and annual fee credits; cases: Philadelphia, Seattle, Nashville, Charlotte, and Prince George’s County) [87]. A similar approach was presented by Valderrama et al., who conducted an analysis for Philadelphia based on the determination of the unit costs of stormwater practices, the annual stormwater reductions, and the critical threshold values of the unit costs, ensuring reimbursement up to 10 years (analysis of the payback period and the net present value). It was shown that only some of the practices were attractive to property owners in the existing stormwater fee system. The authors recommended deploying additional financial incentives for GI projects, such as subsidy programs and raising stormwater fees and/or credits [88].
The risk of urban floods will most probably intensify due to the increasing frequency of extreme rainfall resulting from global climate change [89,90,91]. Therefore, understanding the impact of urbanization on surface runoff and suggesting planning strategies aimed at improving the resistance of cities to floods require greater efforts [11,92].
The aim of this paper was to present a new financial instrument—a fee for reducing natural field retention—which is to be introduced in Poland to support sustainable water management in urban areas. Using the example of the Sudół river catchment in Krakow, we evaluated the incentive and fund functions of the fee. On the basis of the simulation calculations performed in this study, it was possible to assess the incentive effect of the charge. Additionally, the study also showed errors and gaps in the proposed rules of the fee. We estimated the fee rate, which provided material for discussion on ensuring the profitability of planned investments. The following research questions were formulated for this study: (i) Are the fee rates for reducing natural retention a sufficient incentive for investors to invest in stormwater management solutions on private properties? (ii) Are the incentive and funding functions of the charges fulfilled?
2. Materials and Methods
2.1. Case Study Description—Sudół Catchment
The analyzed catchment (case study), with an area of 1836 ha, is located in the northern part of Krakow, Poland, within the city of Krakow, as well as the Wielka Wieś and Zielonki communes (Figure 1).
The approximately 9 km-long Sudół river passes agricultural and urbanized areas. The conducted spatial analysis of the catchment area land development using publicly available topographic data from the GUGIK (Head Office of Geodesy and Cartography) database [93] indicated that more than 50% of the land within the catchment is used for agricultural purposes. Over 36% of the studied area is urbanized land and more than 13% is covered with vegetation, including 11% with forests and tree canopies (Figure 2).
The Sudół river, in the upriver and middle courses, comprises discharged water from low-intensity residential housing areas, as well as agricultural and greenery areas. In its downriver course, it reaches a highly urbanized area of the city of Krakow, built-up with numerous housing estates of high and low intensity (100 ha), commercial and production areas (98 ha), as well as roads, railroads, and pedestrian routes (129 ha). The water from this area is discharged primarily via stormwater and combined sewage systems to the Sudół river—the right-bank tributary of the Prądnik river, which constitutes a significant flood hazard.
The conducted spatial analyses using QGIS software (QGIS version 3.20.3.-Odense) proved that the studied area was under pressure from anthropogenic activity, which was justified by the calculated average runoff coefficient for the entire catchment, amounting to 0.61. The query covered all information available in the GUGIK database concerning the materials used for impervious surfaces, the types of vegetation, and the operating specification of each of the areas. The calculated total impervious surface area comprising all surfaces with a runoff coefficient above 0.85 (building and structure roofs, roadways, pedestrian and bicycle routes, and yards) within the area of the studied Sudół river catchment was 383 ha and amounted to approximately 21% of the total area. Figure 3 illustrates the case study area of the Sudół river catchment with the use of basic aggregated topographic object classes, the interpretation of which indicates the significant industrialization of the southern catchment section located within the city of Krakow.
2.2. Runoff Estimation as an Assessment of Water Cycle Disturbance
Progressive urbanization impacts ground sealing; as a consequence, it leads to a reduced ability of soil to filter and retain water, resulting in larger runoff and accelerated flow of stormwater to discharge locations [41,94,95,96].
The rational method of runoff calculation is based on rainfall intensity in the form of [60,97,98,99]:
where:
- —runoff volume from a given area (m3/unit time);
- RC—runoff coefficient;
- F—analyzed area (m2);
- P—peak (or daily or annual) rainfall (mm/unit time).
The product of the rainfall and runoff coefficient expresses the runoff from the surface in question over an analyzed time unit. Some of the rainfall soaks into the ground, is retained on the surface, or is evaporated; hence, not all of the rainfall reaches watercourses. The runoff coefficient, also called the catchment watertightness coefficient, is the ratio between the runoff from a given surface to the rainfall magnitude that fell on that surface.
The RC value strictly depends on the land development method/coverage, with the land gradient also of significant importance in this regard. The runoff coefficient values for simplified runoff volume estimates were adapted as per the source literature data. For watersheds with multiple land-use classes, a composite (area-weighted average) runoff coefficient, , can be estimated [97,98]:
where:
- —th subarea with a particular land-use type;
- —total number of land-use classes in the catchment;
- —literature-based runoff coefficient for the ith land-use class;
- —subarea size for the ith land-use class in the watershed.
For the purposes of estimating the annual average surface runoff volume within the studied Sudół river catchment, we conducted calculations using literature-based runoff coefficient values [97,100], the GUGIK database, and the precipitation multi-annual average for the years 1981–2015 measured at the climatic station Krakow Observatory, located in the Botanical Garden, which amounted to 670 mm [101]. The watertightness degree of individual cadastral plots was estimated using an algorithm developed in QGIS and Excel. The presented calculation results (Table 1), which take into account the unit runoff coefficients for each facility class, indicate that almost 18% of stormwater flows from impervious surfaces, which amounts to 2183.34 dam3.
The area of impervious surfaces (roads, yards, roofs, and parking lots) within the catchment was 383 ha, amounting to ca. 21% of the studied catchment area. The obtained divergence in the percentage shares resulted from the ongoing stormwater microretention, infiltration, and evapotranspiration processes on the surface of the impervious surface. Furthermore, it should be noted that the calculated 18% precipitation runoff from the impervious surfaces accounted for more than 53% of the share in the total runoff from the Sudół river catchment; therefore, undeveloped and biologically active areas generated an annual runoff of less than 1970 dam3.
2.3. Existing and Planned Financial Instruments Motivating Property Owners to Construct Green Infrastructure and the Assessment of Their Potential Effectiveness
Fees for reducing natural retention were introduced by the Water Law Act of 2017. They are typical economic instruments applied in environmental management, which usually have two functions—incentive and economic. These functions include [102,103,104,105,106]:
- Income-generating function (also called the funding or fiscal function): fee-based funds form a source for financing running costs and investments. In this case, they constitute the income of the State Water Holding Polish Waters—a public entity responsible for river maintenance in Poland.
- Incentive function: introducing an instrument (tax, fee, or subsidy) causes users to take desirable actions (limit their environmental impact). For example, in the event of land development and the associated loss of natural retention, the basic desirable action is limiting the degree of catchment tightness and implementing compensation investment projects (stormwater retention).
The Water Law introduced two fees aimed at improving stormwater management in Poland: a fee for discharging stormwater and snowmelt, and a fee for reducing natural field retention [107].
Fees for discharging stormwater and snowmelt are paid by all entities with water permits for discharging stormwater or snowmelt to water in the form of open or closed stormwater sewage systems used to discharge precipitation or collective sewage systems within the administrative boundaries of cities. The fee for reducing natural field retention is complementary to the fees for discharging stormwater collected in sewage systems within the administrative boundaries of cities. This way, the legislator addresses urban and suburban areas subject to intensive development and the associated land sealing, which have experienced urban floods in recent years. This stimulus was introduced through differentiating (significant reduction) fee rates in the event of constructing such infrastructure [107].
Under the current legislation, the retention fee shall be payable if a property satisfies three conditions simultaneously:
- The area is over 3500 m2;
- More than 70% of the property area is excluded from a biologically active area due to development;
- The property is located within an area not covered by an open or closed sewage system.
The fee is a product of a unit fee rate and the volume of lost biologically active area expressed in square meters. A mechanism to motivate a reduction in the runoff from properties was introduced. The structure of the fee includes rate reduction in the event of using stormwater retention devices. The level of the fee rate depends on the equipment volume relative to the annual runoff. The Water Law Act specifies the maximum fees for reduced retention (PLN 1/m2/year (€0.22/m2/year), while the current rates are lower, in the years 2018–2021, this fee amounted to PLN 0.50/m2/year (€0.11/m2/year)). The current rates are published in a relevant implementation regulation in addendum to the Act. Such a legal structure enables them to be annually updated, e.g., in the event of significant inflation or other factors that enforce rate adjustment without the need to amend the Act. The maximum fee rates and those applicable in 2021 are listed in Table 2 [107,108]:
The fees are calculated and collected by communes, but the funds (90% of the resources) are transferred to PGW WP, with only 10% left for the communes to cover administrative expenses.
The fees have been in force since 2018, and the audit by the NIK (Supreme Audit Office) indicated that the revenue in this regard on the national scale is at a level of PLN 6.24 MM (€1.37 MM) (data for 2019), which means that the fee covers just ca. 1200 ha, accounting for ca. 0.07% of the urbanized area throughout Poland [109]. The NIK audit was conducted in 18 cities, and it showed that properties subject to this fee were located in only 11 of them, with examples listed in Table 3:
The fee for loss–of–retention appears to be an instrument with a very poor impact—both the number of entities covered by the fee and the accumulated funds are small. Therefore, planning is underway to change it. This change will lead to imposing the fee on a larger number of properties. The planned changes are as follows [110]:
- The fee will cover properties with an area of over 600 m2;
- The plot development/watertightness criteria will be less stringent—the fee will apply to those properties that exclude more than 50% of the property surface from the biologically active area;
- The condition that a property is to be located within an area not within the range of open or closed sewage systems will be removed;
- A planned rate increase of 50%;
- Fee-based funds—funds for communes will increase to a level of 25%, provided that 80% of this amount is spent on developing stormwater retention; 75% of the funds will be transferred to Polish Waters.
2.4. Economic Efficiency of the Investment (Investor Profitability) as an Incentive for Residents and Entities to Construct Green Infrastructure
The net present value (NPV) method, which is a discount method that determines the total net gains (total gain surplus over costs) for investors, has been used to assess the incentive function of the fee [70]. An investment is profitable if the NPV is greater than zero. The NPV is expressed through the formula [83,87,111]:
where:
- CFt—cash flow in year t;
- r—discount rate;
- t—time in years, from 0 to n;
- n—analysis period.
In the event of investment projects related to stormwater retention, the analysis will estimate two basic expenses, namely capital expenditure and operating costs, as well as two possible gain sources, namely gains on account of reduced retention fees and potential gains on account of reduced tap water bills, which could be the case if rainwater is used for economic purposes (lawn watering, toilet flushing, etc.). Therefore, given the above categories, the NPV is expressed by the formula [86]:
where:
- It—capital expenditures in year t;
- Ot—operational expenditures in year t;
- Rt—benefits of fee reduction in year t;
- Bt—benefits of reducing tap water bills in year t;
Others as above.
In this study, the following assumptions were adopted for the calculations:
- An analysis period of 10 years was adopted as the expected payback time for private investors [87];
- Operating costs were adopted at a level of 2% of the capital expenditure (periodic cleaning and pumping energy costs);
- The tap water cost for the purpose of calculating potential stormwater-used gains was adopted at PLN 11/m3 (€2.42/m3) [117].
The applied approach is presented in a methodological flowchart (Figure 4) describing the stages of the analyses:
- The method of qualifying properties for fees according to the existing and planned regulations (checking the increase in the area of real estate subject to fees);
- The calculation of due fees resulting from the impervious surface and the fee rate depending on the volume of retention devices (the volume is related to the annual runoff);
- The estimation of costs (capital and maintenance) and benefits (fee and water bill reductions);
- The calculation of the NPV.
3. Results
3.1. Selecting Properties Subject to Fees
The procedure of selecting properties that satisfy the criteria set out in the Water Law Act required geospatial analysis using the GUGIK database, GIS tools, and orthophotomaps. Properties (excluding cadastral plots developed for roads) satisfying the area (>3500 m2 property area) and area watertightness (>70% watertightness) criteria were very rare. A total of 252 cadastral plots with a total area of 75 ha, including an impervious area of 63 ha accounting for 16.5% of all impervious surfaces, were identified within the Sudół river catchment. It should be noted that there were no available maps or documents establishing a property that may have consisted of a single or more cadastral plots; therefore, the conducted procedure was an estimate. The locations of the properties selected based on the legislation applicable in Poland are graphically depicted in Figure 5.
Figure 5 summarizes land development as per the applicable local zoning plans (MPZPs) and the selected properties (>3500 m2 and >70%), marked with dark lines. It can be noted that the highest number of selected properties was located within commercial and production areas (50.5 ha) and residential areas (8.9 ha). According to the current regulation, one more criterion shall be adopted (sewage system access), which applies to the potential connection of the property to an open or closed sewage system. The analysis of the selected 252 cadastral plots clearly showed that all of them were within the range or directly connected to a stormwater or combined sewage system. Therefore, the last of the criteria exempts all located properties from the need to establish fees for reducing natural field retention due to tightening the property area.
A draft Act updating the legislation regarding fees for reducing natural field retention within a property was developed in 2020. Its basic assumptions relate to planned changes in terms of selecting properties to be subject to the fees in question. Properties, also excluding cadastral plots developed for roads, would have to satisfy more stringent area (>600 m2) and area watertightness (>50% watertightness) criteria, excluding the criterion of open or closed sewage system availability. The studied Sudół river catchment area was analyzed with the assumption of the suggested criteria (Figure 6).
The conducted calculations resulted in a larger number of properties, consisting of 907 cadastral plots, classified as subject to fees. The map (Figure 6) shows their high concentration in the southern, urbanized section of the catchment within the city of Krakow. The total area of the selected properties was 181 ha and was still very low relative to the total catchment area. The impervious area therein (131 ha) was ca. 34% of the impervious developed area within the catchment. However, note the distribution of selected cadastral plots, the largest area of which (75 ha) covered commercial and production land, and 45 ha corresponded to residential areas, mainly of high intensity (26 ha). The proposed legislation still excluded almost 66% of the impervious area within the catchment from the obligation to pay fees for reduced retention.
The estimated volume of the studied catchment area runoff volume indicated that only 34% (i.e., 748 dam3) could be accumulated and used annually by property owners, assuming a sufficient volume of the reservoir tank to enable collecting stormwater from the entire impervious area, while ensuring its full use prior to the next rainfall.
The next map (Figure 7) shows the cadastral plots (shades of purple: 20–50% area watertightness) that constitute the properties omitted in the proposed procedure for selecting properties subject to fees, conducted and described above, due to the fact that the criterion related to a property area of 600 m2 was not exceeded.
The purple color in Figure 7 marks an area of 106 ha, with a stormwater runoff of 606 dam3, which was not included in the selection results and was omitted with regard to calculating the fees. It was mainly associated with the division of residential complexes into cadastral plots with areas below 600 m2, which is shown in Figure 8. This figure displays a map of a housing estate fragment with low-intensity terraced houses on Pękowicka/Wiarusa St. in Krakow, where the cadastral division prevents selecting such properties as being subject to fees.
The 8.7 ha housing estate shown in Figure 8, in part of the Sudół river catchment area in question, has a 4.5 ha built-up area with impervious materials; therefore, neither its entirety nor individual separated properties were classified as subject to the fee for reduced natural field retention. Of the 238 cadastral plots, 57 were impervious in at least 50%, and 97 of the plots were impervious in 40–50%; however, their average area was only 100–300 m2.
3.2. Simulating the Impact of New Fees on Motivating Residents to Build Retention Facilities
For the properties selected and described above, which satisfy the conditions and will probably be subject to the obligation to pay the new fee for reduced retention, the following summary calculations were conducted for all users:
- The area of the property covered by fees;
- The impervious area;
- The total annual fee for loss of retention;
- The total runoff (annual runoff) from impervious surfaces that can/should be retained.
For the purposes of the fee calculation, it was assumed that the current fees will increase by 50%, just as the rates planned in the draft of the Act [110]. The planned rates of the fee for reducing retention are listed in Table 4.
The fee rates depend on stormwater retention (Table 2 and Table 4). The fees to be paid according to the basic rate are shown in Table 5. The rate discount structure is aimed at supporting the development of stormwater retention; however, the following issues are a significant hindrance:
- The minimum retention level that entitles a property to the first fee discount of 50% is not defined in any way. This is why a fee discount of 50% can be obtained simply by having any rainwater retention device, e.g., a small rain barrel; the legislation does not condition the discount upon the volume of such a tank, the impervious surface, or the stormwater volume to be retained in it;
- The second fee discount level (reduction of 75% relative to the fee without retention equipment) can be achieved if the volume of the retention equipment is 10–30% of the annual runoff from impervious surfaces; in turn, this requirement seems very exaggerated, being approximately three times higher than the volume of equipment required when designing retention devices, e.g., a stormwater sewage system. For example, when designing retention devices within an urbanized area in accordance with standard PN-EN:752 2017 [118], the designed first rate of rainfall is the maximum rainfall (Pmax) with an occurrence probability of p = 20%, a return period of c = five years, and a duration of 15 min, which, according to Bogdanowicz–Stachy’s method, is 211 dm3/s/ha [60,119]. The volume of this rainfall accounts for 3% of the annual runoff from the impervious area. The volume at a level of 10% of the annual runoff corresponds to rainfall of 633 dm3/s/ha (and a duration of 15 min), which is even higher than the rainfall with an occurrence probability of p = 2% and return period of c = 50, with critical infrastructure designed in this regard. To sum up, obtaining the second fee discount level requires designing retention devices with a very large volume, which is not practically feasible due to capital expenditure and engineering principles;
- The legislation assesses the equipment volume relative to the annual runoff volume; the problematic issue is determining the volume of equipment that also utilizes soil infiltration. Unfortunately, general provisions of the law do not entail any guidelines regarding the calculation of such equipment volume. However, because the few entities that currently pay fees for reduced retention do not have any equipment with a volume exceeding 10% of the runoff, they are only entitled to the first discount, which applies for actually simply having retention equipment of any volume. Due to this, the issue of determining the volume of retention and infiltration equipment has not been unequivocally raised as necessary for regulation/clarification.
Four variants were simulated in order to assess the planned fees. These variants were related to the behavior of property owners with regard to implementing investments in stormwater retention devices (rain barrels and cisterns):
- Variant 1: Property owners implement a minimum plan, i.e., equipment with a volume at a level of 0.1% of the runoff from the impervious surfaces within their properties. A minimum variant providing a 50% fee rate discount;
- Variant 2: Retention devices with a volume at a level of 10% of the runoff. This volume ensures a higher fee rate discount of 75%;
- Variant 3: Retention devices with a volume at a level of 3% of the runoff. This variant guarantees a 40% fee discount, ensuring the retention of the maximum rainfall (Pmax) with an occurrence probability of p = 20%, a return period of c = five years, and a duration of 15 min, totaling an amount of 211 dm3/s/ha;
- Variant 4: This involves estimating a new, increased fee rate that ensures the profitability of investing in retention devices with a volume amounting to 3% of the runoff.
The fees are assessed through calculating the following values for each of the variants:
- Assessing the fee as an incentive stimulus; the profitability for the investor is calculated for each property through calculating the NPV;
- Assessing the fee funding function (fee as a source of generating funds for water management); total funds generated by fees on a catchment scale.
3.2.1. Variant 1
This variant involves simulating the behavior of those investors that invest in minimum-volume retention equipment in the event of a need to pay the fee for reduced retention and its possible reduction. For all of the analyzed properties, it was assumed that the volume of equipment was at a level of 0.1% of the runoff from impervious surfaces, which meant a need to install one rain barrel with a volume of 0.2–0.3 m3 for the smallest properties of 601–1000 m2 and an impervious area of up to 540 m2. In the case of larger properties (with larger impervious surfaces), the required volume was several cubic meters (up to a maximum of 9 m3).
The required capital expenditure, operating costs for the analyzed 10-year period, and gains associated with a reduced fee were estimated for each property. Ultimately, the profitability of such investments was determined through calculating the NPV.
An additional gain that may motivate property owners to construct stormwater retention systems is the possibility of using such water instead of tap water. It was assumed that the accumulated rainwater can be used, for example, to water green areas. Increased capital expenditure on the construction of automatic watering systems was not assumed. However, it was assumed that the simplest retention system was equipped with a pump that enables either discharging the retained water to the sewage/filtering system or collecting water for watering purposes. The calculation results are shown in Figure 9.
The construction of retention equipment was profitable in both analyzed cases involving both only water retention and its use. The gains on account of reducing the fee were higher for such low volumes, meaning low capital expenditure and covering them with a surplus. The decline in NPV evident in the graph resulted from the two unit capital expenditure values assumed for the analysis: PLN 1.2 k/m3 (€263/m3) for devices with a volume of up to 2 m3 and PLN 1.6 k/m3 (€351/m3) for greater volumes.
3.2.2. Variant 2
This variant involved estimating the profitability of an investment that would ensure obtaining the higher fee discount (75%). For all analyzed properties, it was assumed that the volume of equipment was at a level of 10% of the runoff from impervious surfaces, which meant the need to install tanks with a volume of 18–30 m3 for the smallest properties of 601–1000 m2 and an impervious area of up to 540 m2. In the case of larger properties (with larger impervious surfaces), the required volume reached 900 m3.
Each property had the profitability of such investments estimated through calculating the NPV via two options—sole retention and the additional use of rainwater, e.g., for watering. The calculation results are shown in Figure 10.
Constructing retention equipment was unprofitable in both of the analyzed cases—sole water retention and its use. In the case of such large volumes, the gains on account of a reduced fee cannot make up for the high capital expenditure.
3.2.3. Variant 3
This variant involved estimating the profitability of an investment that would provide each property with a volume enabling the retention of designed rainfall of 211 dm3/s/ha. For all analyzed properties, it was assumed that the volume of equipment was at a level of 3% of the runoff from impervious surfaces, which meant the need to install tanks with a volume of 5–9 m3 for the smallest properties of 601–1000 m2 and an impervious area of up to 540 m2. In the case of larger properties (with larger impervious surfaces), the required volume reached up to 270 m3.
Each property had the profitability of such investments estimated through calculating the NPV via two options—sole retention and additional use of rainwater, e.g., for watering. The calculation results are shown in Figure 11.
Constructing retention equipment was unprofitable in both analyzed cases—sole water retention and its use. However, the loss level (negative NPV) was, of course, lower than that for Variant 2.
3.2.4. Variant 4
Both of the applicable and planned fee rates were at a very low level. This variant involved simulating a fee level that would ensure the profitability of investing in equipment with a volume amounting to 3% of the runoff from impervious surfaces.
If the fee rate was increased to PLN 4.68/m2 (€1.03/m2) and the current discount system was maintained so that a 3% volume discounts the rate by 70%, the total gains resulting from reducing the fee and additionally reducing tap water bills due to the use of rainwater would balance the construction and operating costs. The calculation results are shown in Figure 12.
A rate of PLN 4.68/m2 (€1.03/m2) provided an incentive to invest in stormwater retention and use. Without the gains on account of reduced tap water bills, the rate would have to be even higher—approximately PLN 5.44/m2 (€1.19/m2).
The conducted calculations showed that the assumed legislation change (changed retention reduction fee) can still be ineffective, since it will not lead to developing retention and limiting flood and drought hazards. A change in the principles governing the qualification of properties for fees will certainly result in a very high number of users incurring such a fee. Over 900 properties were classified as subject to fees within the analyzed catchment. Their total area was approximately 10% of the entire area. However, due to the suggested fee rates (most probably PLN 0.75/m2 (€0.16/m2)), the fees would be too low to motivate property owners to invest. For example, properties of 601–1000 m2, with a watertightness level of 50% would be charged with a fee of approximately PLN 270-450/year (PLN 23–38/month) (€60–100/year or €5–8/month). The fee rate discount system does not specify a minimum equipment volume that entitles to the first discount of 50%. This is why property owners will probably limit themselves to minimum investments, e.g., purchasing rain barrels or small tanks, the cost of which does not exceed PLN 1–1.2 k/m3. This way, they are able to limit the fees to PLN 135–225/year (PLN 11–19/month) (€30–50/year or €2.5–4/month), hence recovering the expenditure over a period of several years.
The fee rate discount structure, without minimum requirements as to the volume of retention equipment, can, therefore, trigger the situation described in variant 1: the achieved total volume will be at a level of approximately 750 m3 (or even less), and the granted discounts (difference between the total fee in variant 0 without equipment and the fee in variant 1) will reach a level of approximately PLN 490,000 (see Table 6). The retention capacity of such small devices may not have any impact on limiting the hazard in periods of high precipitation, and this, plus limiting drought outcomes (through water retention and filtration at its precipitation site), was a premise for amending the fee for reducing natural retention. Those investors aware of the design and effectiveness principles, who would want to implement devices with a volume enabling rainwater retention (variant 3), would be entitled to the same discount, although the total retention volume required in this case would be 30 times higher, at a level of 22,000 m3. An analysis of variant 3, which also involves potential additional gains on account of reduced tap water bills, demonstrated that such an investment level is not profitable for investors. Only the application of higher rates (and a potentially different discount structure) may encourage investors to implement devices with an effective retention capacity.
The current discount structure provides for further discounts when constructing equipment with a retention volume at a level of 10% of the annual runoff (75% discount) and more than 30% of the annual runoff (90% discount). However, even reaching a volume in the order of 10% is completely financially unprofitable.
An assessment of the funding (income-generating) function should address the total fees that can be collected from property owners. The funding role of the fee increases relative to the currently applicable rules, which, as mentioned in Section 2.3, currently result in an inflow of nationwide fees at a level of PLN 6.24 MM (€1.37 MM). The basic fee rate, with the planned more stringent fee-eligibility qualification rules, can generate funds at a level of approximately PLN 985,000 per year already for the analyzed area (€216,000). This amounts to approximately one-sixth of the funds that are already generated on a nationwide scale. Therefore, this will be a huge increase in the revenue generated by this fee on a domestic scale. These funds will be divided between the local government (25%) and Polish Waters (75%), who are responsible for river maintenance and implementing investments in the field of flood and drought protection. A fund of this magnitude could be a significant financing source for local stormwater management systems and subsidy schemes, additionally motivating investors to implement investments related to stormwater management.
However, it should be noted that, while the Act specifies that local governments must spend 80% of these funds on stormwater retention development investments, there is no such instruction applicable to Polish Waters. Therefore, most funds (75%) will be sent to Polish Waters, the financial needs of which, in terms of funding supra-local investments, significantly exceed the funds at its disposal. This is why it is likely that the funds collected from fees transferred to Polish Waters will not be spent again on investments to solve local issues associated with stormwater management.
4. Discussion
The often-mentioned economic limitation of the development of blue–green infrastructure includes economic factors. The lack of funding for both the construction and subsequent maintenance of such infrastructure [68,99,120], as well as the uncertainty regarding the responsibility for construction and maintenance funding, are a problem [120]. New principles for qualifying properties as subject to fees for reduced natural retention are a way to generate funds that can be used by local governments and Polish Waters for implementing investments, as well as for co-financing or launching subsidy incentive schemes for private investments.
The study of stormwater policy/management clearly stresses the lack of incentive instruments—both in terms of fees [99] and tap water prices—because the aspect of water bill savings may also be a stimulus behind undertaking rainwater harvesting [99]. This is why the study emphasizes the role of creating incentive instruments [120], with many cities creating such schemes including fees (stormwater fee and development/impact fee), together with a discount system for onsite stormwater management and/or surface unsealing, thus achieving both an incentive for residents and a funding source for stormwater management [68,69,121,122,123,124]. The changes proposed in terms of the fee for reduced retention will, in fact, be an introduction of “impact fees.” The change involves, among other things, popularizing this fee through covering much smaller properties with an area above 600 m2 instead of the current 3500 m2, removing the restriction regarding non-sewage areas, and reducing the development/watertightness threshold from 70% to 50%. This leads to an increase in the impervious area subject to fees within the analyzed catchment to ca. 34% of the analyzed developed land. However, it should be noted that a greater part of an impervious area will not be subject to such a duty. The property area criterion (>600 m2) should be removed or significantly lowered, since a fixed classification method leads to the rejection of a considerable impervious area, important from the perspective of surface runoff.
The planned amendment of the fee for reducing natural retention, unfortunately, does not cover a fee-reduction system. Leaving the possibility of obtaining a high 50% discount without leaving the requirement of minimum volume may result in the retention obtained this way being very small and, hence, ineffective from the perspective of limiting pluvial flood hazards.
Another issue might also be the lack of guidelines regarding the determination of retention equipment volume; it is currently assessed directly based on equipment dimensions, which is simple in the case of tight tanks. However, in the case of equipment with infiltration, the volume may be determined in various ways in the absence of such guidelines. For the purposes of calculating fees and fee rate discounts, it would be better to determine the retention capacity on an annual scale. The equipment volume can be used repeatedly, which, unfortunately, has neither been taken into account in the legislation nor has been specified in the explanations or guidelines for designers, property owners, or even local government officials who currently calculate such fees.
The analyzed fee changes will generate an economic stimulus for property owners; however, the conducted economic efficiency analysis in the form of estimating the total profit/loss over a period of 10 years (NPV) demonstrates that it is not a strong incentive to undertake investments. The achievable gains on account of reduced fees, even if we additionally take into account the potential benefits on account of reduced water bills, do not compensate capital expenditure or operating costs. Only a small rainwater barrel and small cisterns will be profitable for investors.
To sum up, the suggested changes in the fees for reduced natural retention will significantly increase the number of properties obliged to pay such fees. Therefore, they will lead to achieving the funding effect and the fee funds will generate considerable revenue that will finance water management, although, primarily, the operation of the State Water Holding Polish Waters. Whereas, in terms of the incentive function of the fees for reduced natural field retention, the suggested changes will probably not contribute to a massive reduction in the sealing process and development of stormwater retention. Therefore, they will not significantly impact the pluvial flood risk or the adaptation of urban areas to climate change.
5. Conclusions
This paper used a specific example of the Sudół river catchment in Krakow to show how a fee for the reduction in natural retention will work in practice. The new regulations regarding the qualification of properties for the charges (the algorithm presented in the flowchart in Figure 4) will contribute to a radical increase in the area of properties subject to the obligation to pay the charges. The geospatial analyses carried out showed that the sealed area subject to charges is 131 ha, while, currently, no parcel in this area (0 ha) is subject to a similar charge. However, there is still a significant portion of the sealed area of approximately 106 ha (Figure 7), i.e., 28% of the sealed area in the analyzed catchment (these are properties not exceeding six acres). In our opinion, these properties should also be subject to charges so that, on the one hand, they bear the financial responsibility for the increase in sealing and the increase in flood risk, and, on the other hand, they are also motivated in this way to take measures to retain and use rainwater. As studies [82,83] have shown, cost-effective joint solutions involving several properties can also be realized for this type of development.
We proved that the introduction of the proposed solution to the legal system is unlikely to result in increased implementation of retention projects. In our opinion, the proposed charges do not fulfill the basic aim, which is to balance rainwater management in urban areas in urbanized catchment regions as an activity aimed at adapting these areas to climate change. We consider that the proposed rates of fees and discounts for the installation of rainwater retention devices of a specified volume (in the three categories of 0–10%, 10–30%, and more than 30%) are not encouraging and may not meet the objectives of sustainable water management for climate change adaptation purposes. The results of the calculations for option 3 allowed estimating the minimum volume of water storage devices to be 3% of the average annual rainwater runoff from the built-up area. It is estimated that volumes below this value will not be sufficient to collect rainwater from the assumed authoritative rainfall (p = 20%, t = 15 min); therefore, despite the implementation of the retention obligation and receipt of a 50% reduction in fees, the basis of the policy of adaptation of urban areas to climate change in terms of rainwater management will not be preserved. On the basis of the conducted analyses, we conclude that the volume of domestic retention reservoirs at an amount of 3% of the average annual rainfall outflow from the built-up area should be the minimum volume for which a discount should be provided. Tanks with a volume below this value should not be considered for the planned system of fee reductions.
The calculations carried out in this paper proved that the incentive function of charges for the reduction of natural terrain retention will not contribute to a massive reduction in the sealing process or the development of rainwater retention. The proposed changes are:
- Extending the fees to all properties;
- Changing the defined capacity thresholds at which reductions in the fee may be obtained: a minimum required capacity should be introduced, with a reasonable threshold being above the mentioned 3% of annual outflow;
- Changing further thresholds, which are very high, exceeding 10%, as well as 30%, of the annual outflow and being completely unprofitable for private investors (without additional financial support, e.g., in the form of subsidies);
- Developing additional guidelines on how to calculate the retention capacity of facilities; for example, the current practice does not take into account the capacity resulting from the infiltration capacity.
We confirmed in this paper that the proposed changes to the charges for reducing natural retention will increase the number of properties that will have to pay said charges, thus achieving a funding effect. However, the funds from the fees will mainly finance the operation of the State Water Holding Polish Waters, which is the river administrator. The funds collected from fees for the reduction in natural retention will not be used to create local green infrastructure systems; they will be used to finance regional activities, such as river maintenance, reservoir retention construction, polders, and other water management tasks, entrusted to Polish Waters.
Author Contributions
Conceptualization, I.G., A.G. and K.M.; methodology, I.G., A.G. and K.M.; investigation, I.G. and K.M.; data curation, K.M.; writing, I.G., A.G. and K.M.; visualization, K.M.; funding acquisition, I.G., A.G. and K.M. All authors have read and agreed to the published version of the manuscript.
Funding
This research was funded by the Polish National Agency for Academic Exchange within the framework of the grant: E-mobility and sustainable materials and technologies EMMAT (grant number: PPI/APM/2018/1/00027/U/001).
Institutional Review Board Statement
Not applicable.
Informed Consent Statement
Not applicable.
Data Availability Statement
The source topographic data are collected and made available by the Head Office of Geodesy and Cartography. Online access: https://www.gov.pl/web/gugik/dane-pzgik4 (accessed on 24 November 2021).
Conflicts of Interest
The authors declare no conflict of interest.
References
- Todeschini, S. Hydrologic and Environmental Impacts of Imperviousness in an Industrial Catchment of Northern Italy. J. Hydrol. Eng. 2016, 21, 05016013. [Google Scholar] [CrossRef]
- Gorgoglione, A.; Gregorio, J.; Ríos, A.; Alonso, J.; Chreties, C.; Fossati, M. Influence of Land Use/Land Cover on Surface-Water Quality of Santa Lucía River, Uruguay. Sustainability 2020, 12, 4692. [Google Scholar] [CrossRef]
- McGrane, S.J. Impacts of urbanisation on hydrological and water quality dynamics, and urban water management: A review. Hydrol. Sci. J. 2016, 61, 2295–2311. [Google Scholar] [CrossRef]
- Sriwongsitanon, N.; Taesombat, W. Effects of land cover on runoff coefficient. J. Hydrol. 2011, 410, 226–238. [Google Scholar] [CrossRef]
- Hoang, L.; Fenner, R.A. System interactions of stormwater management using sustainable urban drainage systems and green infrastructure. Urban Water J. 2016, 13, 739–758. [Google Scholar] [CrossRef] [Green Version]
- Lee, H.; Lau, S.-L.; Kayhanian, M.; Stenstrom, M.K. Seasonal first flush phenomenon of urban stormwater discharges. Water Res. 2004, 38, 4153–4163. [Google Scholar] [CrossRef]
- Gorgoglione, A.; Castro, A.; Iacobellis, V.; Gioia, A. A Comparison of Linear and Non-Linear Machine Learning Techniques (PCA and SOM) for Characterizing Urban Nutrient Runoff. Sustainability 2021, 13, 2054. [Google Scholar] [CrossRef]
- Al-Zahrani, M.A. Assessing the impacts of rainfall intensity and urbanization on storm runoff in an arid catchment. Arab. J. Geosci. 2018, 11, 208. [Google Scholar] [CrossRef]
- Walsh, C.J.; Fletcher, T.D.; Burns, M.J. Urban stormwater runoff: A new class of environmental flow problem. PLoS ONE 2012, 7, e45814. [Google Scholar] [CrossRef] [PubMed] [Green Version]
- Erena, S.H.; Worku, H. Dynamics of land use land cover and resulting surface runoff management for environmental flood hazard mitigation: The case of Dire Daw city, Ethiopia. J. Hydrol. Reg. Stud. 2019, 22, 100598. [Google Scholar] [CrossRef]
- Ohana-Levi, N.; Givati, A.; Alfasi, N.; Peeters, A.; Karnieli, A. Predicting the effects of urbanization on runoff after frequent rainfall events. J. Land Use Sci. 2018, 13, 81–101. [Google Scholar] [CrossRef]
- Suriya, S.; Mudgal, B.V. Impact of urbanization on flooding: The Thirusoolam sub watershed—A case study. J. Hydrol. 2012, 412–413, 210–219. [Google Scholar] [CrossRef]
- Li, Q.; Wang, F.; Yu, Y.; Huang, Z.; Li, M.; Guan, Y. Comprehensive performance evaluation of LID practices for the sponge city construction: A case study in Guangxi, China. J. Environ. Manag. 2019, 231, 10–20. [Google Scholar] [CrossRef]
- Schoener, G. Urban Runoff in the U.S. Southwest: Importance of Impervious Surfaces for Small-Storm Hydrology. J. Hydrol. Eng. 2018, 23, 05017033. [Google Scholar] [CrossRef]
- Liu, Y.; Engel, B.A.; Flanagan, D.C.; Gitau, M.W.; McMillan, S.K.; Chaubey, I.; Singh, S. Modeling framework for representing long-term effectiveness of best management practices in addressing hydrology and water quality problems: Framework development and demonstration using a Bayesian method. J. Hydrol. 2018, 560, 530–545. [Google Scholar] [CrossRef]
- Yao, L.; Chen, L.; Wei, W. Exploring the Linkage between Urban Flood Risk and Spatial Patterns in Small Urbanized Catchments of Beijing, China. Int. J. Environ. Res. Public Health 2017, 14, 239. [Google Scholar] [CrossRef] [Green Version]
- Qiao, X.J.; Liu, L.; Kristoffersson, A.; Randrup, T.B. Governance factors of sustainable stormwater management: A study of case cities in China and Sweden. J. Environ. Manag. 2019, 248. [Google Scholar] [CrossRef]
- Chang, N.-B.; Lu, J.-W.; Chui, T.F.M.; Hartshorn, N. Global policy analysis of low impact development for stormwater management in urban regions. Land Use Policy 2018, 70, 368–383. [Google Scholar] [CrossRef]
- Trinh, D.H.; Chui, T.F.M. Assessing the hydrologic restoration of an urbanized area via an integrated distributed hydrological model. Hydrol. Earth Syst. Sci. 2013, 17, 4789–4801. [Google Scholar] [CrossRef] [Green Version]
- Nguyen, T.T.; Ngo, H.H.; Guo, W.; Wang, X.C.; Ren, N.; Li, G.; Ding, J.; Liang, H. Implementation of a specific urban water management—Sponge City. Sci. Total Environ. 2019, 652. [Google Scholar] [CrossRef]
- Zhang, K.; Chui, T.F.M. A comprehensive review of spatial allocation of LID-BMP-GI practices: Strategies and optimization tools. Sci. Total Environ. 2018, 621, 915–929. [Google Scholar] [CrossRef]
- Wang, M.; Sweetapple, C.; Fu, G.; Farmani, R.; Butler, D. A framework to support decision making in the selection of sustainable drainage system design alternatives. J. Environ. Manag. 2017, 201, 145–152. [Google Scholar] [CrossRef]
- Butler, D.; Farmani, R.; Fu, G.; Ward, S.; Diao, K.; Astaraie-Imani, M. A New Approach to Urban Water Management: Safe and Sure. Procedia Eng. 2014, 89, 347–354. [Google Scholar] [CrossRef] [Green Version]
- Liu, L.; Jensen, M.B. Green infrastructure for sustainable urban water management: Practices of five forerunner cities. Cities 2018, 74, 126–133. [Google Scholar] [CrossRef]
- Ashley, R.; Lundy, L.; Ward, S.; Shaffer, P.; Walker, L.; Morgan, C.; Saul, A.; Wong, T.; Moore, S. Water-sensitive urban design: Opportunities for the UK. Proc. Inst. Civ. Eng. Munic. Eng. 2013, 166, 65–76. [Google Scholar] [CrossRef]
- Hamel, P.; Daly, E.; Fletcher, T.D. Source-control stormwater management for mitigating the impacts of urbanisation on baseflow: A review. J. Hydrol. 2013, 485, 201–211. [Google Scholar] [CrossRef]
- Tedoldi, D.; Chebbo, G.; Pierlot, D.; Kovacs, Y.; Gromaire, M.C. Impact of runoff infiltration on contaminant accumulation and transport in the soil/filter media of Sustainable Urban Drainage Systems: A literature review. Sci. Total Environ. 2016, 569–570, 904–926. [Google Scholar] [CrossRef] [PubMed]
- Shah, R.V. Decentralized water treatment—citizens tracking results and impact. Water Pract. Technol. 2015, 10, 438–444. [Google Scholar] [CrossRef]
- Arora, A.S.; Reddy, A.S. Conceptualizing a decentralized stormwater treatment system for an urbanized city with improper stormwater drainage facilities. Int. J. Environ. Sci. Technol. 2015, 12, 2891–2900. [Google Scholar] [CrossRef] [Green Version]
- Cheng, B.; Li, H.; Yue, S.; Huang, K. A conceptual decision-making for the ecological base flow of rivers considering the economic value of ecosystem services of rivers in water shortage area of Northwest China. J. Hydrol. 2019, 578, 124126. [Google Scholar] [CrossRef]
- Hsu, N.S.; Chiang, C.H.; Cheng, W.M.; Wei, C.C. Study on the Trade-Off between Ecological Base Flow and Optimized Water Supply. Water Resour. Manag. 2012, 26, 3095–3112. [Google Scholar] [CrossRef]
- Davies, B.R.; Biggs, J.; Williams, P.J.; Lee, J.T.; Thompson, S. A comparison of the catchment sizes of rivers, streams, ponds, ditches and lakes: Implications for protecting aquatic biodiversity in an agricultural landscape. Hydrobiologia 2008, 597, 7–17. [Google Scholar] [CrossRef]
- Nakano, S.; Yahara, T.; Nakashizuka, T. (Eds.) Aquatic Biodiversity Conservation and Ecosystem Services; Ecological Research Monographs; Springer: Singapore, 2016; ISBN 978-981-10-0778-1. [Google Scholar]
- Li, Y.; Xue, F.; Jing, R.; Wang, Y.; Wang, J. Study on Water-City Pattern strategies of ShenShan Special Cooperation Zone, China with Sponge City Construction at the Watershed Scale. Landsc. Archit. Front. 2019, 7, 104–113. [Google Scholar] [CrossRef]
- Czemiel Berndtsson, J. Green roof performance towards management of runoff water quantity and quality: A review. Ecol. Eng. 2010, 36, 351–360. [Google Scholar] [CrossRef]
- Vijayaraghavan, K.; Joshi, U.M.; Balasubramanian, R. A field study to evaluate runoff quality from green roofs. Water Res. 2012, 46, 1337–1345. [Google Scholar] [CrossRef] [PubMed]
- Krebs, G.; Kuoppamäki, K.; Kokkonen, T.; Koivusalo, H. Simulation of green roof test bed runoff. Hydrol. Process. 2016, 30, 250–262. [Google Scholar] [CrossRef]
- Li, F.; Liu, Y.; Engel, B.A.; Chen, J.; Sun, H. Green infrastructure practices simulation of the impacts of land use on surface runoff: Case study in Ecorse River watershed, Michigan. J. Environ. Manag. 2019, 233, 603–611. [Google Scholar] [CrossRef]
- Bortolini, L.; Zanin, G. Reprint of: Hydrological behaviour of rain gardens and plant suitability: A study in the Veneto plain (north-eastern Italy) conditions. Urban For. Urban Green. 2019, 37, 74–86. [Google Scholar] [CrossRef]
- Scholz, M.; Grabowiecki, P. Review of permeable pavement systems. Build. Environ. 2007, 42, 3830–3836. [Google Scholar] [CrossRef]
- Obropta, C.C.; Asce, M.; Del Monaco, N.; Asce, A.M. Reducing Directly Connected Impervious Areas with Green Stormwater Infrastructure. J. Sustain. Water Built Environ. 2017, 4, 05017004. [Google Scholar] [CrossRef] [Green Version]
- Parikh, P.; Taylor, M.A.; Hoagland, T.; Thurston, H.; Shuster, W. Application of market mechanisms and incentives to reduce stormwater runoff. An integrated hydrologic, economic and legal approach. Environ. Sci. Policy 2005, 8, 133–144. [Google Scholar] [CrossRef]
- Buurman, J.J.G.; Lee, T.K.; Iftekhar, M.S.; Yu, S.M. Strategies to promote the adoption of sustainable drainage by private developers: A case study from Singapore. Urban Water J. 2020, 18, 61–67. [Google Scholar] [CrossRef]
- Cousins, J.J. Of floods and droughts: The uneven politics of stormwater in Los Angeles. Polit. Geogr. 2017, 60, 34–46. [Google Scholar] [CrossRef] [Green Version]
- Qiao, X.-J.; Kristoffersson, A.; Randrup, T.B. Challenges to implementing urban sustainable stormwater management from a governance perspective: A literature review. J. Clean. Prod. 2018, 196, 943–952. [Google Scholar] [CrossRef]
- US EPA Managing Wet Weather with Green Infrastructure—Incentive Mechanisms: Municipal Handbook; Incentive Mechanisms; United States Environmental Protection Agency: Washington, DC, USA, 2009.
- Thurston, H.W.; Taylor, M.A.; Shuster, W.D.; Roy, A.H.; Morrison, M.A. Using a reverse auction to promote household level stormwater control. Environ. Sci. Policy 2010, 13, 405–414. [Google Scholar] [CrossRef]
- Tayouga, S.J.; Gagné, S.A. The socio-ecological factors that influence the adoption of green infrastructure. Sustainability 2016, 8, 1277. [Google Scholar] [CrossRef] [Green Version]
- Lieberherr, E.; Green, O. Green Infrastructure through Citizen Stormwater Management: Policy Instruments, Participation and Engagement. Sustainability 2018, 10, 2099. [Google Scholar] [CrossRef] [Green Version]
- Brears, R.C. Blue and Green Cities. The Role of Blue-Green Infrastructure in Managing Urban Water Resources; Palgrave Macmillan: London, UK, 2018; ISBN 9781137592576. [Google Scholar]
- Clements, J.; Juliana, A. The Green Edge: How Commercial Property Investment in Green Infrastructure Creates Value Author; Natural Resources Defense Council: New York, NY, USA, 2013. [Google Scholar]
- Lu, Z.; Noonan, D.; Crittenden, J.; Jeong, H.; Wang, D.; Byers, B. Use of Impact Fees To Incentivize Low-Impact Development and Promote Compact Growth. Environ. Sci. Technol. 2013, 47, 10744–10752. [Google Scholar] [CrossRef] [Green Version]
- Gearheart, G. A Review of Low Impact Development Policies: Removing Institutional Berriers to Adoption; Low Impact Development Center: Beltsville, MD, USA, 2007. [Google Scholar]
- Liberalesso, T.; Oliveira Cruz, C.; Matos Silva, C.; Manso, M. Green infrastructure and public policies: An international review of green roofs and green walls incentives. Land Use Policy 2020, 96, 104693. [Google Scholar] [CrossRef]
- Campbell, W.; Bradshaw, J. Western Kentucky University Stormwater Utility Survey 2021; SEAS Faculty Publications: Bowling Green, KY, USA, 2021. [Google Scholar]
- Cook, S.; van Roon, M.; Ehrenfried, L.; LaGro, J.; Yu, Q. WSUD “Best in Class”—Case Studies From Australia, New Zealand, United States, Europe, and Asia. In Approaches to Water Sensitive Urban Design; Elsevier: Amsterdam, The Netherlands, 2019; pp. 561–585. ISBN 9780128128435. [Google Scholar]
- Dierkes, C.; Lucke, T.; Helmreich, B. General Technical Approvals for Decentralised Sustainable Urban Drainage Systems (SUDS)—The Current Situation in Germany. Sustainability 2015, 7, 3031–3051. [Google Scholar] [CrossRef] [Green Version]
- Tasca, F.A.; Assuncaõ, L.B.; Finotti, A.R. International experiences in stormwater fee. Water Sci. Technol. 2018, 2017, 287–299. [Google Scholar] [CrossRef] [PubMed]
- Boguniewicz-Zabłocka, J.; Capodaglio, A.G. Analysis of Alternatives for Sustainable Stormwater Management in Small Developments of Polish Urban Catchments. Sustainability 2020, 12, 10189. [Google Scholar] [CrossRef]
- Godyń, I.; Grela, A.; Stajno, D.; Tokarska, P. Sustainable Rainwater Management Concept in a Housing Estate with a Financial Feasibility Assessment and Motivational Rainwater Fee System Efficiency Analysis. Water 2020, 12, 151. [Google Scholar] [CrossRef] [Green Version]
- Musz-Pomorska, A.; Widomski, M.K.; Gołebiowska, J. Financial Sustainability of Selected Rain Water Harvesting Systems for Single-Family House under Conditions of Eastern Poland. Sustainability 2020, 12, 4853. [Google Scholar] [CrossRef]
- Kordana, S.; Słyś, D. An analysis of important issues impacting the development of stormwater management systems in Poland. Sci. Total Environ. 2020, 727, 138711. [Google Scholar] [CrossRef]
- Opania, S.; Gama Marques, P. Analysis of Water Retention Possibilities Based on Programs, Strategies and Selected Projects in Poland. IOP Conf. Ser. Mater. Sci. Eng. 2021, 1203, 032103. [Google Scholar] [CrossRef]
- Kertesz, R.; Green, O.O.; Shuster, W.D. Modeling the hydrologic and economic efficacy of stormwater utility credit programs for US single family residences. Water Sci. Technol. 2014, 70, 1746. [Google Scholar] [CrossRef]
- Abebe, Y.; Adey, B.T.; Tesfamariam, S. Sustainable funding strategies for stormwater infrastructure management: A system dynamics model. Sustain. Cities Soc. 2021, 64, 102485. [Google Scholar] [CrossRef]
- Tasca, F.A.; Finotti, A.R.; Goerl, R.F. A stormwater user fee model for operations and maintenance in small cities. Water Sci. Technol. 2019, 79, 278–290. [Google Scholar] [CrossRef]
- Brown, H.L.; Bos, D.G.; Walsh, C.J.; Fletcher, T.D.; RossRakesh, S. More than money: How multiple factors influence householder participation in at-source stormwater management. J. Environ. Plan. Manag. 2016, 59, 79–97. [Google Scholar] [CrossRef]
- Dhakal, K.P.; Chevalier, L.R. Managing urban stormwater for urban sustainability: Barriers and policy solutions for green infrastructure application. J. Environ. Manag. 2017, 203, 171–181. [Google Scholar] [CrossRef] [PubMed]
- Valderrama, A.; Levine, L.; Yeh, S.; Bloomgarden, E. Financing Stormwater Retrofits in Philadelphia and Beyond; NRDC: New York, NY, USA, 2012; 34p. [Google Scholar]
- Gill, S.E.; Handley, J.F.; Ennos, A.R.; Pauleit, S. Adapting cities for climate change: The role of the green infrastructure. Built Environ. 2007, 33, 115–133. [Google Scholar] [CrossRef] [Green Version]
- ENTRIX Inc. Portland’s Green Infrastructure: Quantifying the Health, Energy, and Community Livability Benefits; City of Portland Bureau of Environmental Services: Portland, OR, USA, 2010. [Google Scholar]
- Green Values Strategy Guide Linking Green Infrastructure Benefits to Community Priorities; Center for Neighborhood Technology (CNT): Chicago, IL, USA, 2020.
- Majekodunmi, M.; Emmanuel, R.; Jafry, T. A spatial exploration of deprivation and green infrastructure ecosystem services within Glasgow city. Urban For. Urban Green. 2020, 52, 126698. [Google Scholar] [CrossRef]
- Millennium Ecosystem Assessment. Ecosystems and Human Well-Being: Synthesis; Island Press: Washngton, DC, USA, 2005; ISBN 9781597260404. [Google Scholar]
- Hamann, F.; Blecken, G.-T.; Ashley, R.M.; Viklander, M. Valuing the Multiple Benefits of Blue-Green Infrastructure for a Swedish Case Study: Contrasting the Economic Assessment Tools B£ST and TEEB. J. Sustain. Water Built Environ. 2020, 6, 05020003. [Google Scholar] [CrossRef]
- Romero-Calcerrada, R.; Cabello, J.; Pacheco-Romero, M.; Monchet, K.T.; Mirici, M.E. The Ecosystem Services and Green Infrastructure: A Systematic Review and the Gap of Economic Valuation. Sustainability 2022, 14, 517. [Google Scholar]
- Morri, E.; Santolini, R.; Morri, E.; Santolini, R. Ecosystem Services Valuation for the Sustainable Land Use Management by Nature-Based Solution (NbS) in the Common Agricultural Policy Actions: A Case Study on the Foglia River Basin (Marche Region, Italy). Land 2021, 11, 57. [Google Scholar] [CrossRef]
- Nguyen, C.N.; Muttil, N.; Tariq, M.A.U.R.; Ng, A.W.M. Quantifying the Benefits and Ecosystem Services Provided by Green Roofs—A Review. Water 2022, 14, 68. [Google Scholar] [CrossRef]
- Wild, T.C.; Henneberry, J.; Gill, L. Comprehending the multiple ‘values’ of green infrastructure—Valuing nature-based solutions for urban water management from multiple perspectives. Environ. Res. 2017, 158, 179–187. [Google Scholar] [CrossRef] [Green Version]
- Kim, J.E.; Teh, E.X.; Humphrey, D.; Hofman, J. Optimal storage sizing for indoor arena rainwater harvesting: Hydraulic simulation and economic assessment. J. Environ. Manag. 2021, 280, 111847. [Google Scholar] [CrossRef]
- de Sá Silva, A.C.R.; Bimbato, A.M.; Balestieri, J.A.P.; Vilanova, M.R.N. Exploring environmental, economic and social aspects of rainwater harvesting systems: A review. Sustain. Cities Soc. 2022, 76, 103475. [Google Scholar] [CrossRef]
- Farreny, R.; Gabarrell, X.; Rieradevall, J. Cost-efficiency of rainwater harvesting strategies in dense Mediterranean neighbourhoods. Resour. Conserv. Recycl. 2011, 55, 686–694. [Google Scholar] [CrossRef]
- Morales-Pinzón, T.; Lurueña, R.; Rieradevall, J.; Gasol, C.M.; Gabarrell, X. Financial feasibility and environmental analysis of potential rainwater harvesting systems: A case study in Spain. Resour. Conserv. Recycl. 2012, 69, 130–140. [Google Scholar] [CrossRef]
- Lani, N.H.M.; Syafiuddin, A.; Yusop, Z.; bin Mat Amin, M.Z. Performance of small and large scales rainwater harvesting systems in commercial buildings under different reliability and future water tariff scenarios. Sci. Total Environ. 2018, 636, 1171–1179. [Google Scholar] [CrossRef] [PubMed]
- Islam, M.M.; Afrin, S.; Tarek, M.H.; Rahman, M.M. Reliability and financial feasibility assessment of a community rainwater harvesting system considering precipitation variability due to climate change. J. Environ. Manag. 2021, 289, 112507. [Google Scholar] [CrossRef] [PubMed]
- Amos, C.C.; Rahman, A.; Gathenya, J.M. Economic Analysis and Feasibility of Rainwater Harvesting Systems in Urban and Peri-Urban Environments: A Review of the Global Situation with a Special Focus on Australia and Kenya. Water 2016, 8, 149. [Google Scholar] [CrossRef]
- Malinowski, P.A.; Schwarz, P.M.; Wu, J.S. Fee Credits as an Economic Incentive for Green Infrastructure Retrofits in Stormwater-Impaired Urban Watersheds. J. Sustain. Water Built Environ. 2020, 6, 04020015. [Google Scholar] [CrossRef]
- Valderrama, A.; Levine, L.; Bloomgarden, E.; Bayon, R.; Wachowicz, K.; Kaiser, C. Creating Clean Water Cash Flows Developing Private Markets for Green Stormwater Infrastructure in Philadelphia; Natural Resources Defense Council: New York, NY, USA, 2013. [Google Scholar]
- Hirabayashi, Y.; Mahendran, R.; Koirala, S.; Konoshima, L.; Yamazaki, D.; Watanabe, S.; Kim, H.; Kanae, S. Global flood risk under climate change. Nat. Clim. Chang. 2013, 3, 816–821. [Google Scholar] [CrossRef]
- Wu, H.T.J.; Lau, W.K.M. Detecting climate signals in precipitation extremes from TRMM (1998–2013)—Increasing contrast between wet and dry extremes during the “global warming hiatus”. Geophys. Res. Lett. 2016, 43, 1340–1348. [Google Scholar] [CrossRef]
- Zhou, Q.; Leng, G.; Su, J.; Ren, Y. Comparison of urbanization and climate change impacts on urban flood volumes: Importance of urban planning and drainage adaptation. Sci. Total Environ. 2019, 658, 24–33. [Google Scholar] [CrossRef]
- Debbage, N.; Shepherd, J.M. The Influence of Urban Development Patterns on Streamflow Characteristics in the Charlanta Megaregion. Water Resour. Res. 2018, 54, 3728–3747. [Google Scholar] [CrossRef]
- Dane PZGiK—Główny Urząd Geodezji i Kartografii—Portal Gov.pl. Available online: https://www.gov.pl/web/gugik/dane-pzgik4 (accessed on 24 November 2021).
- Jacobson, C.R. Identification and quantification of the hydrological impacts of imperviousness in urban catchments: A review. J. Environ. Manag. 2011, 92, 1438–1448. [Google Scholar] [CrossRef]
- Miguez, M.G.; Mascarenhas, F.C.B.; Magalhães, L.P.C. Multifunctional landscapes for urban flood control in developing countries. Int. J. Sustain. Dev. Plan. 2007, 2, 153–166. [Google Scholar] [CrossRef] [Green Version]
- Wolf, L.; Klinger, J.; Hoetzl, H.; Mohrlok, U. Quantifying Mass Fluxes from Urban Drainage Systems to the Urban Soil-Aquifer System (11 pp). J. Soils Sediments 2007, 7, 85–95. [Google Scholar] [CrossRef]
- Dhakal, N.; Fang, X.; Cleveland, T.G.; Thompson, D.B.; Asquith, W.H.; Marzen, L.J. Estimation of Volumetric Runoff Coefficients for Texas Watersheds Using Land-Use and Rainfall-Runoff Data. J. Irrig. Drain. Eng. 2012, 138, 43–54. [Google Scholar] [CrossRef] [Green Version]
- Radecki-Pawlik, A.; Wałęga, A.; Wojkowski, J.; Pijanowski, J. Runoff formation in terms of changes in land use—Mściwojów water reservoir area. J. Water Land Dev. 2014, 23, 3–10. [Google Scholar] [CrossRef]
- Li, C.; Peng, C.; Chiang, P.C.; Cai, Y.; Wang, X.; Yang, Z. Mechanisms and applications of green infrastructure practices for stormwater control: A review. J. Hydrol. 2019, 568, 626–637. [Google Scholar] [CrossRef]
- Yu, Y.; Xu, H.; Wang, X.; Wen, J.; Du, S.; Zhang, M.; Ke, Q. Residents’ Willingness to Participate in Green Infrastructure: Spatial Differences and Influence Factors in Shanghai, China. Sustainability 2019, 11, 5396. [Google Scholar] [CrossRef] [Green Version]
- Plan Adaptacji Miasta Krakowa do zmian klimatu do roku 2030—Biuletyn Informacji Publicznej Miasta Krakowa—BIP MK. Available online: https://www.bip.krakow.pl/?dok_id=114317 (accessed on 24 November 2021).
- Rosiek, K. Opłaty od Powierzchni Uszczelnionej Jako Instrument Zrównoważonego Zarządzania Wodami Opadowymi i Roztopowymi [Impervious Surfaces Fees as a Tool of Sustainable Rainwater Management]. In Prace Naukowe Uniwersytetu Ekonomicznego we Wrocławiu [Research Papers of Wrocław University of Economics]; Wydawnictwo Uniwersytetu Ekonomicznego we Wrocławiu: Wrocław, Poland, 2016; pp. 270–281. [Google Scholar]
- Sinha, S.K.; Ridgway, J.W.; Edstrom, J.E.; Andersen, J.; Mulvaney, P.; Quigley, M.; Rothstein, E. A Business Model Framework for Market-Based Private Financing of Green Infrastructure; Environmental Consulting & Technology, Inc.: Gainesville, FL, USA, 2014. [Google Scholar]
- Godyń, I. Opłaty za wody opadowe a finansowanie kanalizacji deszczowej i zielonej infrastruktury. In Współczesne Problemy Gospodarki Wodnej w Kontekście Zagospodarowania Przestrzennego; Walczykiewicz, T., Ed.; IMGW-PIB: Warszawa, Poland, 2020; pp. 101–110. ISBN 9788364979378. [Google Scholar]
- Zhao, J.Z.; Fonseca, C.; Zeerak, R. Stormwater Utility Fees and Credits: A Funding Strategy for Sustainability. Sustainability 2019, 11, 1913. [Google Scholar] [CrossRef] [Green Version]
- Evaluating Stormwater Infrastructure Funding and Financing; EPA’s Environmental Financial Advisory Board (EFAB): Washington, DC, USA, 2020. Available online: www.epa.gov/sites/production/files/2020-04/documents/efabevaluating_stormwater_infrastructure_funding_and_financing.pdf. (accessed on 24 November 2021).
- Ustawa z Dnia 20 Lipca 2017 r. Prawo Wodne [The Water Law Act of 20 July 2017], Dz.U.2017.1566.
- Rozporządzenie Rady Ministrów z Dnia 22 Grudnia 2017 r. w Sprawie Jednostkowych Stawek Opłat za Usługi Wodne [Executive Act of the Council of Ministers Regarding Unit Rates of Fees for Water Services], Dz.U.2021.736.
- NIK about Rain and Stormwater Management—Supreme Audit Office. Available online: https://www.nik.gov.pl/en/news/nik-about-rain-and-stormwater-management.html (accessed on 23 November 2021).
- Projekt Ustawy o Inwestycjach w Zakresie Przeciwdziałania Skutkom Suszy [Draft Act of 12 August 2020 on Investments in Counteracting the Effects of Drought]. Available online: https://legislacja.rcl.gov.pl/projekt/12337151 (accessed on 8 November 2021).
- Stec, A.; Zeleňáková, M. An Analysis of the Effectiveness of Two Rainwater Harvesting Systems Located in Central Eastern Europe. Water 2019, 11, 458. [Google Scholar] [CrossRef] [Green Version]
- Haghighatafshar, S.; Yamanee-Nolin, M.; Klinting, A.; Roldin, M.; Gustafsson, L.G.; Aspegren, H.; Jönsson, K. Hydroeconomic optimization of mesoscale blue-green stormwater systems at the city level. J. Hydrol. 2019, 578. [Google Scholar] [CrossRef]
- Gray, E.; Ozment, S.; Altamirano, J.C.; Feltran-Barbieri, R.; Morales, G. Green-Gray Assessment: How to Assess the Costs and Benefits of Green Infrastructure for Water Supply Systems; World Resources Institute: Washington, DC, USA, 2019. [Google Scholar]
- SEKOCENBUD Biuletyn cen Obiektów Budowlanych BCO cz. II 3 kw. 2021 (Price Bulletin of Buildings BCO Part II 3rd Q 2021). Available online: https://www.sekocenbud.pl (accessed on 23 November 2021).
- Underground Rainwater Tanks—For Every Ground Conditions. Available online: https://aquatechnika.com.pl/gb/rainwater-tanks/underground-rainwater-tanks (accessed on 23 November 2021).
- Podziemne Zbiorniki na Deszczówkę. Available online: https://www.domiwoda.pl/k10,podziemne-zbiorniki-na-deszczowke.html (accessed on 23 November 2021).
- Tariff—Wodociągi Miasta Krakowa. Available online: https://en.wodociagi.krakow.pl/tariff-and-price-lists.html (accessed on 23 November 2021).
- PN-EN 752: 2017 Drain and Sewer Systems outside Buildings—Sewer System Management; Polish Committee for Standardization: Warszawa, Poland, 2017.
- Bogdanowicz, E.; Stachy, J. Maximum rainfall in Poland-a design approach. In The Extremes of the Extraordinary Floods. Proceedings of an International Symposium on Extraordinary Floods, Reykjavík, Iceland, 17–19 July 2000; IAHS Publ. no 271; Snorrason, A., Finnsdóttir, H.P., Moss, M.E., Eds.; IAHS Publication: Wallingford, UK, 2002; pp. 15–18. [Google Scholar]
- Wihlborg, M.; Sörensen, J.; Alkan Olsson, J. Assessment of barriers and drivers for implementation of blue-green solutions in Swedish municipalities. J. Environ. Manag. 2019, 233, 706–718. [Google Scholar] [CrossRef] [PubMed]
- Gordon, B.L.; Quesnel, K.J.; Abs, R.; Ajami, N.K. A case-study based framework for assessing the multi-sector performance of green infrastructure. J. Environ. Manag. 2018, 223, 371–384. [Google Scholar] [CrossRef] [PubMed]
- Porse, E.C. Stormwater Governance and Future Cities. Water 2013, 5, 29–52. [Google Scholar] [CrossRef] [Green Version]
- Nickel, D.; Schoenfelder, W.; Medearis, D.; Dolowitz, D.P.; Keeley, M.; Shuster, W. German experience in managing stormwater with green infrastructure. J. Environ. Plan. Manag. 2014, 57, 403–423. [Google Scholar] [CrossRef]
- Geyler, S.; Bedtke, N.; Gawel, E. Sustainable Stormwater Management in Existing Settlements—Municipal Strategies and Current Governance Trends in Germany. Sustainability 2019, 11, 5510. [Google Scholar] [CrossRef] [Green Version]
Figure 1.
Location of the case study: the studied Sudół river catchment against the city of Krakow and the adjacent communes.
Figure 1.
Location of the case study: the studied Sudół river catchment against the city of Krakow and the adjacent communes.

Figure 2.
Aggregated percentage share of land development within the analyzed area of the Sudół river catchment.
Figure 2.
Aggregated percentage share of land development within the analyzed area of the Sudół river catchment.

Figure 3.
Summary of the basic land development topographic object classes within the studied Sudół river catchment.
Figure 3.
Summary of the basic land development topographic object classes within the studied Sudół river catchment.

Figure 4.
Methodological flowchart.

Figure 5.
Location of properties with an area of >3500 m2 and an area retention of >70%, excluding the criterion of access to the sewage system, within the area of the Sudół river catchment.
Figure 5.
Location of properties with an area of >3500 m2 and an area retention of >70%, excluding the criterion of access to the sewage system, within the area of the Sudół river catchment.

Figure 6.
Location of properties with an area of >600 m2 and an area retention of >50% within the area of the studied Sudół river catchment.
Figure 6.
Location of properties with an area of >600 m2 and an area retention of >50% within the area of the studied Sudół river catchment.

Figure 7.
Location of properties with an area of <600 m2 and an area retention of 20–50% within the area of the studied Sudół river catchment.
Figure 7.
Location of properties with an area of <600 m2 and an area retention of 20–50% within the area of the studied Sudół river catchment.

Figure 8.
An example of a residential estate of terraced houses on Pękowicka/Wiarusa St., not qualified for fee coverage.
Figure 8.
An example of a residential estate of terraced houses on Pękowicka/Wiarusa St., not qualified for fee coverage.

Figure 9.
Investment profitability (retention equipment volume at 0.1% of runoff) depending on the investment scale (impervious area).
Figure 9.
Investment profitability (retention equipment volume at 0.1% of runoff) depending on the investment scale (impervious area).

Figure 10.
Investment profitability (retention equipment volume at 10% of runoff) depending on the investment scale (impervious area).
Figure 10.
Investment profitability (retention equipment volume at 10% of runoff) depending on the investment scale (impervious area).

Figure 11.
Investment profitability (retention equipment volume at 3% of runoff) depending on the investment scale (impervious area).
Figure 11.
Investment profitability (retention equipment volume at 3% of runoff) depending on the investment scale (impervious area).

Figure 12.
Investment profitability (retention equipment volume at 3% runoff) at an increased fee rate (PLN 4.68/m2) and a 75% discount.
Figure 12.
Investment profitability (retention equipment volume at 3% runoff) at an increased fee rate (PLN 4.68/m2) and a 75% discount.


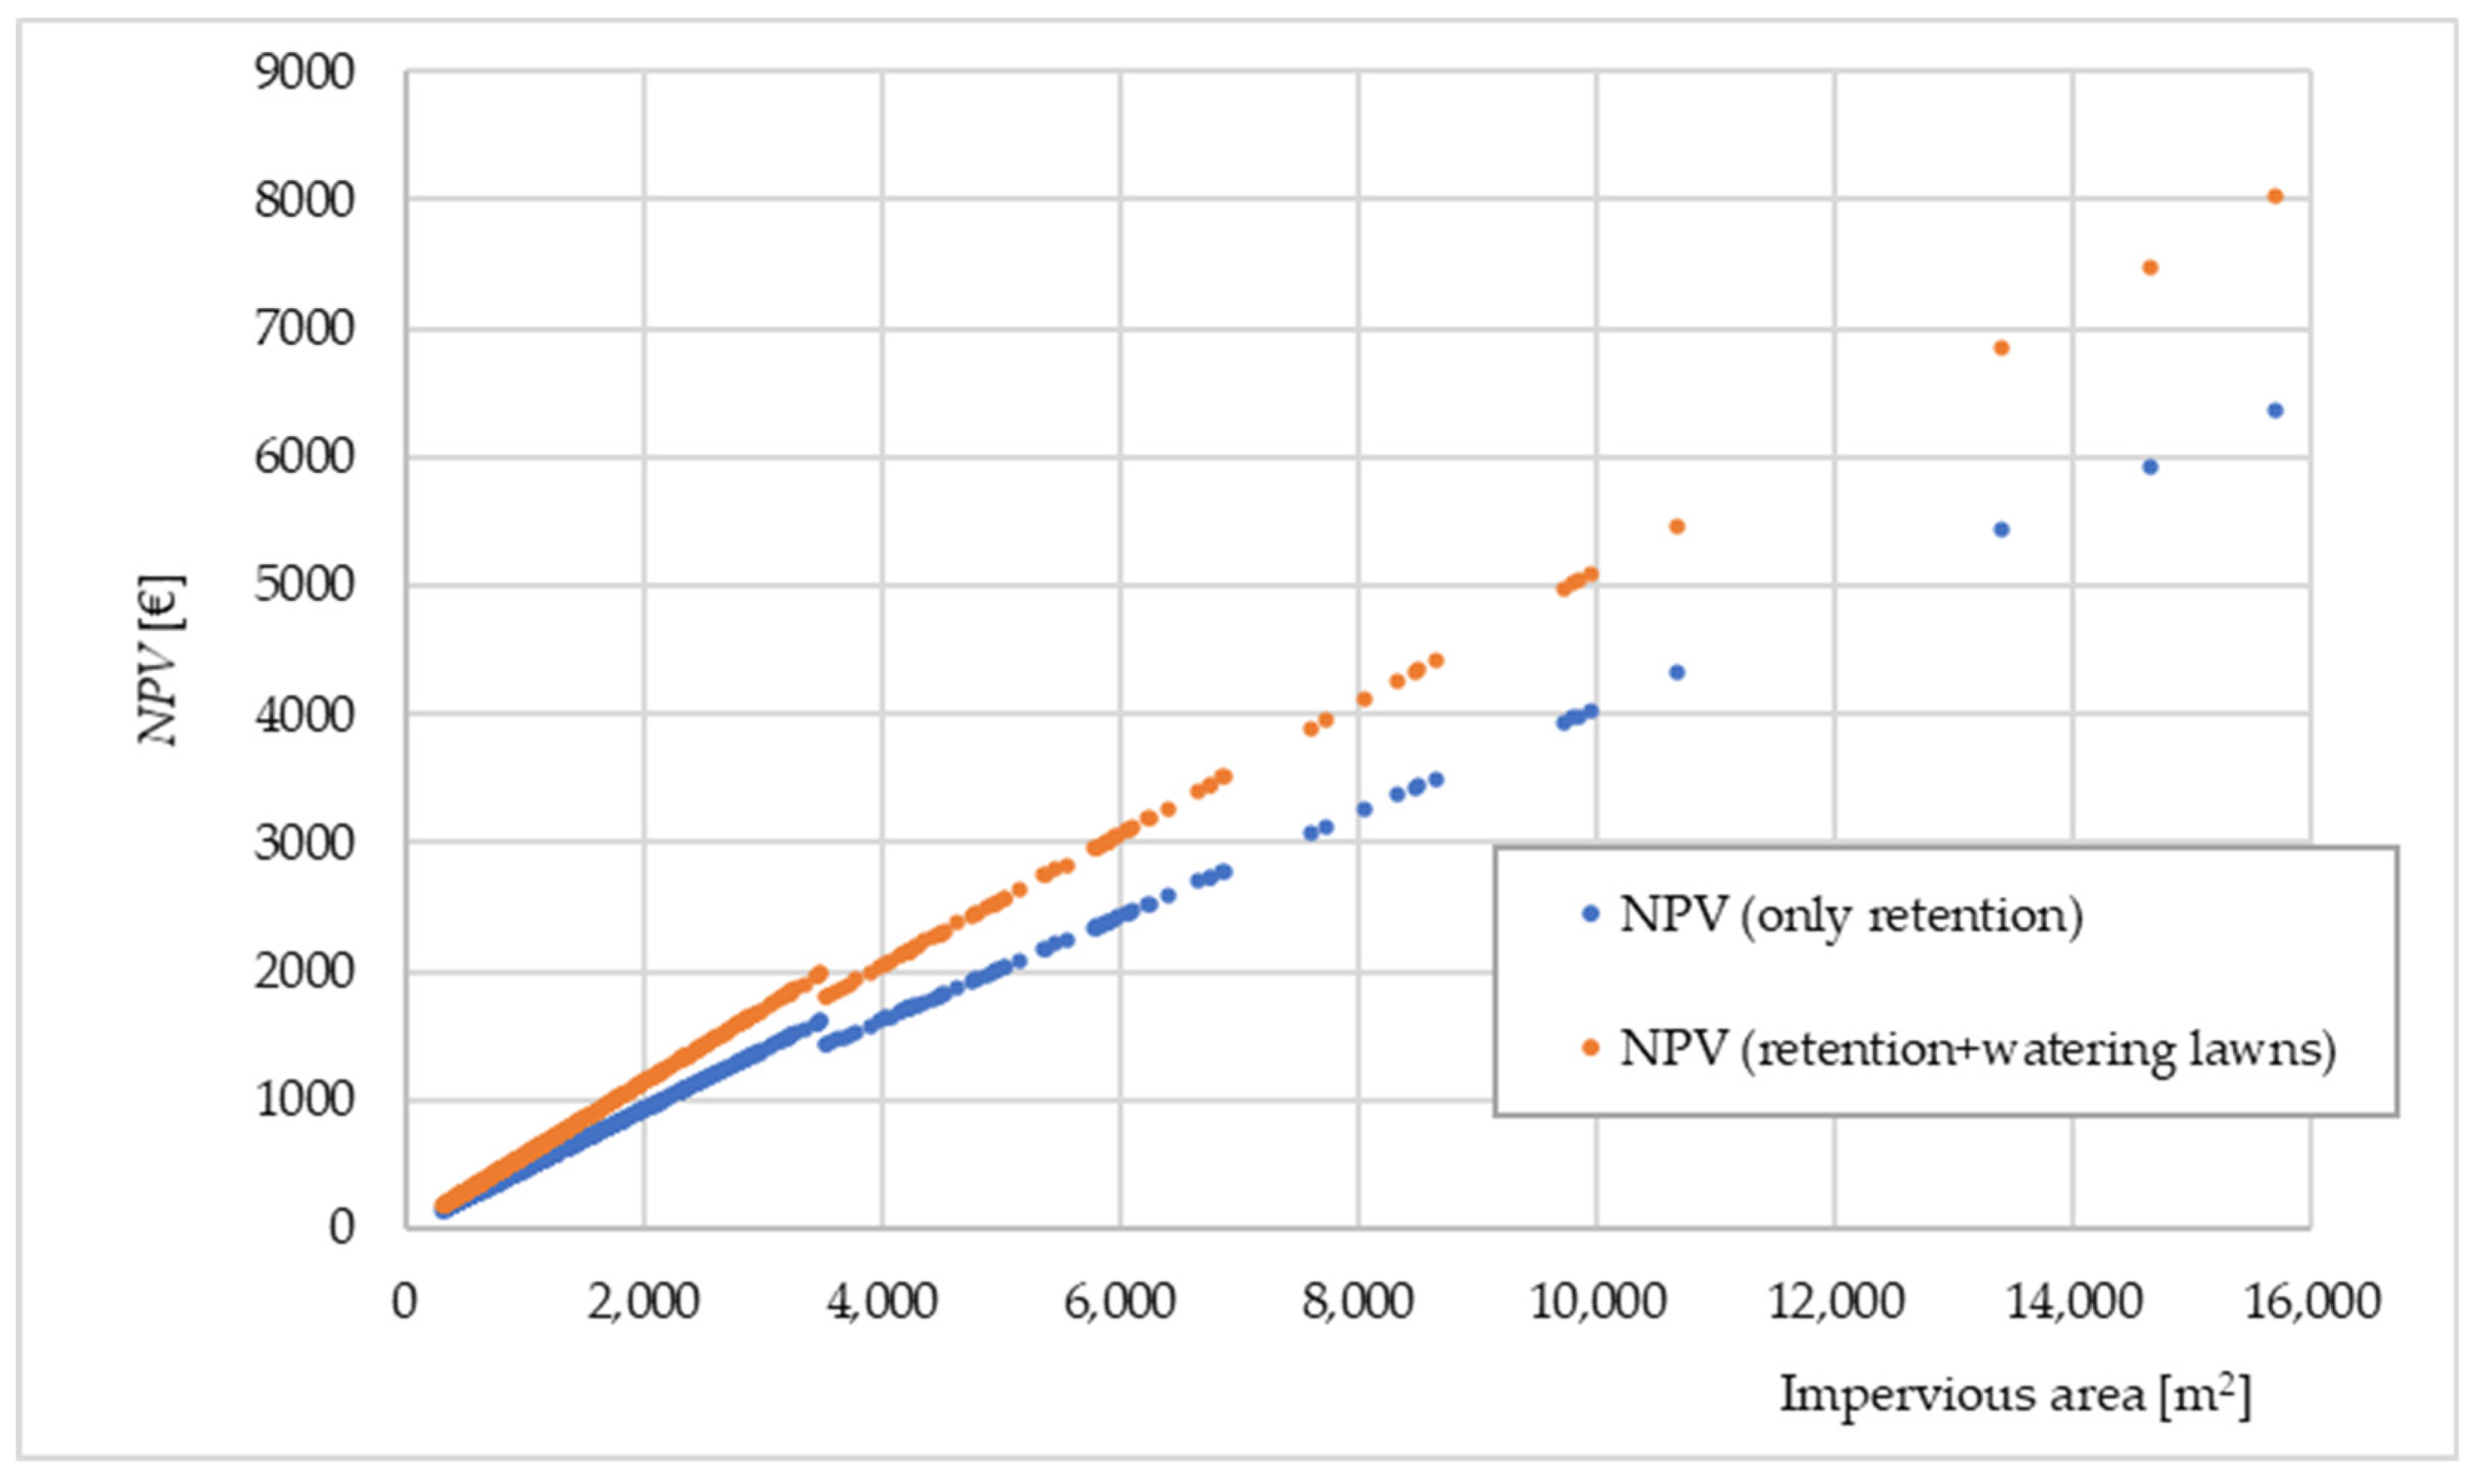
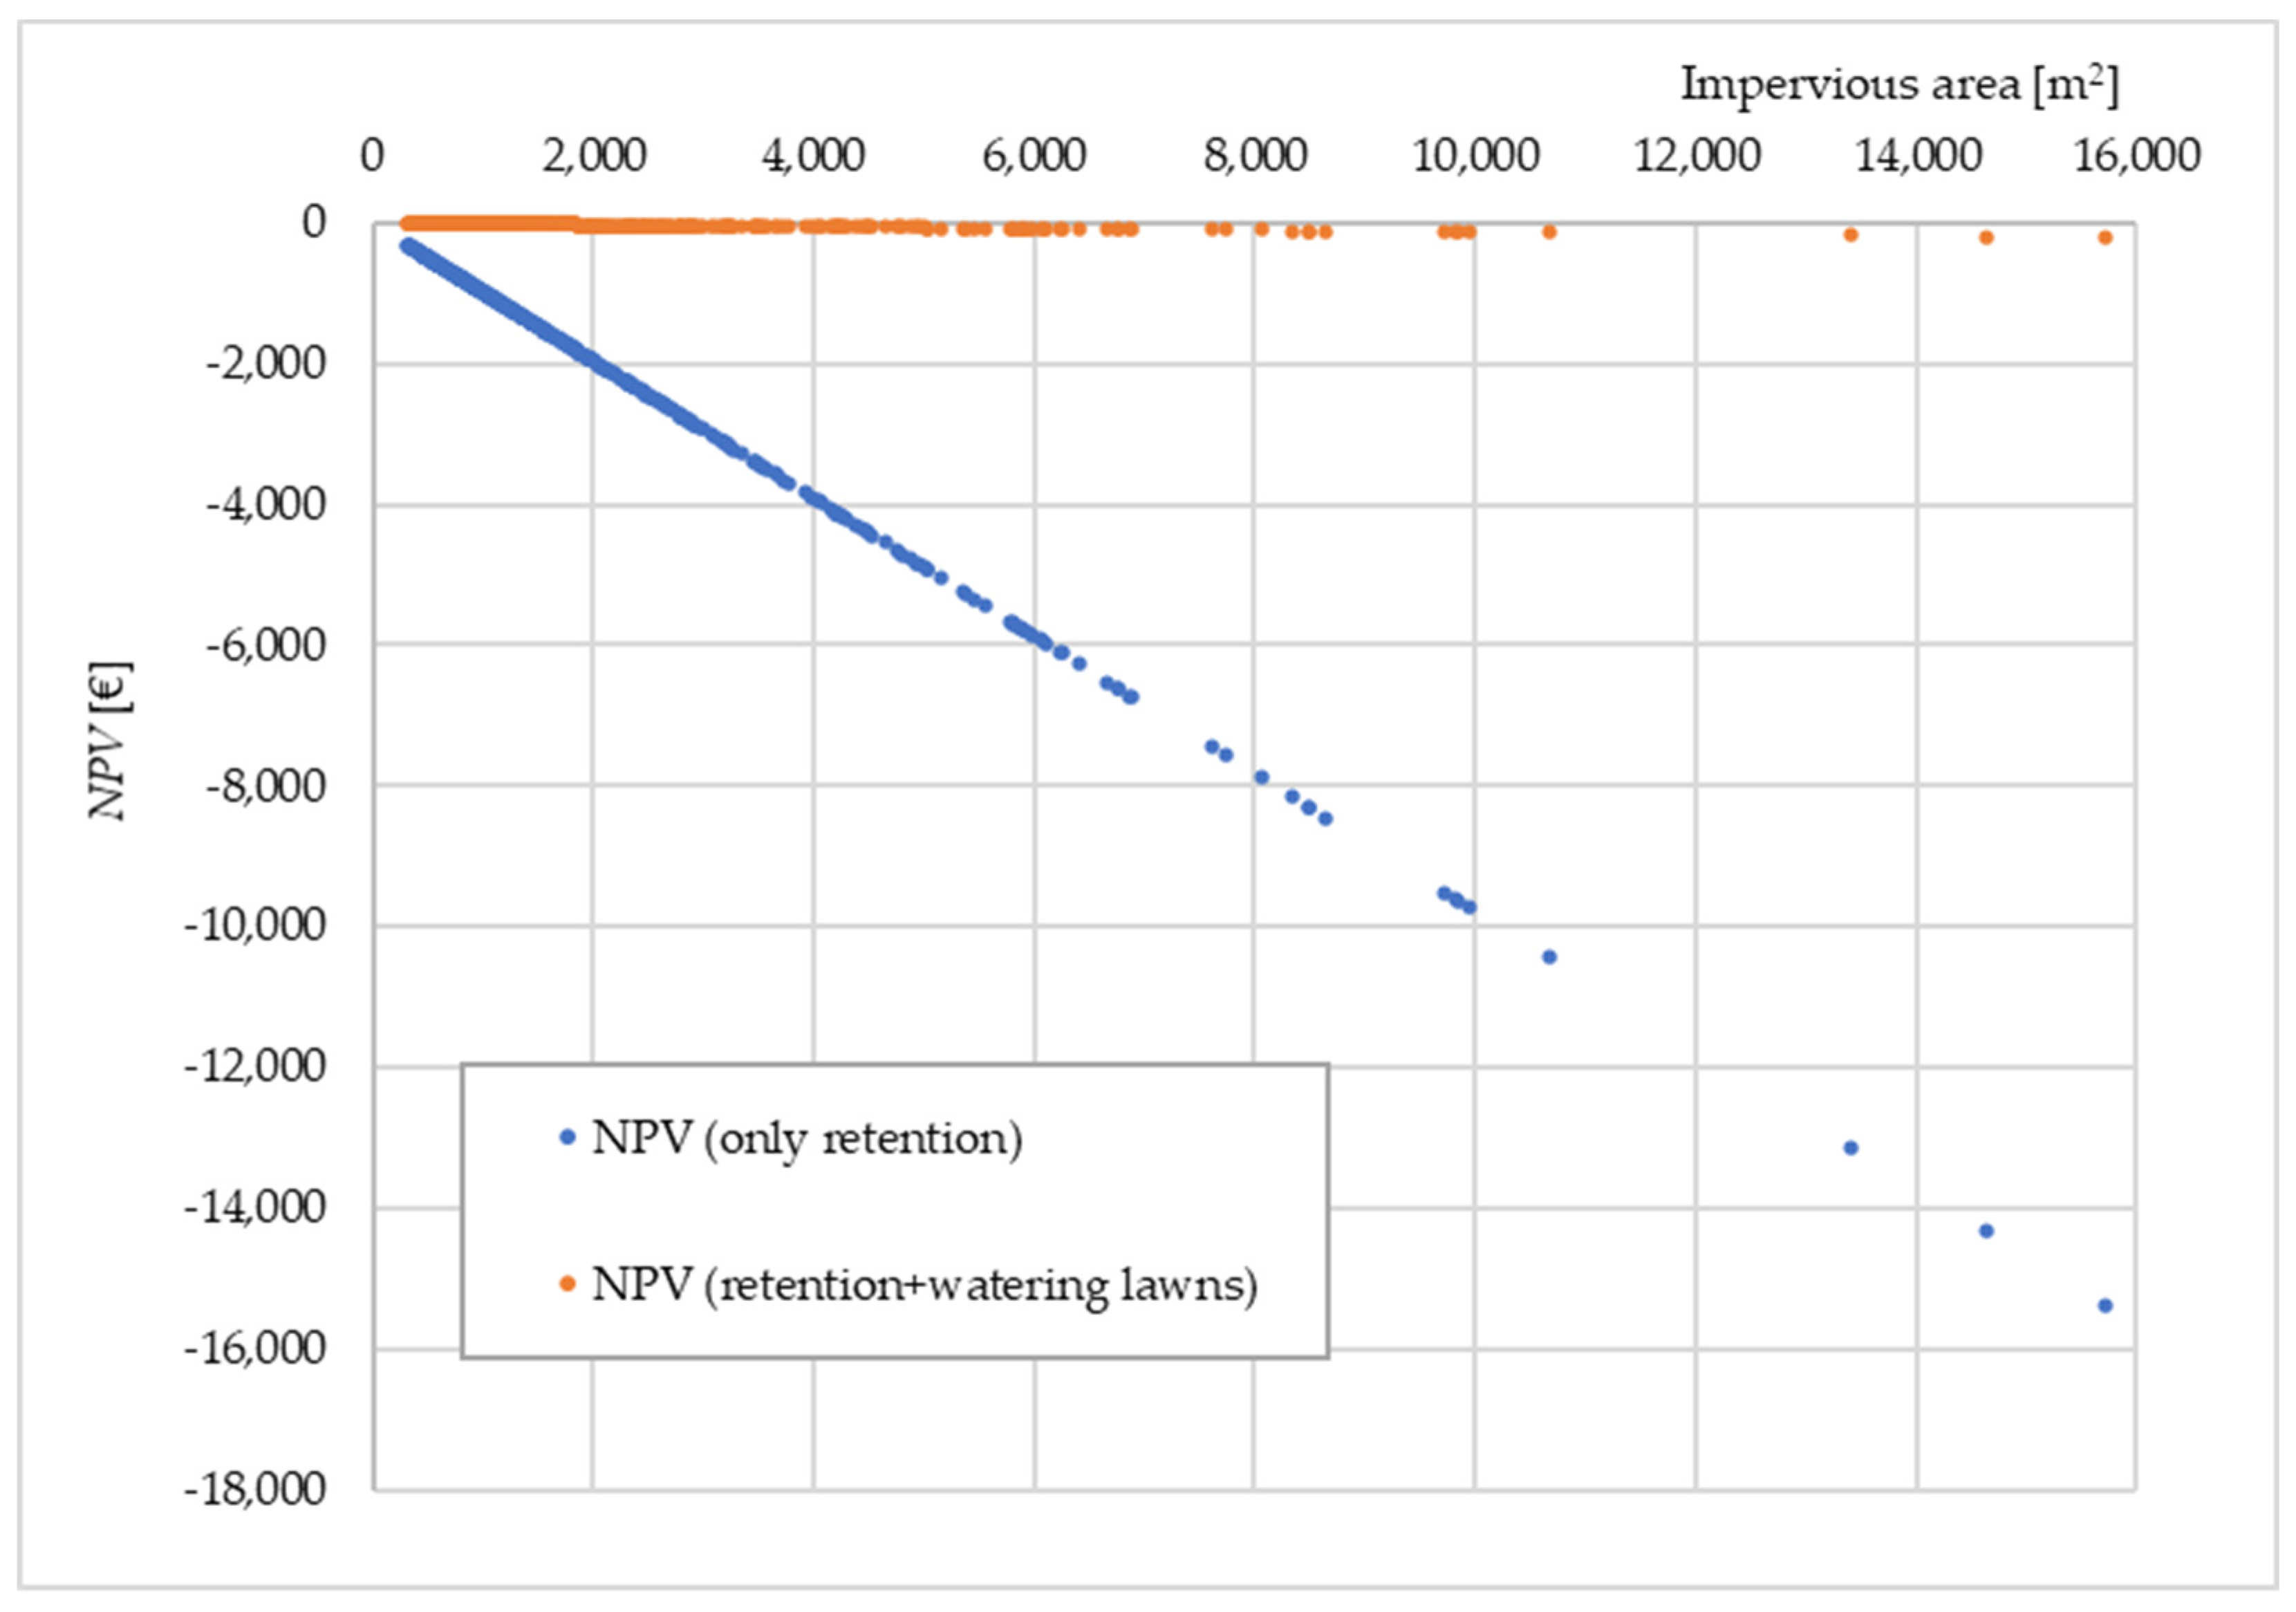
Table 1.
Average annual precipitation and stormwater runoff from individual aggregated land development types within the studied Sudół river catchment.
Table 1.
Average annual precipitation and stormwater runoff from individual aggregated land development types within the studied Sudół river catchment.
| Type of Development | Average Total Precipitation (dam3) | Runoff from the Entire Area (dam3) | Average Runoff from the Impervious Area (dam3) |
|---|---|---|---|
| Buildings and structures | 738.01 | 663.67 | 604.45 |
| Development, communication, and commercial areas | 2548.77 | 1479.96 | 615.97 |
| Religious, recreation, and sports areas | 105.61 | 36.55 | 6.96 |
| Forest and canopy cover area | 1365.56 | 81.93 | 0.00 |
| Undeveloped and green areas | 161.65 | 48.91 | 0.00 |
| Agricultural and greenery areas | 6189.41 | 885.39 | 0.00 |
| Surface water areas | 1.76 | 0.00 | 0.00 |
| Road, roadway, and footpath areas | 1165.04 | 955.96 | 955.96 |
| Total | 12,275.83 | 4149.77 | 2183.34 |
Table 2.
Fee rates in 2021 depending on the equipment volume relative to the annual runoff.
| Category | Fee Rate Per 1 m2 for One Year, Depending on the Equipment Volume | |
|---|---|---|
| Maximum Fee Rate Set Out in the Act | Rate Applicable in the Years 2018–2021 | |
| PLN/m2/Year (€/m2/Year) | ||
| Without equipment for retaining water from permanently impervious surfaces bonded to the ground | 1.00 (0.22) | 0.50 (0.11) |
| With equipment for the retention of water from impervious surfaces, with a volume of up to 10% of the annual runoff from impervious surfaces permanently bonded to the ground | 0.60 (0.13) | 0.30 (0.07) |
| With equipment for the retention of water from impervious surfaces, with a volume from 10% to 30% of the annual runoff from impervious surfaces permanently bonded to the ground | 0.30 (0.07) | 0.15 (0.03) |
| With equipment for the retention of water from impervious surfaces, with a volume above 30% of the annual runoff from impervious surfaces permanently bonded to the ground | 0.10 (0.02) | 0.05 (0.01) |
Notes: Average €/PLN exchange rate in January–October 2021: €1 = PLN 4.5541.
Table 3.
Examples of Polish cities that collect fees for discharging stormwater and snowmelt.
| City | Population (k People) | City Area (km2) | Number of Properties Subject to the Fee |
|---|---|---|---|
| Warsaw | 1.791 | 517 | 110 |
| Poznan | 535 | 262 | 14 |
| Katowice | 293 | 165 | 13 |
| Olsztyn | 172 | 88 | 11 |
| Koło | 22 | 14 | 20 |
Table 4.
Planned fee rates depending on the equipment volume relative to the annual runoff.
| Category | Fee Rate Per 1 m2 for One Year Depending on the Equipment Volume | |
|---|---|---|
| Maximum Rate | Minimum Rate | |
| PLN/m2/Year (€/m2/Year) | ||
| Without equipment for retaining water from permanently impervious surfaces bonded to the ground | 1.50 (0.33) | 0.75 (0.16) |
| With water retention equipment with a volume of 10% of the annual runoff | 0.75 (0.16) | 0.375 (0.08) |
| With water retention equipment with a volume from 10% to 30% of the annual runoff | 0.375 (0.08) | 0.1875 (0.04) |
| With water retention equipment with a volume above 30% of the annual runoff | 0.15 (0.03) | 0.075 (0.02) |
Notes: Average €/PLN exchange rate in January–October 2021: €1 = PLN 4.5541.
Table 5.
Properties within the Sudół catchment area subject to the new retention reduction fee.
| Category | Unit | Value |
|---|---|---|
| Number of properties subject to the fee | pcs | 907 |
| Total area of properties subject to the fee | m2 | 2,043,178 |
| Impervious area of properties subject to the fee | m2 | 1,313,263 |
| Total fee | PLN (€) | 984,947 (216,277) |
| Total annual runoff from impervious surfaces that may be subject to retention | m3 | 747,903 |
Table 6.
Comparison of the analyzed variants.
| Category | Unit | Variant 0 | Variant 1 | Variant 2 | Variant 3 | Variant 4 |
|---|---|---|---|---|---|---|
| Fee rate | PLN/m2 | 0.75 | 0.75 | 0.75 | 0.75 | 5.02 |
| Equipment capacity (% of annual runoff) | % | 0% | 0.1% | 10% | 3% | 3% |
| Total retention capacity | m3 | 0 | 748 | 74,790 | 22,437 | 22,437 |
| Capacity-based discount | % | 0% | 40% | 70% | 40% | 70% |
| NPV (only retention) | >0 | <0 | <0 | <0 | ||
| Profitability for investors (only retention) | yes | no | no | no | ||
| NPV (retention + watering lawns) | >0 | <0 | <0 | >0 * | ||
| Profitability for investors (retention + watering lawns) | yes | no | no | yes | ||
| Total fee (water management funds) | PLN (€) | 984,947 (216,277) | 492,474 (108,138) | 294,237 (54,069) | 492,474 (108,138) | 1,536,517 (337,392) |
* Slightly greater than 0.
Publisher’s Note: MDPI stays neutral with regard to jurisdictional claims in published maps and institutional affiliations. |
© 2022 by the authors. Licensee MDPI, Basel, Switzerland. This article is an open access article distributed under the terms and conditions of the Creative Commons Attribution (CC BY) license (https://creativecommons.org/licenses/by/4.0/).
Share and Cite
MDPI and ACS Style
Godyń, I.; Muszyński, K.; Grela, A. Assessment of the Impact of Loss-of-Retention Fees on Green Infrastructure Investments. Water 2022, 14, 560. https://0-doi-org.brum.beds.ac.uk/10.3390/w14040560
AMA Style
Godyń I, Muszyński K, Grela A. Assessment of the Impact of Loss-of-Retention Fees on Green Infrastructure Investments. Water. 2022; 14(4):560. https://0-doi-org.brum.beds.ac.uk/10.3390/w14040560
Chicago/Turabian StyleGodyń, Izabela, Krzysztof Muszyński, and Agnieszka Grela. 2022. "Assessment of the Impact of Loss-of-Retention Fees on Green Infrastructure Investments" Water 14, no. 4: 560. https://0-doi-org.brum.beds.ac.uk/10.3390/w14040560
Note that from the first issue of 2016, this journal uses article numbers instead of page numbers. See further details here.