Article

Assessing Numerical Model Skill at Simulating Coastal Flooding Using Field Observations of Deposited Debris and Photographic Evidence

1
Ocean, Coastal and River Engineering Research Centre, National Research Council Canada, Ottawa, ON K1A 0R6, Canada
2
Department of Civil Engineering, University of Ottawa, Ottawa, ON K1N 6N5, Canada
3
Natural Resources and Energy Development, Geological Surveys Branch, Government of New Brunswick, Bathurst, NB E2A 7B8, Canada
4
Campus de Shippagan, Secteur Administration, Arts et Sciences Humaines, Géographie, Université de Moncton, Shippagan, NB E8S 1P6, Canada
*
Author to whom correspondence should be addressed.
Submission received: 22 December 2021 / Revised: 9 February 2022 / Accepted: 11 February 2022 / Published: 15 February 2022

Abstract

:
Despite the growing range and availability of resources to support coastal flood hazard model development, there is often a scarcity of data to support critical assessment of the performance of community-scale coastal inundation models. Even where long-term tide gauge measurements are available in close proximity to the study area, the records provide little insight into the spatial distribution and limits of overland flooding, or the influence of topographic features and structures on flooding pathways. We present methods to support the assessment of model performance using field observations in lieu of, or supplementary to, conventional water-level records. A high-resolution, numerical coastal flood hazard model was developed to simulate storm surge-driven flooding in the Acadian Peninsula region of New Brunswick, Canada. Owing to the remoteness of the study area from tide gauge stations, model performance was assessed based on a comparison with field measurements of deposited wrack and debris, as well as photographic and video evidence of coastal flooding, for two significant storm surge events in recent history. Our research findings illustrate the value of observational and qualitative data for characterizing coastal flood hazards, lending gravity to the importance of non-conventional data sources, particularly in data-scarce regions.

1. Introduction

Approximately 6.5 million Canadians live in the vicinity of Canada’s marine coasts, making these regions intrinsically important to the national identity, culture, and economy [1]. Coastal flood hazards and risks in Canada are becoming increasingly exacerbated by climate-driven phenomena such as sea-level rise, and anthropogenic factors that contribute to increased development, population growth, and loss of natural features in the coastal zone [2,3,4,5]. The southern Gulf of Saint Lawrence and sections of New Brunswick’s coast are particularly sensitive to the impacts of sea-level rise and storm surges [3]. In response to this growing threat, numerous research initiatives have been conducted in New Brunswick and the surrounding area to investigate coastal flooding at both regional [3,6] and local scales [2,7,8,9,10].
Hazard assessment is a crucial component of disaster risk management. Flood hazard modelling (and derived mapping and communication products) permits the quantitative assessment of the consequences of flooding and ultimately supports evidence-based decision making and disaster risk management [5,11,12]. A number of analytical methods, with varying complexity, are applied in practice to model and assess coastal flood hazards. Bathtub modelling techniques, where high-water elevations are mapped onto a digital elevation model, are often employed to evaluate overland flood depths and extent [7,10,13,14,15]. Numerical hydrodynamic modelling techniques, although more computationally demanding, are an attractive alternative owing to their explicit consideration of hydrodynamics, resulting in generally superior accuracy [16], and their provision of additional information regarding spatial and temporal variation of flood hazards, providing insight to water velocities, flood propagation, and duration. Two-dimensional (and in some cases three-dimensional) hydrodynamic modelling techniques are often employed to simulate coastal water levels and flows in response to meteorological and tidal forcing [17,18,19,20]. Circulation models are sometimes coupled with other computational models to simulate other physical processes at various scales and resolutions such as wave runup, overtopping, and geomorphological processes [17,21]. To alleviate computational demand, nested modelling techniques and unstructured grids are commonly employed to permit detailed simulation nearshore, while maintaining sufficient domain size to capture synoptic scale atmospheric and meteorological forcing [17,19,22]. Previous studies have employed bathtub modelling approaches to characterize coastal flood hazards in the Acadian Peninsula region of New Brunswick [7,10]. However, to the authors’ knowledge, hydrodynamic modelling of storm surges, including overland inundation, at spatial resolutions conducive to damage and risk assessment have not yet been conducted for this region.
The Acadian Peninsula is located at the northeastern extremity of New Brunswick, Canada (Figure 1). The region is bordered to the north by Chaleur Bay and to the south by the Gulf of Saint Lawrence. The region is home to several communities experiencing coastal flooding and erosion, which have contributed to damage to infrastructure, including houses, roads, and wharfs [23]. A number of coastal flood assessment and mapping projects [7,10] and adaptation initiatives [9] have been undertaken for Acadian Peninsula communities. However, one of the biggest challenges hindering accurate flood hazard characterization and development of reliable flood modelling and assessment tools is the scarcity of proximate water level records. Currently, there are no long-term, active tide gauges located on the Acadian Peninsula. The region is approximately equidistant between the two closest long-term tide gauge stations located in Belledune (tide gauge 2145) and Lower Escuminac (tide gauge 2000), approximately 85 km and 75 km away, respectively [24]. Even where tide gauge measurements exist, they provide little insight into the spatial distribution and inland extent of coastal flooding [2]. To overcome these challenges, previous studies have relied on surveyed high-water marks, such as shoreline debris, to support validation of inundation models [10].
Where adequate observational data exist, deposited debris such as driftwood and sea wrack have been used to support analyses related to coastal flooding [8,26,27,28,29,30]. Didier et al. [8] used debris lines to evaluate coastal flood extent, as well as predictive accuracy of wave runup estimations, for the community of Maria, Québec; Maria is located approximately 100 km northwest of the Acadian Peninsula. Similarly, Bernatchez et al. [2] used observational data and photographic evidence in the community of Maria to investigate flood extent for a winter storm event. Often, researchers pursue the acquisition of observational data in a sufficient quantity to support the delineation of the full flood extent [2,8,27]. However, depending on the size of the study area, the effort and resources required to support this level of field data collection can be prohibitively large. In this paper, we describe the assessment of model skill for a numerical hydrodynamic model developed to evaluate storm surge-driven flood hazards for selected locations of the Acadian Peninsula region of New Brunswick, Canada. Model skill was assessed using surveyed high-water marks coinciding with the 6 December 2010 and 21 December 2010 events. High-water marks were comprised of shoreline debris observations as well as pegs placed by the field team marking direct observation of maximum flood extent. In addition, a qualitative assessment of model skill was conducted through a comparison with photographic and video evidence.

2. Storm Surge Modelling

Numerical hydrodynamic modelling was conducted at two scales using TELEMAC-2D, which solves the shallow water (Saint-Venant) equations governing free surface flows in two dimensions (i.e., depth averaged) on unstructured computational meshes [31]. A coarse-resolution, regional-scale model was developed to simulate the generation and evolution of storm surges on the Atlantic Canada continental shelf, including the Gulf of Saint Lawrence, in response to synoptic-scale wind and atmospheric pressure fields [32]. A fine-resolution, community-scale model was developed and driven by output from the regional model to simulate inundation at seven Acadian Peninsula communities. The seven communities of interest included Maisonnette, Bas-Caraquet, Caraquet, Pointe-Brûlée, Shippagan, Le-Goulet, and Lamèque (Figure 1). This paper is focused on assessment of the community-scale model skill; however, some information pertaining to the regional-scale model is provided for context. A detailed summary of the regional-scale model development is presented in Provan et al. [32].
The regional-scale model domain covered a large portion of the continental shelf from Portland, Maine (United States) to Sandwich Bay, Newfoundland and Labrador (Canada). The model uses an unstructured computational mesh with resolution ranging between 30 km near the offshore boundary and 200 m in the vicinity of the Acadian Peninsula. The model bathymetry was constructed using a combination of bathymetric datasets [33,34]. The regional-scale model was forced using wind and atmospheric pressure data from the ERA5 global atmospheric reanalysis dataset [35]. Tidal forcing was applied using the global TPXO database and its regional and local variants [36]. The regional-scale model was calibrated based on measured data available from the Belledune and Lower Escuminac tide gauges. Water level residuals were extracted from the gauge records by computing the difference between measured levels and the predicted astronomical tide [37], and were used as a basis for calibration, assuming storm surges represent the dominant contribution to the residual. Model wind drag formulation/coefficients and bed roughness were iteratively adjusted until satisfactory results were achieved. Ultimately, the regional-scale model was able to predict peak storm surges at the Lower Escuminac gauge to within 15% of measured water level residuals for 24 of the largest 44 storm surge events recorded at the gauge.
The community-scale model encompassed the Acadian Peninsula region of New Brunswick extending from the north coast of New Bandon Parish, eastward to Miscou Island, and southward to Tracadie-Sheila. The model domain extended approximately 20–30 km northward into Chaleur Bay and 30 km southward into the Gulf of Saint Lawrence. The model uses an unstructured (triangular) computational mesh with characteristic element edge lengths on the offshore boundary ranging between approximately 250 m and 2000 m. Characteristic edge lengths of 10 m were specified in the vicinity of the communities of interest to resolve floodplain features, flooding pathways, and hazards, at scales of relevance to support consequence assessments. Model elevations were generated from a combination of bathymetric and topographic datasets [33,38,39,40], including a hydro-enforced 1 m-resolution digital elevation model (DEM) from 2018 and a 1 m-resolution DEM from 2009 provided by the Government of New Brunswick. The hydro-enforced DEM was used in six of the seven communities. The 2009 DEM was used in the vicinity of Le Goulet to provide a consistent basis for comparing model output to observations, which pre-dated significant coastal engineering works and alterations to the dynamic Le Goulet coastline, including construction of artificial dunes and sand retention structures [9]. Spatially and temporally varying water levels were prescribed at the offshore boundary of the community-scale model based on output from the regional-scale model, which included tidal forcing based on the TPXO tide model and its regional and local variants [36]. Corrections for wave setup were not incorporated into the community-scale model. Surface wind and atmospheric pressure forcing was applied within the model domain, based on linear interpolation of gridded ERA5 reanalysis data to the model mesh [35]. Initial estimates for the wind drag formulation and coefficients were based on calibrated parameters for the regional-scale model. Initial estimates for land roughness were based on land cover data acquired from the Government of New Brunswick [41,42,43] and typical roughness values by land cover type obtained from literature [44,45].

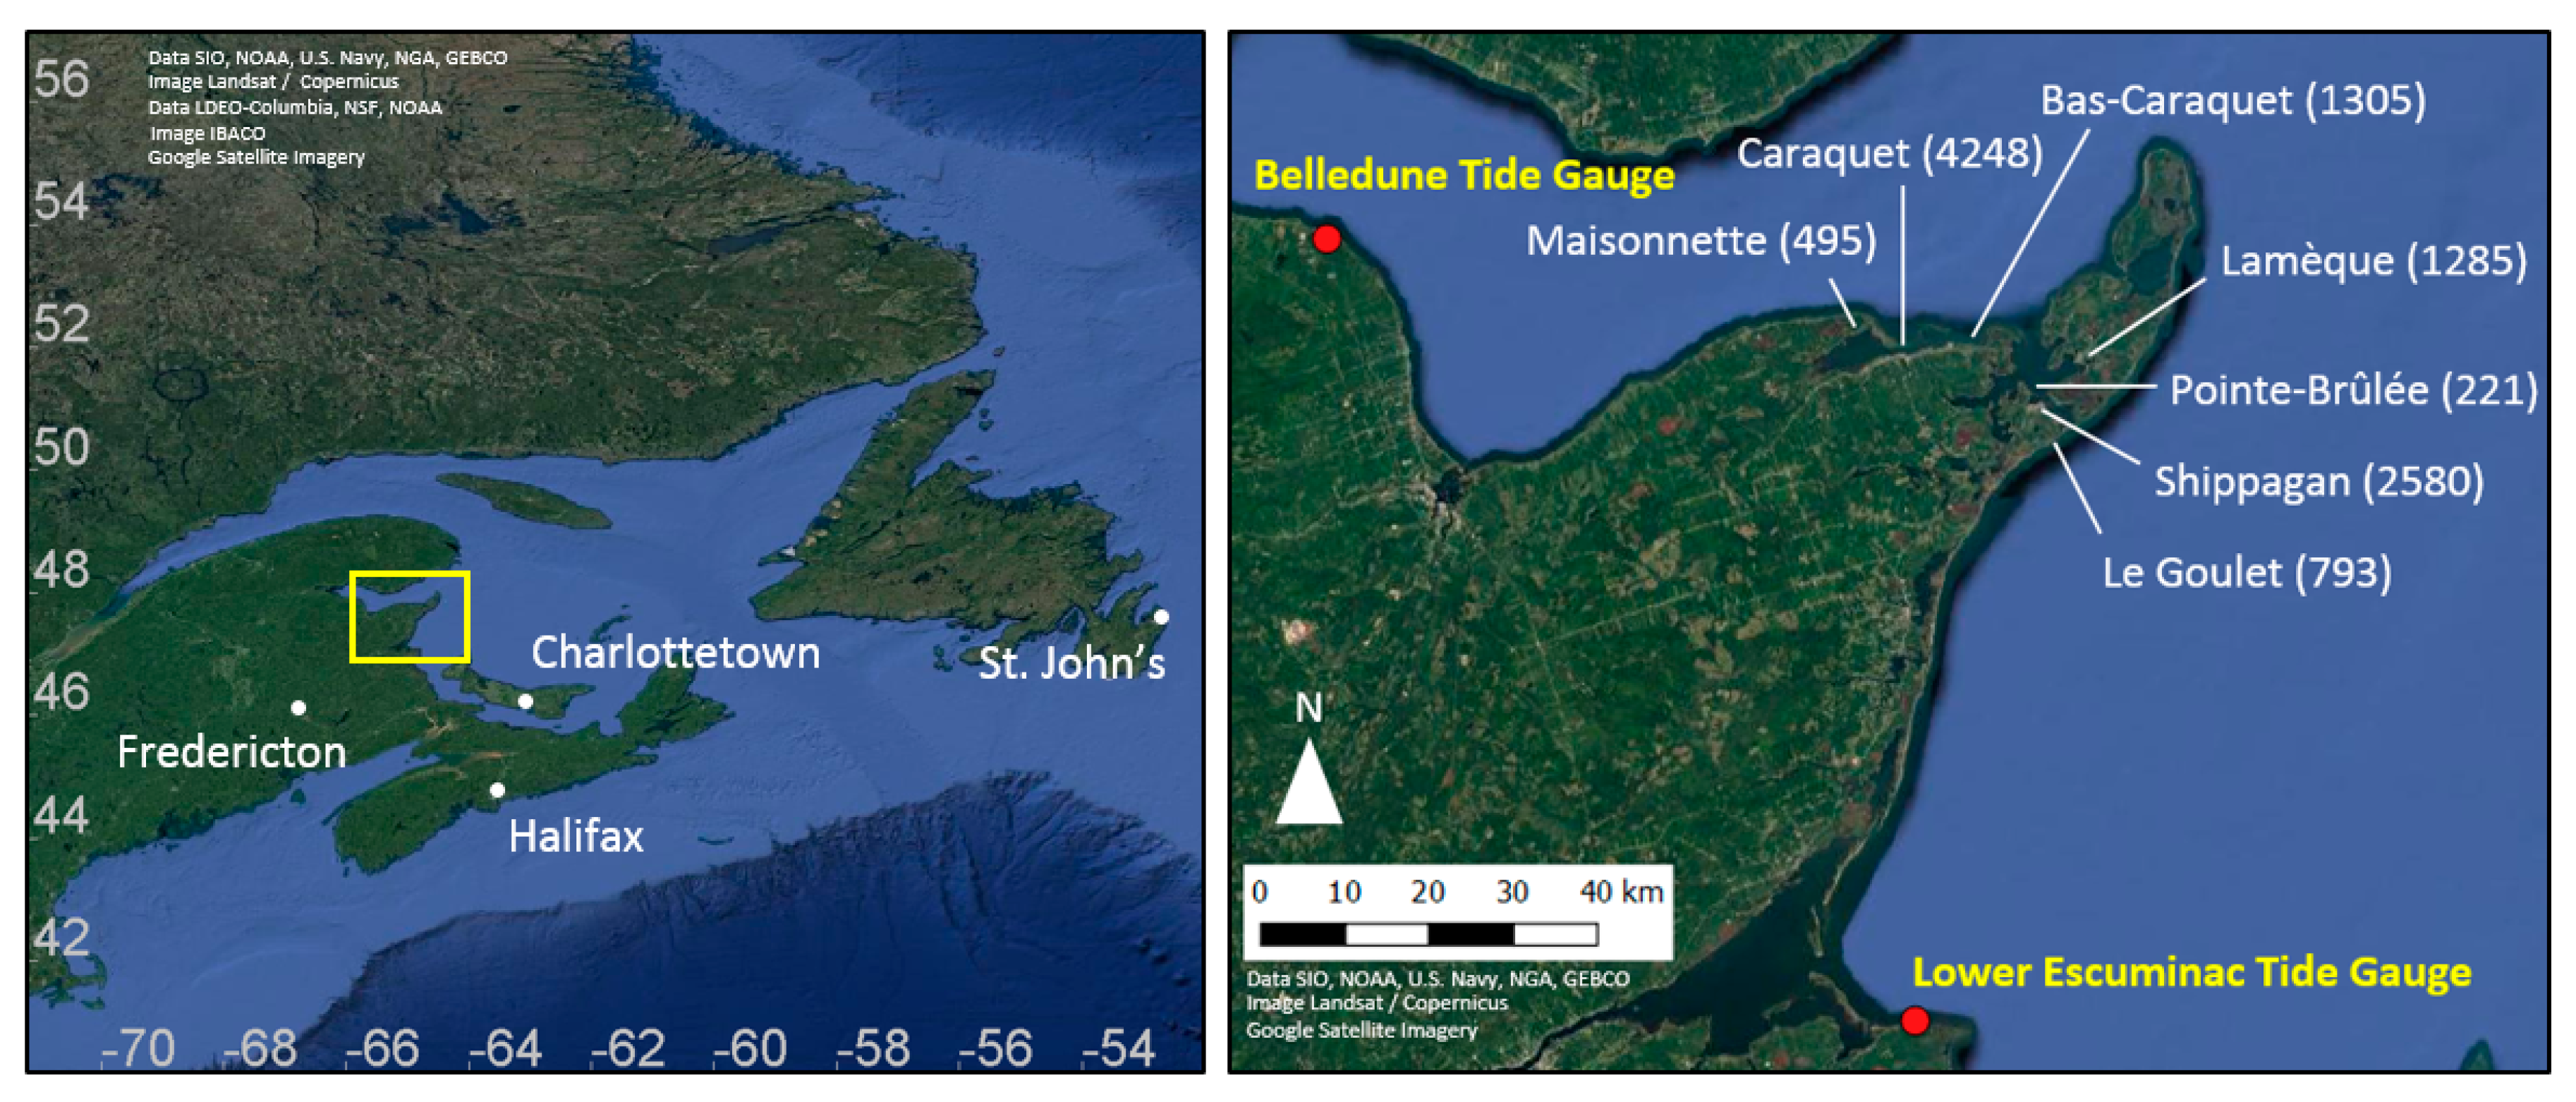
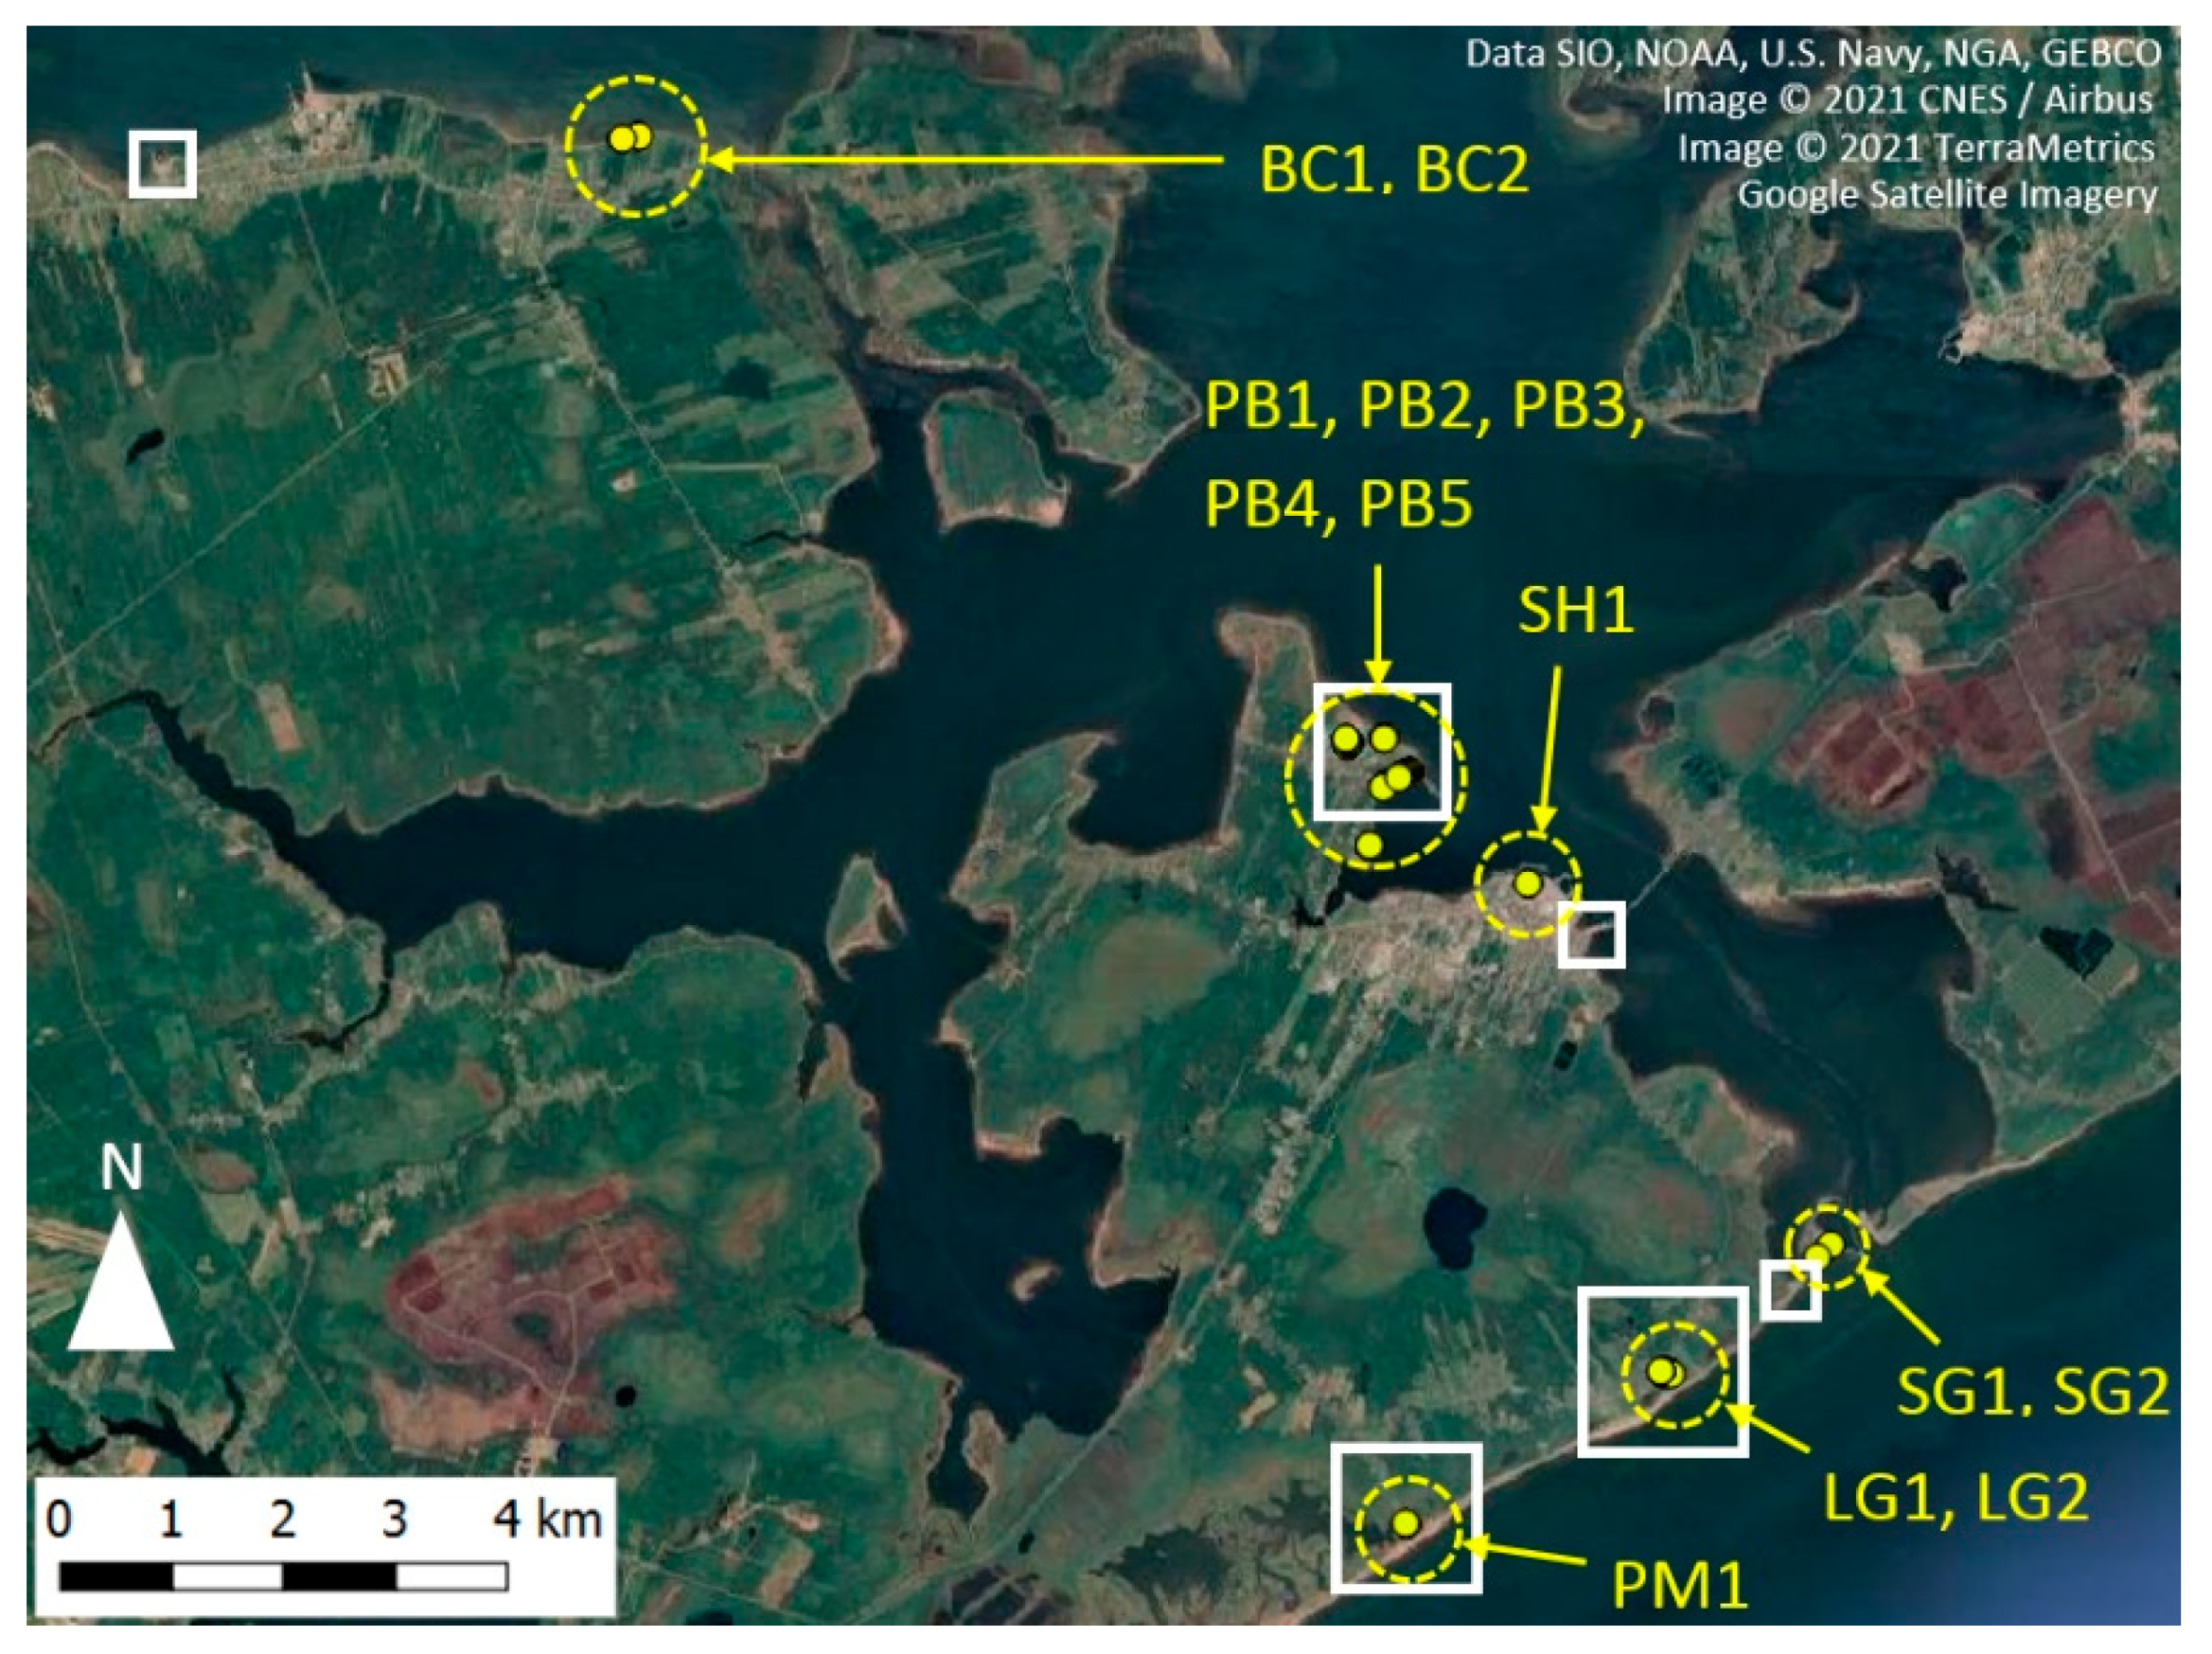
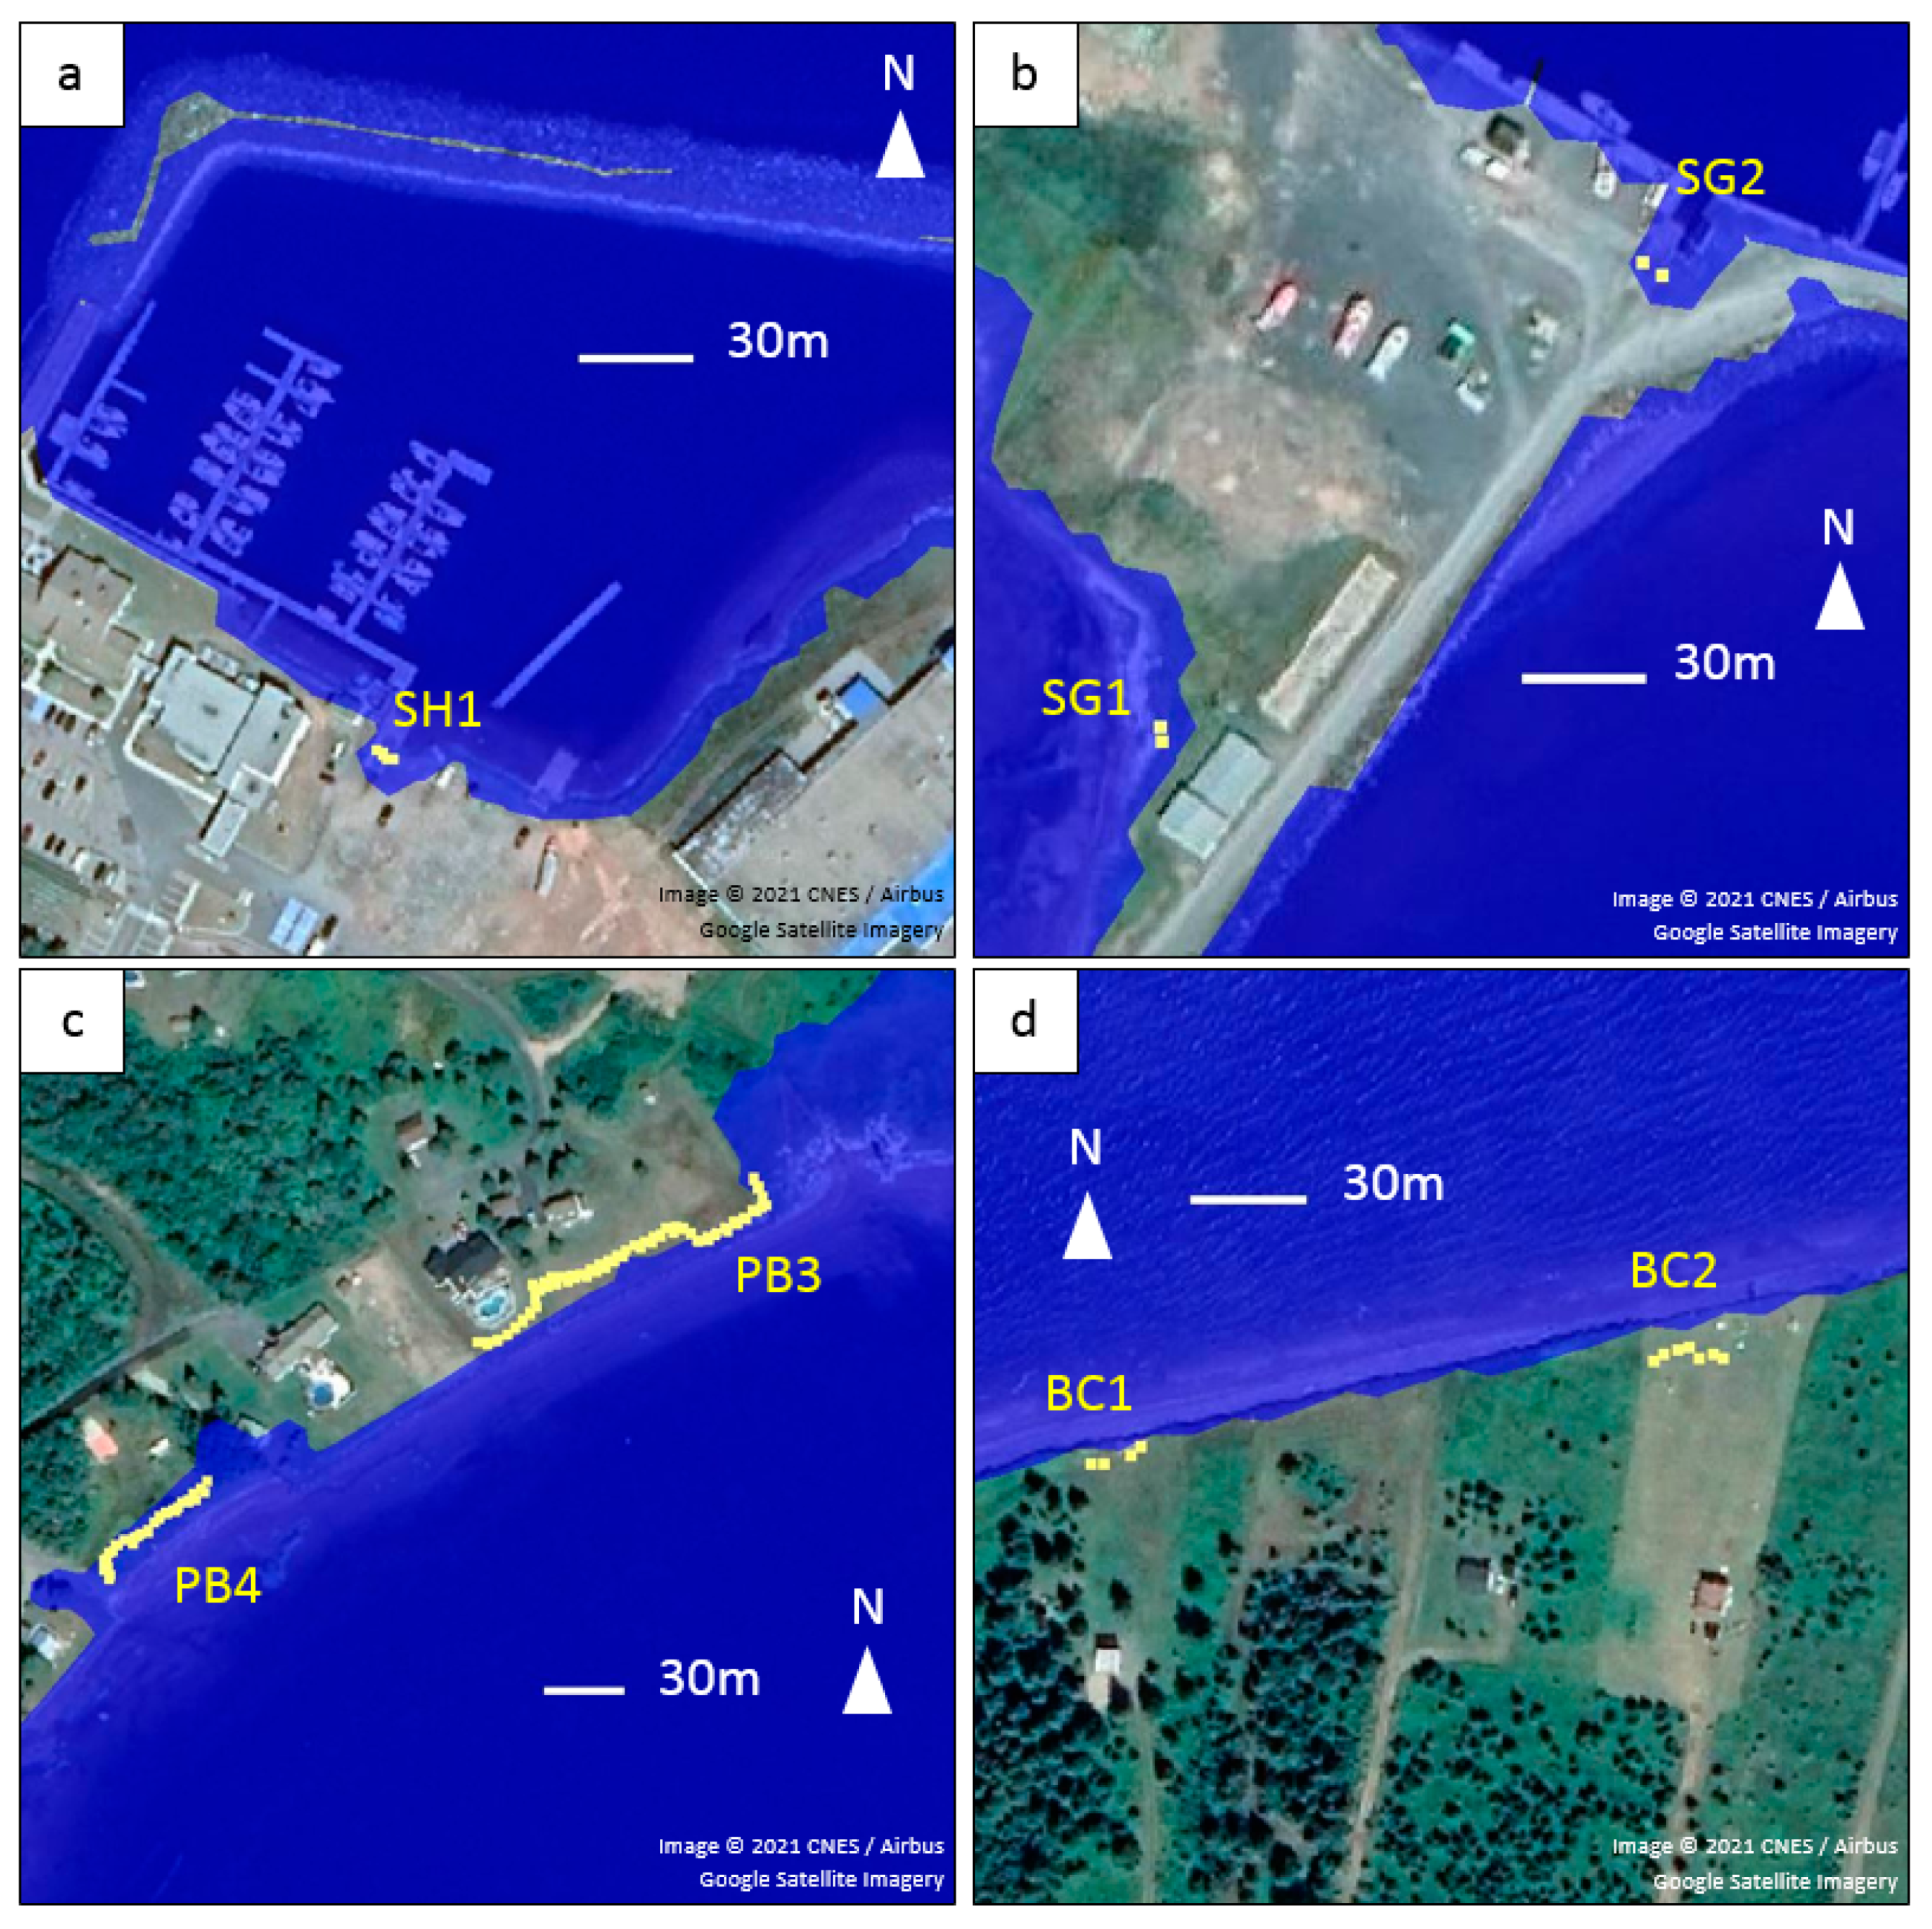
3. High-Water-Mark Surveys and Photographic and Video Evidence

High-water-mark surveys were conducted by members of the New Brunswick Geological Surveys Branch using a high precision real-time kinematic differential global positioning system (RTK-DGPS) consisting of two rovers and a base station. Leica Viva GS15 GPS receivers were used, which have a reported horizontal and vertical accuracy of 8 mm and 15 mm, respectively [46]. However, duplicate readings on ground-control points revealed that survey accuracy was actually 20 mm to 30 mm in all three axes (i.e., easting, northing, and orthometric height). The surveys were conducted on 9 December 2010 in the vicinity of Le Goulet and Shippagan; 23 June 2011 in the vicinity of Pointe-Brûlée; and 28 June 2011 in the vicinity of Bas-Caraquet. The survey data consisted of point measurements indicating horizontal position (easting and northing) and elevation georeferenced to the Canadian Geodetic Vertical Datum of 1928 (CGVD28). Elevations were converted to the Canadian Geodetic Vertical Datum of 2013 (CGVD2013) using the GPS·H tool [47] to support comparison with the model; model simulations were conducted with elevations referenced to mean water level (MWL), but model results could be easily transformed to CGVD2013. Most of the survey data were based on observations of debris (sea-wrack) deposited onshore by the flood water, primarily consisting of eel grass vegetation. Exceptions included data recorded in Bas-Caraquet (locations BC1 and BC2 on Figure 2), which represent observed gravel deposits, and data recorded in Le Goulet (locations LG1 and LG2), which represent pegs placed by the field team during the flood event marking the maximum flood extent. When debris were used as an indicator of high water, measurements were recorded at ground elevation near the mid-section of the debris lines.
Referring to survey locations shown in Figure 2, most surveyed high-water marks were located either substantially landward of the beach crest (PB1, PB2, PM1, LG1, and LG2), were sheltered within a small bay with fetches less than 3 km (PB3, PB4, PB5, and SG1), or were otherwise sheltered by built structures (SH1 and SG2), such that wave runup contributions to total water levels were expected to be relatively low. This is supported by photographic evidence of the December 2010 flood events, where only small ripples were observed at the flood extent beyond the beach crest in Pointe-Brûlée, Baie-de-Petit-Pokemouche, and Le Goulet (refer to Section 4.2). Exceptions included survey locations in Bas-Caraquet (BC1 and BC1), where surveyed points are located immediately adjacent to the shoreline, which is exposed to Chaleur Bay.
The survey data collected on 9 December 2010 (in the vicinity of Baie-de-Petit-Pokemouche, Le Goulet, Shippagan Gully, and Shippagan) reflect peak flood levels and extents produced during the 6 December 2010 event. It was not fully certain whether debris lines surveyed in June 2011 (in the vicinity of Pointe-Brûlée and Bas-Caraquet) reflected peak flood levels associated with the 6 December 2010 event or the 21 December 2010 event; both events produced similar water levels in the Acadian Peninsula region. To address this uncertainty, modelled results for the 6 December 2010 and 21 December 2010 events were carefully compared for each model setup evaluated during the calibration process (see Section 4.1). Modelled results for the 21 December 2010 event consistently showed more extensive flooding in comparison to the 6 December 2010 event in the vicinity of Pointe-Brûlée for all comparable model setups. In the vicinity of Bas-Caraquet, the modelled results for the 21 December 2010 event showed slightly more extensive flooding compared to the 6 December 2010 event. This suggests that the June 2011 survey data in Pointe-Brûlée and Bas-Caraquet represent peak flood levels associated with the 21 December 2010 event. Furthermore, only single debris lines were observed at Pointe-Brûlée and Bas-Caraquet, further suggesting that the debris lines were formed by the 21 December 2010 event (the later of the two events) in these locations. Altogether, survey data corresponding to the 6 December 2010 event were available at six locations and survey data corresponding to the 21 December 2010 event were available at seven locations (Figure 2).
Flooding during the 6 December 2010 and 21 December 2010 events was photographed. Shoreline debris was also photographed following the events. Footage of the 21 December 2010 event was available from a video uploaded to YouTube by a local resident [48]. The video owner was contacted to confirm the locations shown in the video to support interpretation of the footage for model skill assessment. Altogether, photographic evidence corresponding to the 6 December 2010 event was available at five locations and photographic and video evidence corresponding to the 21 December 2010 event was available at eight locations (Figure 2).

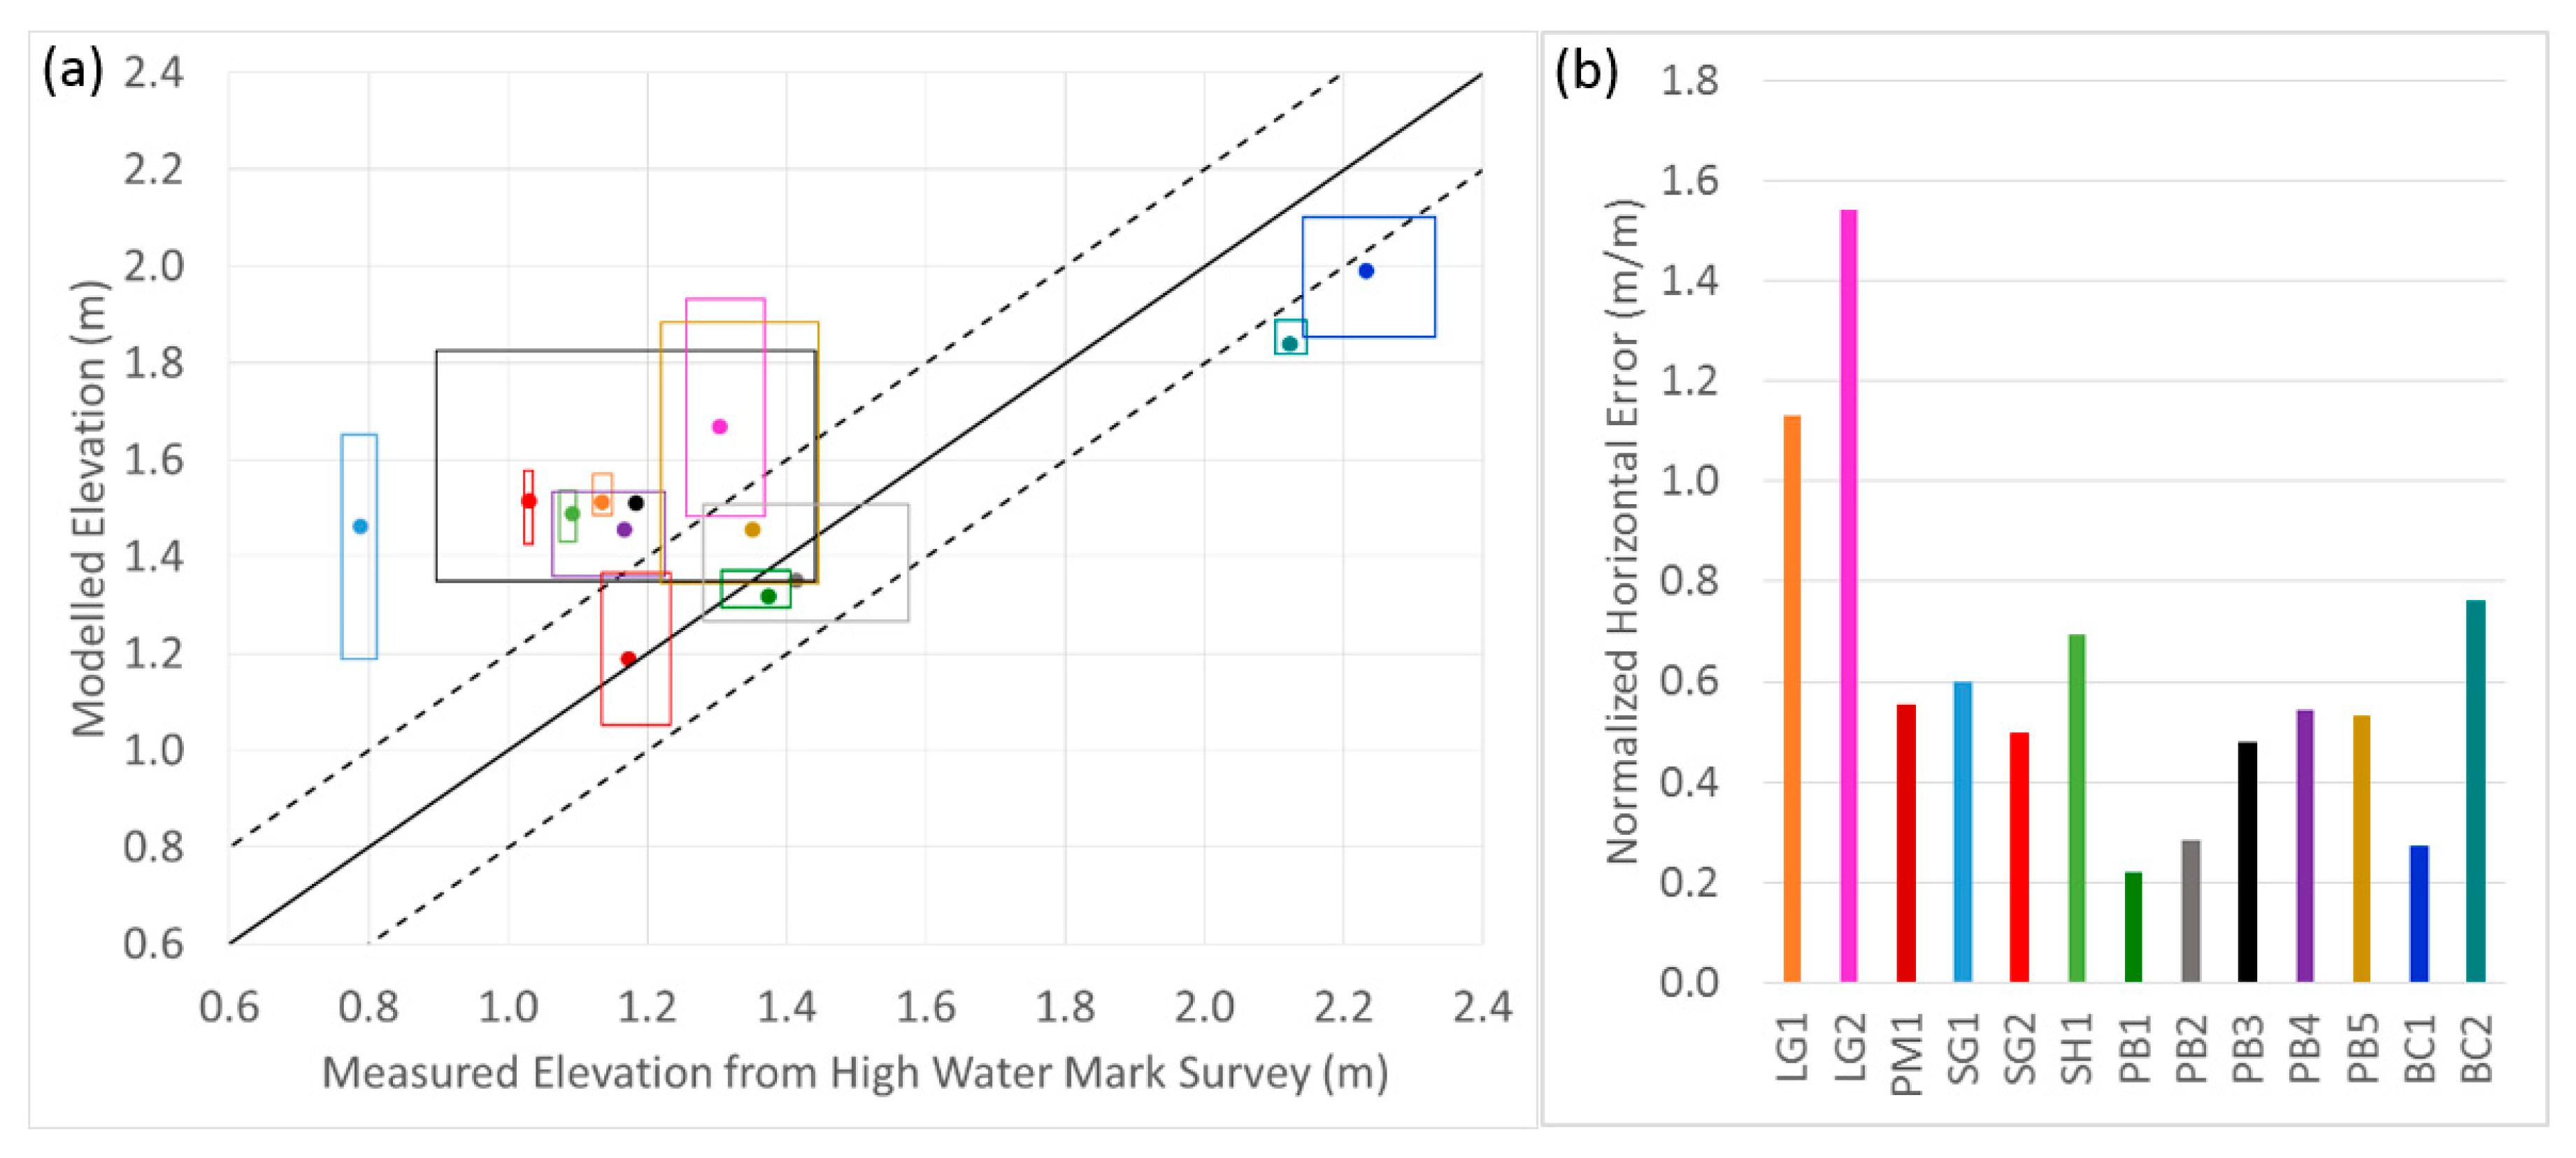
4. Assessment of Model Skill

4.1. Comparison with High-Water-Mark Survey Data

The community-scale model was calibrated by adjusting the wind drag formulation, drag coefficients, and land (Manning’s) roughness and comparing modelled results to the high-water-mark survey data to assess model skill in predicting peak water levels and horizontal flood extents. These quantitative comparisons are presented and discussed in the following paragraphs. The consistency of predictions with photographic and video evidence was also considered (Section 4.2) to corroborate the model skill assessment.
Waterborne debris, such as wrack, is deposited when the submerged draft of the debris exceeds the local water depth and flow-induced forces are insufficient to overcome restoring gravitational and frictional resistance [49]. Debris transport and deposition are complex processes affected by the physical properties of the debris as well as shoreline characteristics and hydrodynamics [50,51,52]. Receding flood waters can also mobilize debris. As such, post-flood surveys of debris elevations do not necessarily provide a precise indication of the peak flood elevation and extent. For context, in a past study where small log debris was used as an indicator of storm surge-driven high-water level, Harper et al. [29] reported vertical survey error up to 0.13 m owing to the scatter of the logs. To facilitate a comparison between model predictions and surveyed debris, an assumption had to be made about the flood depth required to mobilize and deposit the materials. It was assumed that a flood depth of at least 5 cm was required to mobilize and deposit debris, and that this flood depth represents a suitable lower-bound from which to extract flood hazard metrics such as depth and flood extent. Therefore, the modelled 5 cm flood depth contour was adopted as a proxy for peak water level and flood extent. Model skill at predicting peak water levels was assessed by computing the difference between the modelled peak water level and the surveyed high-water mark elevations at each of the 13 survey locations. High-water-mark survey data were available for the 13 discrete locations only, which precluded comprehensive mapping of the flood extent [8,27]. Model skill at predicting the horizontal extent of inundation was therefore assessed by computing horizontal distances between the high-water-mark survey points and the modelled 5 cm flood depth contour at each survey location. Figure 3 shows high-water-mark survey data at locations SH1, SG1, SG2, PB3, PB4, BC1, and BC2, alongside modelled results.
The results of the horizontal and vertical assessment of model skill, through comparison to the high-water-mark survey data, are summarized in Table 1 and Figure 4. Average absolute vertical error was equal to 0.28 m and vertical-root-mean-square error (RMSE) was equal to 0.34 m. Vertical discrepancies less than 30 cm were observed for 7 of the 13 locations. To provide context to the observed vertical error, a comparison between the high-water-mark survey point elevations and the model ground elevations was conducted and revealed general agreement with RMSE discrepancy of approximately 0.2 m. This represents the approximate error between the high-water-mark survey elevations and the model ground elevations, which encompasses the spatial error of the Light Detection and Ranging (LiDAR) data; the error introduced by interpolating the LiDAR data to DEM products; the error introduced by interpolating DEM products to the model mesh; the error introduced by converting surveyed high-water mark elevations from CGVD28 to CGVD2013; and the error introduced by converting model elevations from MWL to CGVD2013. The model ground elevations were derived from the aforementioned DEMs, which, in turn, were derived from LiDAR data that have a reported vertical accuracy of 0.05 m RMSE and horizontal accuracy of 0.2 m RMSE [40]. The largest vertical discrepancies were observed at the Shippagan Gully (SG) locations. However, it is expected that the fast and dynamic flows through the gully and the presence of fine resolution structures may present challenges to achieving accurate model results. Flow velocities up to 3.1 m/s and 2.6 m/s were observed near Shippagan Gully for the 6 December 2010 and 21 December 2010 events, respectively. Average absolute horizontal error was equal to 6.25 m, and horizontal RMSE was equal to 7.16 m. Except for locations LG1 and LG2, the model was able to reproduce measured flood extents with sub-mesh-resolution accuracy (i.e., discrepancies less than 10 m). Altogether, with consideration of the model resolution, and in light of uncertainties regarding water depth and debris deposition, the observed vertical and horizontal discrepancies were deemed acceptable to support coastal flood hazard assessment. Based on the computed RMSE values for the events and locations investigated, the model predicts inundation to within ±0.34 m vertically and ±7.16 m horizontally, which reflects similar spatial scales to those associated with buildings and assets of relevance to risk assessment.

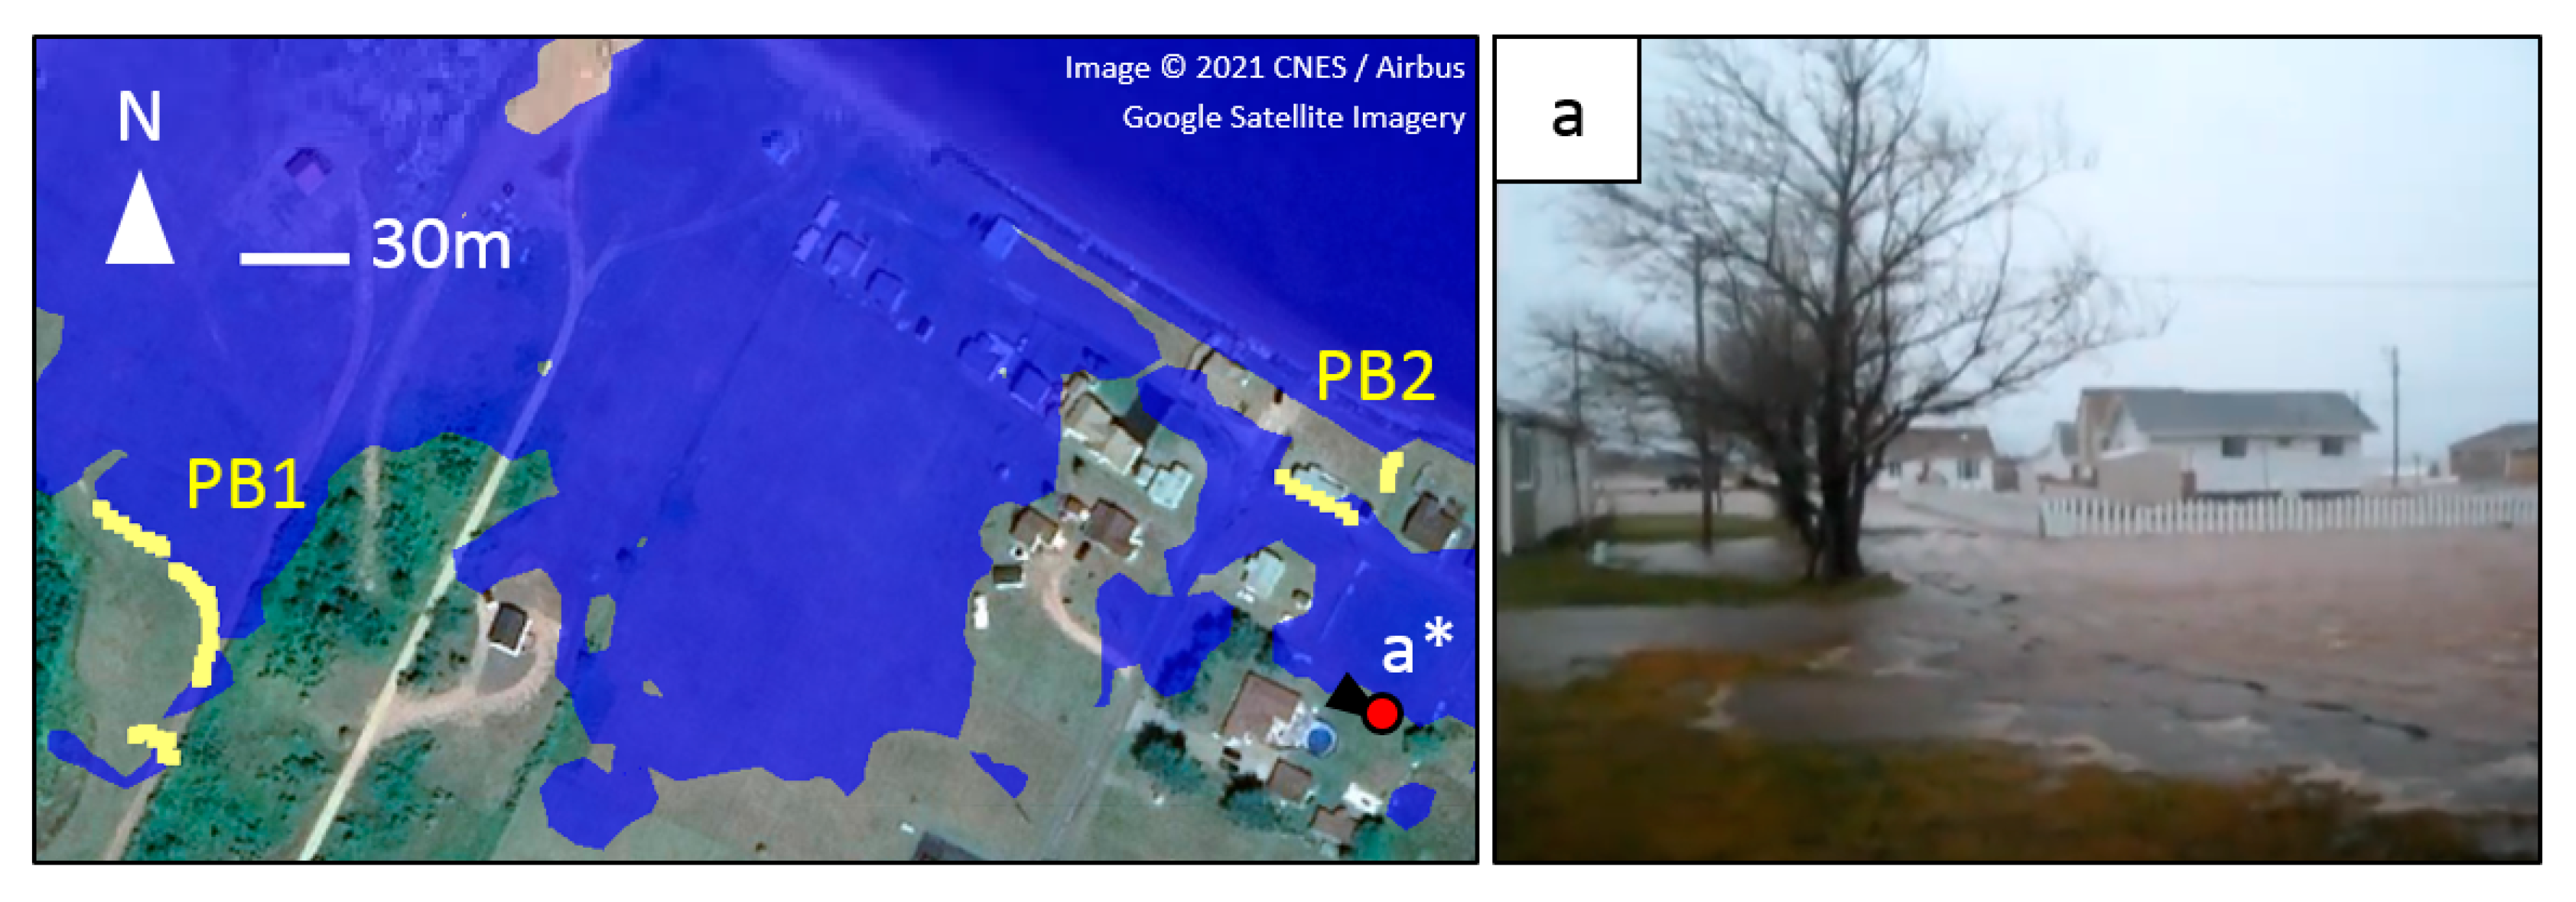
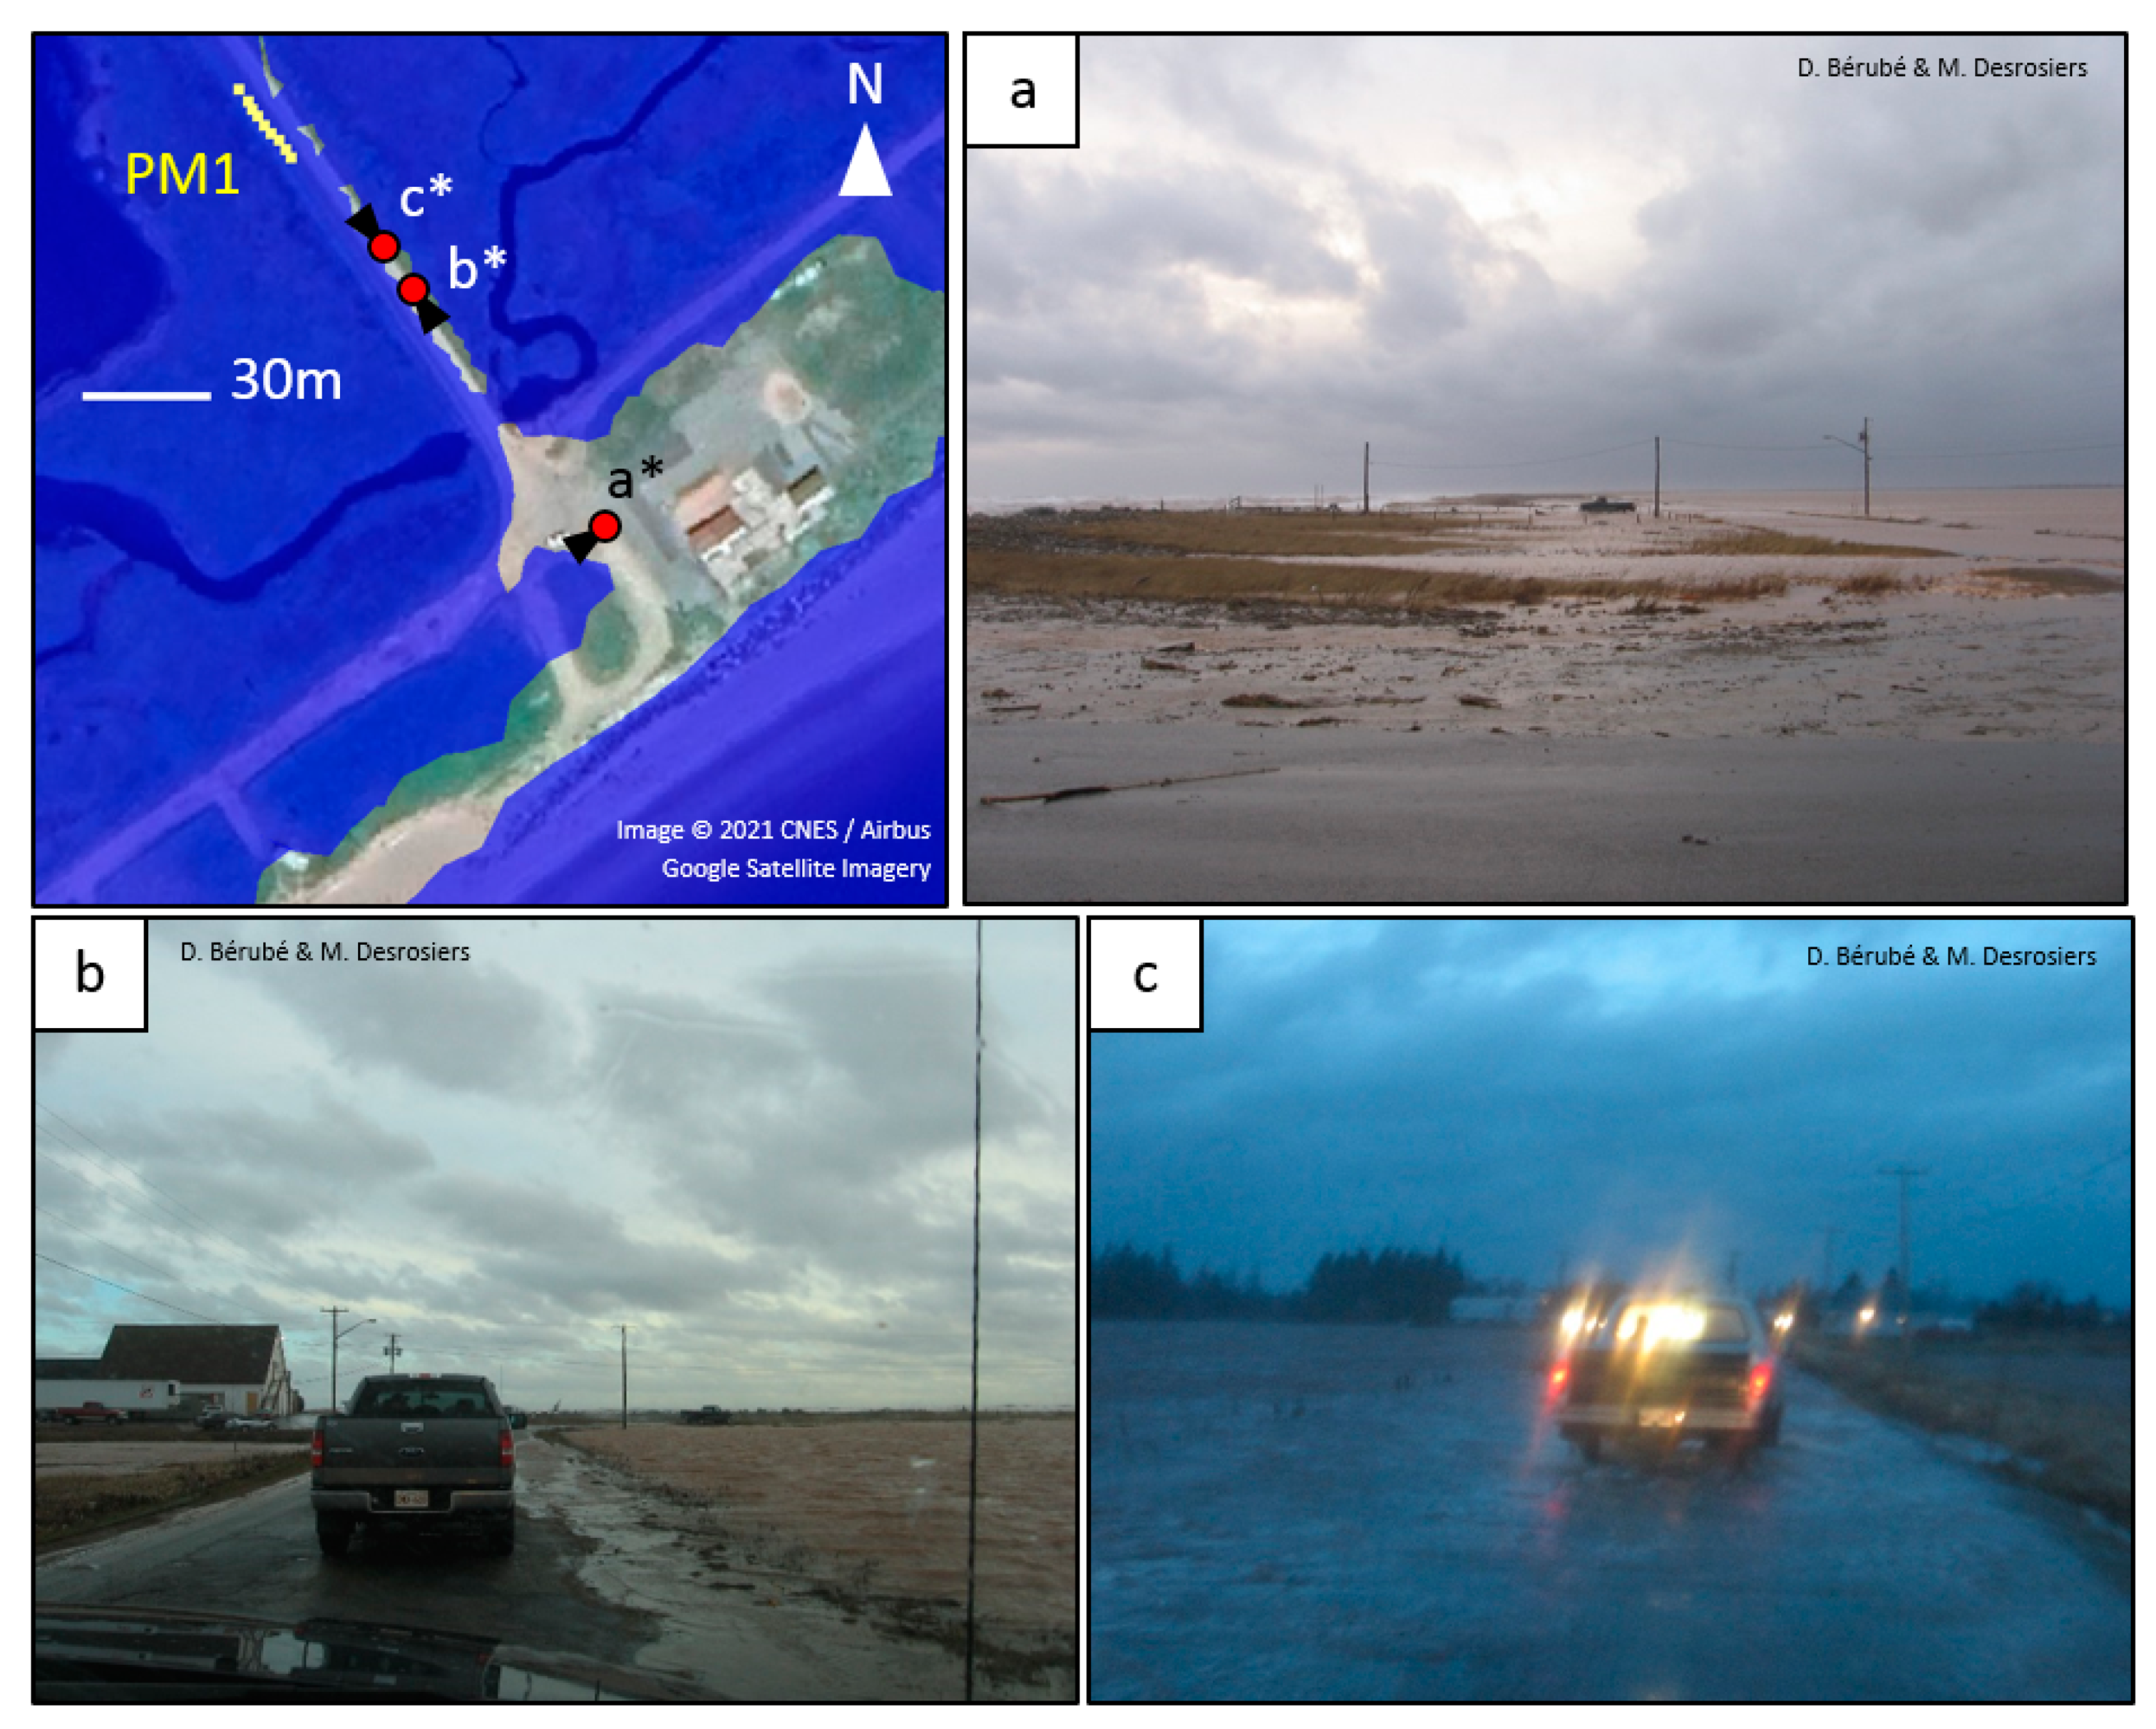
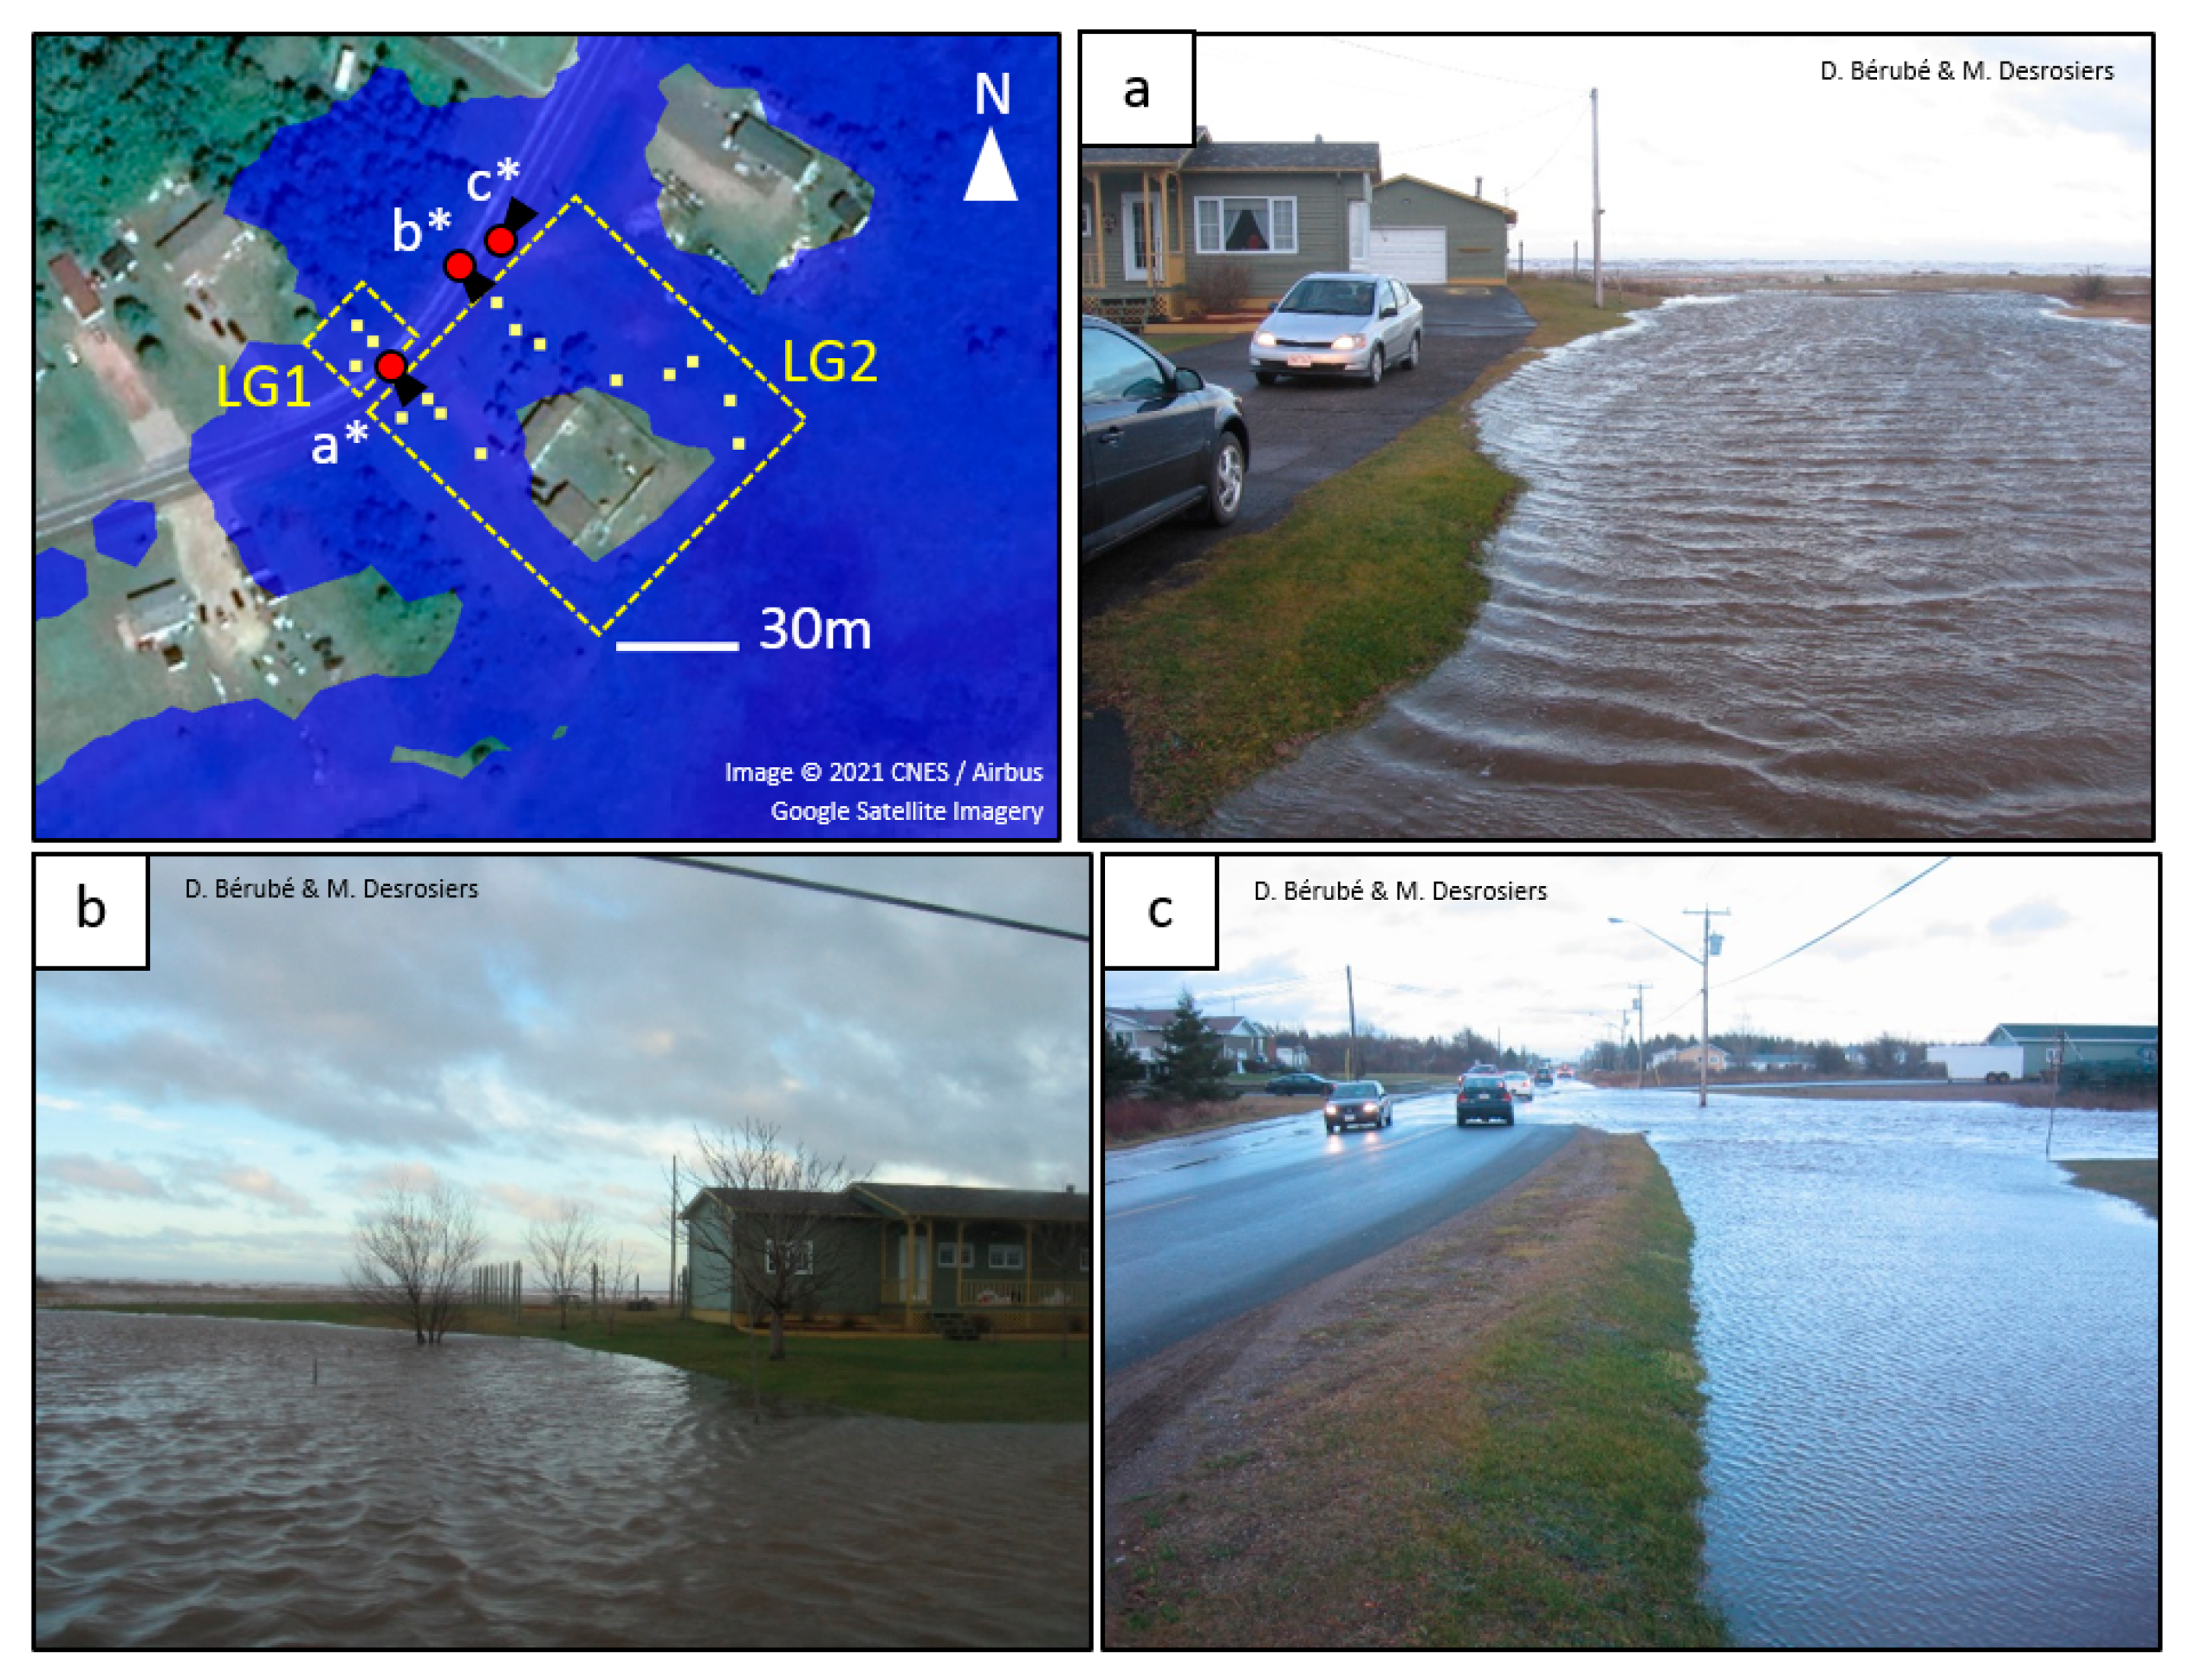
4.2. Comparison with Photographic and Video Evidence

Qualitative assessment of model skill was conducted by comparing modelled results with photographic and video evidence of flooding captured during and after the 6 December 2010 and 21 December 2010 events. The photographic and video evidence permitted assessment of model skill in areas where survey data were not collected and provided a basis for model validation. In general, modelled results agreed well with photographic and video evidence. However, the model overestimated inundation extents at Le Goulet, as apparent from horizontal error values computed for survey locations LG1 and LG2 (Table 1), which were the highest of all locations evaluated. Figure 5, Figure 6 and Figure 7 show modelled results in comparison to photographic and video evidence near Pointe-Brûlée, Baie-de-Petit-Pokemouche, and Le Goulet, respectively; where available, surveyed high-water marks are also shown in yellow.

5. Discussion and Conclusions

5.1. Synthesis

A high-resolution, numerical hydrodynamic model was applied to simulate storm surge-driven coastal flooding at communities on the Acadian Peninsula in eastern Canada. Comparisons of model output to surveyed debris and high-water marks demonstrated that the community-scale inundation model generally produces sub-mesh-resolution horizontal accuracy, with vertical accuracy of approximately 0.34 m. Both horizontal and vertical discrepancies may be explained, in part, by wave contributions to observed high-water marks, which were not included in the community-scale modelling. The largest horizontal error was observed in Le Goulet (LG1 and LG2), which is the site most exposed to waves propagating from the longest north-easterly fetches in the Gulf of Saint Lawrence. Furthermore, model ground elevations incorporate interpolation error. In addition, assumptions and uncertainties pertaining to flood depths required to mobilize and deposit debris may have also contributed to discrepancies. Ultimately, considering the model resolution and aforementioned uncertainties, model skill was deemed acceptable to support community-scale flood hazard assessment.
The presented work illustrates methods to assess model skill using surveyed high-water marks, in conjunction with photographic and video evidence, in lieu of, or supplementary to, proximate tide gauge records. Photographic and video evidence provided valuable information to support qualitative assessment of model skill where survey data were not available. The presented methods, which provide insight into model skill and uncertainty in predicting key flood hazard metrics (i.e., the areal extent and depth, or maximum elevation, of flooding), are conducive to community-scale flood disaster risk management where an understanding of such metrics is required to inform assessment of damages and consequences. Although flood extent and elevations may be inferred from point measurements of water level at tide gauges located on the coast (e.g., using bathtub modelling techniques), such approaches leave many open questions regarding skill in predicting overland flooding pathways, and floodwater interactions with coastal floodplain features, which influence hazards.
Unlike area-based methods for assessing model skill at predicting inundation, which require abundant and expansive data collection (e.g., [2,8,27]), modelled horizontal flood extents were assessed using a distance-based method on discrete clusters of survey data. Furthermore, area-based methods require the selection and application of interpolation methods to fully delineate flood extent, introducing further error and uncertainty to model skill assessment [27].
The presented methods lend gravity to the importance of non-conventional data sources in data-scarce regions and provide motivation to advance research focused on coastal debris detection and delineation through field or remote-sensing techniques.

5.2. Limitations and Future Research Needs

The community-scale hydrodynamic model was designed to simulate elevated water levels caused by tides and storm surge, and resulting flood hazards. The model excluded wave effects (i.e., wave runup, overtopping), morphodynamic effects (e.g., dune erosion or breaching), and their contributions to flood hazards, which are sources of model uncertainty in more exposed, open-coast communities. Integration or coupling of wave and morphodynamic models with the hydrodynamic model could enable improved flood hazard assessment and quantify or reduce these sources of uncertainty.
Debris transport and deposition are affected by the physical properties of the debris, shoreline characteristics, and hydrodynamics [50,51,52]. In this study, sea wrack and shoreline debris were used to support model skill assessment, assuming that they represent a proxy for peak water level elevation and flood extent, following similar assumptions by others [8,26,27,28,29,30]. Future research addressing the processes and mechanisms underlying the transport and deposition of specific debris types in different coastal settings would help to clarify linkages between water levels and deposits of debris, and their utility to support coastal flood hazard assessment.
In this study, photographic and video evidence was used to corroborate the quantitative model skill assessment (relying on debris surveys) in a purely qualitative way. However, recent advancements in video- and imagery-based methods and machine learning techniques to measure bathymetry, depth, and flow velocity offer promise for quantitative assessment [53,54,55,56]. Further advancements in these areas, targeted at assessment of hydraulic parameters and interpretation of photographic evidence of historical flooding, would contribute to improved model skill assessment, particularly in data-scarce regions.
The methods and findings presented in this paper offer guidance on assessing model skill in data-scarce regions where coastal debris persist, albeit based on data for a limited number of storm-driven flooding events on Canada’s Atlantic coast. Further case studies and validation of the presented methods would enable generalization to a broader range of site conditions.

Author Contributions

Conceptualization, S.F. and E.M.; methodology, S.F. and E.M.; formal analysis, S.F. and M.P.; data curation, D.B., M.D. and A.R.; writing—original draft preparation, S.F.; writing—review and editing, J.K., E.M., D.B., M.D., A.R. and M.P. All authors have read and agreed to the published version of the manuscript.

Funding

This work was funded as part of the Coastal Flood Mitigation Canada project by Defence Research and Development Canada through the Canadian Safety and Security Program, with support from the National Research Council of Canada’s Ocean Program.

Data Availability Statement

This study relied on a number of third party datasets, which are referenced in the text; readers are directed to referenced sources for access to data. Some of the data products produced in this study may be available upon request to the authors, subject to intellectual property and data sharing policies of their affiliated institutions. This study relied on data provided by the Canadian Hydrographic Service (CHS), pursuant to CHS MOU No. 2020-0206-1260-NRCC and CHS MOU No. 2021-0805-1260-NRCC. The incorporation of data sourced from CHS in this study shall not be construed as constituting an endorsement by CHS of this study. The products produced in this study do not meet the requirements of the Charts and Nautical Publications Regulations, 1995 or the Navigation Safety Regulations, 2020 under the Canada Shipping Act, 2001. Official charts and publications, corrected and up-to-date, must be used to meet the requirements of those regulations.

Acknowledgments

The authors thank Nicky Hastings, Jackie Yip, Julie Van de Valk, Robert Capozi, Reid McLean, and Maxime Doucet for their helpful contributions to this research. This paper was improved by comments provided by three critical reviewers.

Conflicts of Interest

The authors declare no conflict of interest.

References

  1. Lemmen, D.S.; Warren, F.J.; James, T.S.; Mercer Clarke, C.S.L. (Eds.) Canada’s Marine Coasts in a Changing Climate; Government of Canada: Ottawa, ON, Canada, 2016; ISBN 978-0-660-05052-2.
  2. Bernatchez, P.; Fraser, C.; Lefaivre, D.; Dugas, S. Integrating Anthropogenic Factors, Geomorphological Indicators and Local Knowledge in the Analysis of Coastal Flooding and Erosion Hazards. Ocean. Coast. Manag. 2011, 54, 621–632. [Google Scholar] [CrossRef]
  3. Environment Canada. Impacts of Sea-Level Rise and Climate Change on the Coastal Zone of Southeastern New Brunswick; Environment Canada: Ottawa, ON, Canada, 2006; ISBN 0-662-43947-3.
  4. Murphy, E.; Lyle, T.; Wiebe, J.; Hund, S.V.; Davies, M.; Williamson, D. Coastal Flood Risk Assessment Guidelines for Building and Infrastructure Design; National Research Council Canada: Ottawa, ON, Canada, 2020; ISBN 978-0-660-36745-3.
  5. Apollonio, C.; Bruno, M.F.; Iemmolo, G.; Molfetta, M.G.; Pellicani, R. Flood Risk Evaluation in Ungauged Coastal Areas: The Case Study of Ippocampo (Southern Italy). Water 2020, 12, 1466. [Google Scholar] [CrossRef]
  6. Daigle, R. Sea-Level Rise and Flooding Estimates for New Brunswick Coastal Sections Based on IPCC 5th Assessment Report; R.J. Daigle Enviro: Moncton, NB, Canada, 2017. [Google Scholar]
  7. Aubé, M.; Hébert, C.; Simard, I. Analyse Des Risques d’inondation et d’érosion Dans Les Régions de Grande-Anse, Maisonnette, Bertrand et Caraquet; Institut de Recherche sur les Zones Côtières Inc. & Geomediatix Innovations Inc.: Shippagan, NB, Canada, 2016. [Google Scholar]
  8. Didier, D.; Bernatchez, P.; Boucher-Brossard, G.; Lambert, A.; Fraser, C.; Barnett, R.; Van-Wierts, S. Coastal Flood Assessment Based on Field Debris Measurements and Wave Runup Empirical Model. J. Mar. Sci. Eng. 2015, 3, 560–590. [Google Scholar] [CrossRef]
  9. Hébert, C.; Aubé, M. Évaluation d’options d’adaptation Aux Changements Climatiques: Restauration Des Dunes à Le Goulet; Institut de Recherche sur les Zones Côtières Inc.: Shippagan, NB, Canada, 2015. [Google Scholar]
  10. Robichaud, A.; Simard, I.; Doiron, A.; Chelbi, M. Infrastructures à Risque Dans Trois Municipalités de La Péninsule Acadienne. 2011. Atlantic Climate Adaptation Solutions Association. Available online: https://atlanticadaptation.ca/en/islandora/object/acasa%253A653 (accessed on 27 May 2021).
  11. Natural Resources Canada. Federal Flood Damage Estimation Guidelines for Buildings and Infrastructure-Version 1.0; Government of Canada: Ottawa, ON, Canada, 2021.
  12. Rangel-Buitrago, N.; Anfuso, G. Risk Assessment of Storms in Coastal Zones: Case Studies from Cartagena (Colombia) and Cadiz (Spain); Springer: Heidelberg, Germany, 2015; ISBN 978-3-319-15843-3. [Google Scholar]
  13. Webster, T.L.; Forbes, D.L.; MacKinnon, E.; Roberts, D. Flood-Risk Mapping for Storm-Surge Events and Sea-Level Rise Using Lidar for Southeast New Brunswick. Can. J. Remote Sens. 2006, 32, 194–211. [Google Scholar] [CrossRef]
  14. Creach, A.; Chevillot-miot, E.; Mercier, D.; Pourinet, L. Vulnerability to Coastal Flood Hazard of Residential Buildings on Noirmoutier Isalnd (France). J. Maps 2016, 12, 371–381. [Google Scholar] [CrossRef]
  15. Aucelli, P.P.C.; Di Paola, G.; Incontri, P.; Rizzo, A.; Vilardo, G.; Benassai, G.; Buonocore, B.; Pappone, G. Coastal Inundation Risk Assessment Due to Subsidence and Sea Level Rise in a Mediterranean Alluvial Plain (Volturno Coastal Plain–Southern Italy). Estuar. Coast. Shelf Sci. 2017, 198, 597–609. [Google Scholar] [CrossRef]
  16. Didier, D.; Baudry, J.; Bernatchez, P.; Dumont, D.; Sadegh, M.; Bismuth, E.; Bandet, M.; Dugas, S.; Sévigny, C. Multihazard Simulation for Coastal Flood Mapping: Bathtub versus Numerical Modelling in an Open Estuary, Eastern Canada. J. Flood Risk Manag. 2019, 12, e12505. [Google Scholar] [CrossRef]
  17. Barnard, P.L.; van Ormondt, M.; Erikson, L.H.; Eshleman, J.; Hapke, C.; Ruggiero, P.; Adams, P.N.; Foxgrover, A.C. Development of the Coastal Storm Modeling System (CoSMoS) for Predicting the Impact of Storms on High-Energy, Active-Margin Coasts. Nat. Hazards 2014, 74, 1095–1125. [Google Scholar] [CrossRef]
  18. Resio, D.T.; Westerink, J.J. Modeling the Physics of Storm Surges. Phys. Today 2008, 61, 33–38. [Google Scholar] [CrossRef] [Green Version]
  19. Muis, S.; Verlaan, M.; Winsemius, H.C.; Aerts, J.C.J.H.; Ward, P.J. A Global Reanalysis of Storm Surges and Extreme Sea Levels. Nat. Commun. 2016, 7, 11969. [Google Scholar] [CrossRef] [Green Version]
  20. Ferrarin, C.; Roland, A.; Bajo, M.; Umgiesser, G.; Cucco, A.; Davolio, S.; Buzzi, A.; Malguzzi, P.; Drofa, O. Tide-Surge-Wave Modelling and Forecasting in the Mediterranean Sea with Focus on the Italian Coast. Ocean. Model. 2013, 61, 38–48. [Google Scholar] [CrossRef] [Green Version]
  21. Postacchini, M.; Lalli, F.; Memmola, F.; Bruschi, A.; Bellafiore, D.; Lisi, I.; Zitti, G.; Brocchini, M. A Model Chain Approach for Coastal Inundation: Application to the Bay of Alghero. Estuar. Coast. Shelf Sci. 2019, 219, 56–70. [Google Scholar] [CrossRef]
  22. Federal Emergency Management Agency. Guidance for Flood Risk Analysis and Mapping: Coastal Water Levels; Federal Emergency Management Agency: Washington, DC, USA, 2016.
  23. Valorēs the Reality of the Acadian Peninsula. Available online: https://adaptationpa.ca/en/adaptation-pa/the-reality-of-the-acadian-peninsula (accessed on 6 May 2021).
  24. Fisheries and Oceans Canada Canadian Tides and Water Levels Data Archive. Available online: https://www.meds-sdmm.dfo-mpo.gc.ca/isdm-gdsi/twl-mne/index-eng.htm# (accessed on 16 July 2019).
  25. Statistics Canada Census Profile. 2016 Census. Statistics Canada Catalogue No. 98-316-X2016001. Available online: https://www12.statcan.gc.ca/census-recensement/2016/dp-pd/prof/index.cfm?Lang=E (accessed on 7 May 2021).
  26. Kim, J.; Murphy, E.; Nistor, I.; Ferguson, S.; Provan, M. Numerical Analysis of Storm Surges on Canada’s Western Arctic Coastline. J. Mar. Sci. Eng. 2021, 9, 326. [Google Scholar] [CrossRef]
  27. Melton, G.; Gall, M.; Mitchell, J.T.; Cutter, S.L. Hurricane Katrina Storm Surge Delineation: Implications for Future Storm Surge Forecasts and Warnings. Nat. Hazards 2010, 54, 519–536. [Google Scholar] [CrossRef]
  28. Jardine, D.E.; Wang, X.; Fenech, A.L. Highwater Mark Collection after Post Tropical Storm Dorian and Implications for Prince Edward Island, Canada. Water 2021, 13, 3201. [Google Scholar] [CrossRef]
  29. Harper, J.R.; Henry, R.F.; Stewart, G.G. Maximum Storm Surge Elevations in the Tuktoyaktuk Region of the Canadian Beaufort Sea. Arctic 1988, 41, 48–52. [Google Scholar] [CrossRef]
  30. MacLeod, R.F.; Dallimore, S.R. Assessment of Storm Surge History as Recorded by Driftwood in the Mackenzie Delta and Tuktoyaktuk Coastlands, Arctic Canada. Front. Earth Sci. 2021, 9, 698660. [Google Scholar] [CrossRef]
  31. Hervouet, J.M. Hydrodynamics of Free Surface Flows: Modelling with the Finite Element Method; John Wiley & Sons, Ltd.: Chichester, West Sussex, UK, 2007; ISBN 978-0-470-03558-0. [Google Scholar]
  32. Provan, M.; Ferguson, S.; Murphy, E. Storm Surge Contributions to Flood Hazards on Canada’s Atlantic Coast. J. Flood Risk Manag. 2022. Submitted. Available online: https://0-www-mdpi-com.brum.beds.ac.uk/journal/water/instructions#references (accessed on 27 May 2021).
  33. Canadian Hydrographic Service Non-Navigational (NONNA-100) Bathymetric Data. Available online: https://open.canada.ca/data/en/dataset/d3881c4c-650d-4070-bf9b-1e00aabf0a1d (accessed on 15 July 2019).
  34. GEBCO Compilation Group GEBCO 2019 Grid. 2019. Available online: https://0-doi-org.brum.beds.ac.uk/10.5285/836f016a-33be-6ddc-e053-6c86abc0788e (accessed on 23 July 2019).
  35. Hersbach, H.; Bell, B.; Berrisford, P.; Biavati, G.; Horányi, A.; Muñoz Sabater, J.; Nicolas, J.; Peubey, C.; Radu, R.; Rozum, I.; et al. ERA5 Hourly Data on Single Levels from 1979 to Present. Copernicus Climate Change Service (C3S) Climate Data Store (CDS). Available online: https://0-doi-org.brum.beds.ac.uk/10.24381/cds.adbb2d47 (accessed on 9 December 2019).
  36. Egbert, G.D.; Erofeeva, S.Y. Efficient Inverse Modeling of Barotropic Ocean Tides. J. Atmos. Ocean. Technol. 2002, 19, 183–204. [Google Scholar] [CrossRef] [Green Version]
  37. Foreman, M.G.G. Manual for Tidal Heights Analysis and Prediction; Department of Fisheries and Oceans, Institue of Ocean Sciences: Sidney, BC, Canada, 1977. [Google Scholar]
  38. Canadian Hydrographic Service Nautical Charts. Available online: https://www.charts.gc.ca/charts-cartes/nautical-marines-eng.html (accessed on 17 August 2021).
  39. Government of New Brunswick 2018 Digital Elevation Model. Available online: https://geonb.snb.ca/nbdem/ (accessed on 5 May 2020).
  40. Government of New Brunswick SNB 2018 LiDAR AOI 2. Available online: https://geonb.snb.ca/li/ (accessed on 1 June 2020).
  41. Government of New Brunswick Wetlands. Available online: http://www.snb.ca/geonb1/e/DC/RW.asp (accessed on 19 August 2020).
  42. Government of New Brunswick Forest. Available online: http://www.snb.ca/geonb1/e/DC/forest.asp (accessed on 5 December 2019).
  43. Government of New Brunswick Non-Forest. Available online: http://www.snb.ca/geonb1/e/DC/non-forest.asp (accessed on 5 December 2019).
  44. Chin, D.A. Water Resources Engineering, 3rd ed.; Pearson Education Inc.: Upper Saddle River, NJ, USA, 2013; ISBN 0-13-283321-2. [Google Scholar]
  45. Houghtalen, R.J.; Akan, A.O.; Hwang, N.H.C. Fundamentals of Hydraulic Engineering Systems, 4th ed.; Prentice Hall: Upper Saddle River, NJ, USA, 2010. [Google Scholar]
  46. Leica Geosystems Leica Viva GS15 Data Sheet. Available online: https://leica-geosystems.com/-/media/files/leicageosystems/products/datasheets/leica_viva_gs15_ds.ashx?la=de-de (accessed on 21 January 2022).
  47. Government of Canada GPS·H. Available online: https://webapp.geod.nrcan.gc.ca/geod/tools-outils/gpsh.php (accessed on 5 November 2021).
  48. Doucet, M. Inondation Du 21 Décembre 2010 (Le Goulet) (Haut-Shippagan). YouTube. Available online: https://www.youtube.com/watch?v=GaL_tjc6sbM (accessed on 14 May 2021).
  49. Braudrick, C.A.; Grant, G.E. When Do Logs Move in Rivers? Water Resour. Res. 2000, 36, 571–583. [Google Scholar] [CrossRef] [Green Version]
  50. Orr, M.; Zimmer, M.; Jelinski, D.E.; Mews, M. Wrack Deposition on Different Beach Types: Spatial and Temporal Variation in the Pattern of Subsidy. Ecology 2005, 86, 1496–1507. [Google Scholar] [CrossRef]
  51. Oldham, C.; McMahon, K.; Brown, E.; Bosserelle, C.; Lavery, P. A Preliminary Exploration of the Physical Properties of Seagrass Wrack That Affect Its Offshore Transport, Deposition, and Retention on a Beach. Limnol. Oceanogr. Fluids Environ. 2014, 4, 120–135. [Google Scholar] [CrossRef]
  52. Murphy, E.; Nistor, I.; Cornett, A.; Wilson, J.; Pilechi, A. Fate and Transport of Coastal Driftwood: A Critical Review. Mar. Pollut. Bull. 2021, 170, 112649. [Google Scholar] [CrossRef]
  53. Brodie, K.L.; Palmsten, M.L.; Hesser, T.J.; Dickhudt, P.J.; Raubenheimer, B.; Ladner, H.; Elgar, S. Evaluation of Video-Based Linear Depth Inversion Performance and Applications Using Altimeters and Hydrographic Surveys in a Wide Range of Environmental Conditions. Coast. Eng. 2018, 136, 147–160. [Google Scholar] [CrossRef] [Green Version]
  54. Perugini, E.; Soldini, L.; Palmsten, M.L.; Calantoni, J.; Brocchini, M. Linear Depth Inversion Sensitivity to Wave Viewing Angle Using Synthetic Optical Video. Coast. Eng. 2019, 152, 103535. [Google Scholar] [CrossRef]
  55. Ansari, S.; Rennie, C.D.; Jamieson, E.C.; Seidou, O.; Clark, S.P. Machine Learning Based Surface Velocimetry. In Proceedings of the EGU General Assembly 2021, Online, 19–30 April 2021. [Google Scholar]
  56. Ansari, S.; Rennie, C.D.; Venditti, J.G.; Kwoll, E.; Fairweather, K. Shore-Based Monitoring of Flow Dynamics in a Steep Bedrock Canyon River. E3S Web Conf. 2018, 40, 06025. [Google Scholar] [CrossRef] [Green Version]
Figure 1. Study location. The image on the left shows the Acadian Peninsula (yellow box) within the broader extent of Atlantic Canada. The image on the right shows selected communities from the Acadian Peninsula where inundation modelling was completed using a fine-resolution, community-scale hydrodynamic model; population estimates are shown in parentheses [25].
Water 14 00589 g001
Figure 2. Data available to support model skill assessment. High-water-mark survey data are shown as yellow points. General areas where photographic or video evidence were available are shown with white boxes. Short-form identification labels assigned to high-water-mark survey locations are shown: BC = Bas-Caraquet; PB = Pointe-Brûlée; SH = Shippagan; SG = Shippgan Gully; LG = Le Goulet; PM = Baie-de-Petit-Pokemouche.
Water 14 00589 g002
Figure 3. Model skill assessment for the 6 December 2010 flood event in (a,b) Shippagan and Shippagan Gully, and the 21 December 2010 event in (c,d) Pointe-Brûlée and Bas-Caraquet. Surveyed high-water marks are shown in yellow, and the area lying within the 5 cm flood depth contour is shown in blue.
Water 14 00589 g003
Figure 4. Assessment of (a) vertical and (b) horizontal model skill. The solid line in (a) represents equality of measured and modelled elevations, and the dashed lines represent RMSE of model ground elevations compared to measured point elevations from the high-water-mark survey. Points in (a) indicate computed averages, and boxes indicate the range of modelled and measured elevations at each location. Values in (b) are normalized by the model element edge length (i.e., 10 m). Colors indicate matching locations.
Water 14 00589 g004
Figure 5. Modelled results for the 21 December 2010 event in Pointe-Brûlée compared to (a) video evidence of flooding (video frame extracted from a YouTube video uploaded by a local resident [48]). Approximate observer location and direction of view are shown by the red icon. Video frame (a) coincides with observer location (a*). Survey data in the vicinity of the video evidence are shown in yellow.
Water 14 00589 g005
Figure 6. Modelled results for the 6 December 2010 event in Baie-de-Petit-Pokemouche compared to (ac) photographic evidence. Approximate observer location and direction of view are shown by the red icons. Photographs (a), (b) and (c) coincide with observer locations (a*), (b*) and (c*), respectively. Survey data in the vicinity of the photographic evidence are shown in yellow.
Water 14 00589 g006
Figure 7. Modelled results for the 6 December 2010 event in Le Goulet compared to (ac) photographic evidence. Approximate observer location and direction of view are shown by the red icons. Photographs (a), (b) and (c) coincide with observer locations (a*), (b*) and (c*), respectively. Survey data in the vicinity of the photographic evidence are shown in yellow.
Water 14 00589 g007
Table 1. Comparison of modelled and measured flood elevations and extents.
LocationEventSpatial Average Vertical Error (m) (Model-Survey)Spatial Average Horizontal Error (m)
PM16 December 20100.015.54
LG16 December 20100.3811.33
LG26 December 20100.3615.43
SG16 December 20100.676.00
SG26 December 20100.494.97
SH16 December 20100.406.94
PB121 December 2010−0.062.20
PB221 December 2010−0.062.85
PB321 December 20100.334.79
PB421 December 20100.295.45
PB521 December 20100.105.33
BC121 December 2010−0.242.73
BC221 December 2010−0.287.64
Publisher’s Note: MDPI stays neutral with regard to jurisdictional claims in published maps and institutional affiliations.

