1. Introduction
The basin rainfall–runoff conversion process exhibits a complex nonlinear relationship in all soil types, and this relationship is mainly controlled by two processes: runoff yield and concentration, in which the runoff yield process is the basis and core of hydrological simulation [
1,
2,
3,
4]. Runoff yield calculation refers to the process of converting precipitation into net rainfall after deducting various losses such as plant retention, evaporation, infiltration, and puddle filling. Among them, soil infiltration calculation is the key to runoff yield calculation and one of the most important and complex aspects of the hydrological cycle [
5,
6].
Soil moisture infiltration refers to the process of water infiltration through the surface into the soil, which is an important link in the conversion of precipitation and surface water into soil water and groundwater, and is a complex, dynamic process influenced by many factors [
7]. In runoff yield and concentration calculations, soil infiltration is an important loss in the process of rainfall–runoff transformation and an important component in hydrologic simulations, and accurate calculation of infiltration would effectively improve the accuracy of runoff simulation. At the same time, the properties of soil will change during the process of soil infiltration, and the increase in soil volume content and pore pressure will lead to the occurrence of soil landslides. Therefore, accurate calculation of soil infiltration is of great significance for flood control and flood mitigation [
8]. In addition, the transport of soil water and pollutants during soil infiltration affects regional groundwater resources and water quality, and quantifying the factors affecting the infiltration rate can provide a basis for the calculation of groundwater resources in water-scarce areas [
9]. Overall, soil infiltration is a crucial process in a variety of studies, including hydrology, hydraulic engineering, agriculture, and pollutant transfer [
10]. As a result, a number of scientists have researched soil infiltration.
At present, the research on the factors influencing infiltration is mainly divided into two types: soil characteristics (soil texture, structure, bulk density, etc.) and external factors (initial soil water content, rainfall process, land use type, etc.). Research on the dynamic variables of the infiltration process is relatively focused on the changes in infiltration rate, soil moisture content, and rainfall duration. Among them, the infiltration rate and soil moisture content have a complex interaction: as the infiltration process proceeds, infiltration increases soil moisture content, which in turn affects the rate of infiltration. The infiltration rate and soil moisture content interact with each other, and this relationship develops over time.
However, most existing infiltration studies have focused on the relationship between two variables, infiltration rate and rain duration, which is a comprehensive expression of the variation in infiltration rate with soil moisture content and soil moisture content with rain duration, ignoring the importance of the complex interaction between infiltration rate and soil moisture content. Empirical models such as the Horton equation and the Soil Conservation Service Curve (SCS), for example, describe the empirical relationship between infiltration rate and rain duration or rainfall and runoff without considering the relationship between infiltration rate and soil moisture content [
11,
12,
13]. The Green–Ampt model is a classical model of saturated soil infiltration which assumes that the infiltration process is similar to “piston motion” and the infiltrated soil has only two soil moisture content states: the saturated soil moisture content above the wetting front and the initial soil moisture content below the wetting front, which cannot be directly used to study the relationship between infiltration rate and soil moisture content [
14,
15,
16,
17,
18]. Richards’ equation is the basic equation describing moisture movement of unsaturated soil; it describes the physical process of infiltration and soil moisture movement through
K(
θ) (relationship between hydraulic conductivity and soil moisture content) and
ψ(
θ) (relationship between matrix potential and soil moisture content), but due to the problems of more and less accessible model parameters and complicated model solutions, it is difficult to give a simple relationship between infiltration rate and soil moisture content directly in Richards’ equation [
19,
20,
21,
22]. Therefore, there is an absence of a clear description of the relationship between infiltration rate and soil moisture content, which does not provide a good solution to the questions of how the infiltration rate varies with soil moisture content and what the main factors influencing this variation process are.
The objectives of this paper were to (1) deduce and verify the equation of the relationship between infiltration rate and soil moisture content, (2) analyze the effect of initial soil moisture content on the relationship between infiltration rate and soil moisture content, and (3) quantify the effect of initial soil moisture content on the relationship between infiltration rate and soil moisture content.
2. Materials and Methods
2.1. Experimental Data of Infiltration and Soil Moisture
In order to obtain high-precision infiltration rate and layered soil moisture change data, an artificial rainfall infiltration experiment apparatus was designed. This experiment apparatus consisted of three parts, in which an automatic rainfall simulation system provided a stable and spatially uniform rainfall event with rainfall intensity of 0.5 to 3.5 mm/min, a test chamber consisted of loam soil (based on the USDA textural triangle), and a data acquisition system was used to record infiltration rate and layered soil moisture content data (5, 10, 15, 20, and 25 cm below the soil surface) once per minute. A detailed introduction of the experiment system can be found in [
23].
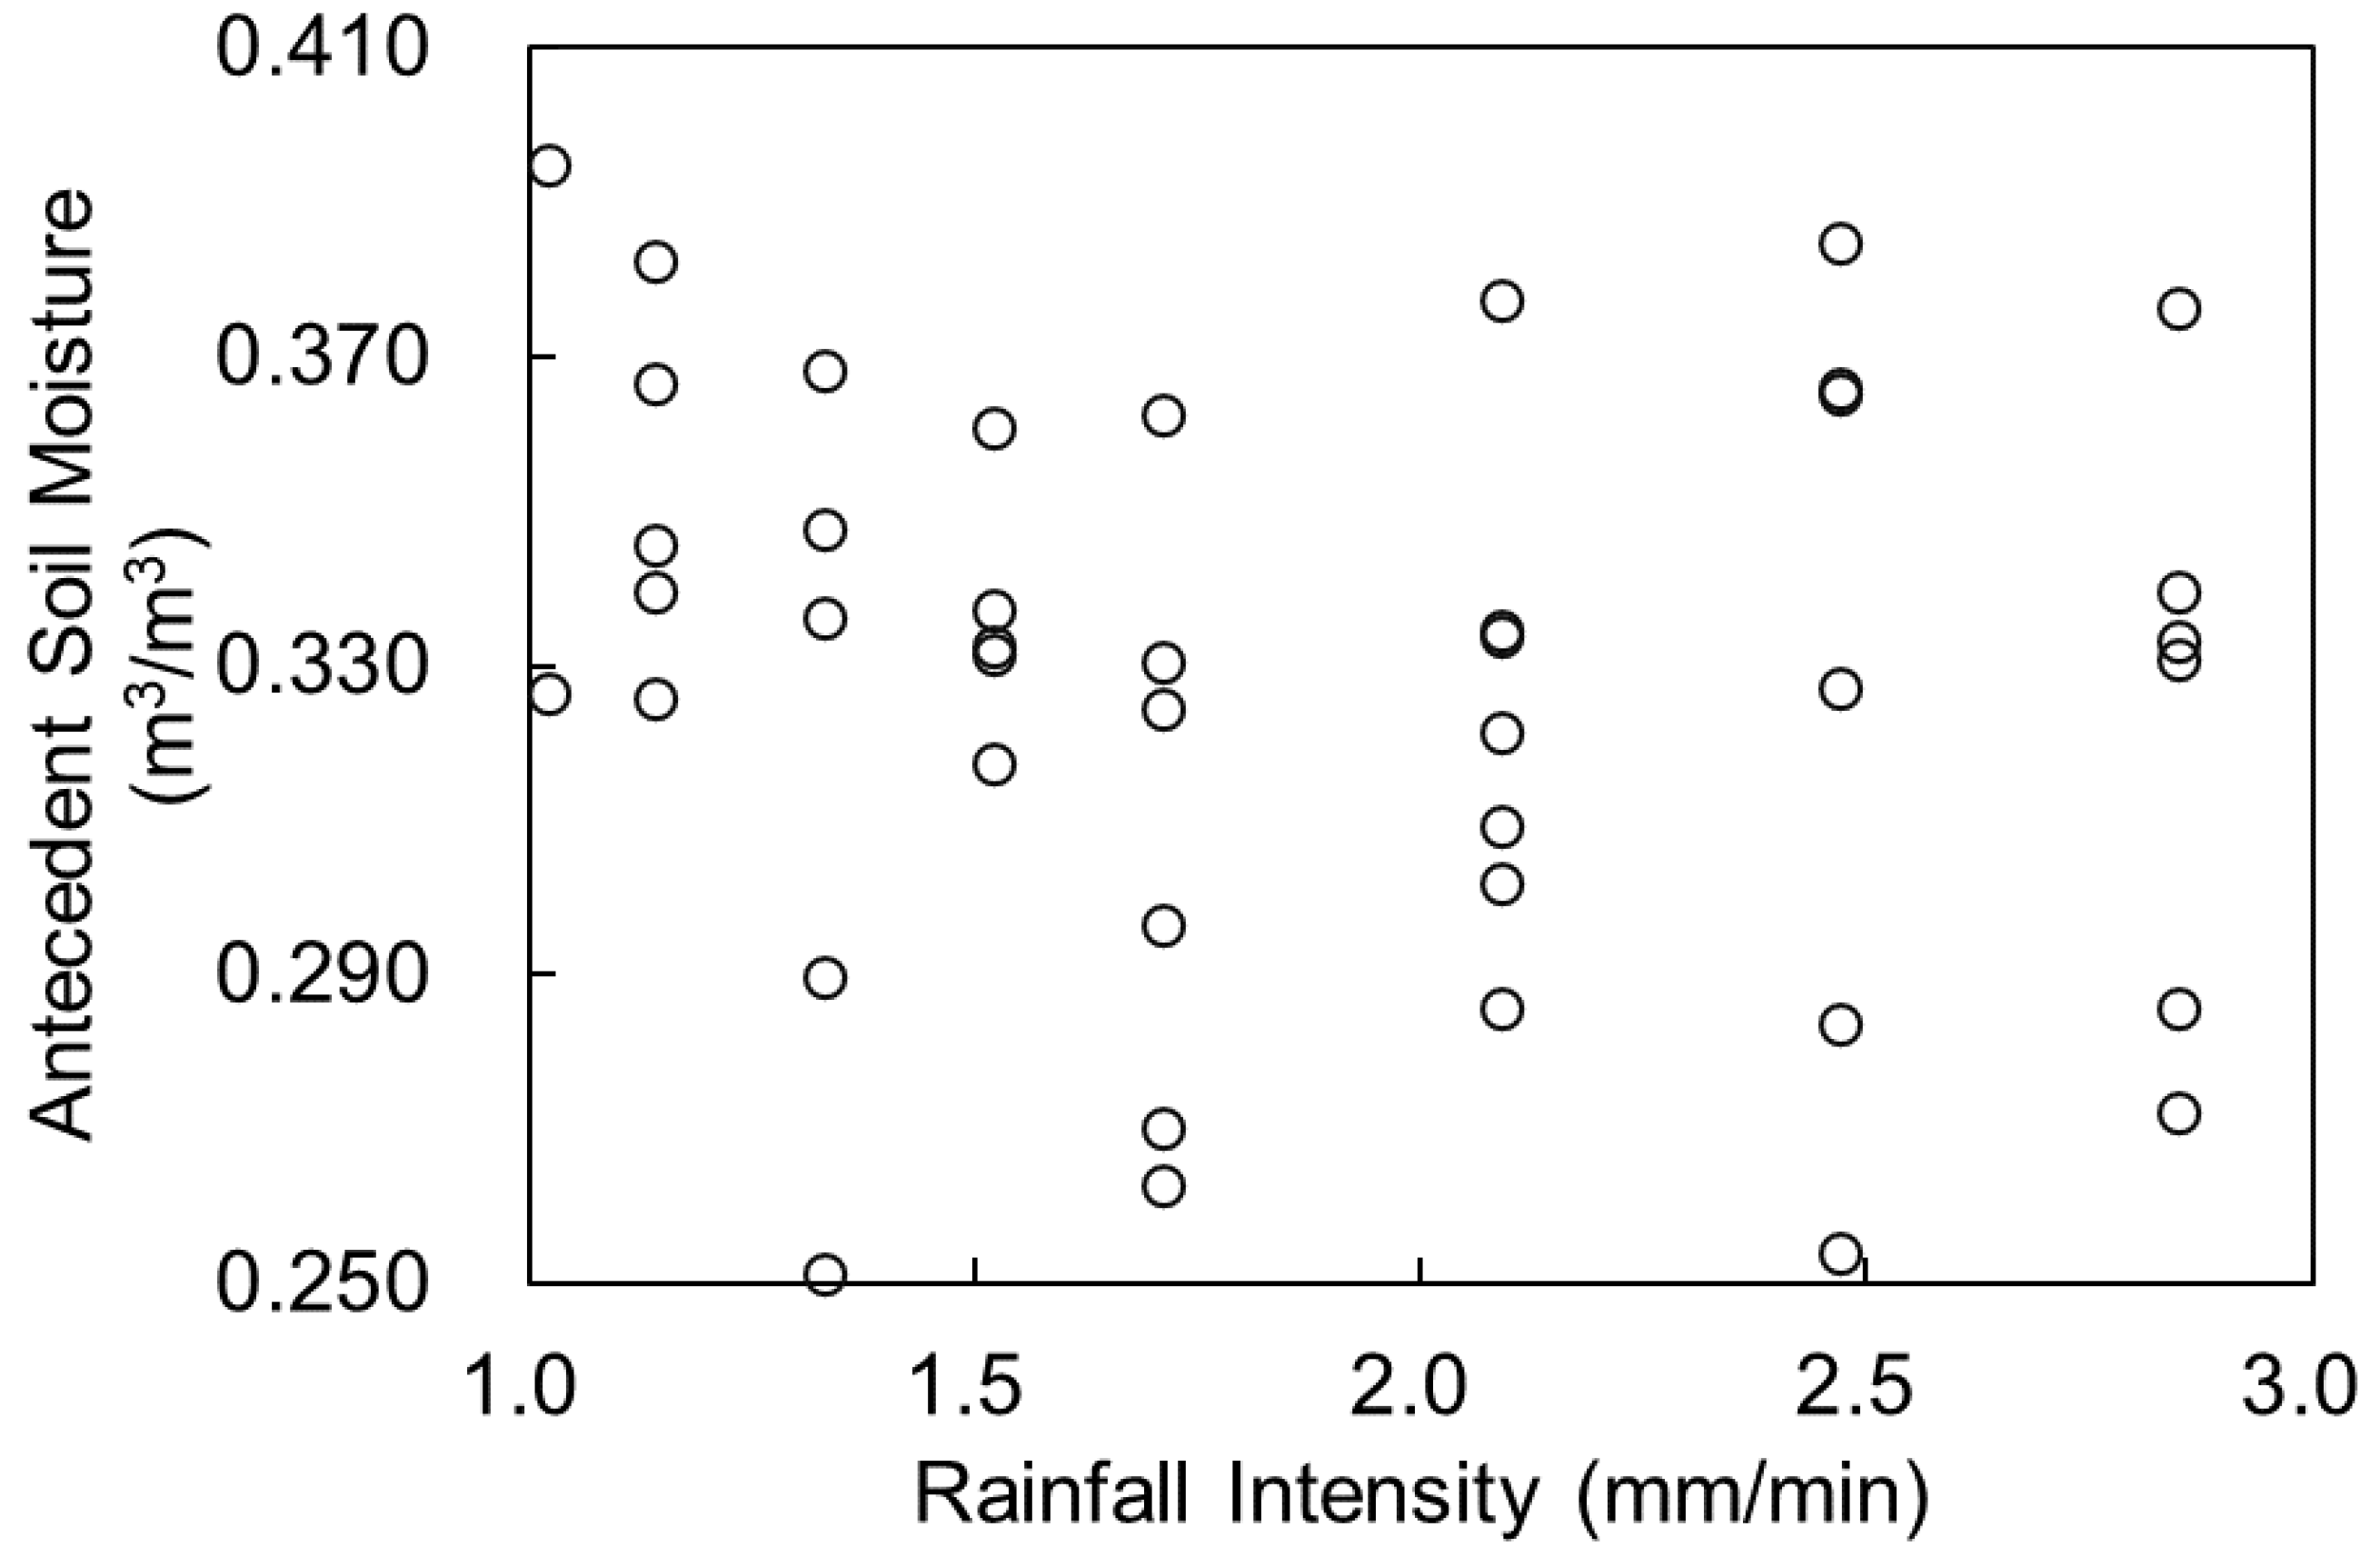
Using this experimental system, considering different rainfall intensities and initial soil moisture contents, 42 experiments were conducted. The range of rainfall intensity was 1.0 to 3.0 mm/min, and the range of initial soil moisture content was 0.25 to 0.41 m
3/m
3 and was taken with reference to the wilting moisture content and the field capacity. The specific experimental scenarios, which comprehensively cover the common rainfall intensities and initial soil moisture contents, are shown in
Figure 1.
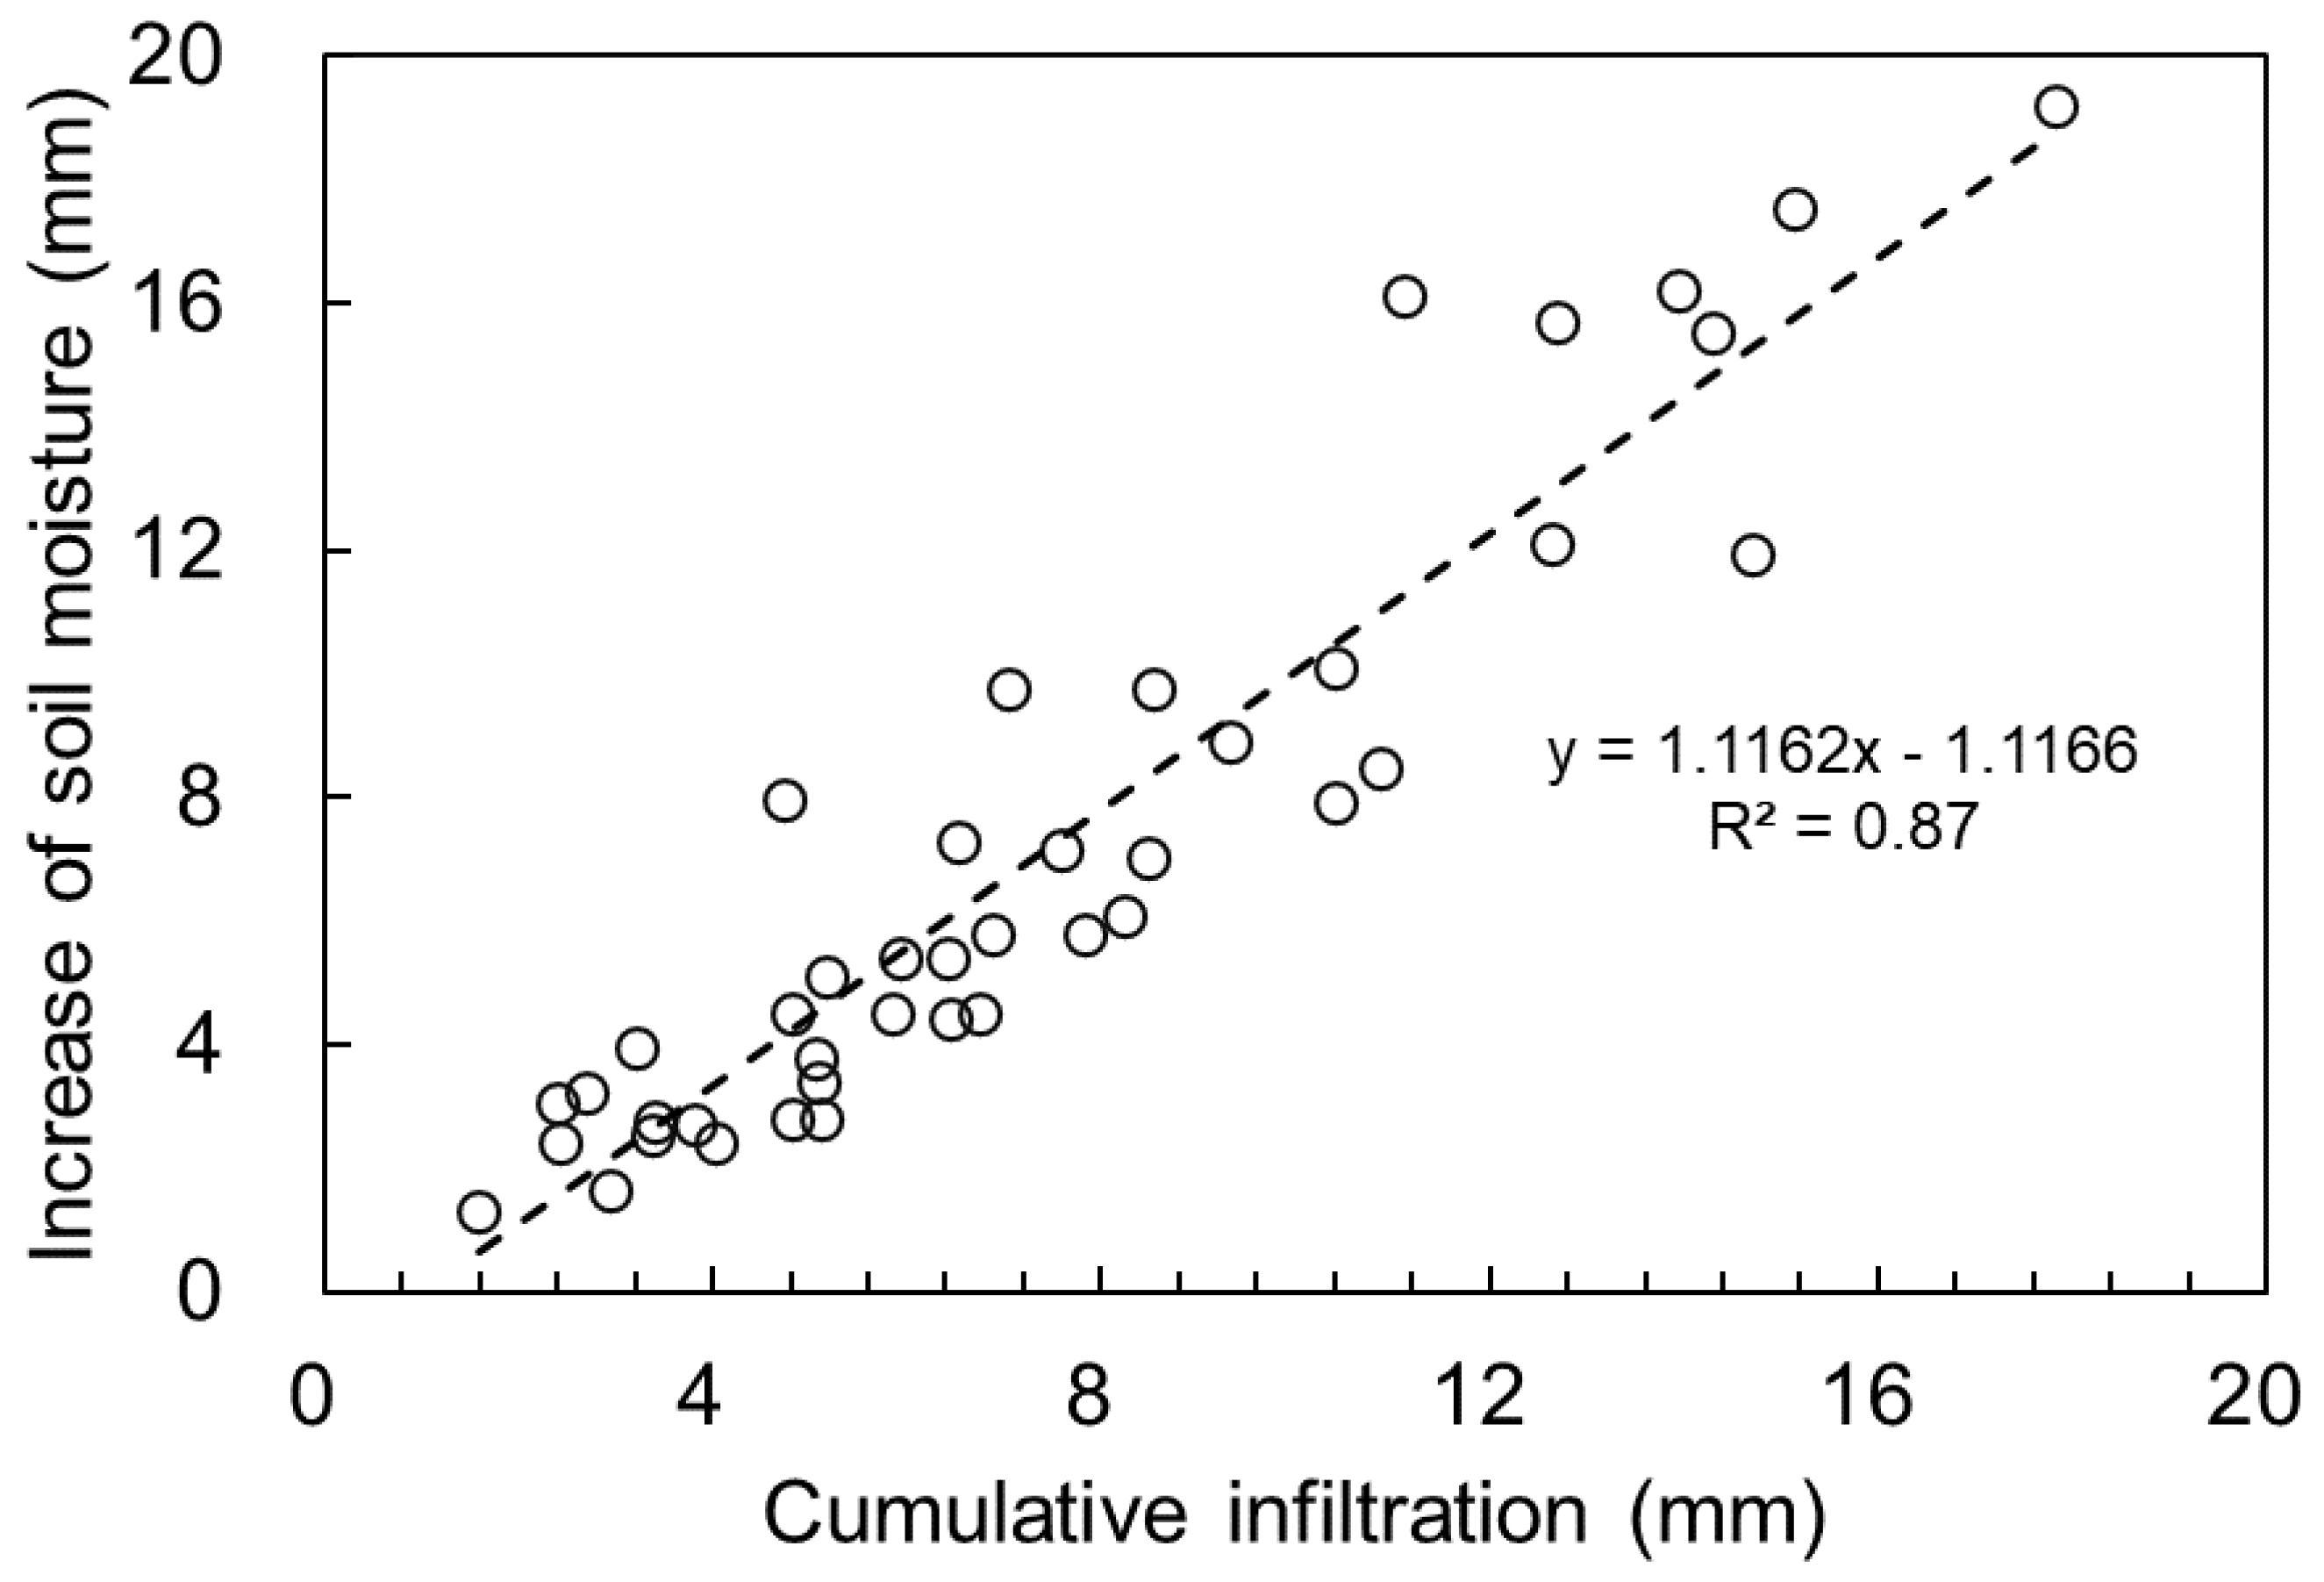
In order to verify the accuracy of the experimental data, water balance analysis was carried out first. In the analysis, the time period before the wetting front arriving at the depth of 25 cm was chosen. It ranged from 5 to 20 min with different rainfall intensities and soil moisture contents. The increase in soil moisture content reflected by four soil moisture sensors (i.e., Decagon EC-5,
https://www.metergroup.com/environment/products/ec-5-soil-moisture-sensor/ accessed on 20 March 2022) at the depth of 0–20 cm was compared with the measured cumulative infiltration which was calculated by subtracting the outflow from the rainfall. Results of water balance analysis in 42 experiments are shown in
Figure 2. The volume error between measured cumulative infiltration and the increase in soil moisture content is 3.5%, and the coefficient of determination (R
2) is 0.87, indicating a high accuracy.
2.2. Derivation of Infiltration Rate and Soil Moisture Equation
By assuming that the change in infiltration rate obeys the nature of the exhaustion process, the famous empirical infiltration equation was obtained by analyzing the experimental data [
11], and the original Horton equation is given as follows:
where
f is the infiltration rate;
t is the rainfall duration;
f0 and
fc are the initial infiltration and stable infiltration rates, respectively; and
k is the soil-specific decay constant.
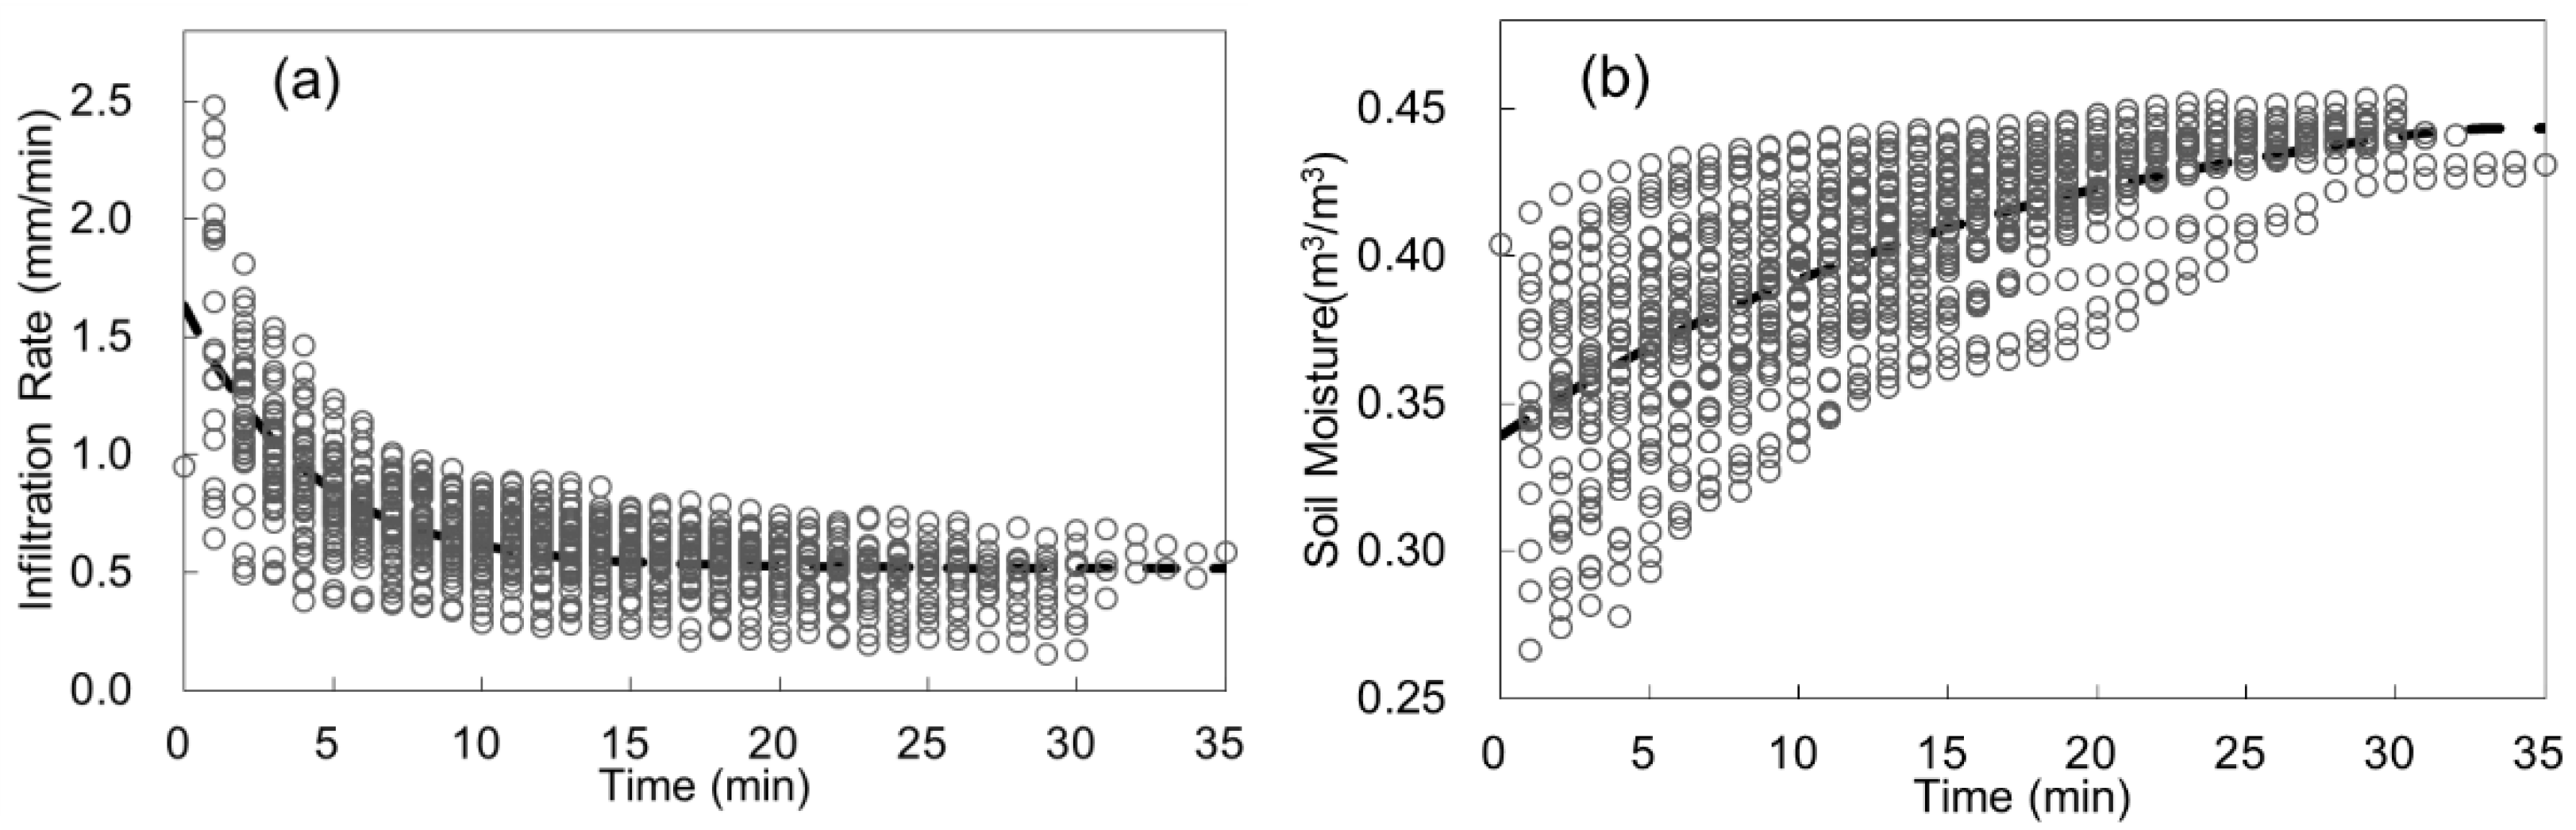
According to the Horton equation, when rainfall continues, the infiltration rate decreases continuously from the initial infiltration rate to the stable infiltration rate and the deceleration declines gradually. In these experiments, the infiltration rate, which is equal to the cumulative infiltration divided by the rainfall duration, also confirms this law well, as shown in
Figure 3a.
In addition, in the process of infiltration, while the infiltration rate keeps decreasing, the cumulative infiltration keeps increasing, and the soil moisture content gradually increases from the initial soil moisture content to the saturated soil moisture content. The rate of increase is decreasing. The experimental results are also consistent with this rule, as shown in
Figure 3b. Therefore, we can use the form of the Horton infiltration equation to describe the similar process of change in soil moisture content with time.
where
θ is soil moisture;
and
θS are the initial and saturated soil moisture, respectively. Therefore,
t can be derived as follows:
As one of the most widely used physical infiltration equations, Philip’s equation can express the process of change in infiltration rate with time and reflect the influence of initial moisture content on the subsequent infiltration process [
24]. It has a simple form:
where C is a constant parameter that varies from one-half to three-quarters of the value of
fc and is independent of the initial condition of the soil;
S is referred to as the soil sorptivity and is a function of the initial soil moisture content [
24,
25].
The relationship between soil moisture content and infiltration rate can be obtained by bringing Equation (3) into Equation (4):
Setting
, we can obtain the equation of infiltration rate and soil moisture content:
For a specific soil structure, and C are constant. Therefore, the relationship between soil moisture content and infiltration rate is mainly affected by the initial moisture content (), and the key to the analysis of the quantitative impact is the determination of .
3. Results
3.1. Relationship between Soil Moisture Content and Rainfall Duration
The relationship between soil moisture content and rainfall duration can be expressed by Equation (2). The fitting effect on the comprehensive dataset of 42 experiments is shown in
Figure 3b, with the R
2 value of 0.49, indicating an unsatisfactory accuracy. The main reason is that the
is an important parameter in Equation (2), and it changes from 0.25 to 0.41 in different experiments. Therefore, it is necessary to fit the experimental data of each field separately in order to evaluate the fitting effect of Equation (2) accurately.
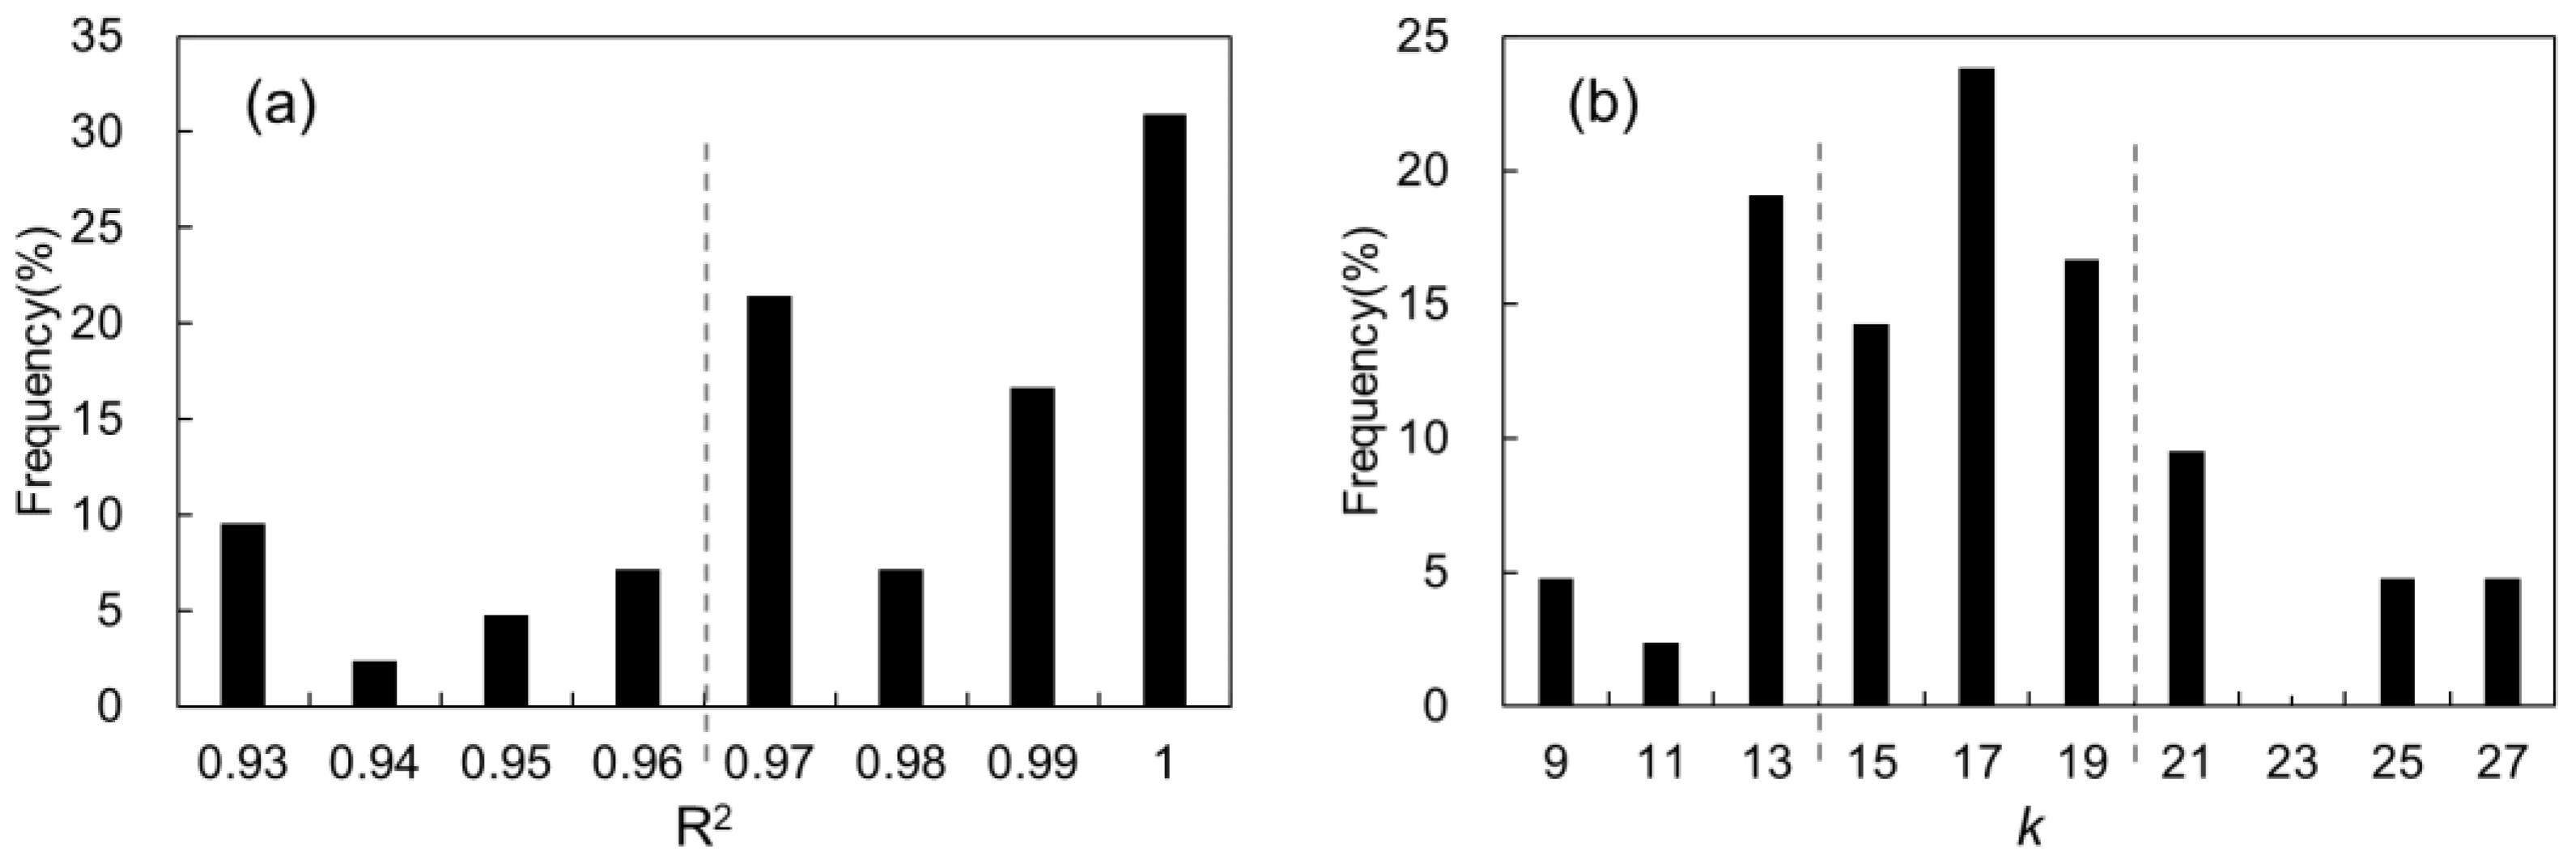
In the fitting analysis, the observed saturated soil moisture content of 0.48 was taken directly as the value of the parameter
, and only the variations of the two parameters
and
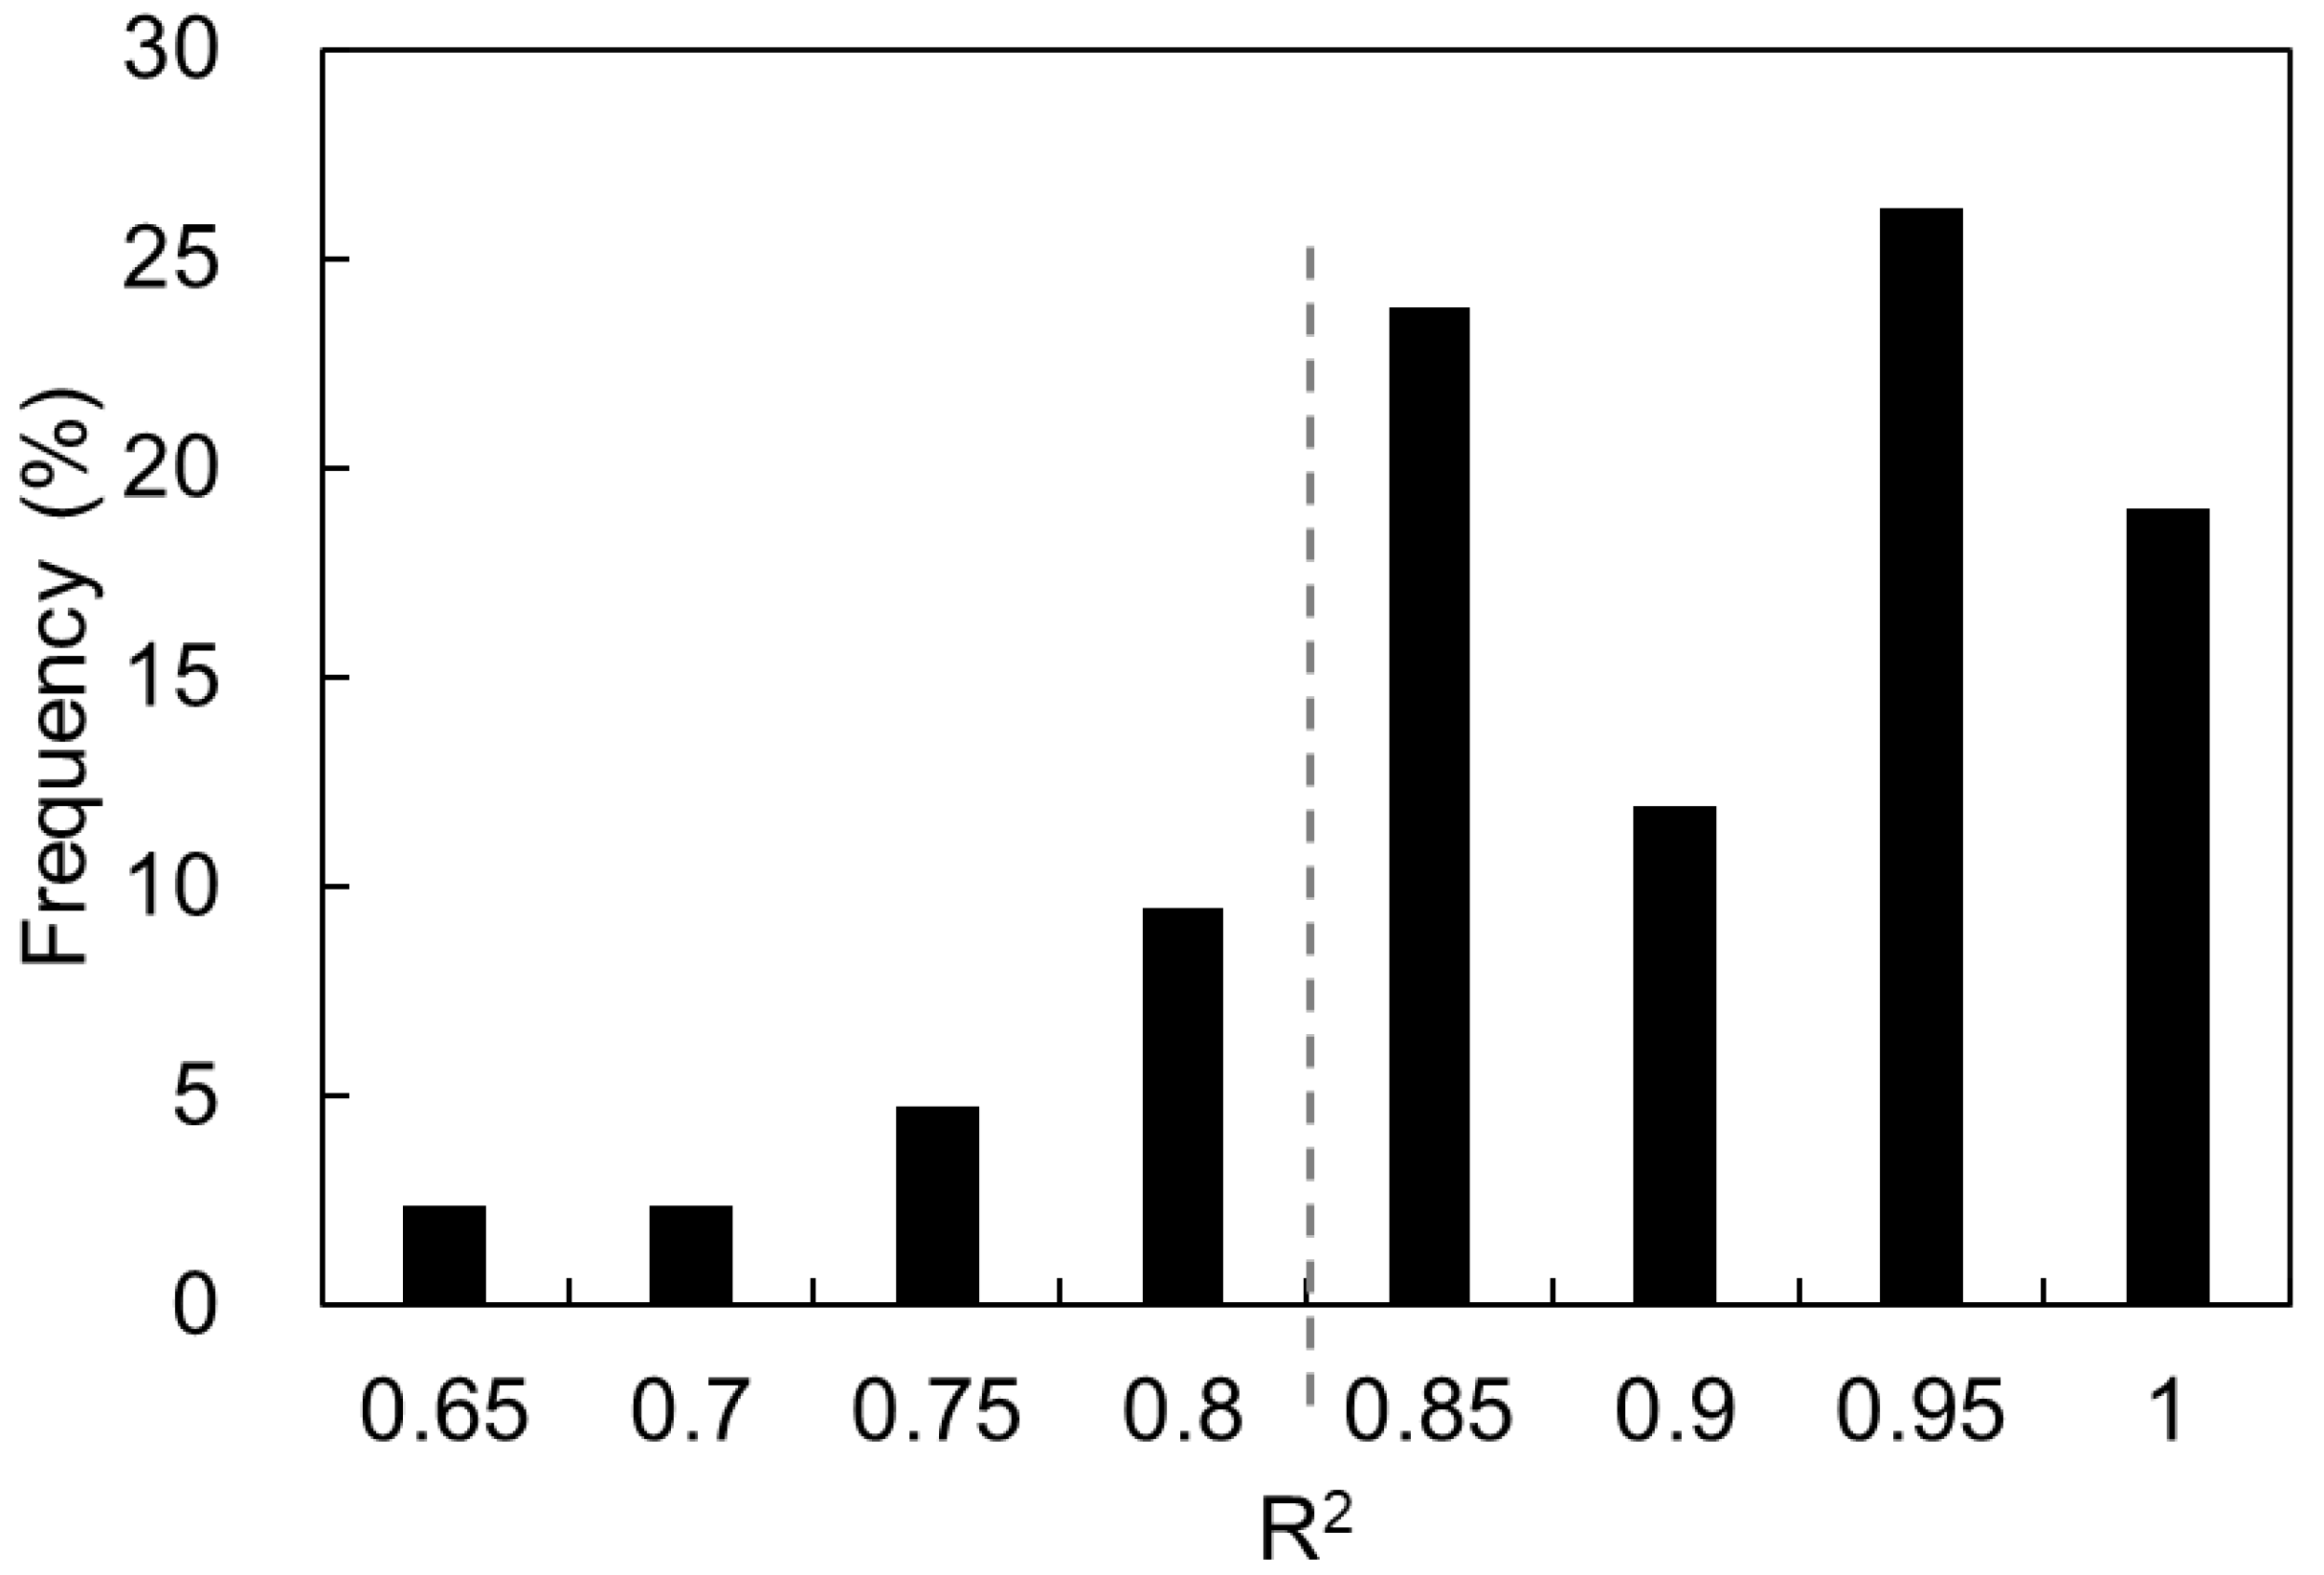
k were considered. The curve was fitted using the least squares method. Fitting results of each experiment are shown in
Figure 4a; more than 80% of the experiments had R
2 values greater than 0.96, reflecting the high accuracy of Equation (2). In addition, the values of fitted
k parameter values were concentrated, and 70% of the
k values ranged from 13 to 21, as shown in
Figure 4b. The fitted
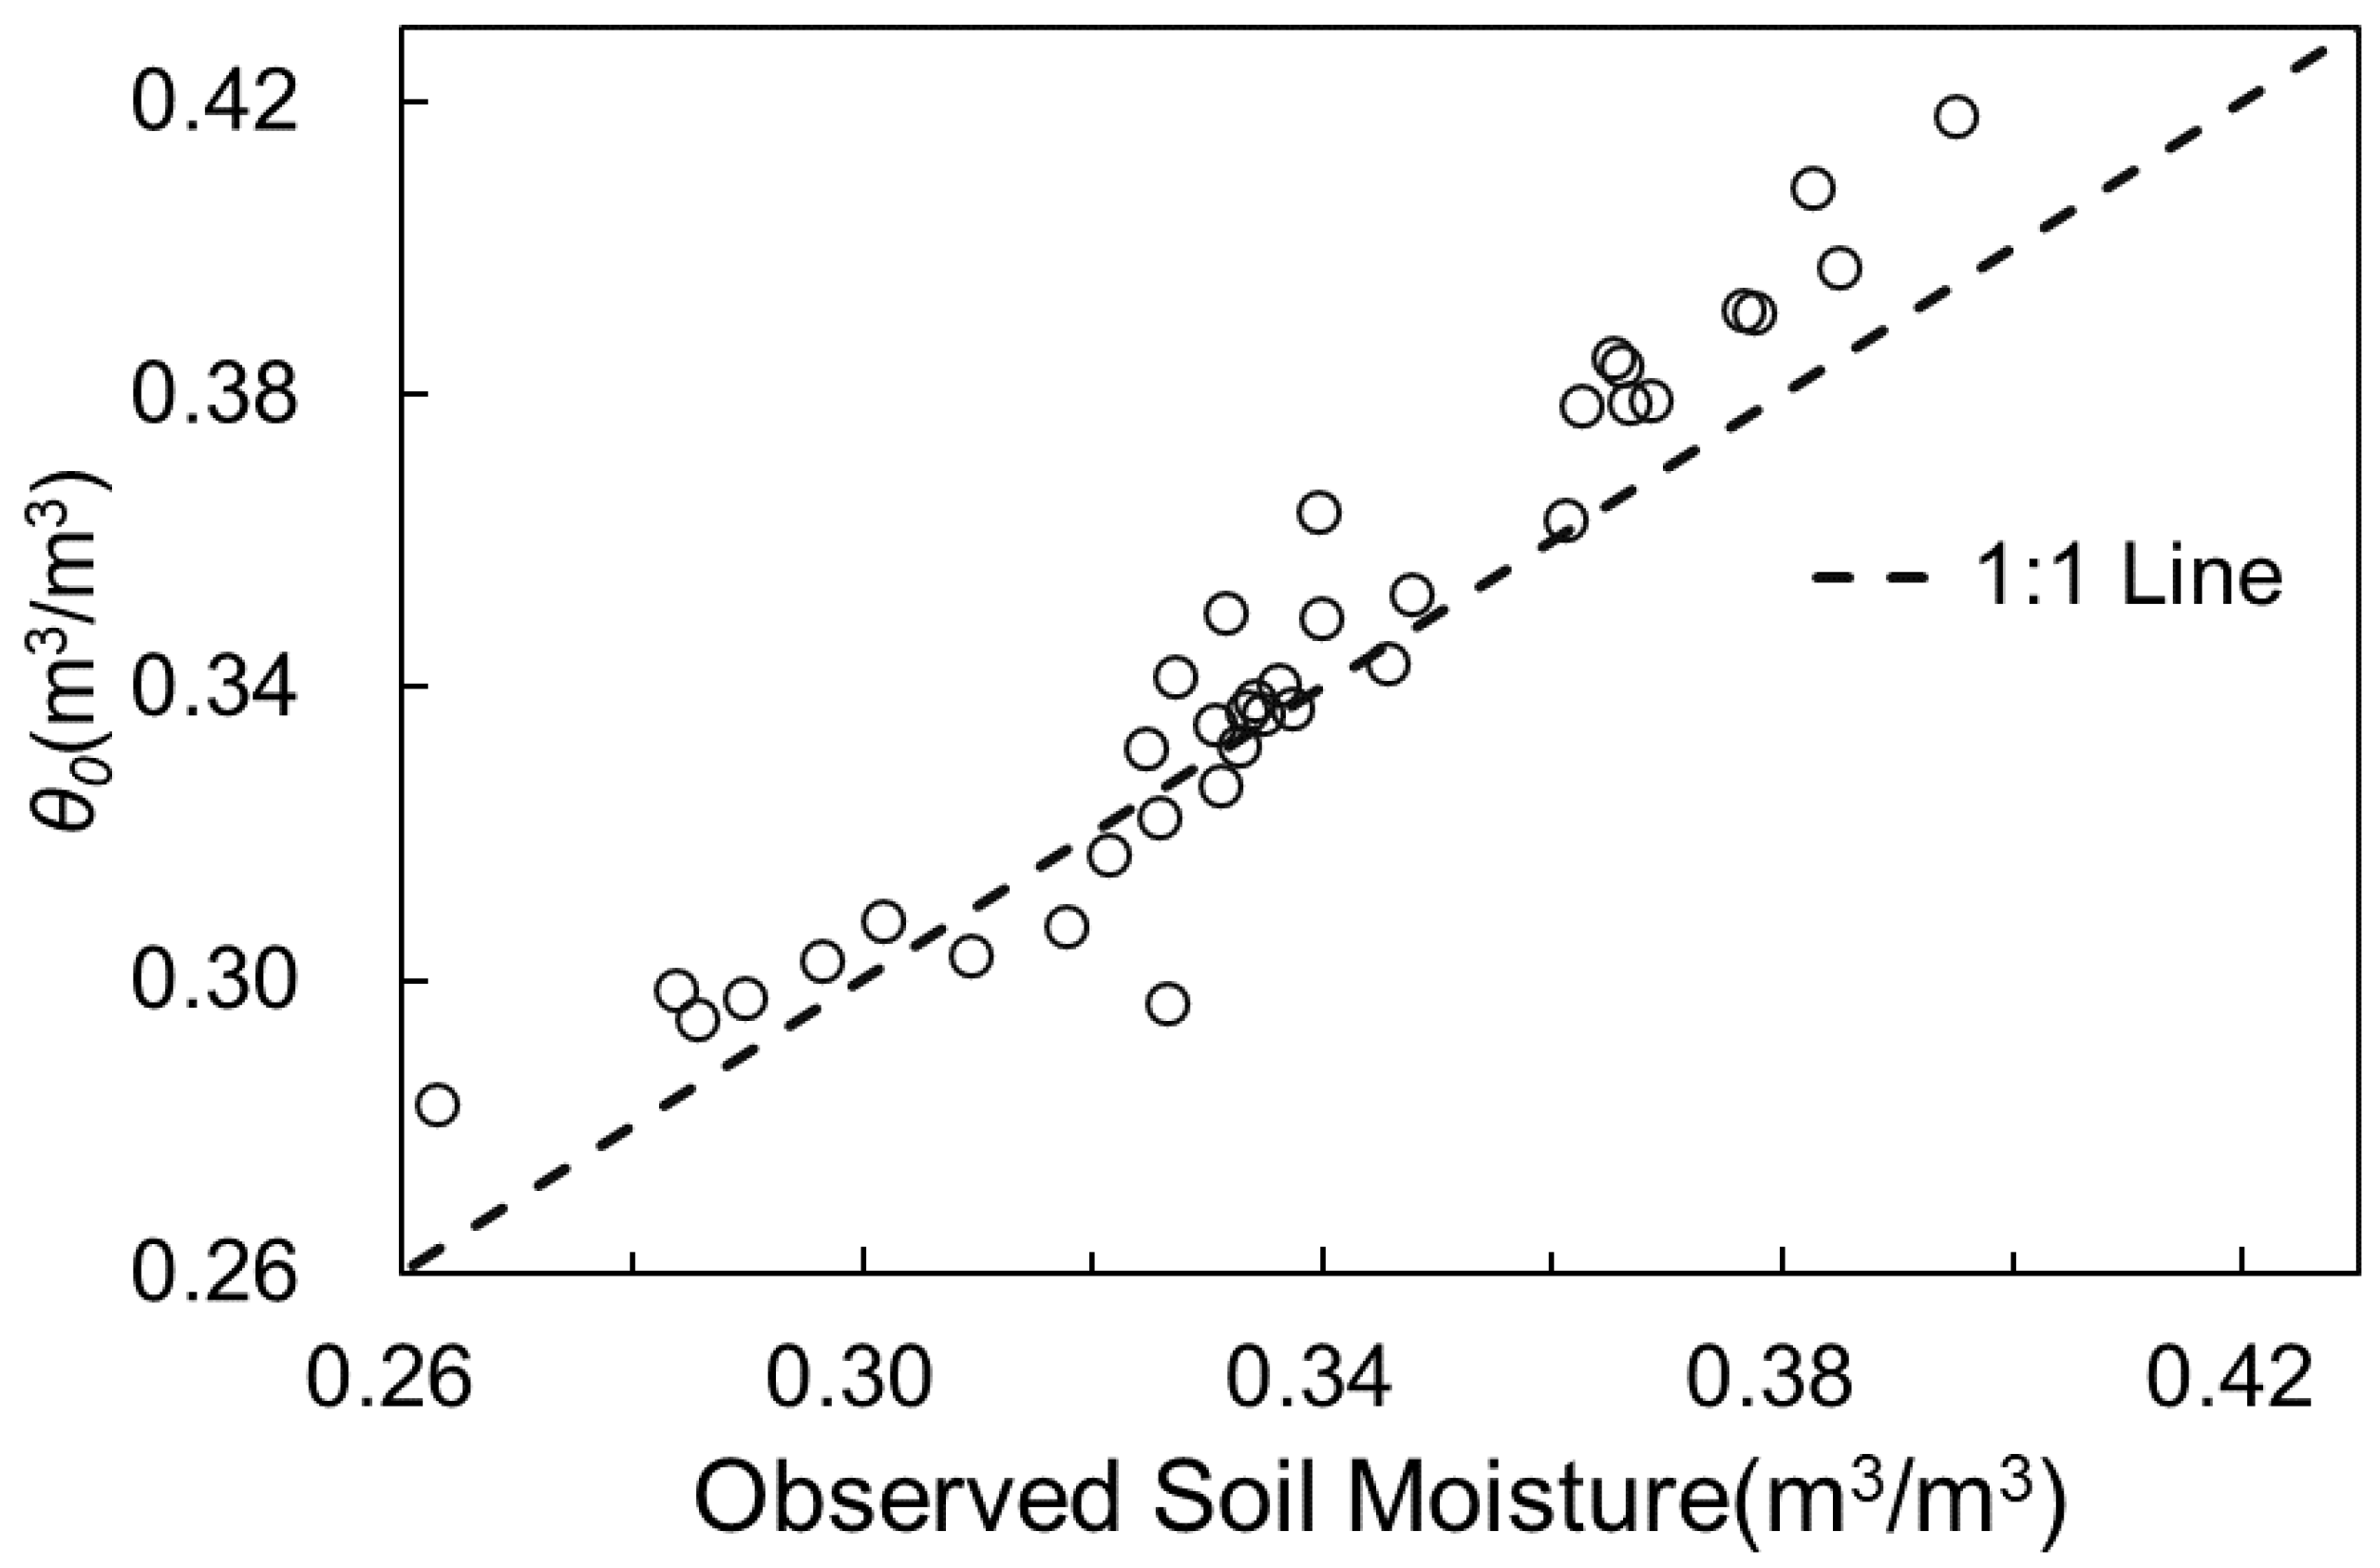
and measured initial soil moisture are shown in
Figure 5; they had an R
2 value of 0.94, and the fitted
is slightly higher than the measured initial soil moisture. Overall, the relationship between soil moisture content and infiltration time can be well described by Equation (2), taking into account the fitting accuracy, pattern of parameter distribution, and verification of observed data.
3.2. Relationship between Infiltration Rate and Soil Moisture Content
In the previous analysis, the temperature of each soil layer was almost the same as the indoor temperature, and we focused on the change in average soil moisture content at the depth from 0 to 25 cm. As shown in
Table 1, the average soil moisture content had a relatively obvious correlation with the soil moisture content at different depths. However, the rainfall infiltration process mainly occurs on the surface of soil, so the relationship between infiltration rate and soil moisture content will be affected by the depth of soil. Overall, infiltration rate and soil moisture content have an obvious negative correlation, and with the increase in soil depth, the correlation between infiltration rate and soil moisture content gradually decreases, and the change in soil moisture content below 20 cm had no significant impact on the infiltration rate, as shown in
Table 1. Therefore, in the following analysis, we focused on the relationship between surface soil moisture content and infiltration rate.
To analyze the relationship between infiltration rate and soil moisture content in each experiment, Equation (6) was used, and the fitting performance is shown in
Figure 6. The overall fitting effect was good, and the R
2 of more than 80% of the fields is more than 0.8.
S′ is the most important parameter in Equation (6), and it is calculated with
S and
k, where
k is a constant value. Therefore, the parameter
S′ is similar to
S which has a linear correlation with the initial soil moisture. The R
2 value of the linear correlation between the parameter
S′ and measured initial soil moisture is 0.57, with a high correlation, as shown in
Figure 7. Therefore, under the condition of this study, the parameter
S′ can be calculated as follows:
3.3. The Impact of Initial Soil Moisture on Infiltration Rate
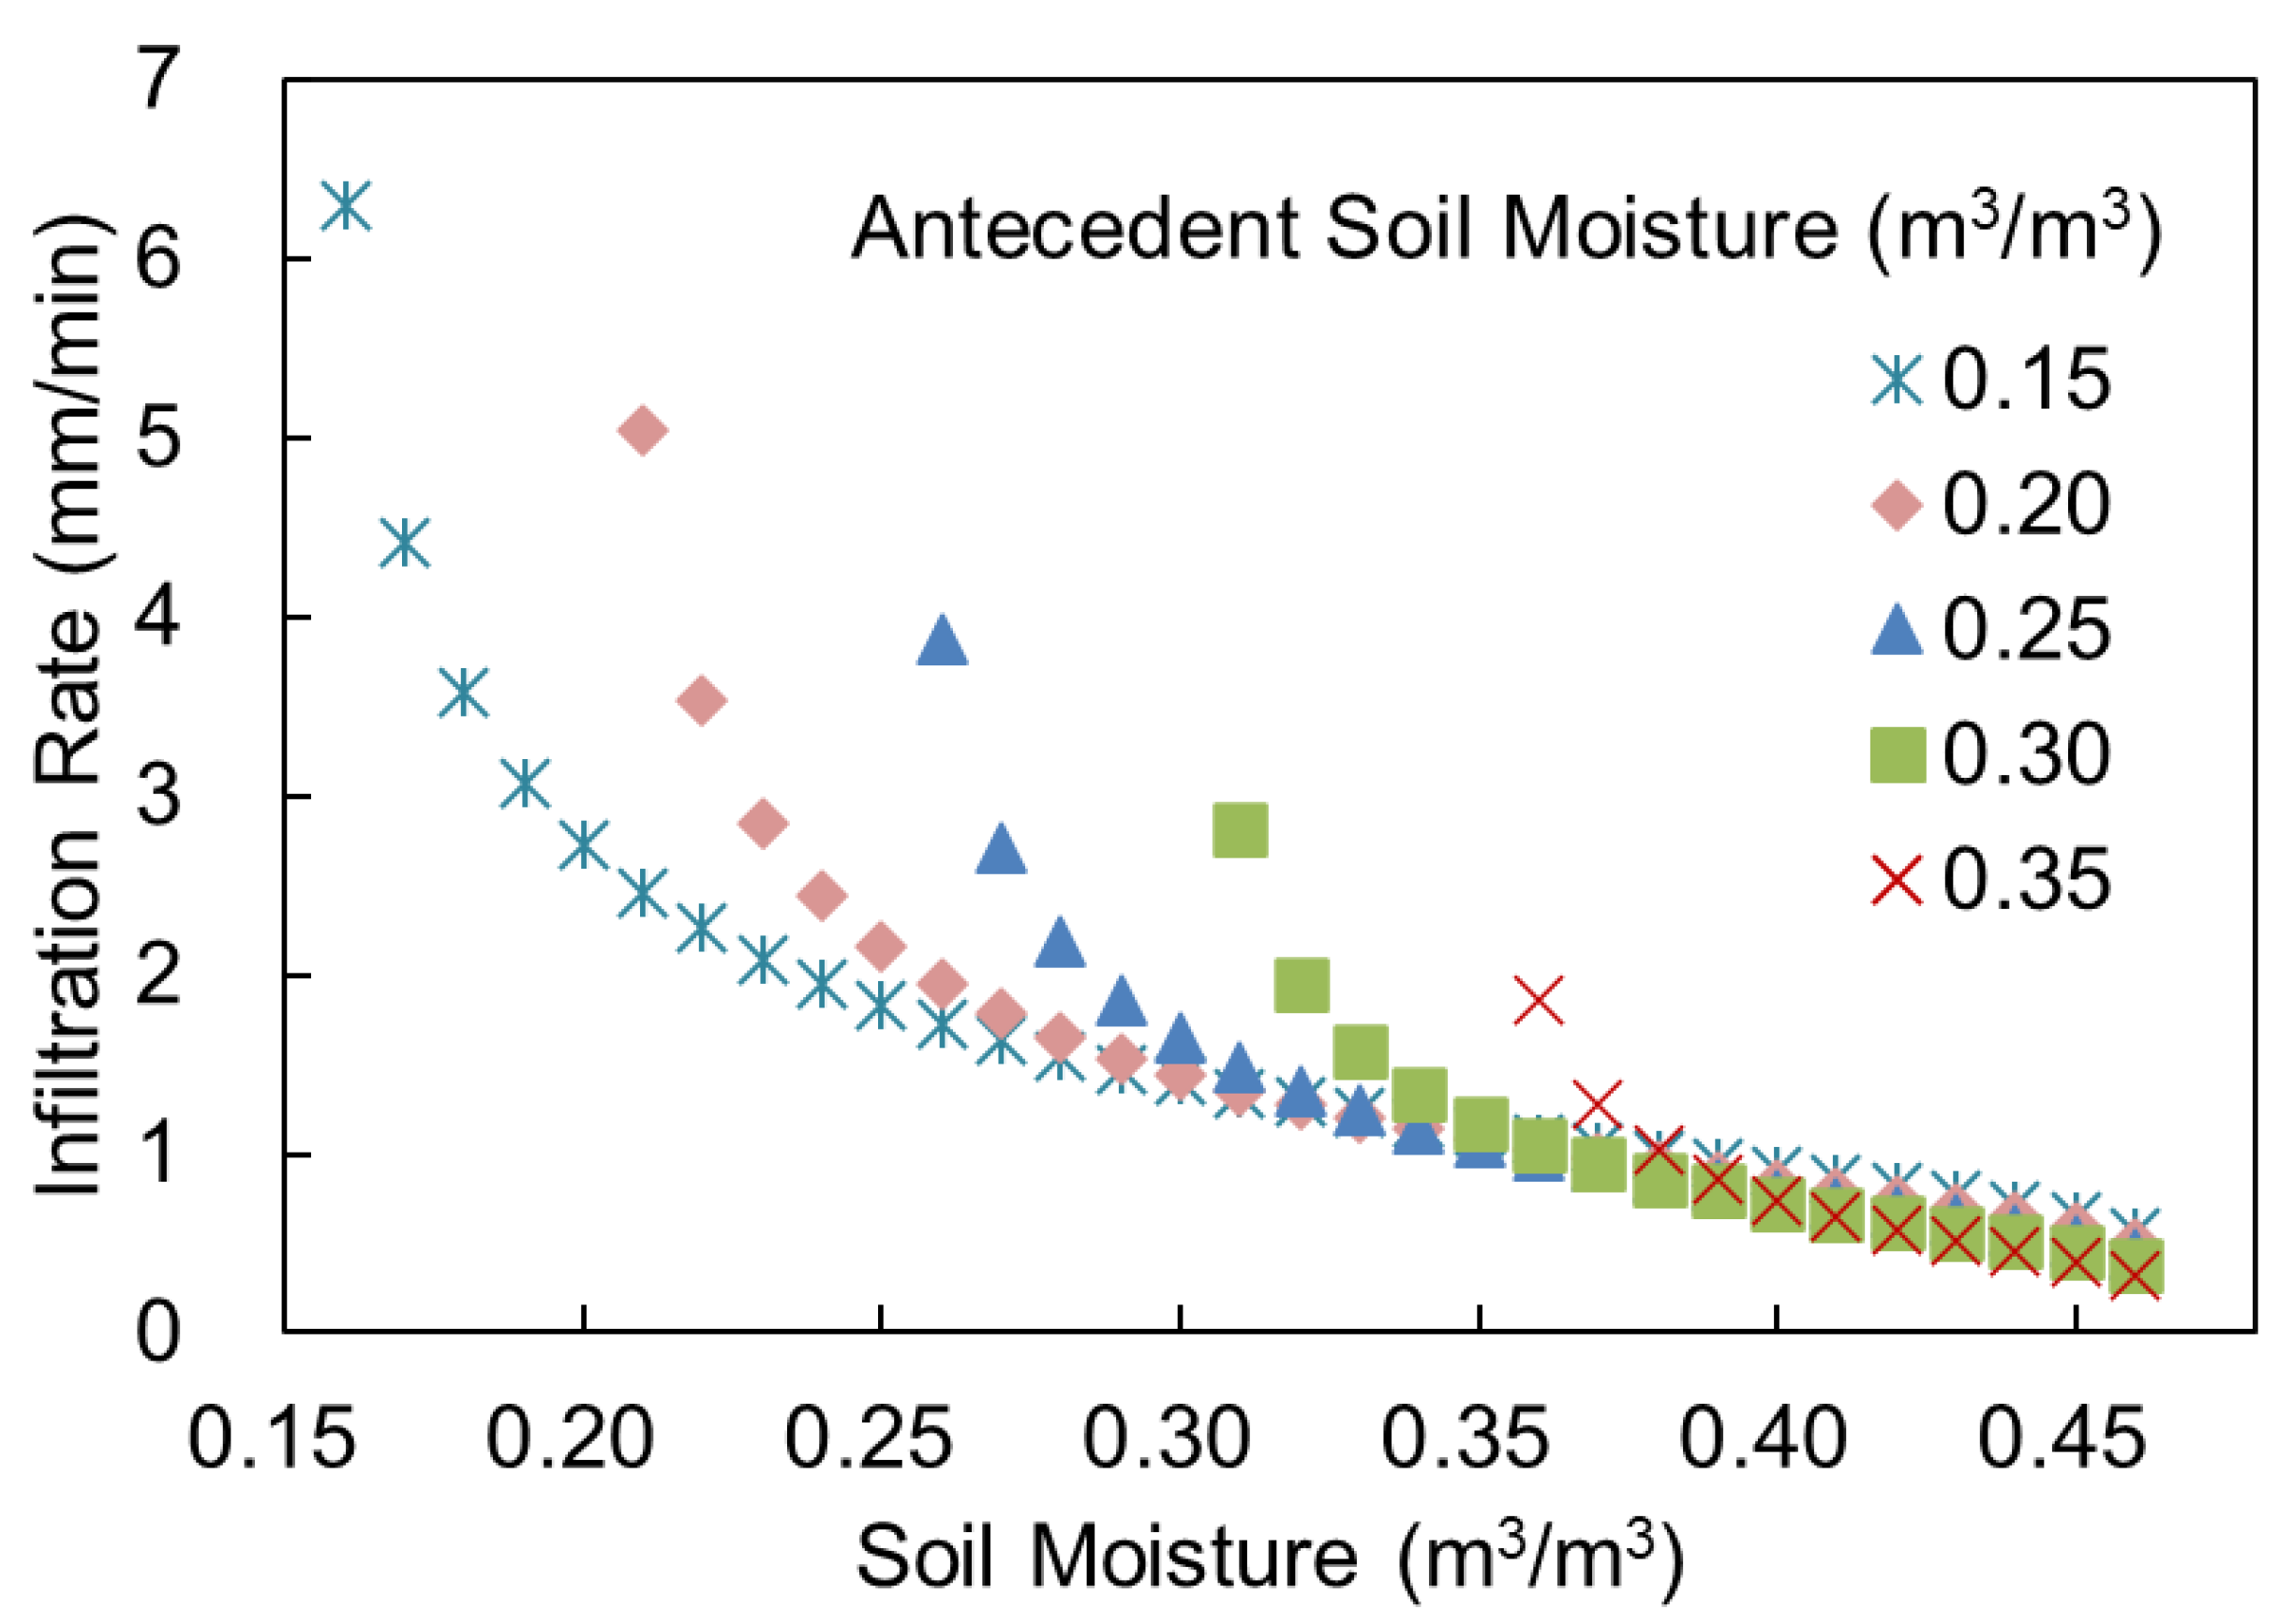
By introducing Equation (7) into Equation (6), the relationship between infiltration rate and soil moisture content under the influence of initial soil moisture can be obtained, and consequently, the influence of initial soil moisture can be quantified by scenario simulation analysis. Five kinds of initial soil moisture content were considered: 0.15, 0.20, 0.25, 0.30, and 0.35, and the fitting results are shown in
Figure 8. The difference between the five curves in the figure is obvious, and the change law is mainly described as follows:
The lower the initial soil moisture content is, the higher the initial infiltration rate is.
Five groups of infiltration rate–soil moisture content curves had intersections, and the soil moisture contents of intersections were 0.30 to 0.40. Further, the soil moisture content at the intersection was smaller when the initial soil moisture content was lower, but it was larger when the initial soil moisture content was higher.
On the left side of the intersections, with the increase in initial soil moisture content, the infiltration rate corresponding to the same soil moisture content is also increasing, while on the right side of the intersections, there is an opposite law.
On the left side of the intersections, with the increase in soil moisture content, the influence of initial soil moisture on the relationship between infiltration rate and soil moisture content decreases gradually, while on the right side of the intersections, it increases gradually.
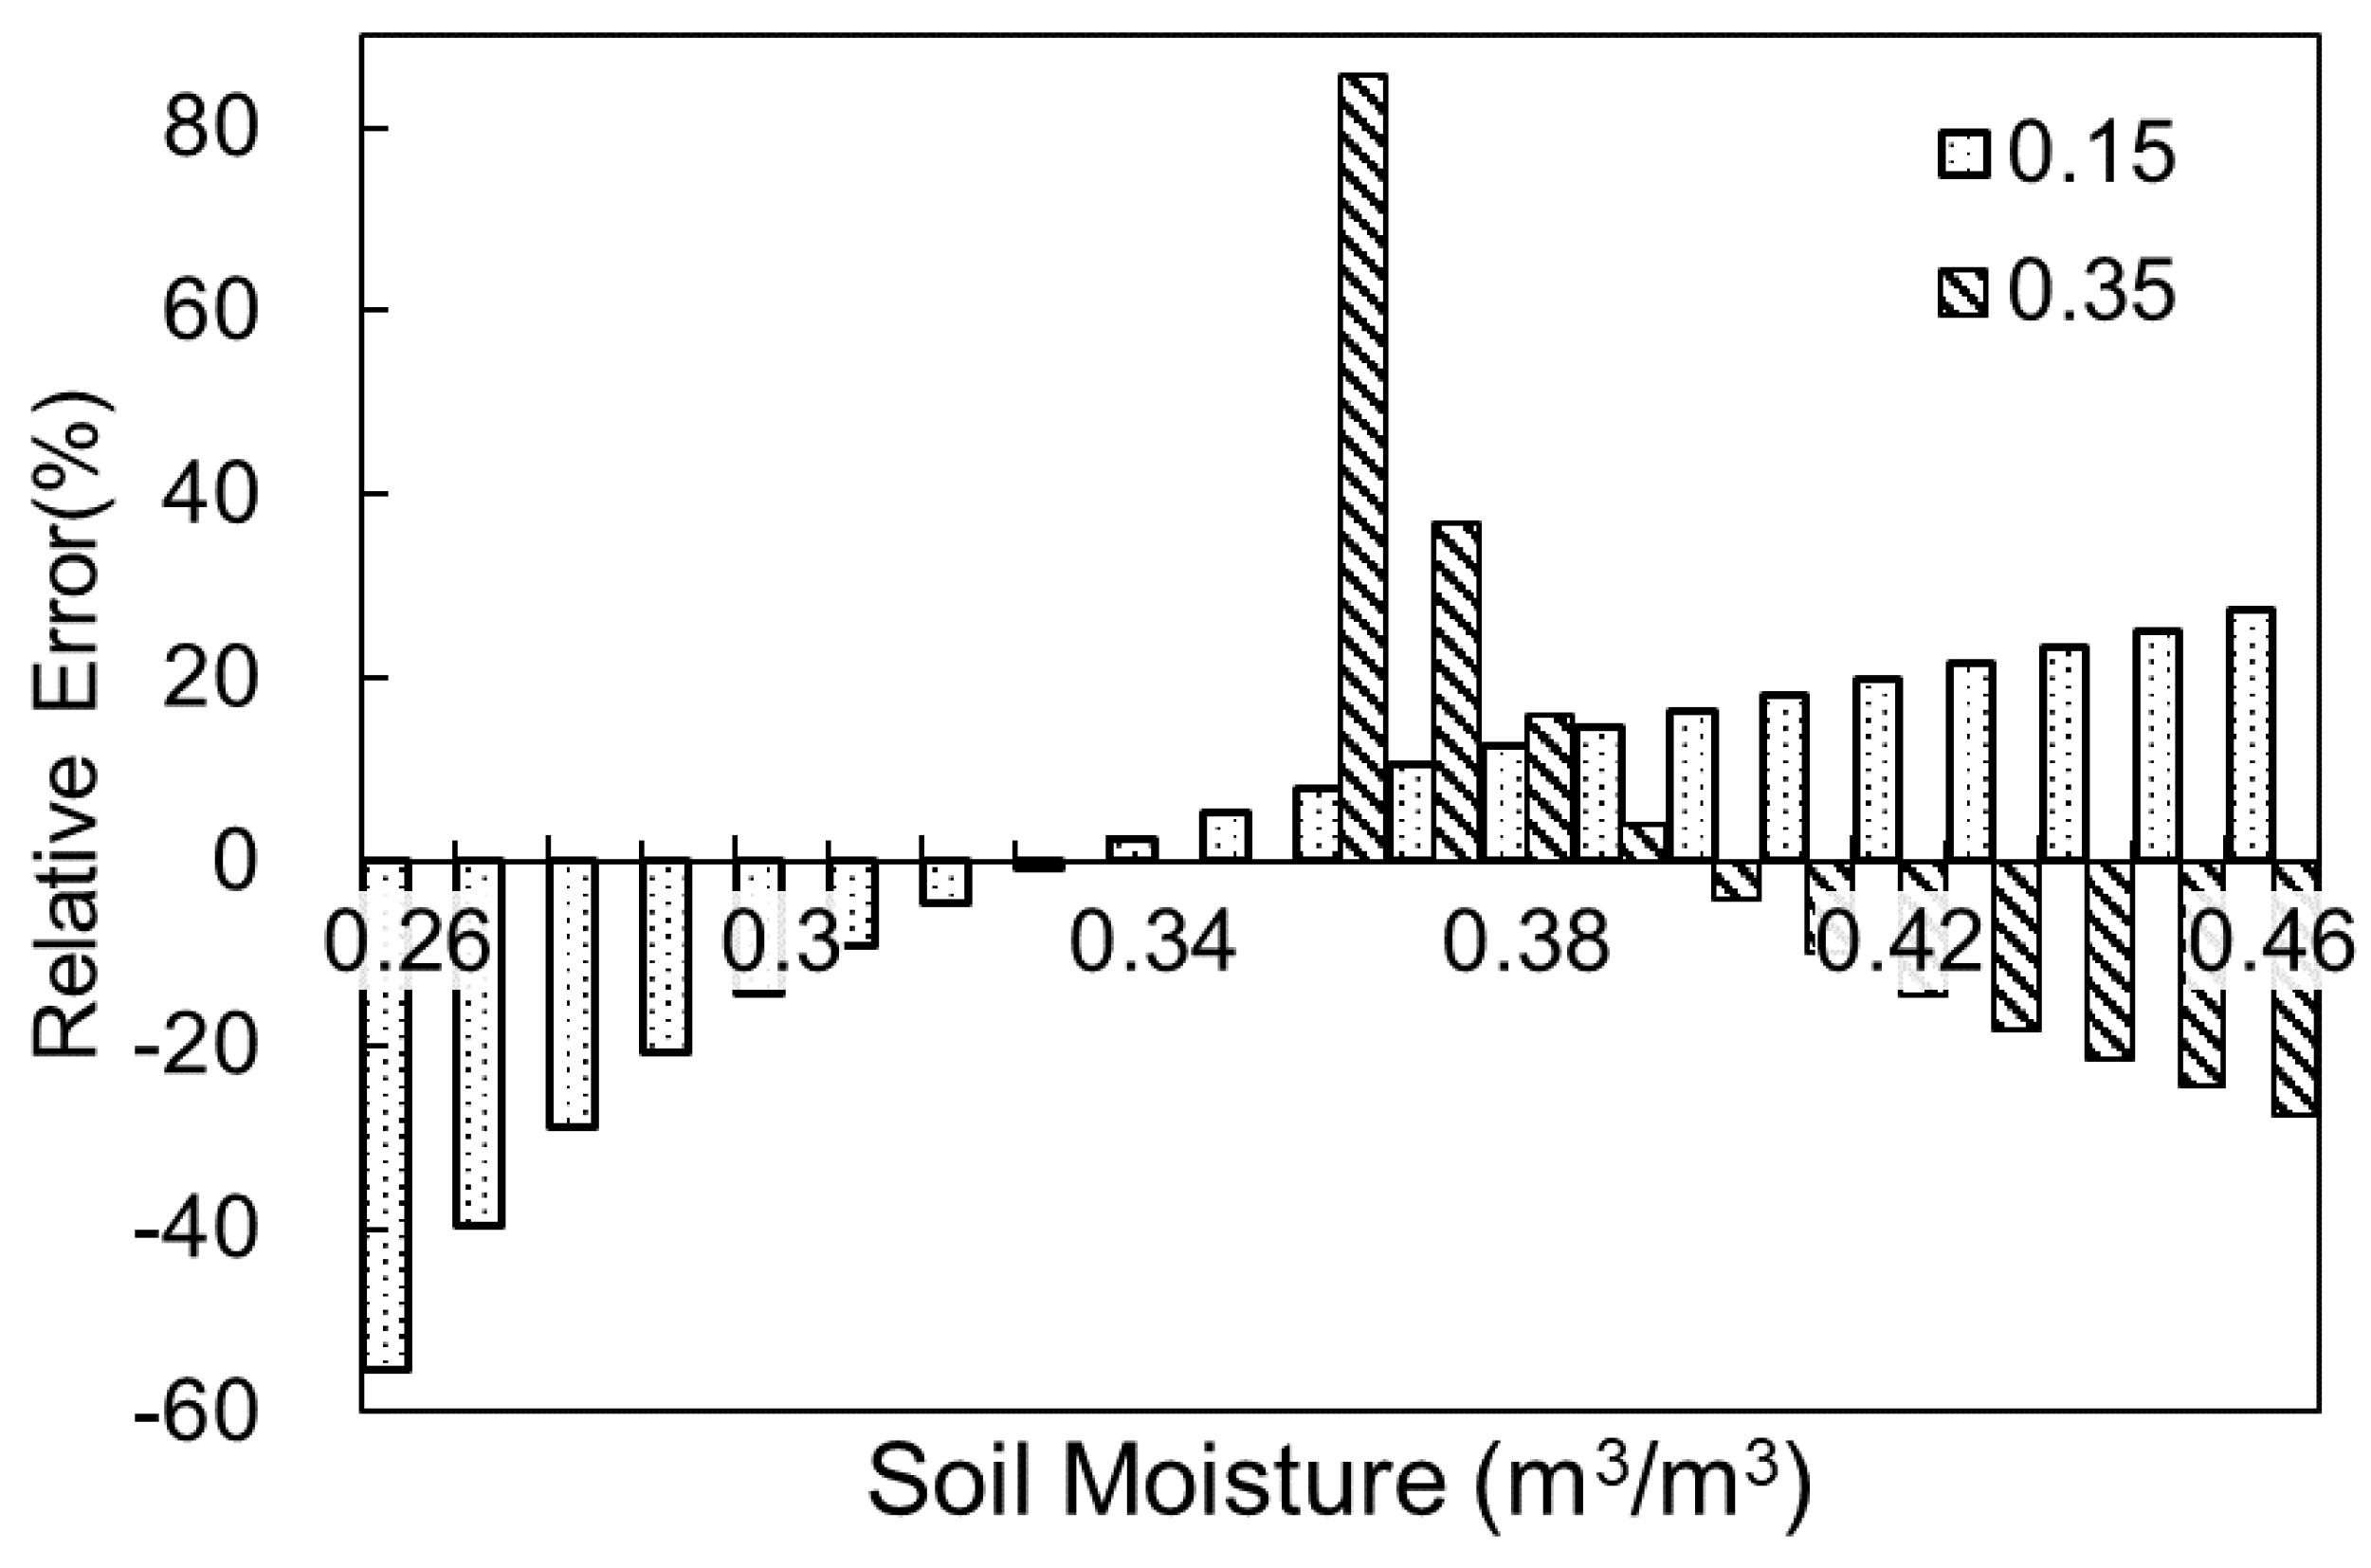
In order to quantify the impact of initial soil moisture on the relationship between infiltration rate and soil moisture, the relative error of infiltration rate calculated in the two scenarios with initial soil moisture content equal to 0.15 and 0.35 was calculated based on the benchmark of initial soil moisture content equal to 0.25. As shown in
Figure 9, the calculation results of the infiltration rate in the scenario (
= 0.15) increased from an underestimate of 55.45% (
θ = 0.26) to a gradual equalization (
θ ≈ 0.33) and then began to overestimate, eventually overestimating by 27.48% (
θ = 0.46).; The calculation error of infiltration rate in the scenario (
= 0.35) had roughly the opposite law, it decreased from overestimation of 85.82% (
θ = 0.36) to underestimation of 27.49% (
θ = 0.46).
4. Discussion
Soil infiltration rate is affected by a variety of factors, and most of the existing infiltration studies have focused on the relationship between two variables, infiltration rate and rain duration, which is a comprehensive expression of the process of infiltration rate with soil moisture content and soil moisture content with rain duration, ignoring the importance of the complex interaction process between infiltration rate and soil moisture content. In this study, considering the direct influence of soil moisture content as an intermediate variable in infiltration, an equation of the infiltration rate and soil moisture content under the influence of initial soil moisture content was proposed. This equation clarified the relationship between infiltration rate and soil moisture content during rainfall infiltration, providing a new perspective for studying the mechanism of runoff yield. Based on this equation, the influence of initial soil moisture content on soil infiltration rate was quantitatively analyzed. When the initial soil moisture content is chosen to be too large or too small, it will cause a certain degree of deviation in the calculation of infiltration volume. Therefore, the accuracy of both infiltration calculation and hydrological simulation would be enhanced by considering the initial soil moisture content.
Soil infiltration rate is a physical quantity that describes how quickly water infiltrates into the soil, and a larger infiltration rate indicates better soil permeability, then less surface runoff from rainfall, and less erosion and scouring of the soil by runoff [
26,
27]. The relationship between soil infiltration rate and soil moisture content considering the initial soil moisture content is used to fit the soil infiltration process and reflect the soil moisture infiltration law, which is very important for the prediction of soil erosion state and the formulation of soil and water conservation measures.
In addition, the infiltration rate and soil moisture content equation proposed in this paper under the influence of initial soil moisture conditions is a semiempirical equation, and each parameter has a relative physical meaning, which accurately reflects the infiltration law while solving the problems of the physical model parameters being more and less accessible, and the model solution is complicated. However, the validation data used in this study were only obtained experimentally from one soil type, but the soil infiltration rate is affected by various factors such as soil type, structure, and land use [
28]. Therefore, it is necessary to further validate the relationship between infiltration rate and initial soil moisture content proposed in this paper using multiple experimental data and even outdoor experiments which reflect the natural condition more realistically.
5. Conclusions
In this paper, an equation for the variation in soil moisture content with time was given, based on the form of the Horton equation, and the equation of infiltration rate and soil moisture content considering the influence of the initial soil moisture content was obtained by combination with Philip’s equation. Further, the scientific validity of the above equation was verified in terms of fitting effect and reasonableness of parameter values by using high-precision experimental data of artificial rainfall infiltration.
The reasonableness of the equation for soil moisture content and rain duration was verified by 42 fields of artificial rainfall infiltration test data. In the verification of 42 experimental data of artificial rainfall infiltration, R2 was greater than 0.96 in more than 80% of the experiments, and the R2 of the fitted parameter θ0 and its corresponding measured initial soil moisture content was as high as 0.94.
The relationship between infiltration rate and soil moisture content considering the effect of initial soil moisture content was obtained, based on the equation for soil moisture content and rain duration combined with Philip’s physical infiltration equation. The R2 of the fitted results was greater than 0.80 in more than 80% of the experiments. The law describing the influence of initial soil moisture content on the infiltration process was quantified with scenario analysis based on the soil moisture content–rain duration equation. The increase in initial soil moisture content increases the slope of the infiltration rate–soil moisture content curve, which in turn causes the intersection of infiltration rate–soil moisture content curves under different initial soil moisture content conditions. On the left side of the intersection, the increase in initial soil moisture content causes the overestimation of infiltration rate calculation results, while on the right side of the intersection point, it causes the underestimation of infiltration rate calculation results.
Due to the significant influence of the variation in initial soil moisture content on the infiltration process, it is difficult to accurately simulate the infiltration process under different initial soil moisture content scenarios with a set of parameters using traditional empirical infiltration equations (e.g., the Horton equation) or physical infiltration equations (e.g., the Philip equation). Under the experimental conditions in this paper, if the variation in the initial soil moisture content is not considered, for example, with a moderate initial soil moisture content condition (θ0 = 0.25), a lower initial soil moisture content (θ0 = 0.15) would underestimate infiltration by 55.45% (θ = 0.26) and overestimate infiltration by 27.48% (θ = 0.46), while a higher initial soil moisture content (θ0= 0.35) would overestimate the infiltration rate by 85.82% (θ = 0.36) and underestimate infiltration rate by 27.49% (θ = 0.46). Therefore, an accurate simulation of the infiltration process needs to be able to reflect the effect of the initial soil moisture content, and the infiltration rate–soil moisture content relationship given in this paper is a more ideal form of the equation.


 ,
, 


