Article

Occurrence of Microplastics from Plastic Fragments in Cultivated Soil of Sichuan Province: The Key Controls

1
College of Resources and Environment, Hunan Agricultural University, Changsha 410128, China
2
Rural Energy & Environment Agency, Ministry of Agriculture and Rural Affairs, Beijing 100125, China
3
Agricultural Technology Extension Station of Sichuan Province, Chengdu 610000, China
4
Department of Soil Science and Agricultural Chemistry, Engineering Polytechnic School, University of Santiago de Compostela, Campus Univ, 27002 Lugo, Spain
5
School of Environmental Science and Engineering, Guangzhou University, Guangzhou 510006, China
*
Author to whom correspondence should be addressed.
These authors contributed equally to this work.
Submission received: 17 March 2022 / Revised: 24 April 2022 / Accepted: 26 April 2022 / Published: 29 April 2022
(This article belongs to the Special Issue Microplastics Pollution and Solutions)

Abstract

:
With the continuous increase in the amount of mulch film, “white pollution” caused by plastic fragments (PF) has seriously affected agricultural production progress and poses a great threat to the safety and health of the agricultural environment. In the present study, PFs collected from 20 mulched agricultural farmlands in Sichuan Province were investigated. The PFs were separated and screened following the density flotation method. Optical microscopy was used to assess the fragments’ distribution, abundance, color, size, and morphology, and Raman spectroscopy was used to identify the types. In addition, through the analysis of a questionnaire survey, a random forest (RF) model was conducted to assess the effects of environmental factors on the amount of PF. The results showed that the abundance of PFs was the highest in Lade Town, Zigong City, reaching 1158.33 ± 52.04 particles kg−1. Meanwhile, PFs were less abundant in Foyin Town, Luzhou City, with 50.00 ± 25.00 particles kg−1; the morphology features of PF in the cultivated soil were mainly transparent (60.06%) and flaky-like (83.41%), with sizes < 5 mm (63.61%). In total, 75% of the representative PFs were PE PFs, while PVC PFs were 25%. The RF model indicated that there were significant effects due to the total mulch film amount, annual precipitation, and planting pattern on the number of derived residues (PF). This study provides data indicating the urgent need to prevent and control plastic pollution in mulch farming, specifically in the soils of Sichuan Province.

Graphical Abstract

1. Introduction

Microplastics (MPs) refer to plastic particles or fibers with a diameter less than 5 mm, which are emerging contaminants that are extensively detected in aquatic ecosystems. Several studies have quantified and analyzed the impact of MPs on the marine and freshwater environment [1,2]; however, since Rillig identified the effect of MPs pollution in the soil environment [3], increasing attention is paid to plastic pollution and its potential dangers in soils [4,5,6]. It is estimated that the annual intake of plastic waste in the terrestrial environment is 4–23 times that of the marine environment [7]. Additionally, the existence of MPs is found in many terrestrial environments. In a soil survey of the Sydney industrial zone, Fuller [8] found that 0.03 to 6.7% of soil weight was made up of MPs. In addition, these values could be as high as 60% in highly polluted areas [9]. At the same time, a large number of MPs are also found in farmland soils [10]. Mulch film plays an important role and is widely used in agricultural activities. However, improper use and imperfect recycling systems have caused a large amount of plastic pollution, resulting in a series of adverse effects on soil and plants [11]. Therefore, the use of mulch film is one of the main sources of plastic pollutants in soil ecosystems.
The technology of soil film mulching on cultivated land can increase temperature and retain water, which plays an important role in increasing agricultural production and income, and it has become one of the most important means to guarantee stable and high agricultural yields [12]. China is the world’s largest consumer of mulch film [13], and its application in the soil used for plant cultivation increased by about five times from 1991 to 2017 [14]. Furthermore, mulch film technology is gradually becoming popularized and applied in cold, arid, and semi-arid regions, such as Xinjiang, Shandong, Shanxi, Inner Mongolia, Heilongjiang, Shaanxi, and Gansu Province, and in the cultivation of more than 40 kinds of crops, especially vegetables, corn, and cotton [15]. Studies have shown that a large number of mulch films stay in the soil every year [16]. The mulch film-covered area is more than 18.33 million hm−2, while the mulch film recovery rate is less than 60% [17]. The long degradation period [18] and the unreasonable utilization of mulch film have caused the accumulation of PF in soils [19]. In addition, the PF in soil not only reduces the soil quality but also alters its biodiversity, its physical properties, including water retention capacity, soil aggregates, bulk density, nutrient availability, microbial communities, as well as above- and below-ground traits of plants [20,21]. Therefore, there is an urgent need to study the current situation of PF pollution in cultivated soil.
Nowadays, many researchers focus on agricultural residual film in cultivated soil in northern China. Cheng [22] analyzed the MPs in plastic mulched cultivated soil in northwest China and found that the large plastic particles gradually transform into tiny particles, and the potential MPs pollution in farmland soil is aggravated with time. In addition to MPs, a certain proportion of medium and macro plastics with different particle sizes were detected in the soil layer. Li [23] found that the amount of residual mulch film with a large grain size was the most in the farmland soil of Qingdao, and the number of <2 cm2 was the least. Therefore, the pollution by plastics of other particle sizes from PF cannot be ignored.
Furthermore, research showed that the amount of PF in farmland soil is closely related to climate [24], crops [14], soil texture, and recycling habits [12], affecting soil biodiversity in degrees that vary among different regions. For example, in 2014, Zhou et al. showed that the density of PF in farmland increased with the increase in the amount of mulching time in Xinjiang Province [25]. However, residual mulch film was related to the recovery rate of mulch film in the current season instead of planting pattern and mulching time in the farmland soils of Qingdao Province [23].
In recent years, the application area of film mulch was extended from arid and semi-arid regions in the north to high mountains and cold areas in the south of China [24]. Currently, the research on PF pollution is mainly concentrated in North China, such as Xinjiang, Handan, and Tianjin city; however, little is known about the overall level of PF in southern China [26]. Sichuan Province, located in southern China, used 9.10 tons of mulch film in 2018, ranking fifth in the country and covering an area of 996.7 hm2. Therefore, there is a justification for the fact that the present study was focused on investigating PF in cultivated soils of Sichuan Province. To do that, the PF was first screened and analyzed. Further, the morphological characteristics of the PF were assessed based on the environmental characteristics near the sampling site of the PF. Field planting surveys were carried out on related information of natural environment and cultivation, and the main factors influencing the effects of PF were evaluated. The study provides data to support the prevention and control of plastic pollution in the soils of Sichuan Province, which can be seen as an exemplar of what happens in this regard in many agricultural soils around the world.

2. Materials and Methods

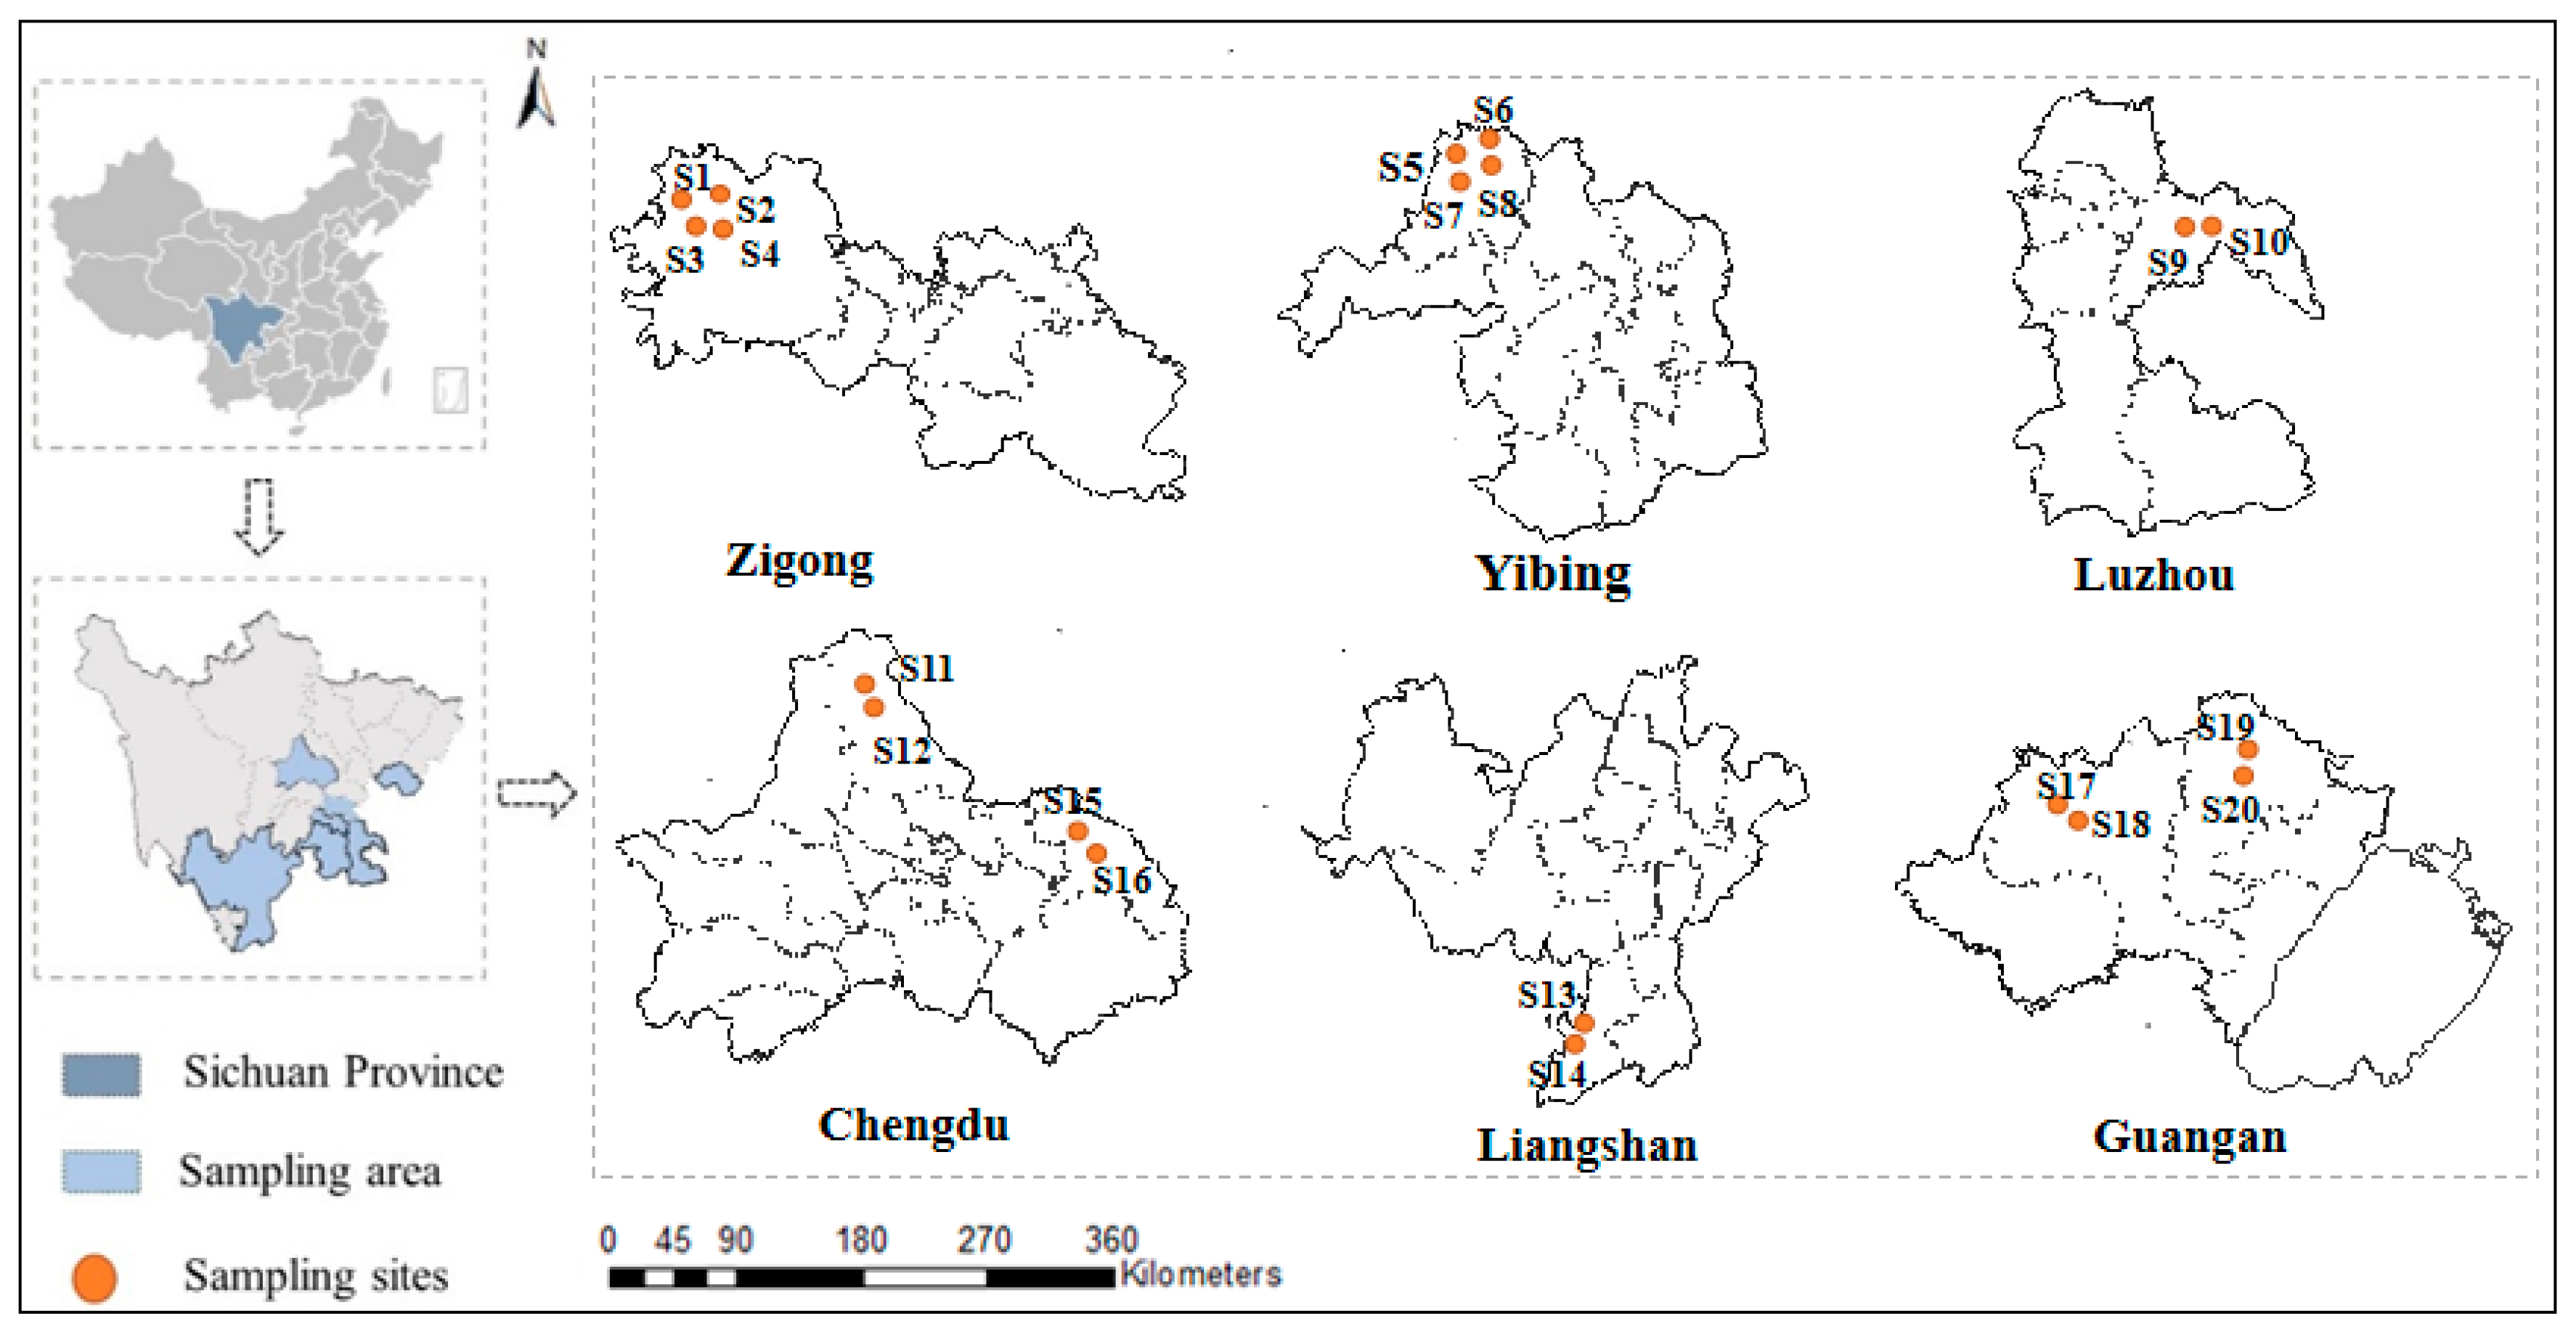
2.1. Site Description, Data Collection, and Sampling

Sichuan Province is located in the hinterland of southwest China (E 97°21’–108°33’, N 26°03’–34°19’), with an area of 486,000 km2. Sichuan has complex topographic types, mainly characterized by mountains, with the soil tillage layer being deep and the soil layer structure being good [27]. The variation range of annual average precipitation in Sichuan Province is 764.40~1093 mm, and the distribution characteristics show a trend increasing gradually from west to east on the whole [28]. The planting area of cash crops in Sichuan Province, mainly fruits, vegetables, tea, and traditional Chinese medicine, reached more than 3.33 million hm2 in 2020 [29].
For the current study, 20 sampling sites were selected from seven cities to investigate the characteristics and factors influencing PF pollution in Sichuan Province, with all the collection locations shown in Figure 1. Four sampling sites each were set in Zigong City (S1, S2, S3, S4), Yibin City (S5, S6, S7, S8), and Guang’an City (S17, S18, S19, S20), and two sampling sites each in Luzhou City (S9, S10), Pengzhou City (S11, S12), Liangshan City (S13, S14), and Chengdu City (S15, S16); three replicates were maintained per sampling site.
In order to further explore the natural and man-made factors affecting the PF in the cultivated land, this study conducted a field survey by means of a questionnaire in the same sample area. The questionnaire mainly included questions to collect information on agricultural production and mulch film amount in the sample area, such as the soil texture, planting pattern, irrigation method, crop type, annual precipitation, mulching time, and mulch film amount. The detailed information about sampling sites collected using the questionnaire is shown in Table S1 (Supplementary Material).
Furthermore, the steps for collecting PF were as follows: First, the location of the sampling sites was recorded with GPS. Then, the seasonal mulch film was removed from the ground after the crop harvest, and soil samples were collected before ploughing the farmland soil. Each sampling site was connected to a 100 cm × 100 cm square with an iron stick as a four-corner support point [22], and 1 kg soil samples were collected from 0–10 cm, 10–20 cm, and 20–30 cm depths, stored in cloth bags, and taken to the laboratory.

2.2. Analysis of PF

The sieving-density separation method [30] was used to extract the PF from cultivated soil: the collected soil samples were naturally air-dried, and the PF was extracted following a combination of oxidation, ultrasonic dispersion, sieving, and density flotation. Studies showed that hydrogen peroxide and NaOH could successfully remove organic materials in agricultural soils [31]. Hence, an amount of 40.0 g of soil sample was first transferred to a 500 mL Erlenmeyer flask, moistened with a small volume of distilled water, and gradually mixed with a 30% hydrogen peroxide solution (10 mL each time); the mixture was shaken well to dissipate the foam. Then, a volume of 30 mL of a 0.50 mol L−1 NaOH solution was added to the Erlenmeyer flask for 30 min, and the volume of the mixture was made up to 250 mL with distilled water, heated, and dispersed using an ultrasonic disperser (at 40 °C) for 1.5 h. The soil–water mixture in the Erlenmeyer flask was then washed through a set of sieves (5 mm, 2 mm, and 0.03 mm sieve holes), and the soil on the surface of each sieve was collected and floated in a NaCl and 20 mL of a 0.05 mol L−1 FeCl2 solution. The floating particles were collected, and the NaCl and FeCl2 solution was washed away. Finally, a volume of 20 mL of 30% hydrogen peroxide was added and left standing for 1 h in the flotation process, then washed, transferred to a Petri dish, and dried at 60 °C for subsequent analysis. Three replicates were maintained per group. The purpose of screening after oxidation was to facilitate the successful separation of soil and PFs.
The floating samples in the Petri dish were transferred to a glass slide with tweezers and placed under a 30× electron microscope (SMZ25, Nikon Corporation, Tokyo, Japan) to observe their shape, color, and size, and numbered on the computer before taking a picture. Representative PFs were selected by observing the difference in shape and color of the PFs under the electron microscope (Table S3, Supplementary Material). Then, the PF was scanned in the range of 400–4000 cm−1 using a Raman spectrometer (PhAT system, Kaiser Optical Inc., Ann Arbor, MI, USA) with 360 MW power and 785 nm laser wavelength. The Raman spectrum of the PF sample was obtained and compared with the standard Raman spectrum of the plastic to identify the type of plastic in each sample [32]. In this experiment, the 24 representative PFs were compared on PE, PVC, PET, PS, PP, PA, and PTFE, respectively.

2.3. Data Statistics and Processing

For each monitoring site, we collected the farmland planting of 11 farmers and the local natural environment. For each original study, the following information was compiled: crop type, annual precipitation, planting pattern, irrigation method, soil texture, mulching time, and mulch film amount. This is shown in Supplementary Material.
A random forest (RF) algorithm was used to explain the influence of various factors on the PF. Like other models, RF can explain several independent variables (X1, X2, …, Xk) on the dependent variable Y. If the dependent variable Y has n observations and k independent variables are related to it, when constructing the classification tree, the random forest will randomly reselect n observations from the original data, some of which are selected many times or not, which is the method of Bootstrap resampling. At the same time, the random forest randomly selects some variables from k independent variables to determine the nodes of the classification tree. In this way, the classification tree may be different each time. In general, random trees randomly generate hundreds to thousands of classification trees and then select the tree with the highest degree of repetition as the final result [33]. The RF was specifically developed for this research, and the additional details on it are shown below. Before performing the analysis using the RF, the explanatory variables (influencing factors) and response variables (residual loading) were standardized, and data were centered and scaled to an average of 0, with a standard deviation of 1. Standardization was conducted to ensure that when all variables had the same weight, the explanatory variables were sorted according to the degree to which the variables explained the changes.
In this study, combined with the questionnaire (Supplementary Material Table S1), the dependent variable Y (Abundance of PF) had one observed value, and the independent variable k (crop type, annual precipitation, planting pattern, irrigation method, soil texture, mulching time, and mulch film amount) had seven. We used the forest plot approach of individual studies, which allowed us to visualize the relationship between sample size and effect size. The studies in our database generally had 11 replicates, as per the norm of such field studies. We provided the codes for all our meta-analyses for R kernel and R script, located in Supplementary Materials File S1.
The least significant difference test (LSD) was used to compare the effects of mulch film amount, annual precipitation, and planting pattern on PF. IBM SPSS Statistics 22.0 and The R Project for Statistics Computing 4.0.5 were used to statistically analyze which natural conditions or human activities (annual precipitation, planting pattern, soil texture, irrigation method, crop type, mulching time, and mulch film amount) are the main factors affecting the abundance of PF in soil samples, and DPS (Data Processing System) software was used to analyze the factors affecting the amount of soil PF. The factors affecting soil PF abundance were analyzed. All graphs were plotted by means of OriginPro 2018.

3. Results and Discussion

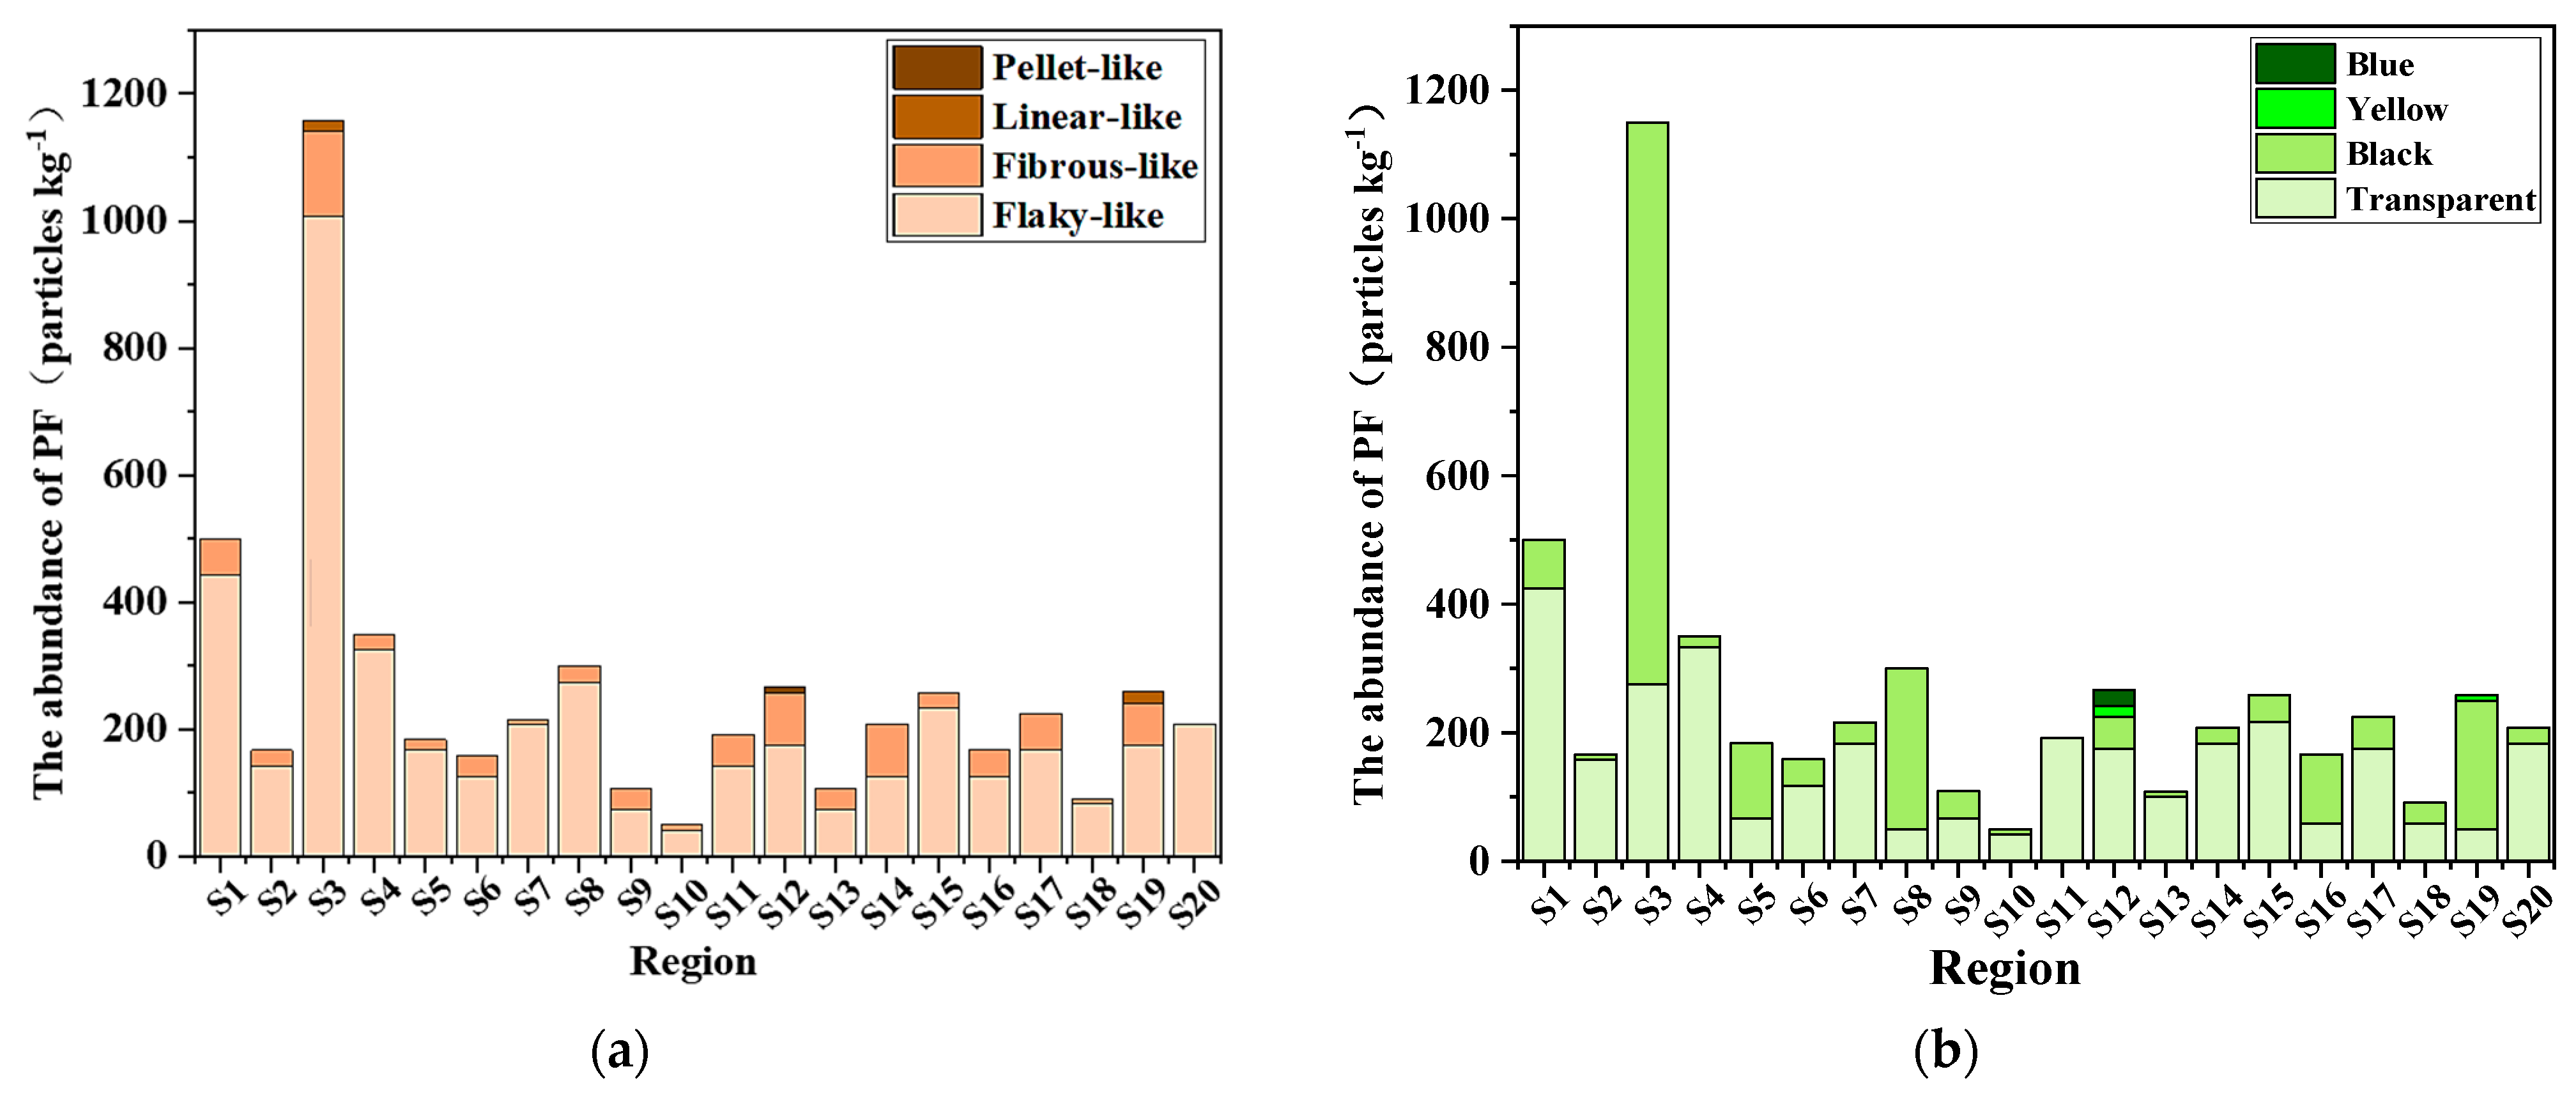
3.1. Abundance and Distribution of PF

The average abundance (standard deviation) and distribution of PF separated from the cultivated soil in all sampling areas are shown in Table 1. The average total abundance of PFs in the cultivated soil of all the sampling sites in Sichuan province was 5175.00 ± 175.00 particles kg−1. The abundance of PFs was the highest in S3, located in Lade Town, Zigong City, reaching 1158.33 ± 52.04 particles kg−1. Meanwhile, PFs were less abundant in S10, located in Foyin Town, Luzhou City, with 50.00 ± 25.00 particles kg−1. Significant differences were observed in the abundance of PF between the various sampling sites (p < 0.05; Table S2, Supplementary Material). Many studies reported the abundance and distribution of PFs in the soils of other cities in China. Specifically, the abundance of PFs with a diameter less than 1 mm in the cultivated soils of the suburbs of Shanghai Municipality ranged from 62.50 ± 12.97 to 78.00 ± 12.91 particles kg1 [34]. Meanwhile, the abundance of PFs with a diameter less than 0.20 mm in the crop soils of the suburbs of Wuhan ranged from 320 to 12,560 particles kg−1 [35]. The abundance of PFs less than 5 mm in the farmland soils of the suburbs of Zhejiang, Chudao Island, and Sanggou Bay was 17.10 particles kg−1 [36]. The abundance of PFs less than 0.50 mm in the farmland soils of the suburbs of Shaanxi Mountains, Loess Plateau, and Guanzhong Plain ranged from 1340 to 3140 particles kg−1 [37]. A comparison of the PFs in the soils of different cities included in the present study showed that the average abundance of PF in the cultivated soils of Sichuan Province was lower than that in the vegetable fields of Wuhan and the cultivated soils of Shaanxi Province, but higher than that in the cultivated soils of Shanghai City and Zhejiang Province.
Furthermore, the abundance and distribution of PF in different soil layers were analyzed (Figure 2a). More than 72% of PF was concentrated in the 0–20 cm soil layer, with a large amount of PF accumulated in the 0–10 cm soil layer (47.83% of the PF), followed by the 10–20 cm layer (33.17% of the PF); the amount of PF accumulated in the 20–30 cm soil layer was the least (19%). Earlier, Liu [34] reported values of 78.00 ± 12.91 particles kg−1 and 62.50 ± 12.97 particles kg−1 MPs in shallow and deep soils, respectively, for farmland soils of crop fields around the suburbs of Shanghai. Meanwhile, Huang reported 61.90 ± 20.60, 102.90 ± 69.40, and 68.00 ± 41.40 particles kg−1 PF in the 0–5, 5–20, and 20–40 cm soil layers, respectively, in the cotton fields of Xinjiang Uygur Autonomous Region [38]. Furthermore, Li [23] detected 26.10 kg hm−2 average residue in the 0–10 cm soil layer (77.70%), 5.92 kg hm−2 in the 10–20 cm soil layer (17.30%), and 1.73 kg hm−2 in the 20–30 cm soil layer (5%) in the farmland soils of Qingdao City. The present study’s results are consistent with these earlier findings. Previous studies concluded that the abundance of PF in shallow farmland soil (0–20 cm) was higher than that in deep soil (20–30 cm), both in the south and north, probably due to less runoff and soil loss in farmland, which reduced the movement of MPs in the surface layer [39]. Generally, light and small-sized MPs are quickly carried away by runoff and soil erosion [40].
In addition, the PF of the same sampling site showed different sizes. The size range of PF separated from the soil samples is shown in Figure 2b. The plastic fragments with a size less than 5 mm accounted for 71.98% of all samples, followed by those between 5 and 10 mm (16.59%); PFs longer than 10 mm were the least, accounting for 11.43%. In addition, the amount of PF with a size <5 mm was much higher than that with a size 5–10 mm and >10 mm. Chen [35] investigated the pollution due to PF in crop plots from the suburbs of Wuhan City and found that the proportion of PF particles sized less than 0.20 mm accounted for 70% in the soil samples, followed by 0.50–1.00 mm (13%), 0.20–0.50 mm (9%), and 1.00–3.00 mm (7%). Ding et al. [37] investigated the size distribution of PF in the cultivated soils in Shaanxi Province and found that small size PF was widely distributed in each sampling site, while its abundance was much higher than that of large PF. It indicated that the small PF may be caused by the decomposition of the large PF [37]. Our results showed that the abundance of PF in cultivated soils in the sampling area followed the sequence: size less than 5 mm, followed by 5–10 mm, and >10 mm. This result is basically consistent with Chen and Ding’s report, and the reason for this phenomenon may be that man-made farming activities or environmental degradation factors lead to the transformation of large-size PF to small size [23]. However, Li [23] found that the amount of PF with a particle size larger than 100 cm2 was the most prevalent (71.90%), followed by 20–100 cm2 (19.20%), 2–20 cm2 (7.30%), and <2 cm2 (1.60%) particles in the farmland soils of Qingdao City. In addition, Hu et al. [41] analyzed the size of the PF in the heavily polluted areas of Xinjiang Province and divided them into 0–4, 4–25, and >25 cm2, resulting in the proportion of quantitative distribution of PF with these three sizes in the soil being 1:7:2 [41]. This may be due to the fact that the thickness of the plastic film in north China was generally higher than that in south China [42] or that mechanical recovery is the main way in north China, which is rougher compared with artificial recovery [43], eventually leading to the larger size of PF than that in south China.
Rafique et al. [44] studied the distribution of MPs of different sizes in the topsoil of Lahore, Pakistan, and their results showed that the content of large-size MPs was the highest (300–5000 μm; 41.16%), followed by fine-size MPs (50–150 μm; 30.67%) and medium-size MPs (150–300 μm; 28.17%) [44]. The views of the teams of Hu and Rafique are different from our results, and the reason may be due to the quality of mulched film and the different degradability of microorganisms in farmland soils. In this regard, it is relevant that the thickness of mulched films used in China is primarily less than 0.005 mm, much lower than the films of 0.02 mm used in Europe or Japan [42]. Such thin films were supposed to be broken easily under cultivation and hard to be recycled. The residual plastic mulching in the fields may lose its integrity and break down into smaller and smaller plastic residues of various sizes (700 μm2–2850 cm2), and some of them would eventually form microplastics [45,46]. It leads to the majority of the small and medium-sized residual film in farmland soil in China, while the large-scale residual film is in the majority. In addition, microorganisms in farmland soil can promote the degradation of residual films. Imhof [47] explored this phenomenon and obtained results showing that MPs in farmland soil may experience intense weathering and decomposition, resulting in the transformation of large MPs into small and medium-sized MPs.

3.2. Morphological Characteristics of PF

PF had different shapes and colors in cultivated soils. The result of electron microscopy revealed that the shape of PFs was mainly flaky-like, fibrous-like, linear-like, and pellet-like (Figure 3). The flaky-like PFs were soft and thin. The fibrous-like PFs were narrow, linear, or soft, appearing as thin strips, while few were curly or wound together. The linear-like PFs were thin and soft, with varying lengths. The pellet-like PFs were hard, regular, or cylindrical-shaped. In addition, the amount of flaky-like PF accounted for 83%, fibrous-like PF accounted for 15.78%, linear-like PF accounted for 0.64%, and pellet-like PF accounted for 0.16%. The abundance of flaky-like PF was the largest at sampling site S3 in Lade Town, Zigong City, reaching 1008 particles kg−1. Furthermore, the fibrous-like, linear-like, and pellet-like PFs were detected in each sampling site, but sampling site S12 in Mengyang Town of Pengzhou City only contained pellet-like PF with an abundance of nine particles kg−1. Ding [37] found that the shapes of PF in the farmland soil of Shaanxi Province had fiber particles, film, and fragments (49%, 23.80%, and 21.90%, respectively), with fiber particles being the most widely distributed. Liu [34] reported that the MPs in 20 vegetable plots in the suburbs of Shanghai City were mainly fiber, fragment, film and pellet, of which the average percentage of fibers was the highest (53.33%), followed by fragment (37.58%), film (6.67%), and pellet (2.12%). These two studies showed that fibrous-like PF accounted for a large proportion in local farmland soil, but flake-like PF accounted for the largest proportion in our study. It may be caused by the various uses of different plastic materials [35]. Plastic materials are widely used in agricultural production, such as greenhouses, mulching film, pesticide cans, and fertilizer bags [48]. However, due to improper treatment and environmental degradation [49,50,51], various PFs remain in the soil [52]. Among them, most of the flaky-like films are formed by mulching film [17]. In this study, most of the cultivated soil in Sichuan Province was flaky-like PF, indicating that plastic mulching was the main input of plastic contamination in cultivated soil [53].
The color of PF in different regions is shown in Figure 4b, mainly including four colors (transparent, black, yellow, and blue). Among these, the amount of transparent PF was the highest, accounting for 60.06%, followed by black PF (38.97%); yellow and blue PF samples were the least, accounting for 0.48% and 0.48%, respectively. The color and abundance of PFs were also different among the sampling sites. The abundance of transparent PF in the S1, S2, S4, S6, S7, S9, S10, S11, S12, S13, S14, S15, S17, S18, and S20 sampling points was more than the other PF colors. The abundance of transparent PF at S11 was 192 particles kg−1, and all PFs at this sampling site were transparent. The black PF of S3, S5, S8, S16, and S19 was higher than other PF colors (875 particles kg−1, 117 particles kg−1, 250 particles kg−1, 108 particles kg−1, and 200 particles kg−1, respectively). In addition, sampling sites S12 and S18 had yellow PF, and their abundance was 17 particles kg−1 and 8 particles kg−1, respectively. Sampling site S12 contained blue PF at 25 particles kg−1 abundance. Chen [35] investigated MPs in 26 crop plots in the suburbs of Wuhan City and found that most plastics were red, black, green, blue, brown, or transparent. Liu [34] investigated MPs and medium plastics of 27 kinds of farmland soils in 20 vegetable plots in the suburbs of Shanghai City. There, black, blue, green, red, and transparent miniature (meso) plastics were found. These authors also found black as the highest in shallow soil (39.39%), and there were a small amount of green and red micro (medium) plastics in the crop soil, while blue micro (medium) plastics were the least likely to appear [34].
The color variety of PF in cultivated soil is mainly due to the different colors of mulching film. The color of mulching film is mainly transparent or black, and there are silver–gray, blue, and green according to the needs of crops [49]. Therefore, most of the transparent, black, and blue PF in the cultivated soil is caused by the decomposition of mulching film, and other colors of PFs may be produced by bottles and plastic bags [49,50,51]. In this study, the abundance of transparent PF in cultivated soil in Sichuan Province was higher than that of black, which may be due to the more transparent mulching film covered on cultivated soils in Sichuan Province. The yellow PFs may be caused by the non-recycling of woven bags applied with chemical fertilizers. Therefore, the type of PFs will be identified next.

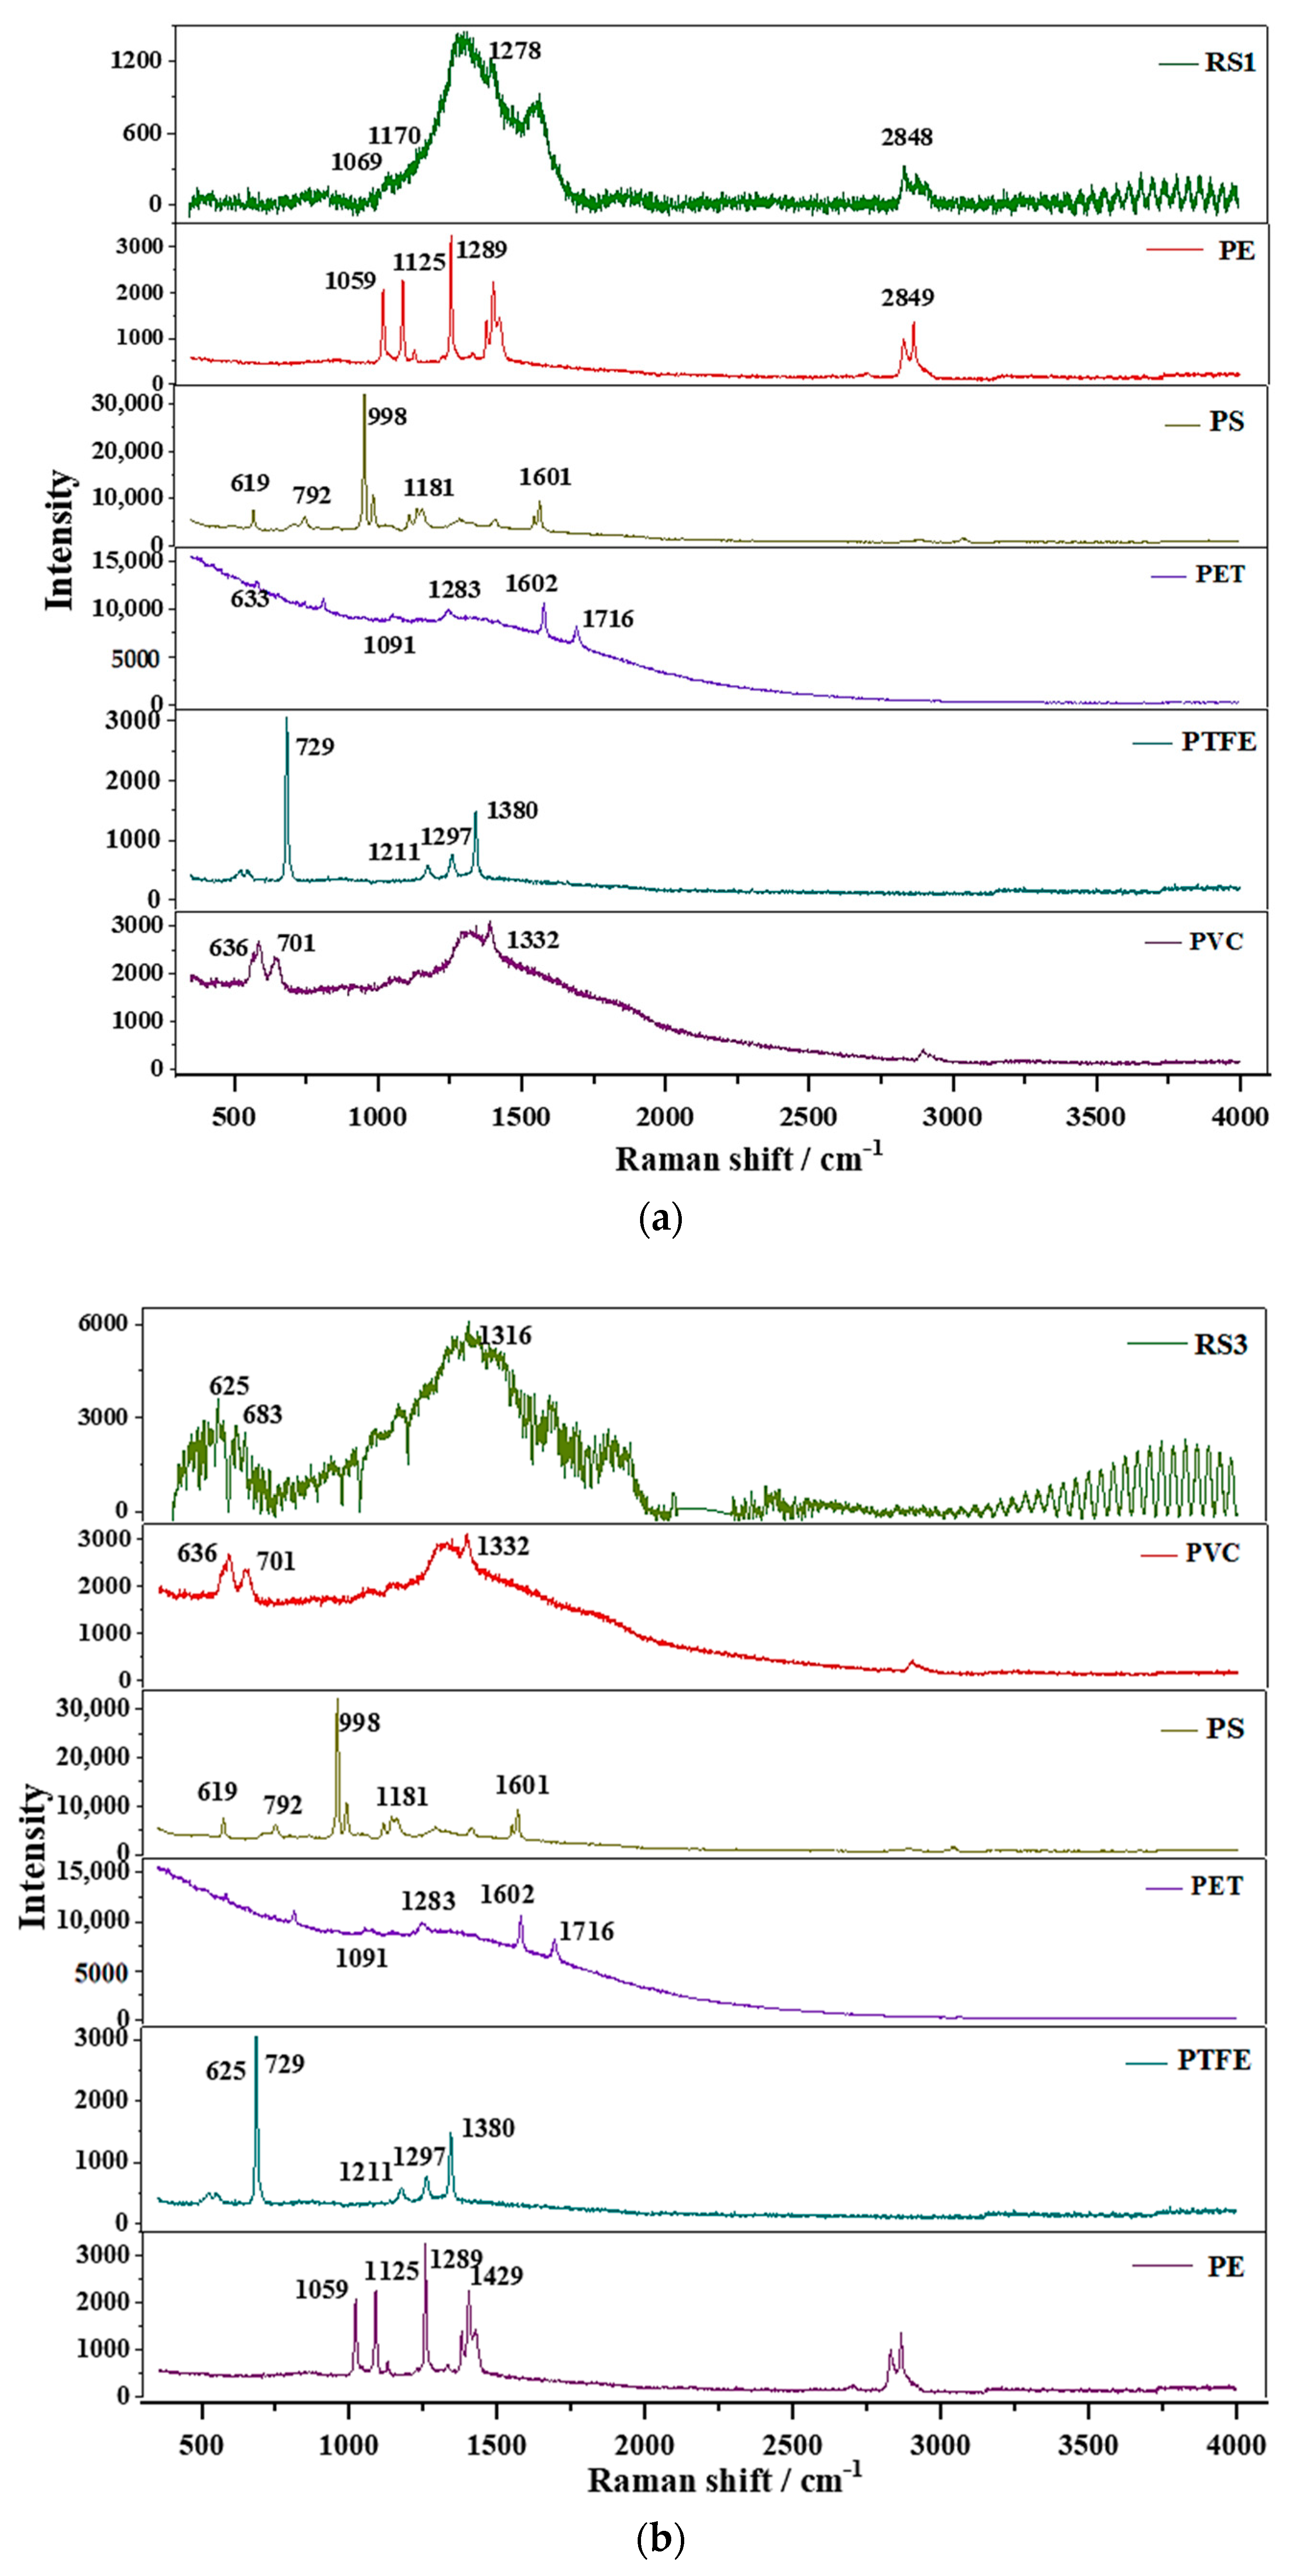
3.3. Identification of PF Type

According to the morphology and color difference of PF in 20 sampling sites, the 24 representatives PF were selected to identify plastic types by Raman spectroscopy. The 24 representatives PF were compared on PE, PVC, PET, PS, and PTFE, respectively. As shown in Figure 1, these 24 PF had different characteristics, such as: RS1, RS6, RS22, etc., represent transparent flaky-like PF; RS2, RS17, RS19, etc., represent black fibrous-like PF; RS3 represents blue fibrous-like PF; RS4, RS16, RS18, etc., represent black flaky-like PF; and RS5, RS12, RS24, etc., represent transparent fibrous-like PF. According to previous studies, Yang et al. [54] revealed several characteristic peaks of PE plastics, mainly appearing near 1059 cm−1, 1125 cm−1, 1289 cm−1, and 2849 cm−1. Additionally, the characteristic peaks of PVC plastics occurred near 636 cm−1, 701 cm−1, and 1332 cm−1 [54]. The result of Raman spectra analysis of RS1 is shown in Figure 5a, indicating that the characteristic peaks at 1069 cm−1, 1170 cm−1, 1278 cm−1, and 2848 cm−1 are consistent with the standard Raman spectra of PE, confirming RS1 as PE.
In the same way, the characteristic peak ranges of RS4–RS14, RS20, RS22, and RS24 are consistent with the standard Raman spectra of PE, so 18 samples of RS1, RS2, RS4-RS14, RS20, RS22, and RS24 are PE (Figure S1). The analysis of RS3 showed that the characteristic peaks at 625 cm−1, 683 cm−1, and 1419 cm−1 are consistent with PVC, confirming RS3 as PVC. In the same way, the characteristic peak range of RS16-RS19 and RS23 is consistent with the standard Raman spectrum of PVC, so the six samples of RS3, RS15, RS16-RS19, RS21, and RS23 are PVC (Figure S1).
The analysis of RS1 revealed that the characteristic peaks at 1318 cm−1 and 1548 cm−1 are consistent with the standard Raman spectra of PE, indicating RS1 as PE. In the same way, the characteristic peak ranges of RS4-RS15, RS20-RS22, and RS24 are consistent with the standard Raman spectra of PE, so 18 samples of RS1, RS2, RS4-RS14, RS20, RS22, and RS24 are PE (Figure S1). Further, comparing the Raman spectra of RS3 with the standard Raman spectra of PVC revealed three characteristic peaks of PVC plastics near 636 cm−1, 701 cm−1, and 1332 cm−1 [54]. The analysis of RS3 showed that the characteristic peaks at 625 cm−1, 683 cm−1, and 1316 cm−1 are consistent with PVC, concluding RS3 is PVC. In the same way, the characteristic peak range of RS15, RS16-RS19, RS21, and RS23 is consistent with the standard Raman spectrum of PVC, so six samples of RS3, RS15, RS16-RS19, RS21, and RS23 are PVC (Figure S1). In addition, according to literature review, the characteristic peaks of PP plastics occurred near 809 cm−1, 841 cm−1, 971 cm−1, 1149 cm−1, 1166 cm−1, 1322 cm−1, and 1451 cm−1 [55]. Additionally, the characteristic peaks of PA plastics occurred near 299.5 cm−1, 542.3 cm−1, 661.4 cm−1, 804.5 cm−1, 923.6 cm−1, 971.2 cm−1, and 1166.4 cm−1 [56]. As a result, it can be determined that there are only PFs of PE and PVC in the cultivated soil of the sampling sites.
According to statistics, most of the 24 representative PFs were PE (75%) and PVC (25%). Chen et al. [35] reported that the PFs of vegetable soil in the suburbs of Wuhan City are mainly polyamides (PA), followed by polypropylene (PP), polystyrene (PS), PE, and PVC [35], probably due to nylon woven bags in the soil that were not recycled or removed. Meanwhile, PS, PE, PP, high-density polyethylene (HDPE), PVC, and polyethylene terephthalate (PET) particles were found in farmland soils of Shaanxi Province [34]. Many different types of plastic were detected in the soil, indicating that their sources are likely to be different. PE and HDPE were found in the soil, which might be derived from plastic packaging, woven bags, and agricultural products [52], while PET, PP, and HDPE, are used to tie vegetables to poles or as a net for vine growth. PS particles, usually found in particles, are formed from the residue of packaging materials. The main sources of PVC may be pesticide woven bags and packaging materials or pipes and hoses in irrigation systems [34]. In this study, the type of plastic in the soil was mainly PE, probably derived from plastic packaging, woven bags, and PF. Part of the residue was PVC from pipes in irrigation systems or shed film residue. It showed that farmers in the sampling sites probably only use PE or PVC plastic packaging materials, woven bags, and agricultural products for farming activities, and the pipes and hoses in the irrigation system were mainly PVC plastic. There was no PET and PP plastic in the soil, which may be due to the fact that the vegetable binding material was still on the pole and did not fall into the soil. Therefore, in order to prevent the pollution of PE plastics in cultivated soil, the recovery of PE plastics should be strengthened, or alternatives should be sought for agricultural activities, such as the full biodegradable plastic film, degradable film synthesized by the chemical industry or plastic mulch films made from plant fibers [57].

3.4. Analysis of Factors Influencing PF

Based on the comprehensive analysis and collating of annual precipitation, planting pattern, soil texture, irrigation method, crop time, mulching time, and mulch film amount from questionnaires (Table S1, Supplementary Material), the RF algorithm was used to explain the influence of seven factors on PF (Figure 6a). Results showed that the variations in the amount of PF could be largely explained by the mulch film amount, annual precipitation, and planting pattern. Among the mulch film amount, the amount of PF was the most in the sampling sites where the annual mulch film amount was less than 100 kg year−1, followed by the sampling sites with an annual mulch film amount above 100–1000 kg year−1 and 1000 kg year−1 (Figure 6b). Li [26] investigated the PF in the farmlands in Qinghai Province and found that the more mulch film amount, the greater the residual rate. However, Yang et al. [54] investigated the current situation of PF in farmland in Inner Mongolia and found that the amount of PF in areas with high use of mulch film was not necessarily large. While in the areas where the use of mulch film was small, the amount of PF was not necessarily small. The results indicated that this is mainly related to the local agricultural production habits, the publicity efforts of the agricultural sector, and the level of agricultural productivity [54]. Therefore, mulching film recovery should be carried out after crop harvest, which can effectively prevent PF pollution.
Climatic factors also affect the distribution of plastics in soil. The average abundance of PF with annual precipitation >1100 mm was 353 particles kg−1, while those with annual precipitation of 0–1000 mm and 1000–1100 mm were 209 particles kg−1 and 189 particles kg−1, respectively (Figure 6c). Ding et al. [37] found that different climatic factors will lead to differences in MPs distribution. Northern Shaanxi Province had a temperate monsoon climate with less rainfall, where MPs would not be lost with surface runoff, resulting in a large amount of accumulation. However, the precipitation in Shaanxi Province generally showed a trend of increasing from north to south. Although the size and type of MPs in central and northern Shaanxi Province were similar, the abundance of MPs in northern Shaanxi Province was higher. Therefore, the abundance of MPs affected by rainfall in northern Shaanxi Province was significantly higher than that in the central and southern regions [37]. The present study concluded that the increase in annual precipitation would lead to an increase in PF abundance, which may be due to the large amount of surface residue reaching the deep layer with runoff, resulting in PF accumulation.
The amount of PF in the open field (584 particles kg−1) was much higher than that in the field (142 particles kg−1) and protected land (181 particles kg−1) (Figure 6d). Teng et al. [12] studied the amount of PF in different cultivated soils in Linyi City. Their results showed that there were significant differences in PF among various cultivated soils [12]. Li [26] studied the amount of PF in different crop soils in the eastern agricultural area of Qinghai Province, with results showing that the residue in the soil of open field vegetable planting was 3.30 and 2.20 times higher than that of field planting and protected field planting, respectively. The results of the present study showed that the abundance of PF in open field soil was significantly higher than that in fields and protected land, which was consistent with the results of the other previous studies commented above. The main reason was that the economic benefit in protected land was significantly higher than that of in open fields and fields. Hence, planting crops in protected land required intensive cultivation; furthermore, farmers’ recovery of PF in protected land was more meticulous, resulting in relatively less PF in protected land.

4. Prevention and Control Measures of PF in Cultivated Soil

With the continuous use of plastic products, the abundance of plastic residues may increase [52]. Studies showed that an important measure to reduce plastic pollution in the soil is to minimize or avoid the use of plastics in food production systems [58]. However, as an important source of plastic in agricultural soil, mulching film is indispensable in agricultural production. Therefore, rational use and forced recycling of traditional mulching film is a promising solution to reduce agricultural plastic pollution. The government and relevant departments should also strictly control the entry of low-grade mulch film (such as the thickness of less than 0.08 mm) into the market and encourage the use of alternative technologies such as high-strength mulching film and all-biodegradable mulching film [40,59]. In addition, it is necessary to prohibit the addition of microplastic particles to cosmetic, detergents, and other industrial products to prevent them from entering the soil through biological solids and irrigation water in daily life [38]. Therefore, people should pay great attention to the problem of PF pollution in farmland soil. It is urgent to reveal the law of PF pollution in the soil ecosystem and explore soil plastic analysis methods, evaluation methods, and management and remediation techniques.

5. Conclusions

In summary, this study demonstrated the significant differences in the PF abundance among the soil sampling sites of Sichuan Province. The highest PF value was found in the sampling site located in Lede Town, Zigong City, reaching 1158.33 ± 52.04 particles kg−1. Additionally, the lowest in the site was located in Foyin Town, Luzhou City, reaching 50.00 ± 25.00 particles kg−1. PF in these areas was mainly concentrated in the 0–20 cm soil layer (>72%). In addition, the PF in the cultivated soil was mainly transparent (60.06%) and flaky-like (83.41%), with sizes < 5 mm (63.61%). A percentage value of 75% of the representative PF was PE PFs, and 25% was PVC PFs. Further analysis showed that the mulch film amount, annual precipitation, and planting pattern had a great influence on the abundance of PF. Taken together, these results provide data to support and encourage the prevention and control of PF pollution in the soils of Sichuan Province. This paper makes a preliminary study on the PF in the cultivated soil of Sichuan Province and the main controlling factors affecting its abundance, which lays a foundation for the prevention and control of plastic pollution in the cultivated soil and provides a guiding basis for ensuring soil safety. This can be seen as a specific example of an environmental issue with worldwide relevance. Future studies should also focus on the fate of PF in the soil environment, their interactions with microorganisms, rhizosphere, food crops, and soil animals.

Supplementary Materials

The following supporting information can be downloaded at: https://0-www-mdpi-com.brum.beds.ac.uk/article/10.3390/w14091417/s1, Figure S1: Raman spectra of all tested samples; Table S1: The questionnaire information about sampling sites; Table S2: The differences in the abundance of PF in different sampling sites; Table S3: Selection of representative samples in sampling sites; File S1: The code of “forestplot” package in R ver 3.5.1.

Author Contributions

H.Z. and T.J.: Data curation, Visualization, Software, Formal analysis, Writing—original draft. M.G.: Writing—review and editing. G.L.: Writing—review and editing. A.N.D. and Y.Z.: Visualization, Writing—review and editing. J.L.: Formal analysis, Writing—review and editing. K.C. and J.P.: Formal analysis, Supervision, J.F.: Project administration, Resources, Funding acquisition. All authors have read and agreed to the published version of the manuscript.

Funding

This study was supported by Scientific Research Foundation of Hunan Provincial Education Department (No. 19B268), Changsha Municipal Natural Science Foundation (No. kq2202233), and Science and technology innovation leading plan of high-tech industry in Hunan Province (No. 2021GK4055).

Institutional Review Board Statement

Not applicable.

Informed Consent Statement

Not applicable.

Data Availability Statement

Data are available on-demand from the corresponding author.

Acknowledgments

We would like to extend special thanks to the editor and the anonymous reviewers for their valuable comments in significantly improving this paper’s quality.

Conflicts of Interest

The authors declare that they have no known competing financial interests or personal relationships that could have appeared to influence the work reported in this paper.

References

  1. Browne, M.A.; Underwood, A.J.; Chapman, M.G.; Williams, R.; Thompson, R.C.; van Franeker, J.A. Linking effects of anthropogenic debris to ecological impacts. Proc. R. Soc. B Biol. Sci. 2015, 282, 20142929. [Google Scholar] [CrossRef] [PubMed] [Green Version]
  2. Li, W.C.; Tse, H.F.; Fok, L. Plastic waste in the marine environment: A review of sources, occurrence and effects. Sci. Total Environ. 2016, 566–567, 333–349. [Google Scholar] [CrossRef] [PubMed]
  3. Rillig, M.C. Microplastic in terrestrial ecosystems and the soil? Environ. Sci. Technol. 2012, 46, 6453–6454. [Google Scholar] [CrossRef] [PubMed]
  4. Souza, M.A.A.; Kloas, W.; Zarfl, C.; Hempel, S.; Rillig, M.C. Microplastics as an emerging threat to terrestrial ecosystems. Glob. Chang. Biol. 2018, 24, 1405–1416. [Google Scholar] [CrossRef] [Green Version]
  5. Nizzetto, L.; Bussi, G.; Futter, M.N.; Butterfield, D.; Whitehead, P.G. A theoretical assessment of microplastic transport in river catchments and their retention by soils and river sediments. Environ. Sci. Process. Impacts 2016, 18, 1050–1059. [Google Scholar] [CrossRef]
  6. Yang, X.; Bento, C.P.M.; Chen, H.; Zhang, H.; Xue, S.; Lwanga, E.H. Influence of microplastic addition on glyphosate decay and soil microbial activities in Chinese loess soil. Environ. Pollut. 2018, 242, 338–347. [Google Scholar] [CrossRef]
  7. Yin, L.; Liu, H.; Cui, H.; Chen, B.; Li, L.; Wu, F. Impacts of polystyrene microplastics on the behavior and metabolism in a marine demersal teleost, black rockfish (Sebastes schlegelii). J. Hazard. Mater. 2019, 380, 120861. [Google Scholar] [CrossRef]
  8. Fuller, S.; Gautam, A. A Procedure for Measuring Microplastics using Pressurized Fluid Extraction. Environ. Sci. Technol. 2016, 50, 5774–5780. [Google Scholar] [CrossRef] [Green Version]
  9. Huerta, L.E.; Gertsen, H.; Gooren, H.; Peters, P.; Salanki, T.; van der Ploeg, M. Incorporation of microplastics from litter into burrows of Lumbricus terrestris. Environ. Pollut. 2017, 220, 523–531. [Google Scholar] [CrossRef]
  10. Kazour, M.; Jemaa, S.; Issa, C.; Khalaf, G.; Amara, R. Microplastics pollution along the Lebanese coast (Eastern Mediterranean Basin): Occurrence in surface water, sediments and biota samples. Sci. Total Environ. 2019, 696, 133933. [Google Scholar] [CrossRef]
  11. Zhang, S.W.; Han, B.; Sun, Y.H.; Wang, F. Microplastics influence the adsorption and desorption characteristics of Cd in an agricultural soil. J. Hazard. Mater. 2019, 388, 121775. [Google Scholar] [CrossRef] [PubMed]
  12. Teng, S.H.; Li, X.X.; Fang, X.Y.; Zhang, X.S.; Yang, H.E. Residue Coefficient of Agricultural Mulch Film and Its Influencing Factors in Linyi. J. Agric. 2018, 8, 11–14. [Google Scholar]
  13. Daryanto, S.; Wang, L.; Jacinthe, P.A. Can ridge-furrow plastic mulching replace irrigation in dryland wheat and maize cropping systems? Agric. Water Manag. 2017, 190, 1–5. [Google Scholar] [CrossRef] [Green Version]
  14. Gao, H.; Yan, C.; Liu, Q.; Ding, W.; Chen, B.; Li, Z. Effects of plastic mulching and plastic residue on agricultural production: A meta-analysis. Sci. Total Environ. 2019, 651, 484–492. [Google Scholar] [CrossRef]
  15. Yang, N.; Sun, Z.X.; Feng, L.S.; Zheng, M.Z.; Chi, D.C.; Meng, W.Z. Plastic Film Mulching for Water-Efficient Agricultural Applications and Degradable Films Materials Development Research. Mater. Manuf. Process. 2014, 30, 143–154. [Google Scholar] [CrossRef]
  16. Du, C.; Liang, H.; Li, Z.; Gong, J. Pollution Characteristics of Microplastics in Soils in Southeastern Suburbs of Baoding City, China. Int. J. Environ. Res. Public Health 2020, 17, 845. [Google Scholar] [CrossRef] [Green Version]
  17. Yan, C.R.; Liu, E.K.; Shu, F.; Liu, Q.; Liu, S.; He, W.Q. Review of Agricultural Plastic Mulching and Its Residual Pollution and Prevention Measures In China. J. Agric. Resour. Environ. 2014, 31, 95–102. [Google Scholar] [CrossRef]
  18. Xue, Y.H.; Jin, T.; Zhou, J.; Wei, L.L.; Gao, H.H.; Xu, Z.Y. Investigation And Analysis On The Use And Recycling Of Plastic Film In Typical Redions—Based On The Survey Data Of Hebei, inner Mongolia And Sichuan. Chin. J. Agric. Resour. Reg. Plan. 2021, 42, 10–15. [Google Scholar] [CrossRef]
  19. Zhang, D.; Hu, W.; Liu, H. Characteristics of residual mulching film and residual coefficient of typical crops in North China. T. Chin. Soc. Agric. Eng. 2016, 32, 1–5. [Google Scholar] [CrossRef]
  20. Fei, Y.; Huang, S.; Zhang, H.; Tong, Y.; Wen, D.; Xia, X. Response of soil enzyme activities and bacterial communities to the accumulation of microplastics in an acid cropped soil. Sci. Total Environ. 2020, 707, 135634. [Google Scholar] [CrossRef]
  21. Luo, G.W.; Jin, T.; Zhang, H.R.; Peng, J.W.; Zuo, N.; Huang, Y.; Han, Y.L.; Tian, C.; Yang, Y.; Peng, K.W.; et al. Deciphering the diversity and functions of plastisphere bacterial communities in plastic-mulching croplands of subtropical China. J. Hazard. Mater. 2022, 422, 126865. [Google Scholar] [CrossRef] [PubMed]
  22. Cheng, W.L. Quantity and distribution of microplastics in film mulching farmland soil of Northwest China. J. Agro-Environ. Sci. 2020, 39, 2561–2568. [Google Scholar] [CrossRef]
  23. Li, Y.C.; Li, H.P.; Wang, Y.X.; Sun, Y.P.; Wang, K.R.; Yang, Q.X. Pollution Status and Control Countermeasures of Polyethylene Mulch Film Residue in Farmland Soils of Qingdao City, China. J. Agric. Resour. Environ. 2017, 34, 226–233. [Google Scholar] [CrossRef]
  24. Jia, H.C.; Zhang, Y.; Tian, S.Y.; Emon, R.M.; Yang, X.Y.; Yan, H.R.; Wu, T.T.; Lu, W.C.; Siddique, K.H.M.; Han, T.F. Reserving winter snow for the relief of spring drought by film mulching in northeast China. Field Crops Res. 2017, 209, 58–64. [Google Scholar] [CrossRef]
  25. Zhou, M.D.; Hu, W.L.; Gen, Y.J.; Dong, H.G.; Qin, X.H. Influence Factors of Residual Film’s Distribution in Xinjiang. J. Anhui Agric. Sci. 2015, 27, 189–191. [Google Scholar] [CrossRef]
  26. Li, Y.M. Analysis on Current Situation of Mulching Film Reside in Qinghai Province. Heilongjiang Acad. Agric. Sci. 2015, 51–54, 55. [Google Scholar] [CrossRef]
  27. Li, Q. Content and change characteristics of carbon and nitrogen in main Forest soil types in Sichuan Province. Electr. China Sci. Technol. 2021, 1, 0196. [Google Scholar]
  28. Chen, Q.Q.; Tang, Z.Y.; Yang, L.; Song, F.L.; Lu, H.G. Analysis of Air Temperature and Precipitation in Sichuan. J. Chengdu Univ. Inf. Technol. 2017, 32, 200–207. [Google Scholar]
  29. Wan, X.W.; Tian, H.; Yin, Y. Discussion on the occurrence and Monitoring and early warning measures of Diseases and insect pests of Economic crops in Sichuan Province. China Plant Prot. 2021, 41, 4. [Google Scholar]
  30. Zhang, G.S.; Liu, Y.F. The distribution of microplastics in soil aggregate fractions in southwestern China. Sci. Total Environ. 2018, 642, 12–20. [Google Scholar] [CrossRef]
  31. He, D.F.; Luo, Y.M.; Lu, S.B.; Liu, M.T.; Song, Y.; Lei, L.L. Microplastics in soils: Analytical methods, pollution characteristics and ecological risks. TrAC-Trends Anal. Chem. 2018, 109, 163–172. [Google Scholar] [CrossRef]
  32. Mai, L.; Bao, L.J.; Shi, L.; Wong, C.S.; Zeng, E.Y. A review of methods for measuring microplastics in aquatic environments. Environ. Sci. Pollut. Res. 2018, 25, 11319–11332. [Google Scholar] [CrossRef] [PubMed]
  33. Breiman, L. Random forests. Mach. Learn. 2001, 45, 5–32. [Google Scholar] [CrossRef] [Green Version]
  34. Liu, M.; Lu, S.; Song, Y.; Lei, L.; Hu, J.; Lv, W. Microplastic and mesoplastic pollution in farmland soils in suburbs of Shanghai, China. Environ. Pollut. 2018, 242, 855–862. [Google Scholar] [CrossRef] [PubMed]
  35. Chen, Y.; Leng, Y.; Liu, X.; Wang, J. Microplastic pollution in vegetable farmlands of suburb Wuhan, central China. Environ. Pollut. 2020, 257, 113449. [Google Scholar] [CrossRef] [PubMed]
  36. Xiong, K.X. The Study on Pollution Characteristics and Influencing Factors of Microplastics in Sanggou Bay, Yellow Sea. Ph.D. Thesis, Zhejiang Ocean University, Zhoushan, China, 2019. [Google Scholar]
  37. Ding, L.; Zhang, S.; Wang, X.; Yang, X.; Zhang, C.; Qi, Y.; Guo, X. The occurrence and distribution characteristics of microplastics in the agricultural soils of Shaanxi Province, in north-western China. Sci. Total Environ. 2020, 720, 137525. [Google Scholar] [CrossRef] [PubMed]
  38. Huang, Y.; Liu, Q.; Jia, W.Q.; Yan, C.R.; Wang, J. Agricultural plastic mulching as a source of microplastics in the terrestrial environment. Environ. Pollut. 2020, 260, 114096. [Google Scholar] [CrossRef] [PubMed]
  39. Zhang, Z.Y.; Sheng, L.T.; Yang, J.; Chen, X.A.; Kong, L.L.; Wagan, B. Effects of Land Use and Slope Gradient on Soil Erosion in a Red Soil Hilly Watershed of Southern China. Sustainability 2015, 7, 14309–14325. [Google Scholar] [CrossRef] [Green Version]
  40. Hurley, R.; Nizzetto, L. Fate and occurrence of micro(nano)plastics in soils: Knowledge gaps and possible risks. Curr. Opin. Environ. Sci. Health 2018, 1, 6–11. [Google Scholar] [CrossRef]
  41. Hu, C.; Wang, X.F.; Cheng, X.G.; Tang, X.Y.; Zhao, Y.; Yan, C.R. Current situation and control strategies of residual film pollution in Xinjiang. Trans. Chin. Soc. Agric. Eng. 2019, 35, 213–224. [Google Scholar] [CrossRef]
  42. Zhao, Y.; Chen, X.G.; Wen, H.J.; Zheng, X.; Niu, Q.; Kang, J.M. Research Status and Prospect of Control Technology for Residual PlasticFilm Pollution in Farmland. J. Agric. Mach. 2017, 48, 14. [Google Scholar]
  43. Xiong, H.Y.; Li, M. Cotton cultivation problems and technical innovation suggestions under the new situation. New Agric. 2021, 15, 52. [Google Scholar]
  44. Rafique, A.; Irfan, M.; Mumtaz, M.; Qadir, A. Spatial distribution of microplastics in soil with context to human activities: A case study from the urban center. Environ. Monit. Assess. 2020, 192, 671. [Google Scholar] [CrossRef] [PubMed]
  45. Steinmetz, Z.; Wollmann, C.; Schaefer, M.; Buchmann, C.; David, J.; Troger, J. Plastic mulching in agriculture. Trading short-term agronomic benefits for long-term soil degradation? Sci. Total Environ. 2016, 550, 690–705. [Google Scholar] [CrossRef] [PubMed]
  46. Briassoulis, D.; Babou, E.; Hiskakis, M.; Kyrikou, I. Analysis of long-term degradation behaviour of polyethylene mulching films with pro-oxidants under real cultivation and soil burial conditions. Environ. Sci. Pollut. Res. 2015, 22, 2584–2598. [Google Scholar] [CrossRef] [PubMed]
  47. Imhof, H.K.; Laforsch, C.; Wiesheu, A.C.; Schmid, J.; Anger, P.M.; Niessner, R. Pigments and plastic in limnetic ecosystems: A qualitative and quantitative study on microparticles of different size classes. Water Res. 2016, 98, 64–74. [Google Scholar] [CrossRef] [PubMed]
  48. Horodytska, O.; Valdes, F.J.; Fullana, A. Plastic flexible films waste management—A state of art review. Waste Manag. 2018, 77, 413–425. [Google Scholar] [CrossRef]
  49. Zhou, B.; Wang, J.; Zhang, H.; Shi, H.; Fei, Y.; Huang, S.; Tong, Y.; Wen, D.; Luo, Y.; Barcelo, D. Microplastics in agricultural soils on the coastal plain of Hangzhou Bay, east China: Multiple sources other than plastic mulching film. J. Hazard. Mater. 2020, 388, 121814. [Google Scholar] [CrossRef]
  50. Zhou, Y.; Liu, X.; Wang, J. Characterization of microplastics and the association of heavy metals with microplastics in suburban soil of central China. Sci. Total Environ. 2019, 694, 133798. [Google Scholar] [CrossRef]
  51. Wang, J.; Li, J.; Liu, S.; Li, H.; Chen, X.; Peng, C.; Zhang, P.; Liu, X. Distinct microplastic distributions in soils of different land-use types: A case study of Chinese farmlands. Environ. Pollut. 2021, 269, 116199. [Google Scholar] [CrossRef]
  52. Antunes, J.C.; Frias, J.G.L.; Micaelo, A.C.; Sobral, P. Resin pellets from beaches of the Portuguese coast and adsorbed persistent organic pollutants. Estuar. Coast. Shelf Sci. 2013, 130, 62–69. [Google Scholar] [CrossRef]
  53. Yang, Y.; He, W.Q. Research status and progress of microplastic pollution in farmland soil. Environ. Eng. 2021, 39, 156–164+15. [Google Scholar]
  54. Yang, Y.M.; Fu, J.W.; Pang, Z.; Yang, S.J.; Cao, J.G. Analysis on the Current Situation of Farmland Film Residue in Inner Mongolia. Inn. Mong. Agric. Sci. Technol. 2010, 1, 10–12. [Google Scholar] [CrossRef]
  55. Ma, X.; Jiang, H.G.Y.; Chen, M.P. Research on Inspecting the Plastic Pack Belts (Ropes) by Raman Spectroscopy. Shanghai Plast. 2018, 4, 29–35. [Google Scholar] [CrossRef]
  56. Tong, N.; Zhu, C.J.; Zhang, C.H.; Zhang, Y.X. Effect of chemical treatment on aliphatic polyamide fibersRaman spectra. Basic Sci. J. Text. Univ. 2015, 28, 366–369. [Google Scholar] [CrossRef]
  57. Zhang, Q.C. Analysis on the progress of environment-friendly substitutes for plastic mulch film. Real Estate Guid. 2014, 33, 459. [Google Scholar]
  58. Horton, A.A.; Svendsen, C.; Williams, R.J.; Spurgeon, D.J.; Lahive, E. Large microplastic particles in sediments of tributaries of the River Thames, UK-Abundance, sources and methods for effective quantification. Mar. Pollut. Bull. 2017, 114, 218–226. [Google Scholar] [CrossRef] [Green Version]
  59. Lin, Z.; Jin, T.; Zou, T.; Xu, L.; Xi, B.; Xu, D.; He, J.; Xiong, L.; Tang, C.; Peng, J.; et al. Current progress on plastic/microplastic degradation: Fact influences and mechanism. Environ. Pollut. 2022, 403, 119159. [Google Scholar] [CrossRef]
Figure 1. Schematic diagram showing the sampling sites in Sichuan Province.
Water 14 01417 g001
Figure 2. The abundance and distribution of PF in the different regions of Sichuan Province. (a) Residual amount and distribution of PF in the different soil layers; (b) Size distribution of PF in the soil samples from different areas of Sichuan Province.
Water 14 01417 g002
Figure 3. Shape and size of PFs observed using an electron microscope.
Water 14 01417 g003
Figure 4. Morphological characteristics of PF in different regions of Sichuan Province. (a) Shape distribution of PF in the sample; (b) Color distribution of PF in the sample.
Water 14 01417 g004
Figure 5. Identification of PF samples by Raman Spectroscopy. (a) Comparison diagram of RS1 Raman spectrum of sample and standard Raman spectrum of plastic; (b) Comparison diagram of RS3 Raman spectrum of sample and standard Raman spectrum of plastic.
Water 14 01417 g005
Figure 6. Influence of factors on PF in sampling sites. (a) Random-forest map of factors affecting PF; (b) Effect of film mulch amount on the PF; (c) Effect of annual precipitation on the PF; (d) Effect of planting pattern on the PF.
Water 14 01417 g006aWater 14 01417 g006b
Table 1. The abundance of PF at sampling sites.
RegionMin/Particles kg−1Max/Particles kg−1Mean/Particles kg−1Std. Dev.
S1450550500.00 50.00
S2125225166.67 52.04
S3110012001158.33 52.04
S4325375350.00 25.00
S5175200183.33 14.43
S6125200158.33 38.19
S7200250216.67 28.87
S8275325300.00 25.00
S9100125108.33 14.43
S10257550.00 25.00
S11175200191.67 14.43
S12250300266.67 28.87
S13100125108.33 14.43
S14175250208.33 38.19
S15250275258.33 14.43
S16150175166.67 14.43
S17200250225.00 25.00
S187512591.67 28.87
S19250275258.33 14.43
S20200225208.33 14.43
Publisher’s Note: MDPI stays neutral with regard to jurisdictional claims in published maps and institutional affiliations.

