Article

Hazard Characterization of the Annual Maximum Daily Precipitation in the Southwestern Iberian Peninsula (1851–2021)

by
Julia Morales
1,
Leoncio García-Barrón
2,
Mónica Aguilar-Alba
3 and
Arturo Sousa
1,*
1
Department of Plant Biology and Ecology, Universidad de Sevilla, 41012 Seville, Spain
2
Department of Applied Physics II, Universidad de Sevilla, 41012 Seville, Spain
3
Department of Physical Geography and AGR, Universidad de Sevilla, 41004 Seville, Spain
*
Author to whom correspondence should be addressed.
Submission received: 14 March 2022 / Revised: 23 April 2022 / Accepted: 3 May 2022 / Published: 7 May 2022

Abstract

:
High-intensity rainfall can raise fluvial channel levels, increasing the risk of flooding. Maximum precipitation depths are used to estimate return periods and, thus, calculate the risk of this type of event. To improve these estimates in Southwest Europe, we studied the behavior of extreme rainfall using the historical records of San Fernando (Cádiz, southwest Spain), obtaining the maximum daily annual rainfall (period 1851–2021). Local risk levels for intense precipitation were established based on the mean values and standard deviation of daily precipitation. In this series, 38% of the years had some type of risk (>53.7 mm), of which 13% of these years had high risk (>73.2 mm) or disaster risk (>92.7 mm). In these risk thresholds, the maximum daily precipitation is mostly concentrated in the autumn months. The SQRT-ETMax model used fits well with the instrumental historical records for return periods of up to 25 years, although it may present appreciable deviations for longer return periods. Using a 170-year secular series, a more precise understanding of extreme periods and precipitation variability was obtained.

1. Introduction

The precipitation of the Mediterranean climate is characterised by its interannual irregularity [1,2,3], high variability in total annual rainfall and recurring drought periods [4,5,6]. It also shows great intra-annual irregularity [7], in which most of the daily precipitation records are null. Therefore, the total annual precipitation accumulates in relatively few days. Moreover, the Mediterranean region is affected by heavy storms, whose duration is frequently shorter than one day [8,9,10,11,12,13]. This explains that Mediterranean basins can be affected by severe flooding caused by extreme rainfall. There is a growing concern about the possible increase in heavy rainfall events associated with climate change [14]. Therefore, knowledge on the temporal resolution of rainfall data, in which extreme precipitation amounts are considered or aggregation time (ta) is relevant, issue in the heavy rainfall analysis. This is because in areas with a Mediterranean climate, the greatest intensity of precipitation occurs in hourly or sub-hourly periods.
However, the traditional manual meteorological observatories do not provide information on precipitation in hourly or sub-hourly scales. In addition to this, there are few studies on the Mediterranean region that relate the daily records with intensity–duration–frequency (IDF) methods to quantify the probability of recurrence of extreme precipitation [15,16,17,18]. A database with information on the temporal resolution of 25,423 rainfall stations from 32 study areas around the world was published in 2020 [19]. For the oldest rainfall stations in this study, the record started manually with a time resolution around 24 h. The oldest recorded rainfall data, dated in 1805, corresponded to an observatory in southern Spain (San Fernando, Cádiz), with a time resolution of several days [20].
Torrential rains, which take place on a small spatial scale (and over a short timespan), can cause serious erosive impacts [21,22], landslides [23], and flooding hazards in hydrological basins [24,25] or in agricultural lands and urban areas next to floodplains. Therefore, the vulnerability of these areas is very high in cases of intense rainfall, which can be the cause of serious environmental, economic and social impacts [26]. In fact, the long return periods of extreme events are frequently disregarded in urban management, which subsequently leads to disastrous damage. The topic developed in this study stands out for the novelty of analysing the temporal evolution of extreme rainfall in secular periods. Despite the important effects of torrential rainfall with serious environmental and social impacts, it is a subject that has not received sufficient attention, perhaps due to the lack of daily records in long-term series.
Fitting the temporal series of the annual maximum daily precipitation to theoretical models in Mediterranean climates is a complex task, due to the irregularity of this variable in the Mediterranean area [24,27]. The shortage of secular series of daily precipitation required good estimation of extreme probability values, as well as the identification of the different physical factors involved [28]. Statistical inference techniques are sensitive to the starting information, especially in the case of maximum precipitation. It has been observed [29] that, when a series does not cover a long period of time, the results of the model may be incorrect. In general, the annual maximum daily precipitation of each year and the resulting series fits to a probability distribution of maximum values [30]. The relevance of these topics has stimulated the development of analytical techniques to assess independent temporal variations and identify the trends of extreme events [30]. In Spain, the Ministry of Development adopted the square-root exponential-type distribution function SQRT-ETMax to theoretically characterise the annual maximum daily precipitation [31] which is used in the management of hydrographic basins. Several studies have also used the results of maximum precipitation provided by this model (SQRT-ETMax) to develop an intensity–duration–frequency equation [32], in order to estimate the probability of rainfall in basins for the management of hydraulic dams [33,34] or to establish the flooding risk in public areas caused by sudden rainfall [35]. This model has also been used jointly with the probability distribution provided by other models, such as Gumbel, GEV, etc. [36].
Traditionally, the Gumbel distribution has been the most frequently used model to calculate the hazard associated with intense rainfall by state official departments dealing with flood risk management, such as the Spanish Centre for Public Works Studies and Experimentation [37]. Further, the Spanish Meteorological Agency (AEMET) provides methods to calculate return periods of maximum daily precipitation and maximum intensity precipitation using the Gumbel fit [38]. However, other studies highlighted its limitations when it was applied to hydrological extremes, thus, questioning its utility [39,40]. The extreme value theory (EV) provides a set of tools to analyse the statistical distribution of extreme precipitation, such as the Gumbel distribution (EVI), the Fréchet distribution (EVII), and the Weibull distribution (EVIII). These can be combined in a single asymptotic distribution of the generalised extreme value (GEV) [41]. GEV has been used to fit long temporal series of annual maximum daily precipitation. An extensive analysis to describe this meteorological event [42] found that the EVII was the most suitable distribution. However, other analyses established that the use of GEV is not completely satisfactory for this type of study [43,44].
The applications of extreme value theory (EV) frequently assume the stationarity of the process, since, for the analysis of risks, it is interesting to verify whether the temporal series of maximum daily precipitation are stationary (i.e., whether they maintain their mean value and variability) or show long-term trends or cycles. Such information has become especially relevant concerning climate change studies [45].
The changes in the frequency and intensity of the extreme events provide valuable information to understand the sensitivity of the region to climatic variability, which can be used to predict future climatic responses to global warming. Only long historical series can be used to accurately detect changes in the frequency, length and magnitude of extreme events. This is even more relevant in Mediterranean climates, since precipitation is one of the most uncertain variables where estimation is especially important due to the great impact on water resources and on the evaluation of extreme values in the occurrence of droughts and floods.
A complementary approach to the interannual annual maximum daily precipitation evolution is its possible relationship with the North Atlantic Oscillation (NAO), as a cause influencing its temporal variability. The NAO measures the variability of the normalized pressure gradient between the high circumpolar pressures of Iceland and those of the Azores Island subtropical anticyclone. When the pressure difference is attenuated, the NAO phase, the entry of the rainy Atlantic front into the Iberian Peninsula is favoured. It is precisely the southwestern quadrant of the Iberian Peninsula where the NAO effect is most prominent [46]. The correlation between the NAO index and the corresponding monthly rainfall has been verified mainly during the winter months [47,48,49], as well as its impact on the intra-annual distribution [50]. Some studies that relate the NAO index with the frequency and intensity of daily rainfall [51,52] have been carried out. However, studies on the effect of atmospheric circulation on maximum daily rainfall or on the environmental impact of torrential rainfall are not frequent. Therefore, we consider that it is interesting to analyse the NAO influence on the annual maximum daily precipitation in the study area.
The aim of the present study was to analyse the evolution of the annual maximum daily precipitation in the southwestern Iberian Peninsula, using one of the longest series available for the area that comprises the 1851–2021 period using the SQRT-ETMax model [31]. This model allows for calculating the magnitude and variability of extreme precipitation, as well as changes based on the existence of long-term trends or cycles, in both frequency and variability. The obtained results will allow for establishing a hazardous precipitation component associated with the risk of maximum daily rainfall, recorded annually in the southwestern Iberian Peninsula for a period of 170 years.

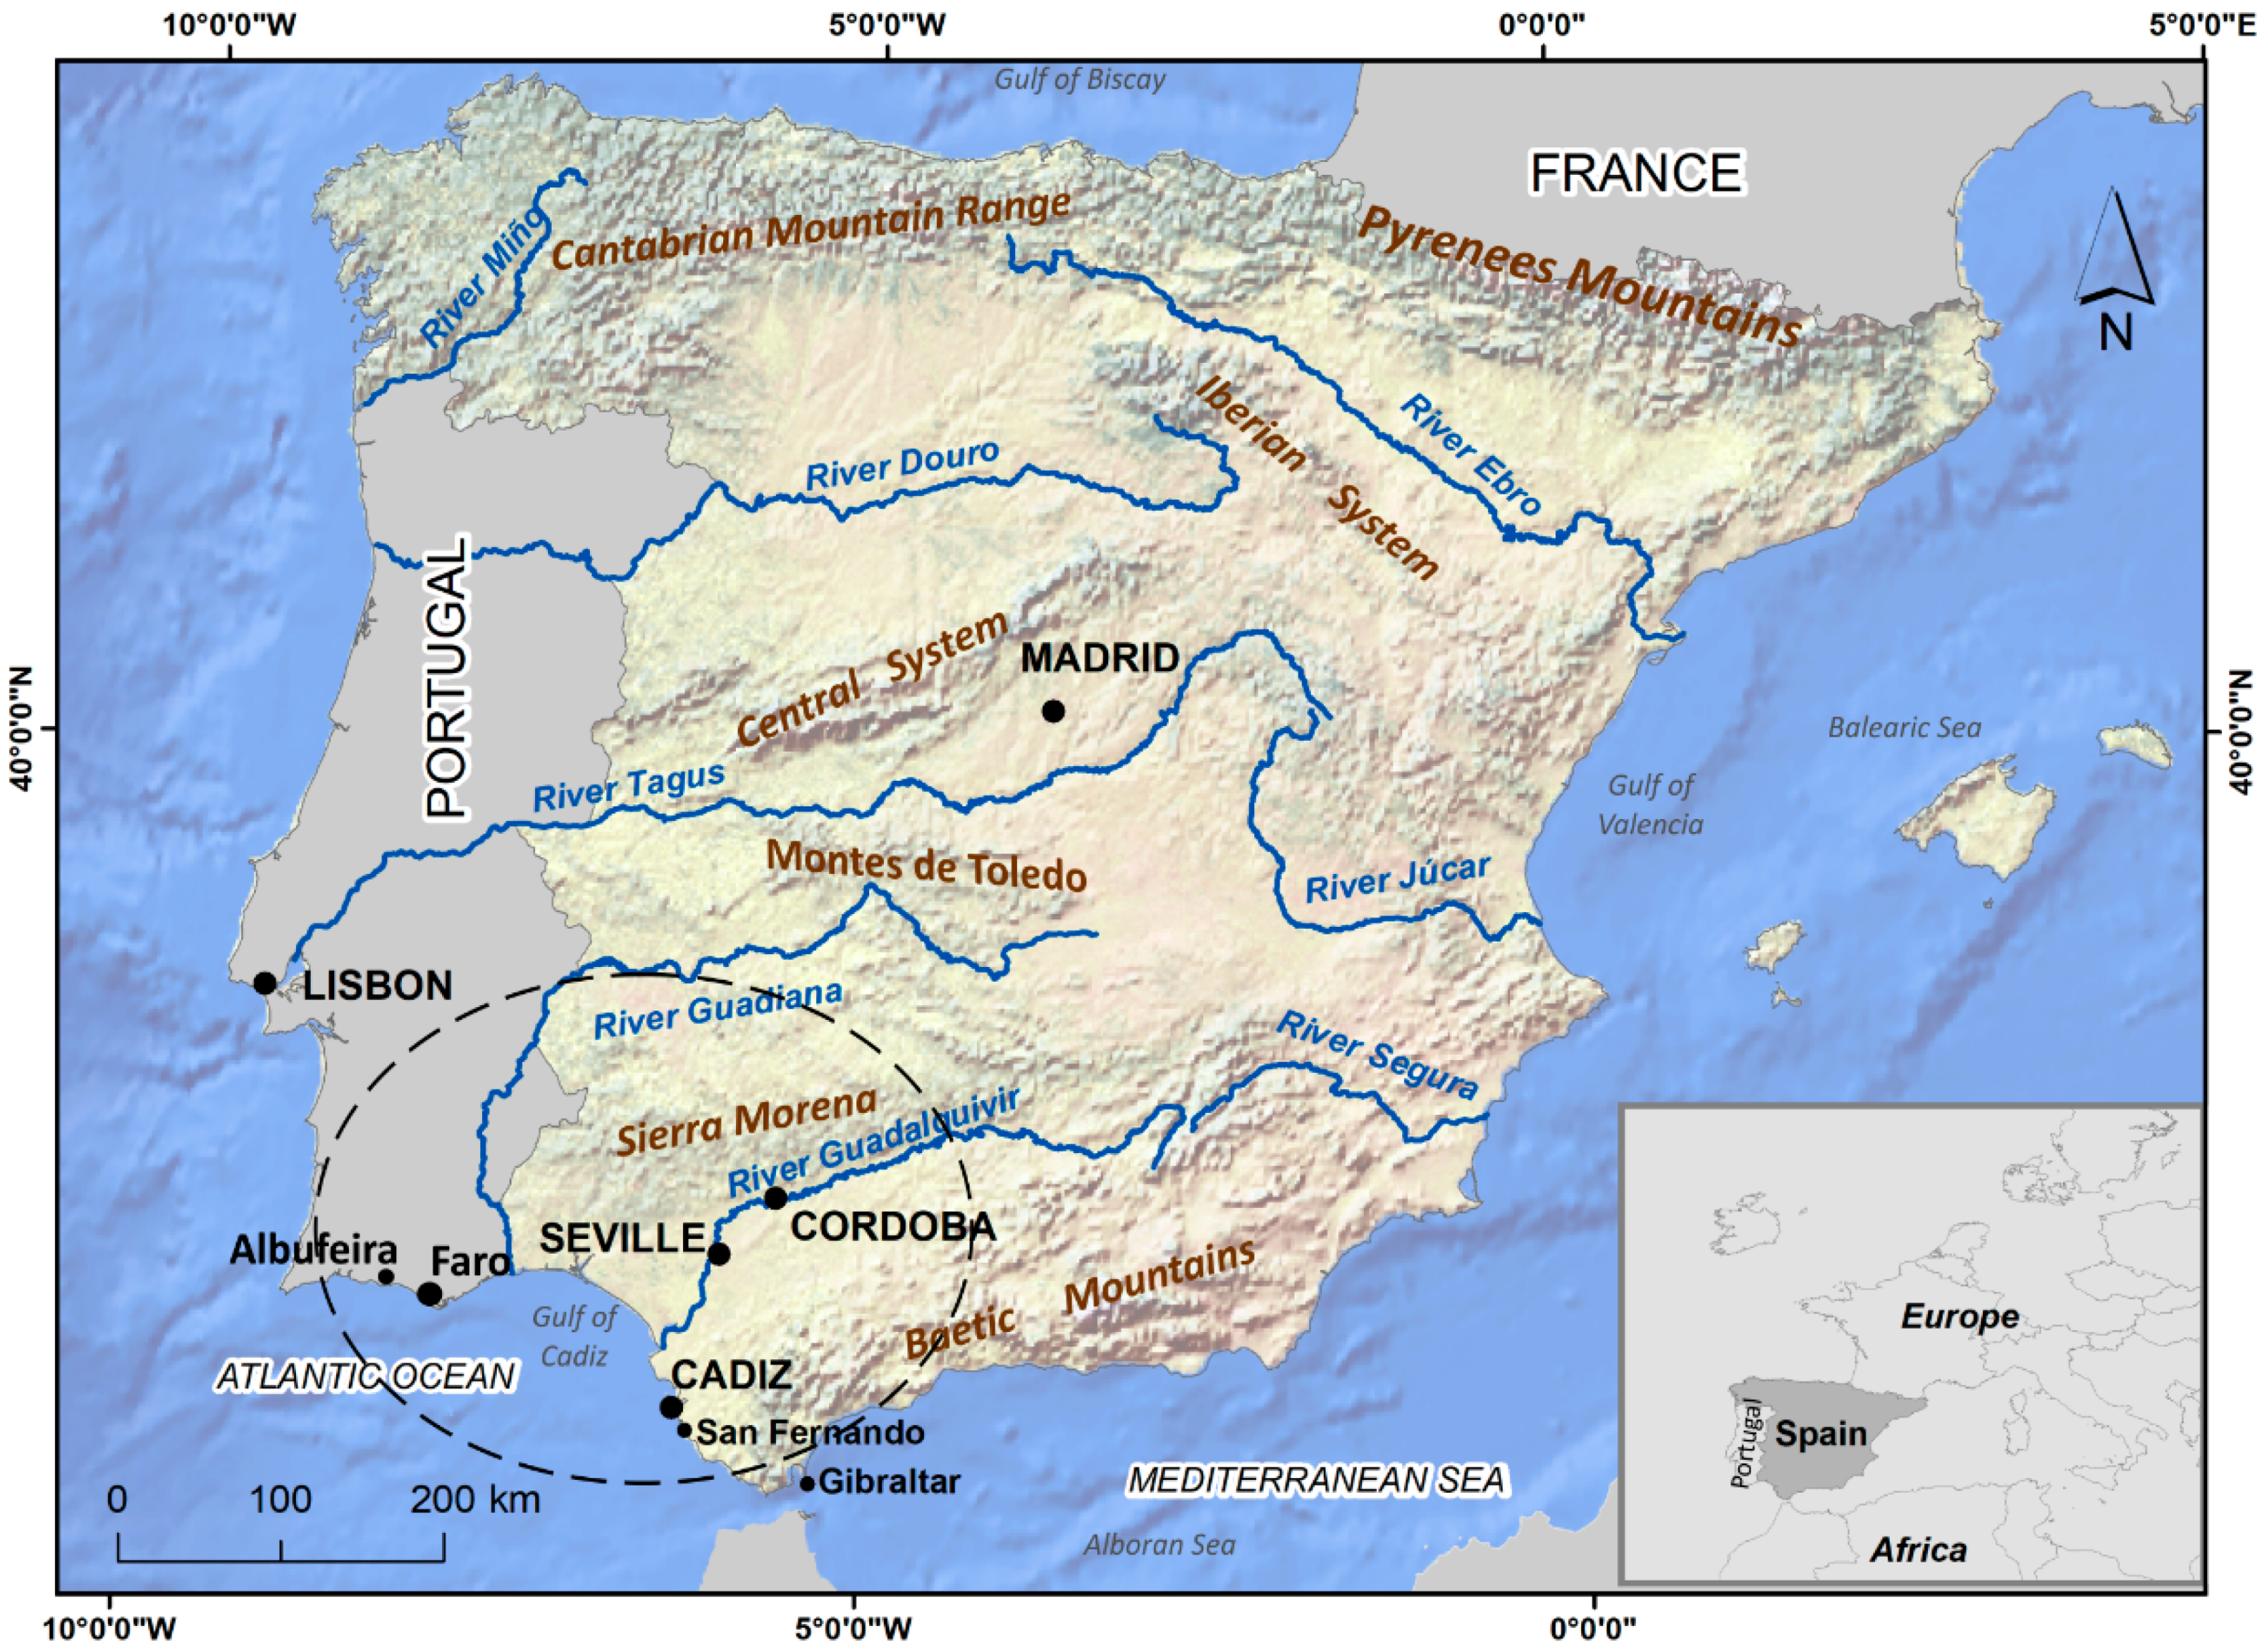
2. Study Area and Data

The study area is located in the southwestern quadrant of the Iberian Peninsula is characterized by a Mediterranean climate, with an influence of humid air masses from the Atlantic Ocean [11,53]. From the climatic perspective, this is a transition area between the middle latitudes and the subtropical climates, which explains the high variability in its precipitation [54,55,56,57]. This is due to the fact that the precipitation regime depends on the alternation between the high subtropical pressures and the frontal disturbances, which are associated with the jet stream. Furthermore, this area, geographically, is a transition area between South Europe and the African continent, but also between the Atlantic Ocean and the Mediterranean Sea. This fact increases the variability in the spatial behaviour of precipitation, together with the complex orography that also favours the development of convective storms of great intensity. Relief also amplifies the effect of frontal disturbances, as it forces the air masses to penetrate the Iberian Peninsula from the Atlantic Ocean [58].
The Mediterranean side of the Iberian Peninsula has been the subject of more recent research, due to the more hazardous nature of rainfall events [11,32,59,60]. However, the Atlantic side, which includes the southwest of the Iberian Peninsula, has been less studied in relation to extreme rainfall, being a homogeneous area according to meteorological criteria and topographic similarities [61]. The Royal Observatory of the Spanish Navy of San Fernando (hereinafter ROA), considered as representative of the whole southwest of the Iberian Peninsula, is located within this study area (Figure 1) [7,62]. Different studies have used the series of the ROA as a reference to characterise the regime of precipitations [63,64], the irregularity and disparity of the precipitation [1], the inter and intra-annual behaviour of the rainfall [7], the aggressiveness of the precipitations [50], and teleconnections, such as the NAO and the WeMO [64,65], in the southwest of Europe.
The mean total annual precipitation in the meteorological observatories of the study area ranges between 550 and 750 mm, depending, basically, on the elevation, with a coefficient of variation of 0.28 to 0.30 [7]. The intra-annual precipitation regime begins increasing in autumn, with maximum values at the beginning of winter, and slightly decreases throughout spring until summer, when it reaches its minimum or null value [7,66]. Intense rainfalls are frequently produced by the entry of Atlantic storms (negative NAO phase), which are usually associated with cold air pockets; they can also be caused by convective events associated with the dynamics of the Mediterranean Sea or by excessive surface warming.
The records of precipitation used in this study were provided by ROA (36°46′ N, 6°20′ W), located in the city of San Fernando (Cádiz). This observatory, along with the meteorological stations of Lisbon and Gibraltar, holds one of the longest meteorological series of the southwest of the European continent and it is used as a reference station in homogeneity studies in the region [63,67,68,69]. The oldest uninterrupted rainfall records of the ROA observatory date from the year 1805. However, between 1805 and 1836, it usually took several days to record the data of daily precipitation (ta > 1440 min) [19], and the years 1844, 1846, 1847 and 1849 present gaps in the daily precipitation data of January, February and December. Therefore, the periods of 1805–1836 and 1844–1849 were not included in this study due to the fact that consistent ta could not be guaranteed. Before 1870, the data of some summer months is missing; when analysing the complete secular series, this was interpreted as absent or inappreciable daily precipitation (<1 mm), which does not affect the analysis. In 1856 and 1859, no data were recorded in May for either of these two years; however, the analysis of the complete secular series shows that the annual maximum daily precipitation is not likely to occur during that month. From 1837 to 1986, the ta = 1440 min and from 1986 to the end of the series, ta = 1 min. Taking into account the few data gaps during the period 1851–2021, and that during this period of 170 years, almost 80% has the same ta, we selected this time period for this study.
The confidence in observations of extreme events depends on the quality and quantity of data, which vary between regions of the globe and for different types of extreme events and weather variables. In this regard, it is first of all necessary to underline the difficulty in finding reliable time series of global data; often, we have to limit ourselves to more local observations carried out in those areas where, historically, the phenomena have been better observed and recorded and whose data are, therefore, more reliable and representative [70]. Therefore, local historical series, such as the San Fernando, in the southwest of Spain (Figure 1), would contribute to both local and global purposes. It would also contribute to the interpretation of rainfall patters in a particularly sensitive transition climate zone, or to solve certain flood risk management problems in the area associated to hazardous precipitation events with remarkable socioeconomic impact.
The interannual and intra-annual behaviour of precipitation obtained by the ROA observatory is strongly correlated with that of other meteorological stations of southern Spain and Portugal. This has been described in previous studies [50,63], which allowed for verifying that they belong to the same climatic atmospheric mechanism in the southwestern sector of the Iberian Peninsula. Extreme precipitation events have a generally strong local frequency; thus, the specific results obtained correspond to the geographical area near the observatory. Therefore, the Spanish Ministry of Environment created a map of areas with potential significant flooding risk (named ARPSIs). These are defined from the recorded data and considering the current circumstances of soil occupation, infrastructure and protection systems. In the predictions of long-term evolution, including the impact of climate change, the study area is considered to be one of these ARPSIs or potential risk zones (https://www.miteco.gob.es/es/cartografia-y-sig/ide/descargas/agua/ARPSI.aspx, accessed on 14 January 2022). In general, we consider that the characterization described in this study fits the regional precipitation behaviour of the southwestern Iberian Peninsula considered in these studies.
The analyses of the regimes of extreme rainfalls in different geographical areas are generally based on precipitation series of only certain decades. As was previously mentioned, this study used the data of the annual maximum daily precipitation from the mid-19th century to the early 21st century. The length of over one and a half centuries allows for obtaining results that fit historical reality, providing information about extreme events not registered in other studies; thus, the conclusions provide robust information supported by a broad period of time. Time series range from 1980 to present, providing a large increase in data availability.

3. Methodology

We analysed the annual maximum daily precipitation (PMD) for a period of 170 years (1851–2021). To this end, the square-root exponential-type distribution function SQRT-ETMax was used to theoretically characterise PMD. This method is the one adopted by the Spanish Ministry of Development to make the necessary calculations prior to the sizing of public works in the prediction of basin flow. This institution, in its official publication, justifies the adoption of this model (SQRT-ETMax) based on the following reasons: (a) it is a model specifically proposed for the statistical modelling of maximum daily precipitation, (b) it is formulated with only two parameters, which makes it easier to obtain results, (c) the results provided by this model are more conservative than those provided by the traditional Gumbel distribution, and (d) it shows a great capacity to reproduce the observed behaviour based on empirical studies of similar climatic series in the area. This study indicates that the comparative analysis of different models does not show relevant differences for short or medium return periods (<25 years), and that such differences are observed only in longer return periods [37].

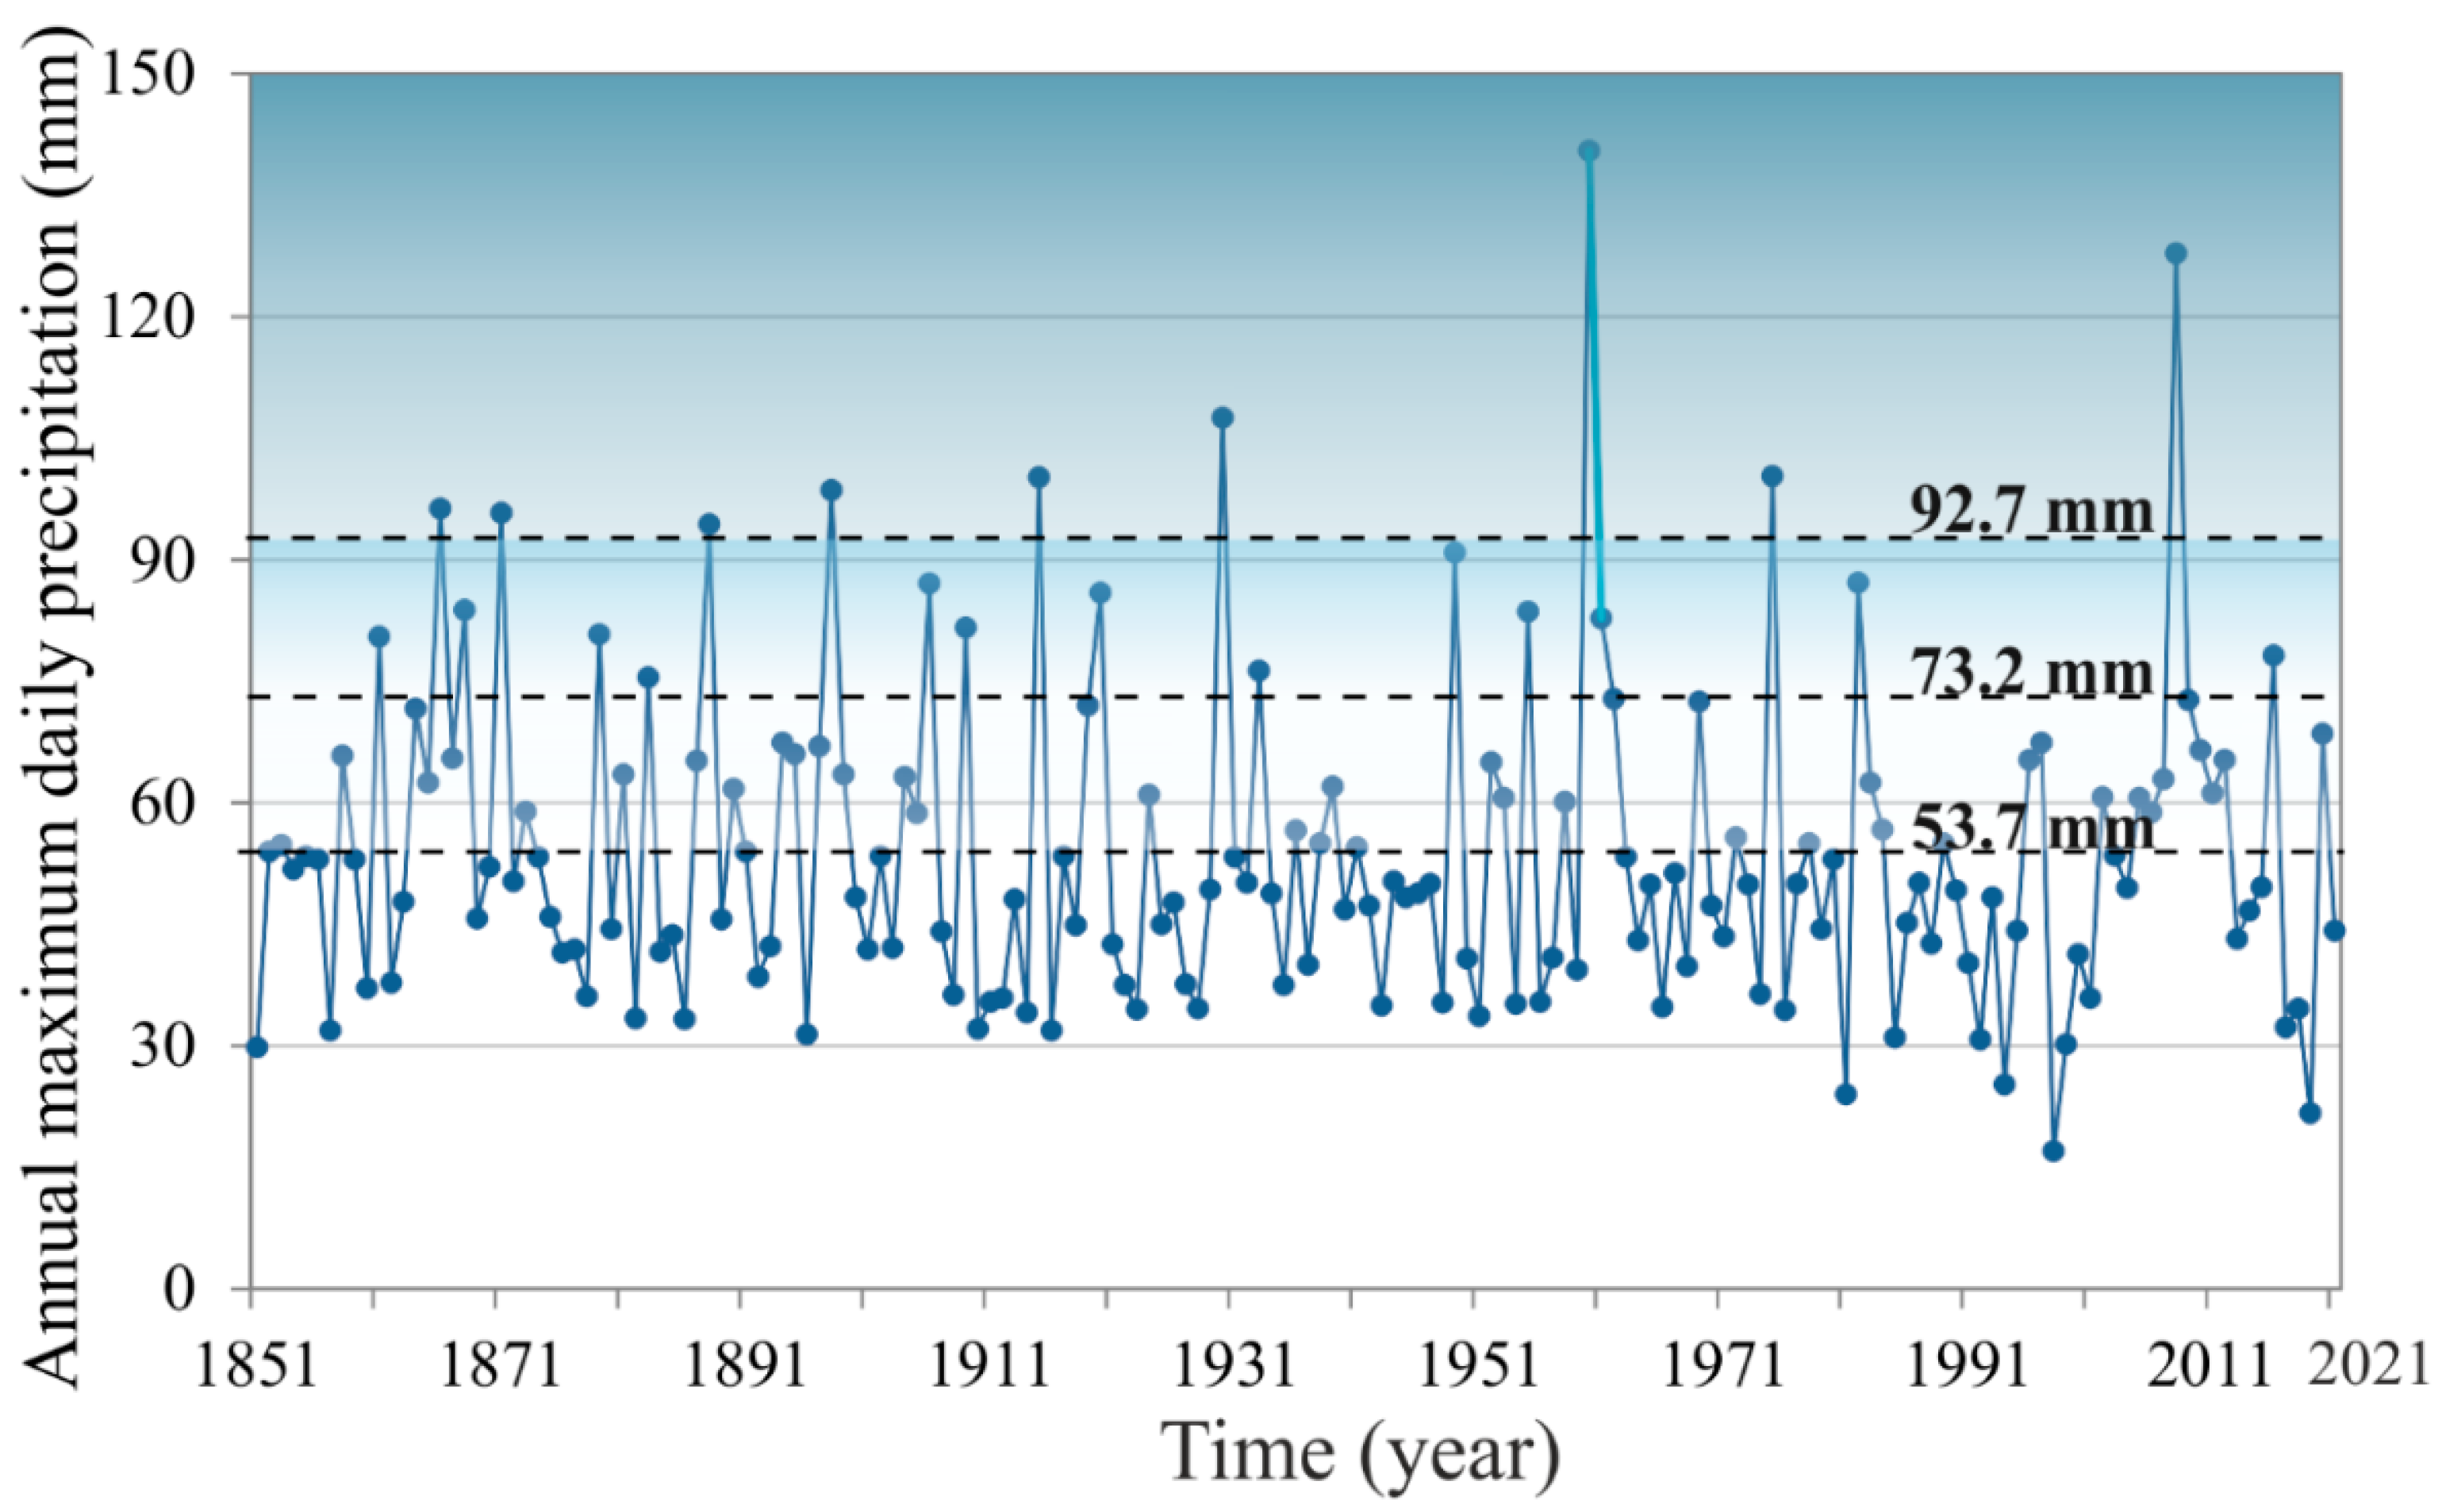
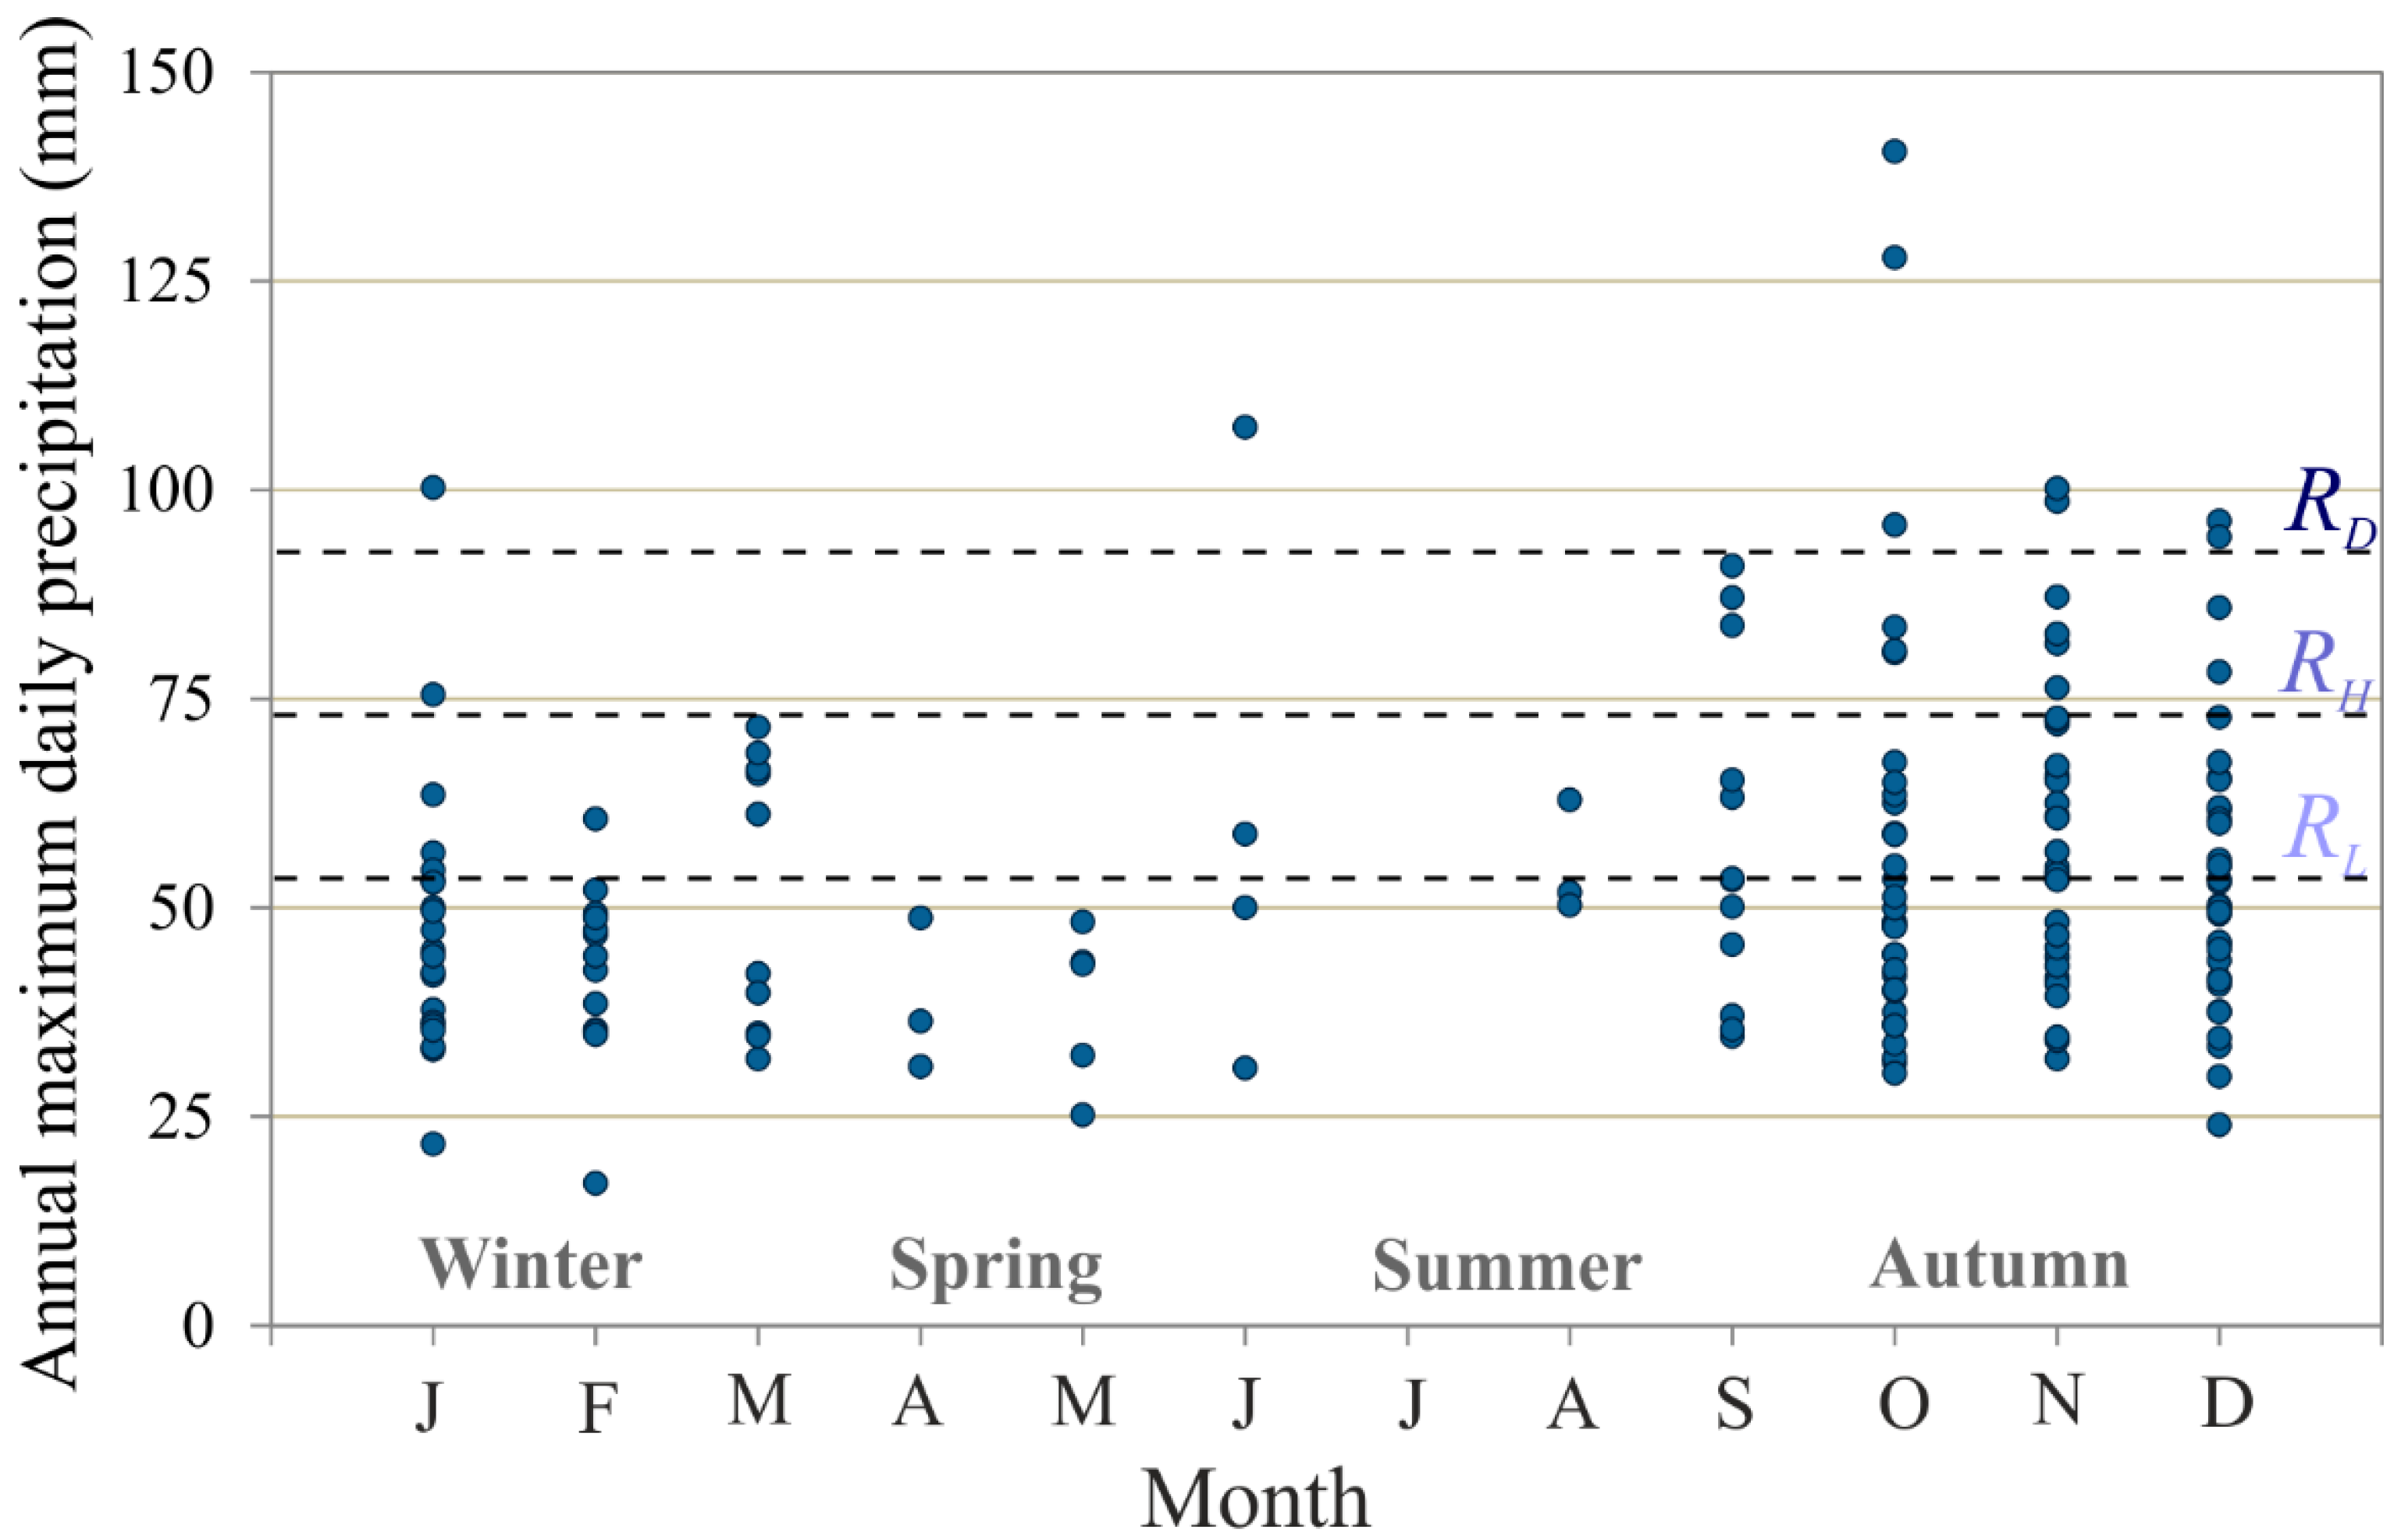
3.1. Determination of the Risk Thresholds

The hazardous thresholds associated with the maximum daily precipitation were established to fit the climatic conditions of the study area. Any attempt to establish hazard levels could be subjective depending on the type of impacts considered. Every criterion selected must indicate the values threshold and its calculation. In this study, the parameters of the SQRT-ETMax were selected for this purpose considering the arithmetic mean and standard deviation required for the estimation of the model parameters of shape based on the sampling statistics of the PMD series. This also allows for the selection of the regional coefficient of variation as the only determining parameter for the regional quantiles required in the application of the method. SQRT-ETMax distribution is then applied to previous defined climatic regions for Spain according to meteorological criteria, topographic similarities and the homogeneity of the coefficient of variation of those PMD series recorded in rain gauges within the regions [61]. Using these two variables, we constructed an ascending scale where the thresholds of each class are determined by a proportionality criterion established from the calculated statistics. Since this study deals with quantitative extreme precipitation descriptions that might cause risk events on the territory, this is the terminology used for easier interpretation. To this end, annual series of observations were classified based on these risk levels as a function of the mean (μN) and standard deviation (σN) of the entire PMD series of N years on which the probability function used is based. Considering pn as the annual value of year n in the PMD series, three risk levels are established:
Threshold with low risk (L): RL, if μN < pn < (μN + σN).
Threshold with high risk (H): RH, if (μN + σ) < pn < (μN + 2 σN).
Threshold with disaster risk (D): RD, if pn > (μN + 2 σN).
The SQRT-ETMax method [31,62,71] is based on the statistical distribution that corresponds to the following expressions:
F(x) = exp[−k(1 + √α·x)·exp(−√α·x)]
in which
ln (k) = ∑ai [ln Cv]
ln (Ii) = ∑bi [ln (k)]I
α = (k Ii)/((1 − ek) 2μ)
where F(x) is the frequency of precipitation x, k and α are, respectively, the shape and scale parameters that depend on the mean μ and the coefficient of variation Cv of the recorded data series, and ai and bi are parameters in the system. Therefore, the model is formulated with only two basic parameters; thus, the results of the distribution are estimated as a function of (μN, σN).

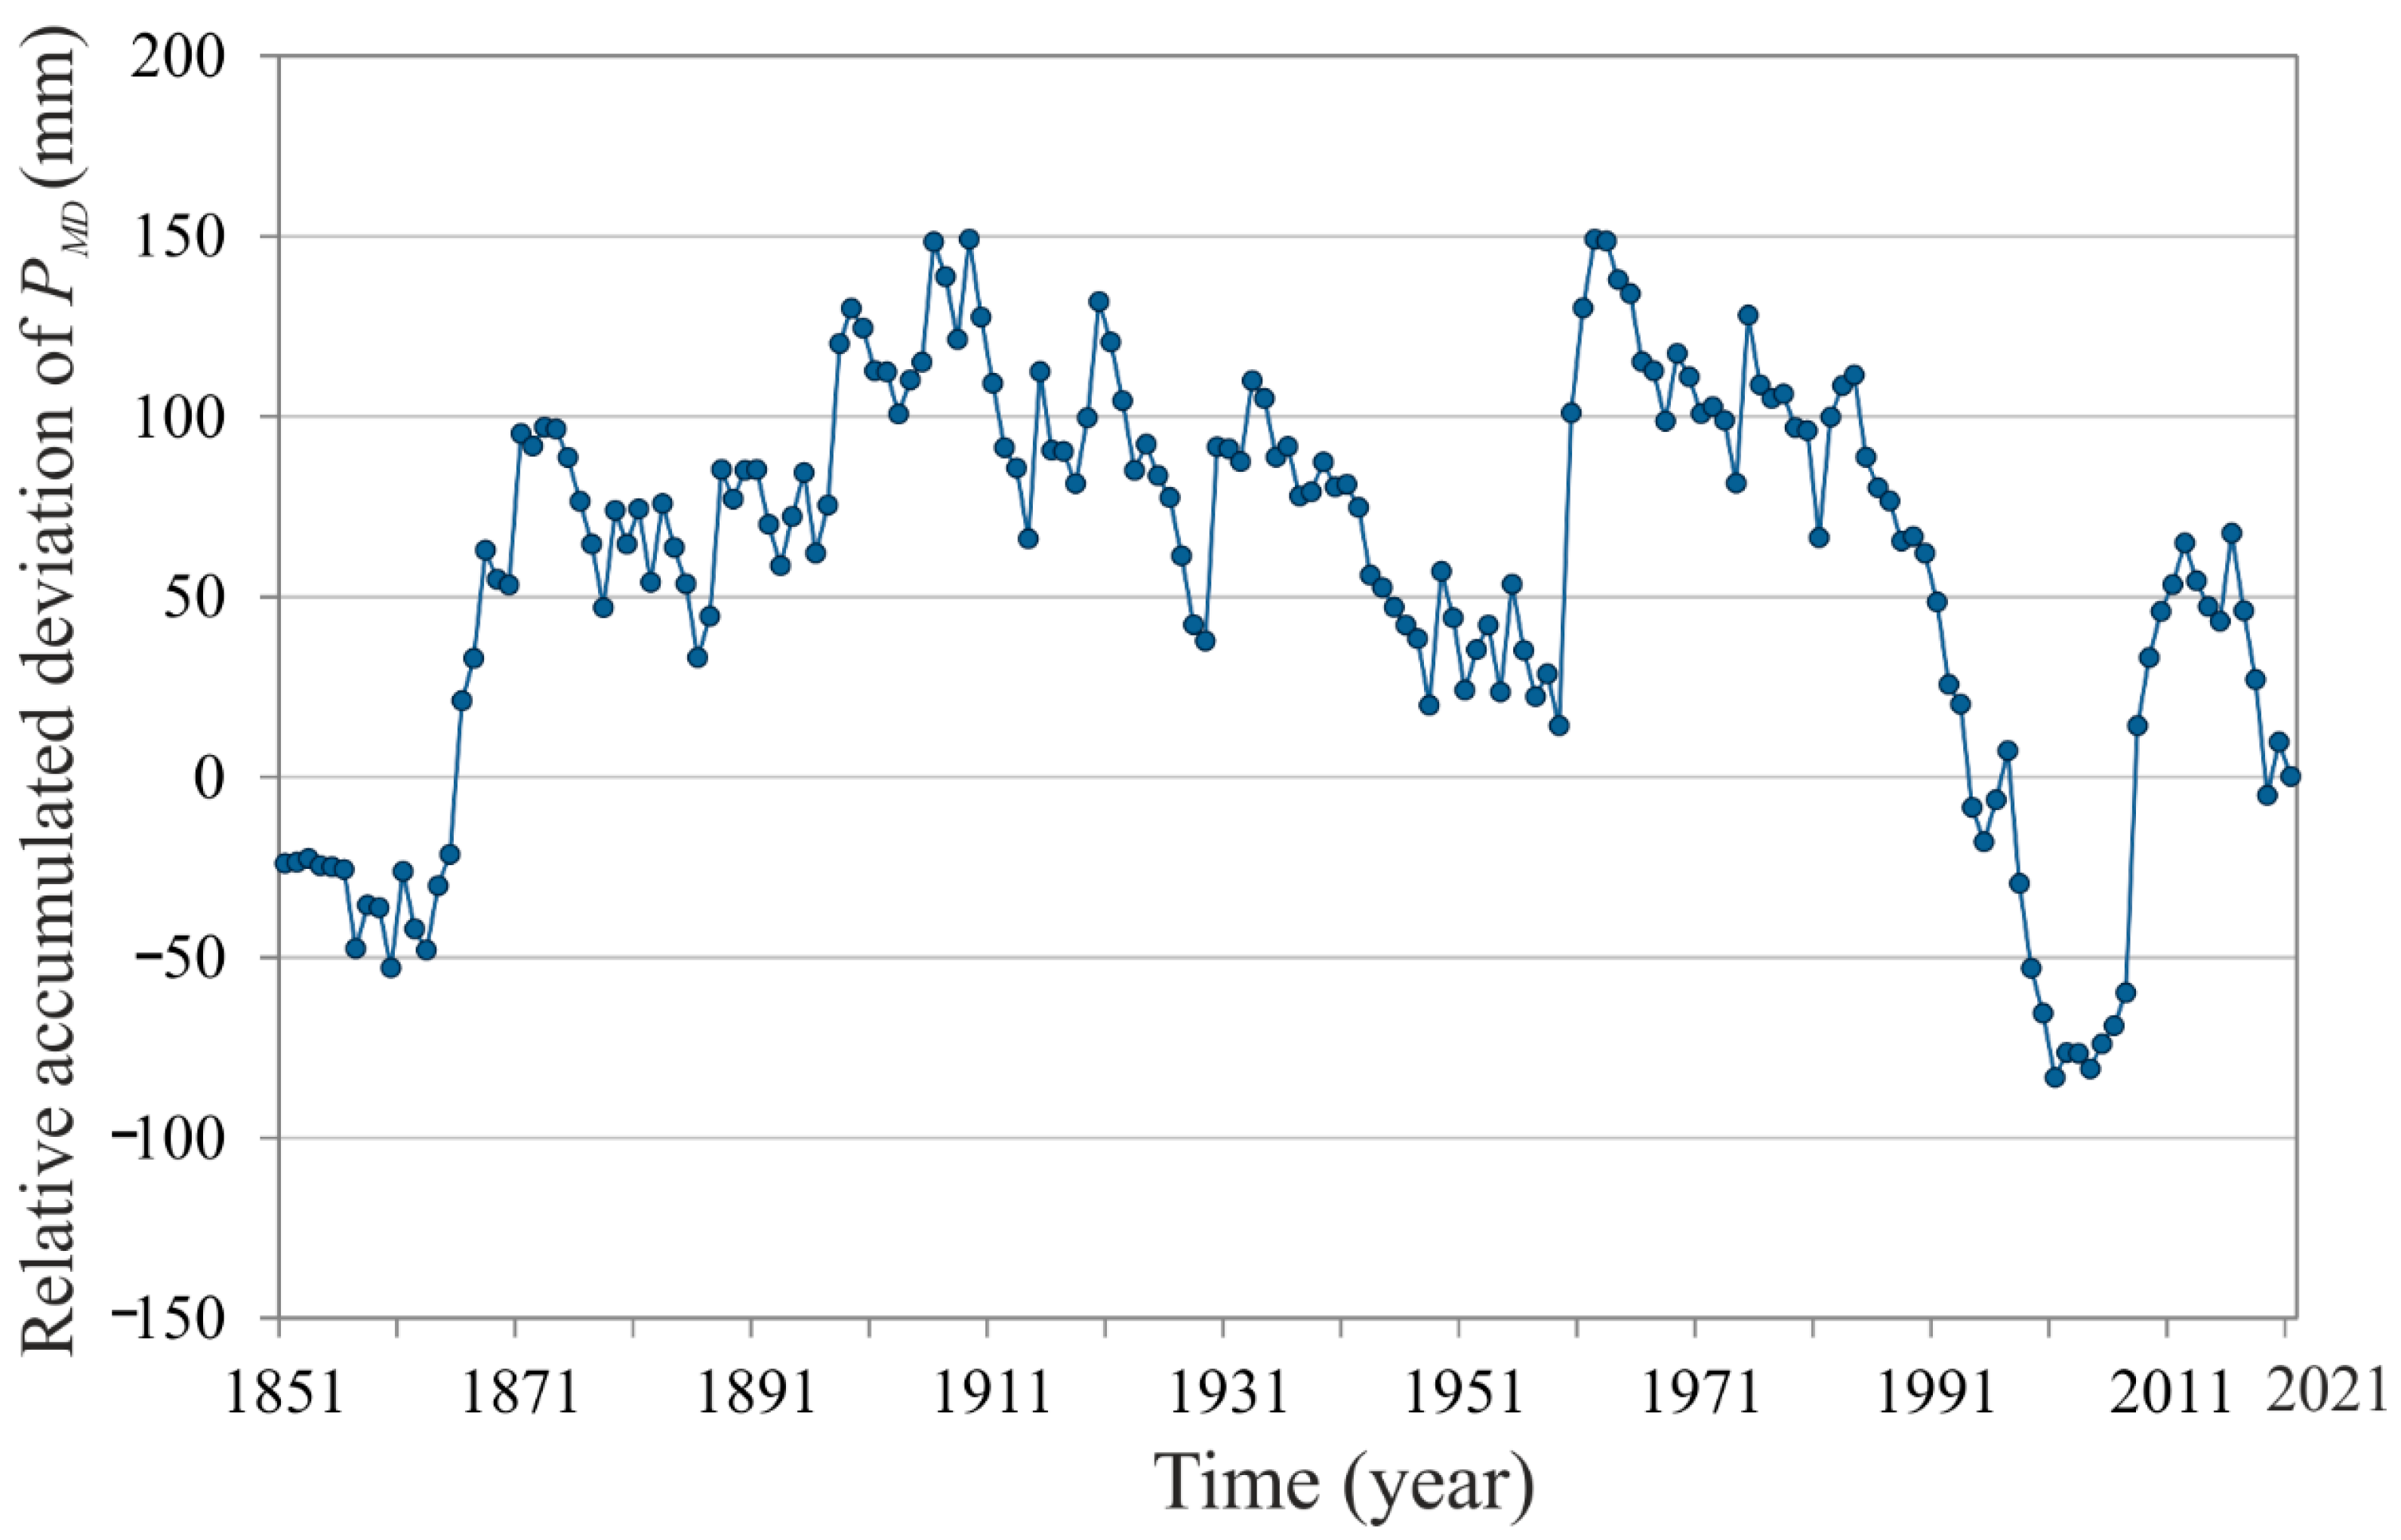
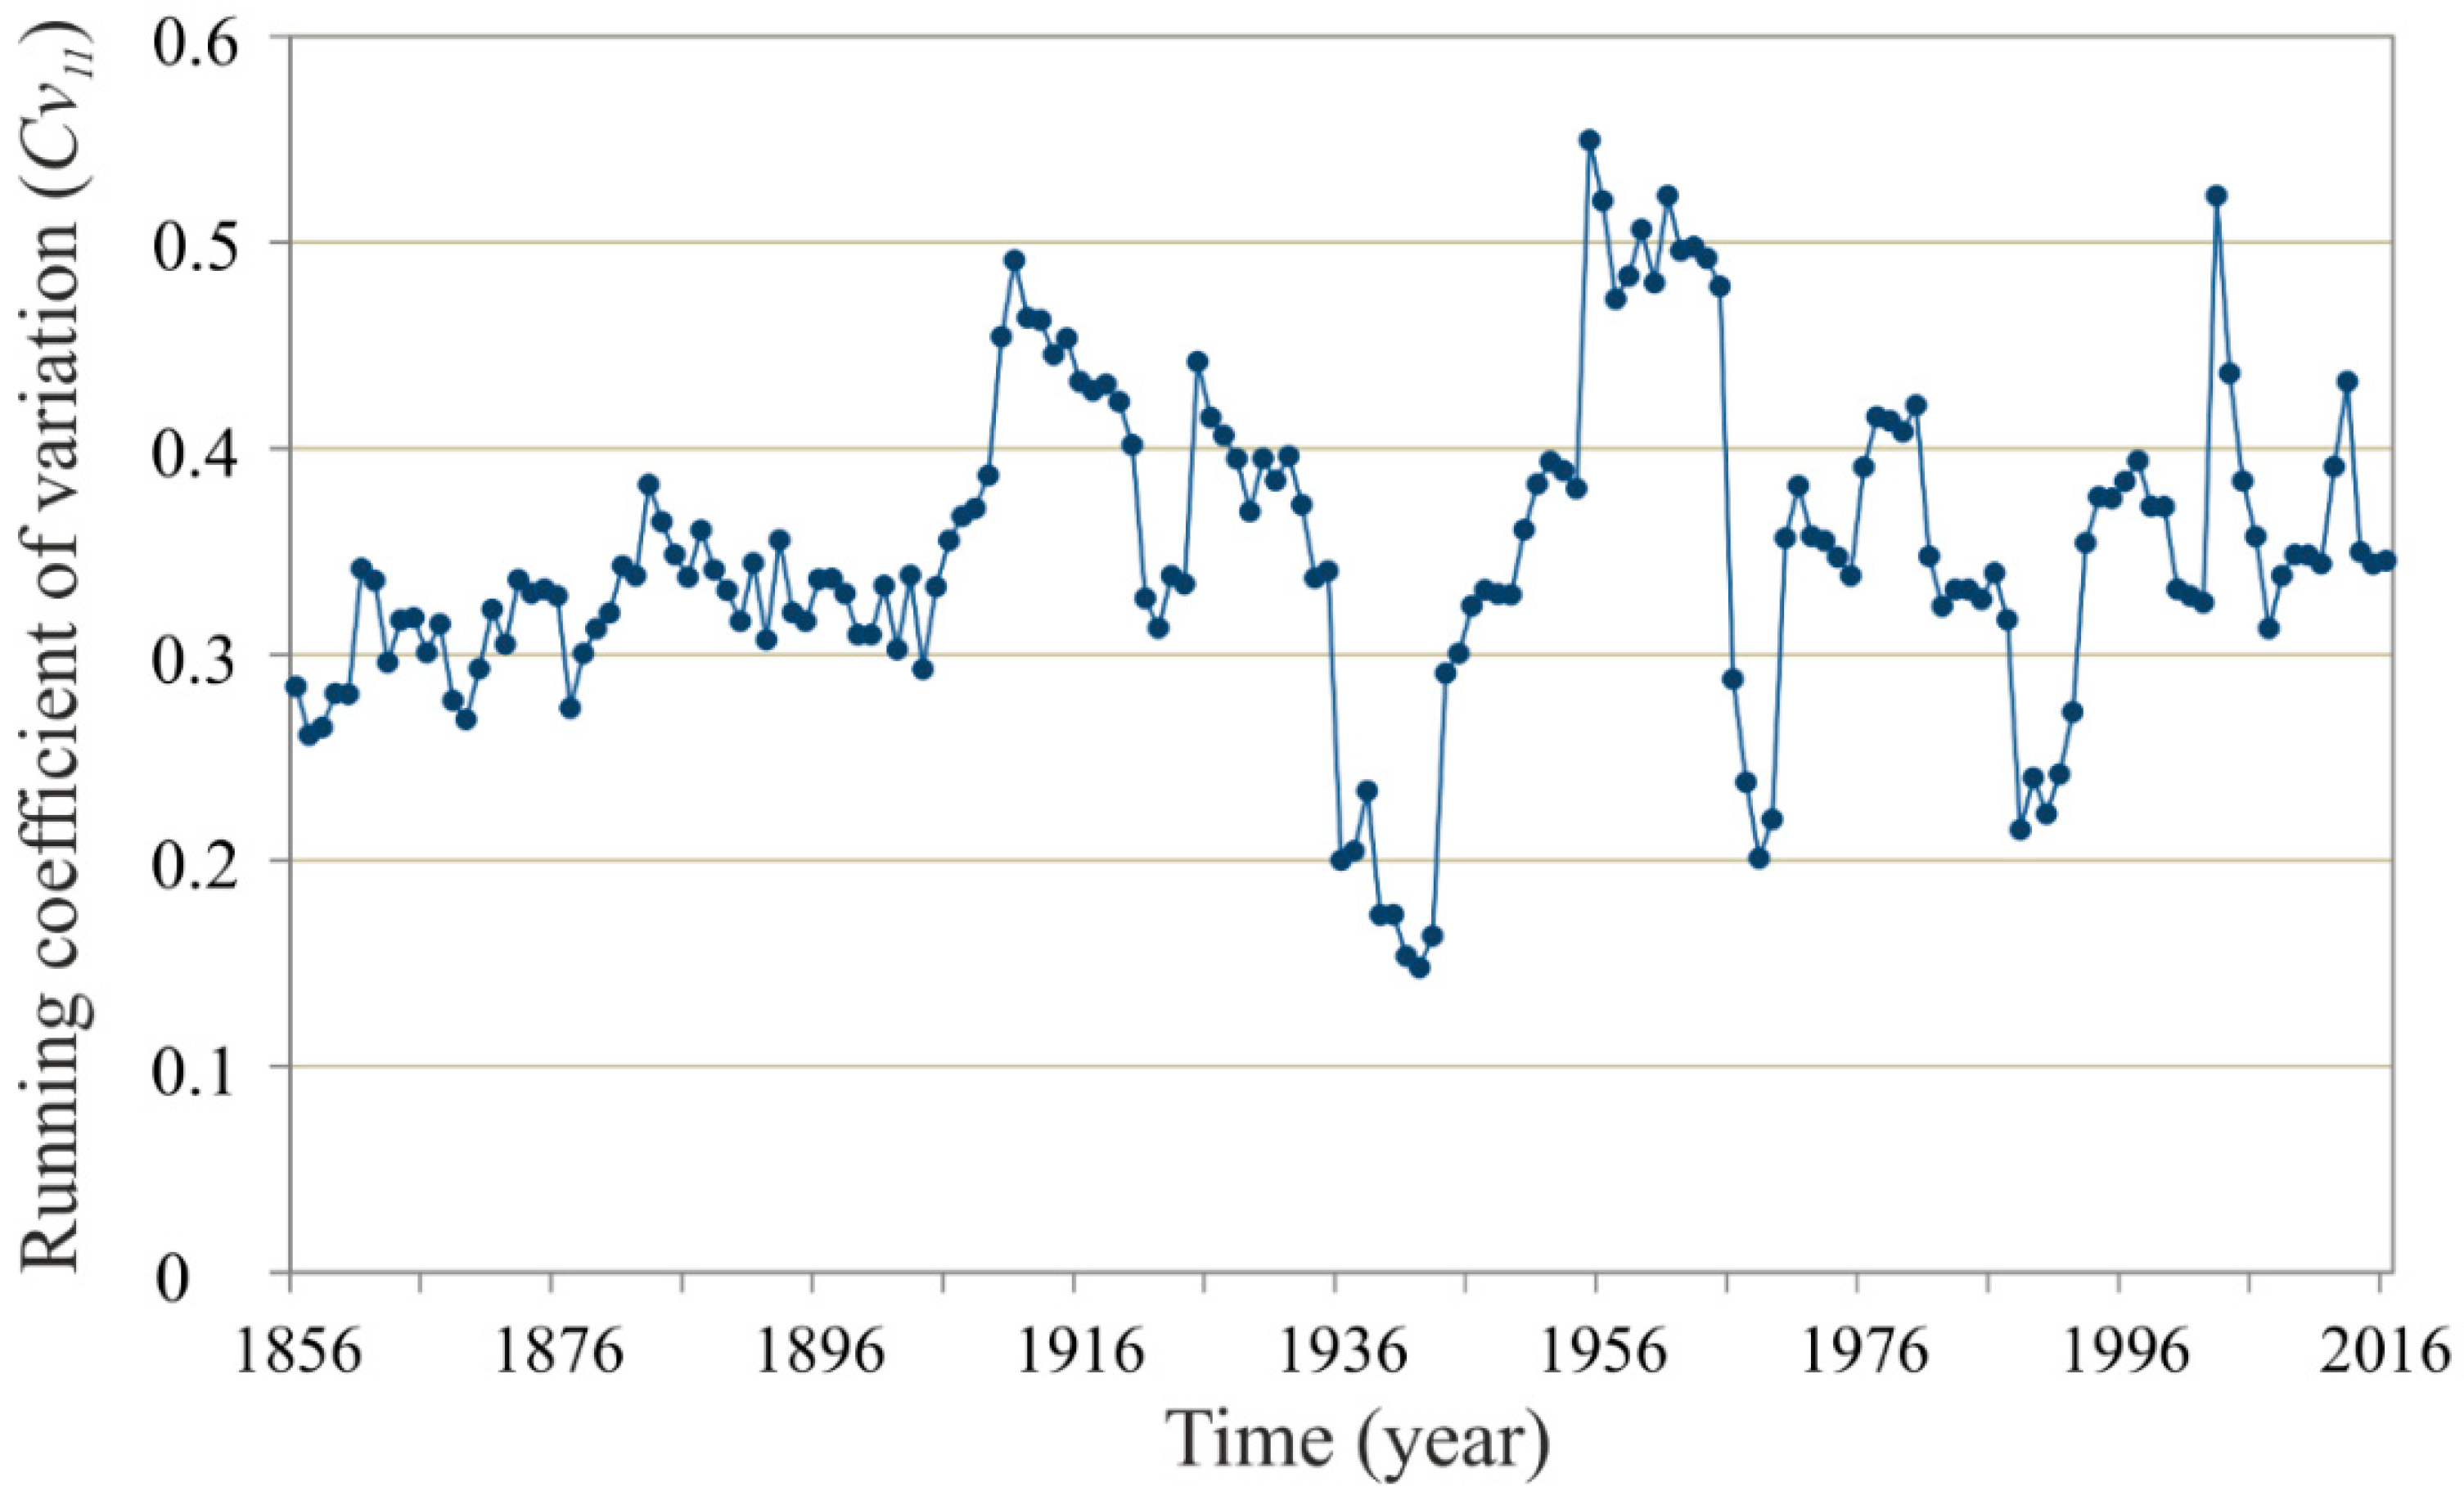
3.2. Interannual Characterisation of the Annual Maximum Daily Precipitation (PMD)

To analyse the temporal behaviour, linear trend estimation methods and interannual variability quantification techniques were used with the aim of identifying any significant changes in the series. In addition to trend detection, the relative accumulated deviations An allow for distinguishing differentiated multi-annual sequences based on the risk occurrence. If pn is the annual value of PMD, the accumulated deviation up to year n is obtained as an addition, extended to all the preceding years j of the annual deviations δj, with respect to the risk threshold value µN of the entire interannual series of N years. If δj = (pjµN), then
An = (∑δj)/µN for j = 1, 2, … n; n ≤ N
Graphically, the descending sections (with a sawtooth pattern) indicate the frequency of annual PMD values without risk: pn < µN (lower than the threshold of RL). The ascending sections indicate sequences with a high proportion of annual values with risk: pn > RL.
To determine the interannual variability, the coefficient of variation of the entire series was used. This is defined as the quotient of the standard deviation σN and the corresponding mean value µN:
Cv = σN/µN
To identify the multi-annual fluctuations, a new temporal series was generated using the running variation coefficient for 11-year periods Cv(11). This procedure smooths the isolated extreme values, without masking the temporal behaviour. Moreover, 11 years is the approximate period of solar activity, which is an objective reference of the fluctuations of energy input into the climate system. This is defined as the ratio of the standard deviation of the partial subseries composed of year n and the previous 10 years, and its corresponding mean value
Cv(11)n = σ(n,n−10)/µ(n,n−10)

3.3. Intra-Annual Characterisation of the Annual Maximum Daily Precipitation (PMD)

A complementary aspect to the interannual evolution is the intra-annual distribution, which shows the monthly frequency and the intensity of the maximum daily precipitation in each of the months throughout the years of the series of observations. Since the data series shows the month of maximum daily precipitation for each year, the series of PMD were grouped in the 12 months of the year. This intra-annual distribution was compared with the risk thresholds, which allowed for obtaining the maximum daily precipitation hazard distribution of each month and season of the year.

3.4. Estimation of the Probability of Occurrence and Return Periods

The values obtained from the direct calculation in the observation series were contrasted with the results of the theoretical analysis of probability for a given precipitation value, and the corresponding return period estimated in years. The return period was used in the risk analysis to estimate the probability of exceeding a certain precipitation value. Thus, the return period of k years indicates that the corresponding maximum daily precipitation is probabilistically reached only once every k years.

3.5. Influence of North Atlantic Oscillation (NAO)

Given the influence of NAO on rainfall, we compared the monthly average of the NAO index during the period 1851–2020 with the monthly average obtained in the months when the PMD occurs in this period and, in particular, with those months in which PMD reaches risk levels. This allows us to deduce the possible influence of the NAO index in extreme rainfall episodes.
To do this, we select the NAO index for the month in which the PMD is reached. This makes it possible to prepare two synchronous interannual series: that of the monthly NAO index for those months and the corresponding PMD values series. In this study we used historical data based on the Rotated Principal Component Analysis (RPCA) [72] (https://www.ncdc.noaa.gov/teleconnections/nao/, accessed on 10 January 2022).

4. Results and Discussion

4.1. Determination of the Risk Thresholds

The interannual series for the period 1851–2021 was generated using the annual pn values of maximum daily precipitation PMD. To this end, mean (μN = 53.7 mm) and standard deviation (σN = 19.5 mm) were calculated. According to the criteria presented in the Methodology section, these parameters were used to establish the risk thresholds in the study area. Therefore, based on the particular climatic conditions of the southwestern Iberian Peninsula, the following risk thresholds were obtained: RL > 53.7 mm; RH > (53.7 + 19.5) ≈ 73.2 mm; RD > (53.7 + 2∙19.5) ≈ 92.7 mm.
As a comparative reference, the prediction system of the Spanish Meteorological Agency (AEMET) establishes colours associated with precipitation risk levels in 12 h for the study area: 40 mm (yellow: potential risk), 80 mm (orange: dangerous risk) and 120 mm (red: extreme risk) (http://www.aemet.es/es/lineas_de_interes/meteoalerta, accessed on 14 January 2022). Although they are based on different criteria, these risk levels are very similar to the ones adopted in the present study.

4.2. Interannual Characterisation of the Annual Maximum Daily Precipitation (PMD)

The equation for the linear function of the trend in the series of the interannual maximum daily precipitation PMD (1851–2021) is:
pn = −0.01n + 55.78
where pn is the maximum daily precipitation of year n.
Figure 2 shows the interannual PMD series, along with the values of the risk thresholds estimated for the study area in the previous section (RL = 53.7 mm, RH = 73.2 mm and RD = 92.7 mm). The trend line of the interannual PMD series is approximately horizontal (not represented in Figure 2), where the variance explained is R2 < 0.001, with no statistical significance, according to the Mann–Kendall test and Student’s T-test (T = −0.344, where T(0.95%) = −1.974 is the critical value). This high-risk trend line of the annual series is also approximately horizontal, with no climatic significance (pn = −0.01n + 7504; R2 < 0.003).
Figure 2 shows a high temporal irregularity for the PMD series in the southwestern Iberian Peninsula for the period of 1851–2021, with a coefficient of variation of Cν = 0.36. The results obtained in other studies on the temporal trend of PMD are not always in agreement with each other in Mediterranean regions. In Southwestern France, a mostly statistically significant ascending trend has been detected [73]. However, for the Mediterranean region, a strong temporal irregularity was detected [27,74,75,76], with no generalised trend, as we found in our study area. The SQRT-ETMax distribution has also been used [77] to quantify the changes in the series of PMD frequency in different zones of Spain, obtaining no generalised trends for all of them. Nevertheless, when considering extreme indices, some decreasing trends are found, especially in the Eastern Mediterranean coast of the Iberian Peninsula [38]. The lack of uniformity in the local behaviour of the PMD in different Mediterranean areas is a manifestation of the territorial and temporal irregularity of the precipitation regime typical of the Mediterranean climate, even more so in a function of extreme values characterised by its high spatial concentration. The recent official report from the Spanish Government about the Impact of climate change on maximum rainfall in Spain (2021) [78] detected a general decrease in total precipitation, together with an increase in the relative contribution of extreme precipitation events in the Mediterranean countries.
In addition to the trend analysis, we calculated the accumulated deviations An of the annual values with respect to the risk threshold RL. This allowed for distinguishing differentiated multi-annual sequences that characterise the interannual behaviour of PMD and, consequently, allowed us to detect the interannual risk periods. These accumulated deviations (Figure 3) show, after an ascending phase from 1870 to 1910, a sawtooth profile, with values alternating around the RL threshold (53.7 mm), and without uninterrupted interannual sequences. A decreasing section began in 1910 and ended in 1960. This section indicates a greater frequency of years, in which the annual pn value of PMD does not reach the risk level (which is why these sections show a negative slope), occasionally interrupted by years with high values of daily precipitation. In 1963, after three years of changing direction, a new decreasing phase begins, ending in 2000. This sharp decreasing phase corresponds to a high proportion of years with annual maximum daily precipitations that do not involve climatic hazard. Then, a sequence begins in 2001, with a predominance of years with high climate hazard, due to the intensity of the maximum daily precipitations. Therefore, with respect to the period of 1860–2021, the last ninety years of the 20th century (1910–2000) concentrate the uninterrupted interannual sequences with relatively lower hazard associated with the maximum intensity of daily precipitation.
Among other features, the changes in the behaviour of climatic series are characterised by variations in the distribution of the temporal trends. Given that the most relevant characteristic of the PMD series is variability, its temporal behaviour was highlighted using the running coefficient of variation in a progression of 11-year periods, 11. Figure 4 shows that the variability of PMD has sharp multi-annual fluctuations, without periodicity. Thus, 11 < 0.36 indicates that the values of PMD are stably similar (high or low) throughout that subperiod, and 11 > 0.4 indicates large deviations between the annual pn values of PMD throughout the corresponding 11-year period. The values are remarkably constant, around 0.36 ± 0.05, throughout the second half of the 19th century, and the annual values of PMD are considerably stable throughout the subperiod of 1931–1948. These periods are in contrast to the great variability in the periods of 1905–1925, 1950–1970 (especially) and 1998–2008.
Different studies carried out in the Iberian Peninsula have used SQRT-ETMax to analyse the complex spatial behaviour of precipitation distribution [31,61,62,78]. The latest adaptation of this method, based on these previous investigations, has been used in our study, guaranteeing the best quality and robustness of the results. Furthermore, in the case of time series, in which the trend is not significant and the of the complete series is high, the previously applied procedures are independent of each other and complementary, expanding information on the characteristics of the time series.

4.3. Intra-Annual Characterisation of the Annual Maximum Daily Precipitation (PMD)

To obtain a complete view of the intra-annual variations in PMD, it is interesting to establish the distribution of the frequency of the months in which the annual maximum daily precipitation occurs. Table 1 shows the accumulated monthly distribution of the occurrence of PMD for each of the 12 months of the year, for the entire study period. These accumulated data refer to those years in which at least the RL, RH or RD values are reached. In all cases, there is a predominance in the autumn months (October, November and December) compared to the months of winter and spring.
The results in Table 1 show that, in the 170 years of the study period (1851–2021), RL occurred in 64 years. This represents 38% of the total number of years in the temporal series. Of these, the high risk (RH) level was reached in 22 years, i.e., 13% of the years of the observation series, with a mean interval of 7.5 years in this case. In turn, RD was reached in 9 years (5%), with a mean interval of 18.9 years. Considering the set of RH episodes (or higher) for the entire observation period, it is obtained that 48% of the total accumulated monthly precipitation occurred that day, i.e., almost half of the monthly precipitation occurred in only 24 h. However, in the complete series, there is no correlation pattern between the PMD and the corresponding total monthly precipitation, since the Pearson’s coefficient of correlation is only 0.12.
Figure 5 shows the monthly distribution of the volume (mm) of maximum daily precipitation throughout the entire observation period. As shown in Table 1, there is a greater concentration of days of annual maximum precipitation in the autumn months, particularly for values above the risk thresholds RL and RD. Therefore, the autumn months represent the greatest potential hazard due to the frequency and intensity of the episodes of PMD. Autumn is the season when the influences of Mediterranean mechanisms (flows of wet air from the Mediterranean Sea) cause higher variability, mostly related to convective atmospheric conditions that are able to discharge great amounts of precipitation in a few days or even hours [75,76]. In the study area, extreme events can also be related to the Atlantic cyclonic conditions in this season, explaining this higher frequency of events in autumn.

4.4. Comparison between the Theoretical and Empirical Results

The application of the SQRT-ETMax method to the longest daily instrumental meteorological records of the southwestern Iberian Peninsula allowed us to obtain a theoretical estimation for the behaviour of the annual maximum daily precipitation. The results of the theoretical analysis are shown in Table 2, along with data obtained using the records that make up the PMD series. To this end, Table 2 includes the probability of reaching the value selected for the thresholds of low risk (RL), high risk (RH) and disaster risk (RD), along with the corresponding return periods in years. Furthermore, it also shows the return period estimated to reach a PMD of 140.5 mm (historically recorded the annual maximum daily precipitation in the study area for the period of 1851–2021).
Table 2 shows that the theoretical probability of the occurrence of RL and RH in one year, estimated using the SQRT-ETMax model, fits correctly to the real values obtained using the instrumental records. However, for higher values, the estimated theoretical return period exceeds the real interval. Therefore, we can deduce that the model is appropriate, making the corresponding correction of approximately 0.8 for daily precipitation values above 100 mm. Thus, it can be useful in basin-flow estimations (i.e., in the prediction of flooding risks from the climatic perspective or related to the management and prediction of maximum flow). With such a coefficient, the corrected return period for the historically recorded maximum daily precipitation (140.5 mm) would be approximately 170 years.
Table 3 completes the information in Table 2 by presenting the annual maximum daily precipitation estimated by the model for the return periods of 20, 30, 50 and 100 years. Considering the exponential essence of the applied function, it follows that there is no linearity between the two variables.
Applying the Gumbel type II distribution to observatories of Southern Spain for the return periods shown in Table 3, Ref. [79] estimated the following PMD values: 20 years (90.7 mm), 50 years (110.8 mm), and 100 years (127.7 mm). It is worth mentioning that, although it responds to an estimation of several seasons, the results obtained with this model are similar to those shown in Table 3.
A study [80] conducted on hydrographic basins near the study area concluded that, for short return periods, the PMD values estimated by the SQRT-ETMax fit are slightly lower than those obtained by the Gumbel fit. However, for return periods longer than 100 years, the SQRT-ETMax fit requires comparatively higher precipitation values. This appreciation does not coincide for disaster risk levels (RD), since the SQRT-ETMax model tends to overestimate the return period with respect to the real valuation, at least in the study area (Table 2).

4.5. Influence of North Atlantic Oscillation

The correlation coefficient between the interannual series of the monthly NAO index in the month in which the PMD occurs in each year and the corresponding series of its value, during the period 1851–2020, is −0.06.
If we select only the month of those years when the PMD reaches the risk level, the correlation coefficient is 0.12. The significance of the correlation between these variables has been analysed using the T test (values above 0.23 were considered significant for α = 0.05). Therefore, the direct correlation is not significant; however, we can use some procedures that allow us to find another type of association.
Table 4 shows, for the rainy semester, in the upper row, the monthly average of the NAO index in the month in which the PMD occurs each year; in the middle row, the average of those months in which the risk level is reached (PMD > 53.7 mm). In the bottom row, it shows the difference between General PMD and Risk PMD; it can be observed that the values of the NAO index increase negatively, as the level of precipitation increases. Therefore, we interpret this result as a manifestation of the influence of the NAO- phase on intense rains.
However, this progressivity is not maintained if we exclusively consider the years of disaster risk (PMD > 92.7 mm). This may be due to the fact that, since the interannual series consists of a small number of elements (9), possible anomalies distort the results. Therefore, we consider that in the case of catastrophic rainfall, the causes can be diverse. Along with the activity of the Atlantic fronts, convective “cold drop” or DANA-type phenomena (isolated depression at high levels) also have an influence due to the entry of a cold air pool of subpolar origin at high levels of the atmosphere that meets local, warm and humid air [81].

5. Conclusions and Final Remarks

We analysed the interannual series of the annual maximum daily precipitation (PMD) for the period of 1851–2021, using the records provided by the ROA, located in the southwestern Iberian Peninsula. The ta of this secular series was 1440 min, except for the last 35 years of the series, due to the absence of sub-daily records. This implies a limitation compared to the most modern pluviometric series. The study of maximum daily precipitation is of special interest in the Mediterranean region due to the potential environmental hazard that they can generate in the form of floods and river overflows. The most relevant characteristic of the analysed PMD series, and by extension of the torrential rains, is the irregular intensity of the event and its interannual distribution. Although the obtained series does not show a statistically significant trend, it does show different subperiods of great variability that fluctuate in time throughout the 20th century. Another relevant aspect of the obtained results is that the intra-annual distribution of the annual maximum daily precipitation is concentrated in the autumn months. This result is valid for hazards caused by increases in the frequency and/or intensity of the maximum daily precipitation.
Using the mean values and standard deviation, the local risk levels were established. Thirty-eight percent of the years reached, at least, a low risk (RL > 53.7 mm). Of this percentage of years, 13% reached a high risk (RH > 73.2 mm), and 5% reached a disaster risk (RD > 92.7 mm) as a result of torrential rains. The empirical results were compared with the theoretical SQRT-ETMax estimation using the probability of occurrence of pre-set values and the predictable return periods. It was detected that the applied model fits well to the empirical results for return periods of up to 25 years. However, there were appreciable deviations for longer return periods. The annual maximum daily precipitation recorded in the historical series of 170 years was 140.5 mm, which, according to the estimation of the model, corresponds to a return period of 247 years.
The theoretical model SQRT-ETMax was selected for this study as a comparison method. This allowed for verifying that the theoretical probability of occurrence of the risk levels and return periods estimated by it fit well to the real values calculated directly in the historical series. The advantage of having a long series of records (1851–2021) in a region with high climate variability (i.e., Mediterranean climate) is that it allows for approaching the extreme climatic episodes more accurately. In this sense, the lack of instrumental series of the annual maximum daily precipitation longer than one and a half centuries, at a global scale, shows the importance of the results in this study. This allowed for analysing long return periods, which are, thus, of very low probability of occurrence. Furthermore, this method allows for detecting changes in the frequency, duration and magnitude of these extreme values from a historical perspective, and it can also be applied to other climatic regions with observatories with series of secular data. In general, the monthly NAO effect is not correlated with the PMD but the influence on the level of risk is observed. Future research could analyse the relationship of the PMD with other teleconnections, such as the El Niño-Southern Oscillation (ENSO) and the Western Mediterranean Oscillation (WeMO).

Author Contributions

Conceptualization, L.G.-B.; methodology, investigation and formal analysis, L.G.-B., J.M., M.A.-A. and A.S.; resources, data curation and, L.G.-B., J.M. and A.S., writing—original draft preparation, L.G.-B., J.M., M.A.-A. and A.S.; visualization, L.G.-B. and M.A.-A.; writing—review and editing, M.A.-A., A.S., J.M. and L.G.-B. All authors have read and agreed to the published version of the manuscript.

Funding

This study was partially funded by project PID2019-104343RB-I00 and RTI2018-096561-A-I00.

Institutional Review Board Statement

Not applicable.

Informed Consent Statement

Not applicable.

Data Availability Statement

Not applicable.

Acknowledgments

We would like to thank the Royal Observatory of the Navy of San Fernando for providing the records of precipitation from its historical archive. The authors are grateful to the anonymous reviewers for their comments and suggestions, which helped to improve the manuscript.

Conflicts of Interest

The authors declare no conflict of interest.

References

  1. García-Barrón, L.; Aguilar-Alba, M.; Sousa Martín, A. Evolution of annual rainfall irregularity in the southwest of the Iberian Peninsula. Theor. Appl. Climatol. 2011, 103, 13–26. [Google Scholar] [CrossRef]
  2. Aguilar-Alba, M. Regionalización Pluviométrica de Andalucía: Análisis de su Red de Observación para la Gestión Medioambiental. Ph.D. Thesis, Universidad de Sevilla, Sevilla, Spain, 2016. [Google Scholar]
  3. Páscoa, P.; Gouveia, C.M.; Russo, A.; Trigo, R.M. Drought Trends in the Iberian Peninsula over the Last 112 Years. Adv. Meteorol. 2017, 2017, 4653126. [Google Scholar] [CrossRef] [Green Version]
  4. Aguilar-Alba, M.; Pita López, M.F. Evolución de la variabilidad pluviométrica en Andalucía occidental: Su repercusión en la gestión de los recursos hídricos. In Clima y Agua. La Gestión de un Recurso Climático; Marzol Jaén, V., Dorta, P., Valladares, P., Eds.; Tabapress: La Laguna, Spain, 1996; pp. 299–310. ISBN 9788479521721. [Google Scholar]
  5. Giansante, C.; Aguilar-Alba, M.; Babiano-Amelibia, L.; Garrido, A.; Gómez, A.; Iglesias, E.; Lise, W.; Moral-Ituarte, L.D.; Pedregal-Mateos, B. Institutional adaptation to changing risk of water scarcity in the lower Guadalquivir basin. Nat. Resour. J. 2002, 42, 521–563. [Google Scholar]
  6. Trigo, R.M.; Ramos, A.M.; Nogueira, P.J.; Santos, F.D.; Garcia-Herrera, R.; Gouveia, C.; Santo, F.E. Evaluating the impact of extreme temperature based indices in the 2003 heatwave excessive mortality in Portugal. Environ. Sci. Policy 2009, 12, 844–854. [Google Scholar] [CrossRef]
  7. García-Barrón, L.; Morales, J.; Sousa, A. Characterisation of the intra-annual rainfall and its evolution (1837–2010) in the southwest of the Iberian Peninsula. Theor. Appl. Climatol. 2013, 114, 445–457. [Google Scholar] [CrossRef]
  8. Gonzalez-Hidalgo, J.C.; Lopez-Bustins, J.A.; Štepánek, P.; Martin-Vide, J.; de Luis, M. Monthly precipitation trends on the Mediterranean fringe of the Iberian Peninsula during the second-half of the twentieth century (1951–2000). Int. J. Climatol. 2009, 29, 1415–1429. [Google Scholar] [CrossRef]
  9. Haktanir, T.; Bajabaa, S.; Masoud, M. Stochastic analyses of maximum daily rainfall series recorded at two stations across the Mediterranean Sea. Arab. J. Geosci. 2013, 6, 3943–3958. [Google Scholar] [CrossRef]
  10. Moral, F.J.; Rebollo, F.J.; Paniagua, L.L.; García-Martín, A.; Honorio, F. Spatial distribution and comparison of aridity indices in Extremadura, southwestern Spain. Theor. Appl. Climatol. 2016, 126, 801–814. [Google Scholar] [CrossRef]
  11. Ruiz Sinoga, J.D.; Garcia Marin, R.; Martinez Murillo, J.F.; Gabarron Galeote, M.A. Precipitation dynamics in southern Spain: Trends and cycles. Int. J. Climatol. 2011, 31, 2281–2289. [Google Scholar] [CrossRef]
  12. Rodríguez-Fonseca, B.; Casado, M.J.; Barriopedro, D. Modos de variabilidad que afectan al suroeste de Europa. CLIVAR Exch. 2017, 73, 24–31. [Google Scholar] [CrossRef]
  13. García-Marín, A.P.; Ayuso-Muñoz, J.L.; Taguas-Ruiz, E.V.; Estevez, J. Regional analysis of the annual maximum daily rainfall in the province of Malaga (southern Spain) using the principal component analysis. Water Environ. J. 2011, 25, 522–531. [Google Scholar] [CrossRef]
  14. Tramblay, Y.; Somot, S. Future evolution of extreme precipitation in the Mediterranean. Clim. Chang. 2018, 151, 289–302. [Google Scholar] [CrossRef]
  15. Kao, S.-C.; Ganguly, A.R. Intensity, duration, and frequency of precipitation extremes under 21st-century warming scenarios. J. Geophys. Res. 2011, 116, D16119. [Google Scholar] [CrossRef] [Green Version]
  16. Ayuso-Muñoz, J.L.; García-Marín, A.P.; Ayuso-Ruiz, P.; Estévez, J.; Pizarro-Tapia, R.; Taguas, E.V. A more efficient rainfall intensity-duration-frequency relationship by using an “at-site” regional frequency analysis: Application at Mediterranean climate locations. Water Resour. Manag. 2015, 29, 3243–3263. [Google Scholar] [CrossRef]
  17. Marra, F.; Morin, E.; Peleg, N.; Mei, Y.; Anagnostou, E.N. Intensity–duration–frequency curves from remote sensing rainfall estimates: Comparing satellite and weather radar over the eastern Mediterranean. Hydrol. Earth Syst. Sci. 2017, 21, 2389–2404. [Google Scholar] [CrossRef] [Green Version]
  18. Şen, Z. Annual daily maximum rainfall-based IDF curve derivation methodology. Earth Syst. Environ. 2019, 3, 463–469. [Google Scholar] [CrossRef]
  19. Morbidelli, R.; García-Marín, A.P.; Mamun, A.A.; Atiqur, R.M.; Ayuso-Muñoz, J.L.; Taouti, M.B.; Baranowski, P.; Bellocchi, G.; Sangüesa-Pool, C.; Bennett, B.; et al. The history of rainfall data time-resolution in a wide variety of geographical areas. J. Hydrol. 2020, 590, 125258. [Google Scholar] [CrossRef]
  20. Herrera-Grimaldi, P.; García-Marín, A.; Ayuso-Muñoz, J.L.; Flamini, A.; Morbidelli, R.; Ayuso-Ruíz, J.L. Detection of trends and break points in temperature: The case of Umbria (Italy) and Guadalquivir Valley (Spain). Acta Geophys. 2018, 66, 329–343. [Google Scholar] [CrossRef]
  21. García-Barrón, L.; Camarillo, J.M.; Morales, J.; Sousa, A. Temporal analysis (1940–2010) of rainfall aggressiveness in the Iberian Peninsula basins. J. Hydrol. 2015, 525, 747–759. [Google Scholar] [CrossRef]
  22. Rodriguez-Lloveras, X.; Buytaert, W.; Benito, G. Land use can offset climate change induced increases in erosion in Mediterranean watersheds. Catena 2016, 143, 244–255. [Google Scholar] [CrossRef]
  23. Segoni, S.; Piciullo, L.; Gariano, S.L. A review of the recent literature on rainfall thresholds for landslide occurrence. Landslides 2018, 15, 1483–1501. [Google Scholar] [CrossRef]
  24. Beguería Portugués, S. Revisión de métodos paramétricos para la estimación de la probabilidad de ocurrencia de eventos extremos en Climatología e Hidrología: El uso de series de excedencias y su comparación con las series de máximos anuales. In La Información Climática como Herramienta de Gestión Ambiental; Cuadrat, J.M., Vicente, S.M., Saz, M.A., Eds.; Universidad de Zaragoza: Zaragoza, Spain, 2002; Volume 1, pp. 83–92. [Google Scholar]
  25. Diodato, N.; Bellocchi, G. Storminess and environmental changes in the Mediterranean central area. Earth Interact. 2010, 14, 1–16. [Google Scholar] [CrossRef]
  26. Serrano-Muela, M.P.; Nadal-Romero, E.; Lana-Renault, N.; González-Hidalgo, J.C.; López-Moreno, J.I.; Beguería, S.; Sanjuan, Y.; García-Ruiz, J.M. An exceptional rainfall event in the central western Pyrenees: Spatial patterns in discharge and impact. Land Degrad. Dev. 2015, 26, 249–262. [Google Scholar] [CrossRef] [Green Version]
  27. Ghenim, A.N.; Megnounif, A. Variability and trend of annual maximum daily rainfall in northern Algeria. Int. J. Geophys. 2016, 2016, 6820397. [Google Scholar] [CrossRef] [Green Version]
  28. O’Gorman, P.A. Precipitation extremes under climate change. Curr. Clim. Chang. Rep. 2015, 1, 49–59. [Google Scholar] [CrossRef] [Green Version]
  29. White, S.; García-Ruiz, J.M.; Martí, C.; Valero, B.; Errea, M.P.; Gómez-Villar, A. The 1996 Biescas campsite disaster in the Central Spanish Pyrenees, and its temporal and spatial context. Hydrol. Process. 1997, 11, 1797–1812. [Google Scholar] [CrossRef]
  30. Beguería, S.; Angulo-Martínez, M.; Vicente-Serrano, S.M.; López-Moreno, J.I.; El-Kenawy, A. Assessing trends in extreme precipitation events intensity and magnitude using non-stationary peaks-over-threshold analysis: A case study in northeast Spain from 1930 to 2006. Int. J. Climatol. 2011, 31, 2102–2114. [Google Scholar] [CrossRef] [Green Version]
  31. Zorraquino Junquera, C. El modelo SQRT-ET MAX. Rev. Obras Públicas 2004, 151, 33–37. [Google Scholar]
  32. Casas-Castillo, M.C.; Rodríguez-Solà, R.; Navarro, X.; Russo, B.; Lastra, A.; González, P.; Redaño, A. On the consideration of scaling properties of extreme rainfall in Madrid (Spain) for developing a generalized intensity-duration-frequency equation and assessing probable maximum precipitation estimates. Theor. Appl. Climatol. 2018, 131, 573–580. [Google Scholar] [CrossRef]
  33. Bianucci, P.; Sordo-Ward, Á.; Moralo, J.; Garrote, L. Probabilistic-multiobjective comparison of user-defined operating rules. case study: Hydropower dam in Spain. Water 2015, 7, 956–974. [Google Scholar] [CrossRef] [Green Version]
  34. Flores, I.; Sordo-Ward, A.; Garrote, L. Probabilistic methods for hydrologic dam safety analysis. In Dam Protections against Overtopping and Accidental Leakage; CRC Press: Boca Raton, FL, USA, 2015; pp. 283–296. ISBN 9780429226243. [Google Scholar]
  35. Garrote, J.; Díez-Herrero, A.; Bodoque, J.M.; Perucha, M.A.; Mayer, P.L.; Génova, M. Flood hazard management in public mountain recreation areas vs. Ungauged fluvial basins. case study of the caldera de Taburiente National Park, Canary Islands (Spain). Geosciences 2018, 8, 6. [Google Scholar] [CrossRef] [Green Version]
  36. Campos-Aranda, D.F. Predicciones extremas de lluvia en 24 horas en el estado de Zacatecas, México. Tecnol. Cienc. Agua 2014, 5, 199–225. [Google Scholar]
  37. Ministerio de Fomento Máximas Lluvias Diarias en España Peninsular; Serie monográfica del Ministerio de Fomento; Dirección General de Carreteras: Madrid, Spain, 1999; ISBN 8449804191.
  38. Serrano-Notivoli, R.; Martín-Vide, J.; Saz, M.A.; Longares, L.A.; Beguería, S.; Sarricolea, P.; Meseguer-Ruiz, O.; de Luis, M. Spatio-temporal variability of daily precipitation concentration in Spain based on a high-resolution gridded data set. Int. J. Climatol. 2018, 38, e518–e530. [Google Scholar] [CrossRef] [Green Version]
  39. Koutsoyiannis, D. Statistics of extremes and estimation of extreme rainfall: I. Theoretical investigation. Hydrol. Sci. J. 2004, 49, 575–590. [Google Scholar] [CrossRef] [Green Version]
  40. Koutsoyiannis, D. Statistics of extremes and estimation of extreme rainfall: II. Empirical investigation of long rainfall records. Hydrol. Sci. J. 2004, 49, 591–610. [Google Scholar] [CrossRef]
  41. Jenkinson, A.F. The frequency distribution of the annual maximum (or minimum) values of meteorological elements. Q. J. R. Meteorol. Soc. 1955, 81, 158–171. [Google Scholar] [CrossRef]
  42. Papalexiou, S.M.; Koutsoyiannis, D. Battle of extreme value distributions: A global survey on extreme daily rainfall. Water Resour. Res. 2013, 49, 187–201. [Google Scholar] [CrossRef]
  43. Veneziano, D.; Langousis, A.; Lepore, C. New asymptotic and preasymptotic results on rainfall maxima from multifractal theory. Water Resour. Res. 2009, 45. [Google Scholar] [CrossRef]
  44. Esteves, L.S. Consequences to flood management of using different probability distributions to estimate extreme rainfall. J. Environ. Manag. 2013, 115, 98–105. [Google Scholar] [CrossRef]
  45. Vicente-Serrano, S.M.; Trigo, R.M.; López-Moreno, J.I.; Liberato, M.L.R.; Lorenzo-Lacruz, J.; Beguería, S.; Morán-Tejeda, E.; El Kenawy, A. Extreme winter precipitation in the Iberian Peninsula in 2010: Anomalies, driving mechanisms and future projections. Clim. Res. 2011, 46, 51–65. [Google Scholar] [CrossRef] [Green Version]
  46. Rodríguez-Puebla, C.; Nieto, S. Trends of precipitation over the Iberian Peninsula and the North Atlantic Oscillation under climate change conditions. Int. J. Climatol. 2010, 30, 1807–1815. [Google Scholar] [CrossRef]
  47. Hidalgo-Muñoz, J.M.; Argüeso, D.; Gámiz-Fortis, S.R.; Esteban-Parra, M.J.; Castro-Díez, Y. Trends of extreme precipitation and associated synoptic patterns over the southern Iberian Peninsula. J. Hydrol. 2011, 409, 497–511. [Google Scholar] [CrossRef]
  48. Lorenzo-Lacruz, J.; Vicente-Serrano, S.M.; López-Moreno, J.I.; González-Hidalgo, J.C.; Morán-Tejeda, E. The response of Iberian rivers to the North Atlantic Oscillation. Hydrol. Earth Syst. Sci. 2011, 15, 2581–2597. [Google Scholar] [CrossRef] [Green Version]
  49. Castro, A.; Vidal, M.I.; Calvo, A.I.; Fernández-Raga, M.; Fraile, R. May the NAO index be used to forecast rain in Spain? Atmosfera 2011, 24, 251–265. [Google Scholar]
  50. García-Barrón, L.; Aguilar-Alba, M.; Morales, J.; Sousa, A. Intra-annual rainfall variability in the Spanish hydrographic basins. Int. J. Climatol. 2018, 38, 2215–2229. [Google Scholar] [CrossRef]
  51. Gallego, M.C.; García, J.A.; Vaquero, J.M. The NAO signal in daily rainfall series over the Iberian Peninsula. Clim. Res. 2005, 29, 103–109. [Google Scholar] [CrossRef]
  52. Moreno-Pérez, M.F.; Woolhiser, D.A.; Roldán-Cañas, J. Effects of parameter perturbation on daily precipitation models in Southern Spain using the NAO index. Int. J. Climatol. 2014, 34, 2556–2572. [Google Scholar] [CrossRef]
  53. Luterbacher, J.; Xoplaki, E.; Casty, C.; Wanner, H.; Pauling, A.; Küttel, M.; Rutishauser, T.; Brönnimann, S.; Fischer, E.; Fleitmann, D.; et al. Chapter 1 Mediterranean climate variability over the last centuries: A review. Dev. Earth Environ. Sci. 2006, 4, 27–148. [Google Scholar] [CrossRef]
  54. Pita López, M.F. El clima de Andalucía. In Geografía de Andalucía; López Ontiveros, A., Ed.; Ariel Geografía: Barcelona, Spain, 2003; pp. 137–174. [Google Scholar]
  55. De Luis, M.; Brunetti, M.; Gonzalez-Hidalgo, J.C.; Longares, L.A.; Martin-Vide, J. Changes in seasonal precipitation in the Iberian Peninsula during 1946–2005. Glob. Planet. Chang. 2010, 74, 27–33. [Google Scholar] [CrossRef]
  56. Sousa, A.; García-Murillo, P.; Sahin, S.; Morales, J.; García-Barrón, L. Wetland place names as indicators of manifestations of recent climate change in SW Spain (Doñana Natural Park). Clim. Chang. 2010, 100, 525–557. [Google Scholar] [CrossRef]
  57. Sousa, A.; Morales, J.; García-Barrón, L.; García-Murillo, P. Changes in the Erica ciliaris Loefl. ex L. peat bogs of southwestern Europe from the 17th to the 20th centuries ad. Holocene 2013, 23, 255–269. [Google Scholar] [CrossRef]
  58. Álvarez-Rodríguez, J.; Llasat, M.C.; Estrela, T. Analysis of geographic and orographic influence in Spanish monthly precipitation. Int. J. Climatol. 2017, 37, 350–362. [Google Scholar] [CrossRef]
  59. Camarasa-Belmonte, A.M. Flash floods in Mediterranean ephemeral streams in Valencia Region (Spain). J. Hydrol. 2016, 541, 99–115. [Google Scholar] [CrossRef]
  60. Delgado Peña, J.J.; Martínez Murillo, J.F.; Ruiz Sinoga, J.D. Aproximación a la aplicación de la metodología de los sistemas de conexión de biotopos en los pinsapares de la cuenca alta del Zarzalones (Sierra de las Nieves, Málaga): Consideraciones espacio-temporales. In Los Bosques de la Serranía de Ronda: Una Perspectiva Espacio-Temporal; La Serranía: Mallorca, Spain, 2021; pp. 267–284. ISBN 978-84-15588-35-1. [Google Scholar]
  61. Ferrer Polo, F.J.; López Ardiles, L. Análisis estadístico de las series anuales de máximas lluvias diarias en España. Rev. Digit. Cedex 1994, 95, 87–100. [Google Scholar]
  62. Ferrer Polo, F.J. El Modelo de Función de Distribución SQRT et MAX en el Análisis Regional de Máximos Hidrológicos: Aplicacion a Lluvias Diarias. Ph.D. Thesis, Universidad Politécnica de Madrid, Madrid, Spain, 1996. [Google Scholar]
  63. Rodrigo, F.S. Changes in climate variability and seasonal rainfall extremes: A case study from San Fernando (Spain), 1821–2000. Theor. Appl. Climatol. 2002, 72, 193–207. [Google Scholar] [CrossRef]
  64. Martin-Vide, J.; Lopez-Bustins, J.A. The Western Mediterranean Oscillation and rainfall in the Iberian Peninsula. Int. J. Climatol. 2006, 26, 1455–1475. [Google Scholar] [CrossRef]
  65. Jones, P.D.; Jonsson, T.; Wheeler, D. Extension to the North Atlantic Oscillation using early instrumental pressure observations from gibraltar and south-west Iceland. Int. J. Climatol. 1997, 17, 1433–1450. [Google Scholar] [CrossRef]
  66. Pita López, M.; Camarillo Naranjo, J.; Aguilar-Alba, M. La evolución de la variabilidad pluviométrica en Andalucía y sus relaciones con el índice de la NAO. In La Climatología Española en los Albores del Siglo XXI; Raso Nadal, J.M., Martín-Vide, J., Eds.; Asociación Española de Climatología (AEC): Barcelona, Spain, 1999; pp. 399–408. [Google Scholar]
  67. Barriendos, M.; Martín-Vide, J.; Peña, J.C.; Rodríguez, R. Daily meteorological observations in Cádiz—San Fernando. Analysis of the documentary sources and the instrumental data content (1786–1996). Clim. Chang. 2002, 53, 151–170. [Google Scholar] [CrossRef]
  68. Fernández-Montes, S.; Rodrigo, F.S.; Seubert, S.; Sousa, P.M. Spring and summer extreme temperatures in Iberia during last century in relation to circulation types. Atmos. Res. 2013, 127, 154–177. [Google Scholar] [CrossRef]
  69. Sousa, A.; Morales, J.; Aguilar-Alba, M.; García-Barrón, L. Classification of the flood severity of the Guadalquivir River in the Southwest of the Iberian Peninsula during the 13th to 19th centuries. Atmósfera 2021. [Google Scholar] [CrossRef]
  70. Alimonti, G.; Mariani, L.; Prodi, F.; Ricci, R.A. A critical assessment of extreme events trends in times of global warming. Eur. Phys. J. Plus 2022, 137, 1–20. [Google Scholar] [CrossRef]
  71. Etoh, T.; Murota, A.; Nakanishi, M. SQRT-Exponential type distribution of Maximum. In Hydrologic Frequency Modeling, Proceedings of the International Symposium on Flood Frequency and Risk Analyses, Baton Rouge, LA, USA, 14–17 May 1986; Singh, V.P., Ed.; Springer: Dordrecht, The Netherlands, 1987; pp. 253–264. [Google Scholar]
  72. Barnston, A.G.; Livezey, R.E. Classification, Seasonality and Persistence of Low-Frequency Atmospheric Circulation Patterns. Mon. Weather Rev. 1987, 115, 1083–1126. [Google Scholar] [CrossRef]
  73. Blanchet, J.; Molinié, G.; Touati, J. Spatial analysis of trend in extreme daily rainfall in southern France. Clim. Dyn. 2018, 51, 799–812. [Google Scholar] [CrossRef]
  74. Koutsoyiannis, D.; Baloutsos, G. Analysis of a long record of annual maximum rainfall in Athens, Greece, and design rainfall inferences. Nat. Hazards 2000, 22, 29–48. [Google Scholar] [CrossRef]
  75. Joorabian Shooshtari, S.; Shayesteh, K.; Gholamalifard, M.; Azari, M.; Serrano-Notivoli, R.; López-Moreno, J.I. Impacts of future land cover and climate change on the water balance in northern Iran. Hydrol. Sci. J. 2017, 62, 2655–2673. [Google Scholar] [CrossRef]
  76. Serrano-Notivoli, R.; De Luis, M.; Saz, M.Á.; Beguería, S. Spatially based reconstruction of daily precipitation instrumental data series. Clim. Res. 2017, 73, 167–186. [Google Scholar] [CrossRef] [Green Version]
  77. Barranco, L.M.; Álvarez-Rodríguez, J.; Olivera, F.; Potenciano, Á. Analysis of downscaled climatic simulations to infer future changes on high precipitation in Spain. Int. J. River Basin Manag. 2017, 15, 161–173. [Google Scholar] [CrossRef]
  78. Centro de Estudios Hidrográficos. Impacto del Cambio Climático en las Precipitaciones Máximas en España (2021); Gobierno de España: Madrid, Spain, 2021. [Google Scholar]
  79. Dreux Miranda Fernandes, R.; Vieira José, J.; Wolff, W.; Folegatti, M.V. Daily maximum annual rainfall statistical regionalization in Andalusia. In Clima, Sociedad, Riesgos y Ordenación del Territorio; Olcina Cantos, J., Rico Amorós, A.M., Moltó Mantero, E., Eds.; Asociación Española de Climatología, Instituto Interuniversitario de Geografía, Universidad de Alicante: Alicante, Spain, 2016; pp. 87–96. [Google Scholar]
  80. Sevilla Córdoba, B.M. Estudio Hidrológico y de Planificación del Embalse del Jarrama. Master’s Thesis, Universidad de Sevilla, Sevilla, Spain, 2017. [Google Scholar]
  81. Ferreira, R.N. Cut-off lows and extreme precipitation in eastern Spain: Current and future climate. Atmosphere 2021, 12, 835. [Google Scholar] [CrossRef]
Figure 1. Location of the Royal Observatory of the Spanish Navy of San Fernando in the southwestern Iberian Peninsula.
Water 14 01504 g001
Figure 2. Temporal evolution of the annual maximum daily precipitation (PMD) compared with the estimated risk values (RL = 53.7 mm, RH = 73.2 mm and RD = 92.7 mm).
Water 14 01504 g002
Figure 3. Relative accumulated deviation An of PMD with respect to risk threshold RL.
Water 14 01504 g003
Figure 4. Evolution of 11-year running coefficient of variation (11).
Water 14 01504 g004
Figure 5. Monthly distribution of the volume (mm) of the annual maximum daily precipitation compared with the estimated risk values (RL = 53.7 mm, RH = 73.2 mm and RD = 92.7 mm).
Water 14 01504 g005
Table 1. Monthly distribution of the annual maximum daily precipitation (PMD) in which at least the three risk levels indicated are reached.
Number of Months (Accumulated)JFMAMJJASONDTotal
RD months1000010003229
RH months 20000100366422
RL months 41401201514171564
Complete series2113103440312333235170
Table 2. Comparison of probability of reaching the indicated PMD value and its corresponding return period in years.
Risk ThresholdPMDTheorical Probability versus Earl ProbabilityTheoretical Return Period versus Real Return Period
Level RL53.70.41 versus 0.382.46 versus 2.66
Level RH73.20.13 versus 0.137.65 versus 7.73
Level RD92.70.04 versus 0.0518.89 versus 22.57
Historical maximum PMD140.50.004 versus --247.2 versus >170
Table 3. Annual PMD values estimated by the Gumbel type II model for the selected return periods.
Return Periods (Years)203050100
PMD (mm)90.297.6107.4121.2
Table 4. Effect of monthly NAO index (September to February) on the daily precipitation level.
NAO IndexSONDJF
General PMD−0.24−0.51−0.150.360.740.69
Risk PMD−0.80−1.39−0.83−0.89−0.10−0.08
Difference−0.56−0.87−0.68−1.26−0.84−0.77
Publisher’s Note: MDPI stays neutral with regard to jurisdictional claims in published maps and institutional affiliations.

