Article

Enhancing Sustainable Urban Planning through GIS and Multiple-Criteria Decision Analysis: A Case Study of Green Space Infrastructure in Taif Province, Saudi Arabia

by
Sahl Abdullah Waheeb
1,
Bilel Zerouali
2,
Ahmed Elbeltagi
3,*,
Mamdooh Alwetaishi
4,
Yong Jie Wong
5,*,
Nadjem Bailek
6,7,
Ahmad Ameen AlSaggaf
8,
Sahar I. M. Abd Elrahman
9,
Celso Augusto Guimarães Santos
10 and
Abdulrahman Abdulaziz Majrashi
11
1
Applied College, Umm Al-Qura University, P.O. Box 715, Makkah 21955, Saudi Arabia
2
Vegetal Chemistry-Water-Energy Laboratory, Department of Hydraulic, Faculty of Civil Engineering and Architecture, Hassiba Benbouali University of Chlef, B.P. 78C, Ouled Fares, Chlef 02180, Algeria
3
Agricultural Engineering Department, Faculty of Agriculture, Mansoura University, Mansoura 35516, Egypt
4
Department of Civil Engineering, College of Engineering, Taif University, P.O. Box 888, Taif 21974, Saudi Arabia
5
Department of Bioenvironmental Design, Faculty of Bioenvironmental Sciences, Kyoto University of Advanced Science, Kyoto 606-8501, Japan
6
Laboratory of Mathematics Modeling and Applications, Department of Mathematics and Computer Science, Faculty of Sciences and Technology, Ahmed Draia University of Adrar, Adrar 01000, Algeria
7
MEU Research Unit, Middle East University, Amman 11831, Jordan
8
Department of Urban and Engineering Research, The Custodian of the Two Holy Mosques Institute for Hajj and Umrah Research, Umm Al-Qura University, P.O. Box 715, Makkah 21955, Saudi Arabia
9
Surveying Engineering Department, College of Engineering, Sudan University of Science and Technology, Khartoum 14413, Sudan
10
Department of Civil and Environmental Engineering, Federal University of Paraíba, João Pessoa 58051-900, Brazil
11
Architecture Department, College of Engineering and Architecture, Umm Al-Qura University, P.O. Box 715, Makkah 21955, Saudi Arabia
*
Authors to whom correspondence should be addressed.
Submission received: 21 June 2023 / Revised: 6 August 2023 / Accepted: 8 August 2023 / Published: 23 August 2023
(This article belongs to the Special Issue Review Papers of Urban Water Management 2023)

Abstract

:
Ecotourism in Saudi Arabia (KSA) is gaining significant attention due to the country’s diverse natural landscapes, rich biodiversity, and efforts to preserve and display its environmental treasures. This study presents a comprehensive assessment of urban green space (UGS) suitability in the Taif region of Saudi Arabia using a geographic information system (GIS) combined with a multiple-criteria decision-analysis-based analytic hierarchy process (AHP). The integration of various morphologic, topographic, climatic, and land use/land change (LULC) maps provided a robust framework for evaluating the suitability of UGSs. In the framework of this study, ten criteria were used to elaborate on UGS suitability. The results indicate that distance to water, distance to road, rainfall, and LULC were the most influential criteria in determining UGS suitability. Distance to road emerged as the most significant criterion, emphasizing the importance of accessibility and visibility for attracting the public to green spaces. The Taif region demonstrated fair suitability for UGS development across 56.4% of its total area. However, large areas of barren land in the central and northeastern parts were rendered unsuitable for UGS development, while the southwestern part showed higher percentages of good and excellent suitability. This study highlights the importance of considering the visibility and awareness aspects of UGS planning, as it serves as a visual reminder of the value of nature in urban settings. The results obtained by this research may help managers and decision makers with future planning for GI areas in the Taif region.

1. Introduction

Climate change refers to long-term changes in the Earth’s climate system, including temperature and precipitation [1,2], caused by human activities such as burning fossil fuels and deforestation [3]. These activities have led to more frequent and severe weather events, rising sea levels, and disruptions to ecosystems, significantly impacting water bodies and green spaces [4].
In this context, urban planning aims to create sustainable, livable, and functional urban environments that meet the needs of the community. By making the most efficient use of limited urban space, it provides adequate infrastructure and facilities while preserving open spaces and green areas [5,6,7,8,9]. Urban planning strives to promote social inclusion and equity by providing equal access to public services and amenities, such as transportation, housing, and education, regardless of income or social status [10,11,12]. On the other hand, it seeks to reduce the negative impact of urbanization on the environment by promoting sustainable development, such as the use of renewable energy sources, efficient waste management, and green spaces [13,14,15,16]. Furthermore, urban planning fosters economic growth and development by creating a favorable environment for businesses and industries, attracting investment, and creating job opportunities [17,18].
Preserving and promoting cultural heritage is also a priority in urban planning. Historic landmarks are conserved, cultural events and festivals are promoted, and public spaces for artistic and cultural expression are provided. By preserving cultural heritage, cities’ unique identities and characters are maintained, fostering a sense of pride and belonging among residents [19].
Countries worldwide are actively pursuing the creation of urban green spaces to improve the well-being of their citizens and address environmental concerns. For example, Singapore’s “City in a Garden” vision aims to achieve 85% greenery coverage by 2030 [20,21]. Japan, renowned for its public gardens and parks, promotes the preservation of traditional Japanese landscapes known as “Satoyama” [22,23]. In the United States, initiatives like the “10-Minute Walk” campaign aim to ensure convenient access to parks and green spaces for all residents [24]. Germany’s “Green Cities” initiative prioritizes green infrastructure, including trees, green roofs, and natural design elements, in urban spaces [25].
Recent research has unveiled the positive impact of urban green space infrastructure, such as parks and gardens, on people’s happiness and well-being [26,27,28,29,30]. It was demonstrated that these spaces can contribute to stress reduction by lowering stress levels, improving mood, and increasing happiness when individuals are immersed in a natural environment [31]. Additionally, they offer opportunities for physical activities like walking, running, cycling, or engaging in sports. Moreover, urban green space infrastructure can serve as a gathering place for social interactions, including picnics, community events, and various activities [32]. Social connections vital for overall well-being can be fostered in these spaces and contribute to happiness.
According to a World Health Organization report [33], urban green spaces provide substantial health benefits, particularly for economically deprived communities. Improved physical and mental health, reduced stress levels, and enhanced social cohesion are among the benefits associated with access to green spaces. The report emphasized the mitigation potential of urban green spaces in addressing climate change by reducing urban heat islands, improving air quality, and providing natural habitats for wildlife. The involvement of local residents in the planning and design of green spaces was also emphasized to ensure that their needs are met.
A study conducted by Porcherie et al. [34] aimed to investigate the potential links between urban green spaces and cancer incidence or mortality based on a review of existing literature. The review revealed some evidence suggesting reduced risks of certain types of cancer, such as breast and lung cancer, associated with exposure to urban green spaces. However, the overall evidence was limited and inconclusive when it came to establishing causality. In their study, Kwon et al. [35] analyzed the relationship between urban green space and happiness in 40 developed countries using data from the World Happiness Report. The results of the study demonstrated a positive correlation between urban green space and happiness in developed countries. These findings suggested that increasing access to green spaces in urban areas can contribute to the improvement of residents’ well-being and quality of life.
The relationships between urban green spaces and human health, mortality, and violence were analyzed by Kondo et al. [36]. It was argued that access to green spaces can have a positive impact on physical and mental health, including stress reduction, mood improvement, and the promotion of physical activity. The study concluded that increasing access to urban green spaces should be prioritized in public health initiatives in urban areas. Mensah [37] explored the importance of green spaces in African cities and the challenges encountered in their development. The report documented numerous benefits associated with urban green spaces, such as improved air quality, reduced urban heat island effects, recreational opportunities, and enhanced biodiversity. Several strategies were suggested to promote urban green spaces in African cities, including increasing public awareness about the benefits of green spaces, improving planning and management practices, involving local communities in park development and maintenance, and exploring alternative funding sources through public–private partnerships.
The significance of urban green infrastructure planning in emerging towns in Ethiopia was discussed by Girma et al. [38]. The authors argued that urban green infrastructure can provide numerous benefits for enhancing biodiversity. However, challenges such as capacity building, awareness creation, stakeholder involvement, and competing land uses need to be addressed for successful implementation.
Saudi Vision 2030, a strategic plan launched by the Saudi Arabian government in 2016, aims to diversify the country’s economy and reduce its dependence on oil [39]. One of the key pillars of this vision is developing a sustainable environment through investments in green space infrastructure projects [40]. To achieve this, the government has initiated various projects, such as planting millions of trees, establishing parks and recreational areas, and constructing cycling and walking paths. These efforts seek to improve the quality of life for citizens and visitors, encourage physical activity, and enhance the country’s natural beauty [41,42].
The Green Riyadh project is one of the significant green space infrastructure projects under Saudi Vision 2030 [43]. This initiative aims to transform Riyadh into one of the world’s most livable cities by planting 7.5 million trees, creating new parks and open spaces, and enhancing existing ones. Additionally, the project includes constructing cycling tracks, pedestrian walkways, and public transport facilities. Alongside the Green Riyadh project, other initiatives are underway throughout Saudi Arabia to increase green spaces and promote sustainability. Notable among these is the development of ecotourism destinations like AlUla and NEOM, which prioritize environmental conservation and offer unique experiences for visitors [44]. By promoting sustainable economic growth, preserving natural resources, and supporting local communities, ecotourism holds great potential for contributing to the goals of Saudi Vision 2030 [45,46].
Existing studies on the sustainable development of human and natural resources lack effective guidance for decision makers. To address this critical issue, our research takes a pioneering approach. By integrating various morphological, topographic, and climatic data and maps—such as the topographic position index (TPI), slope, topographic wetness index (TWI), distance to water, distance to road, rainfall, wind speed, land use/land change, topographic roughness index (TRI), and global exposure datasets—with employment in the agriculture sector (urban population) within a geographic information system (GIS) and a multi-criteria decision-analysis-based analytic hierarchy process (AHP), the focal point of this integrated approach is to evaluate and discern the suitability of urban green spaces (UGSs) within the Taif region of the Kingdom of Saudi Arabia. This study aims to uncover untapped potential by identifying optimal areas for UGS, enhancing the well-being of communities, and preserving the natural environment. Through this comprehensive analysis, we strive to pave the way for informed and sustainable decision making, fostering a greener and more resilient urban landscape in the Taif region.

2. Study Area

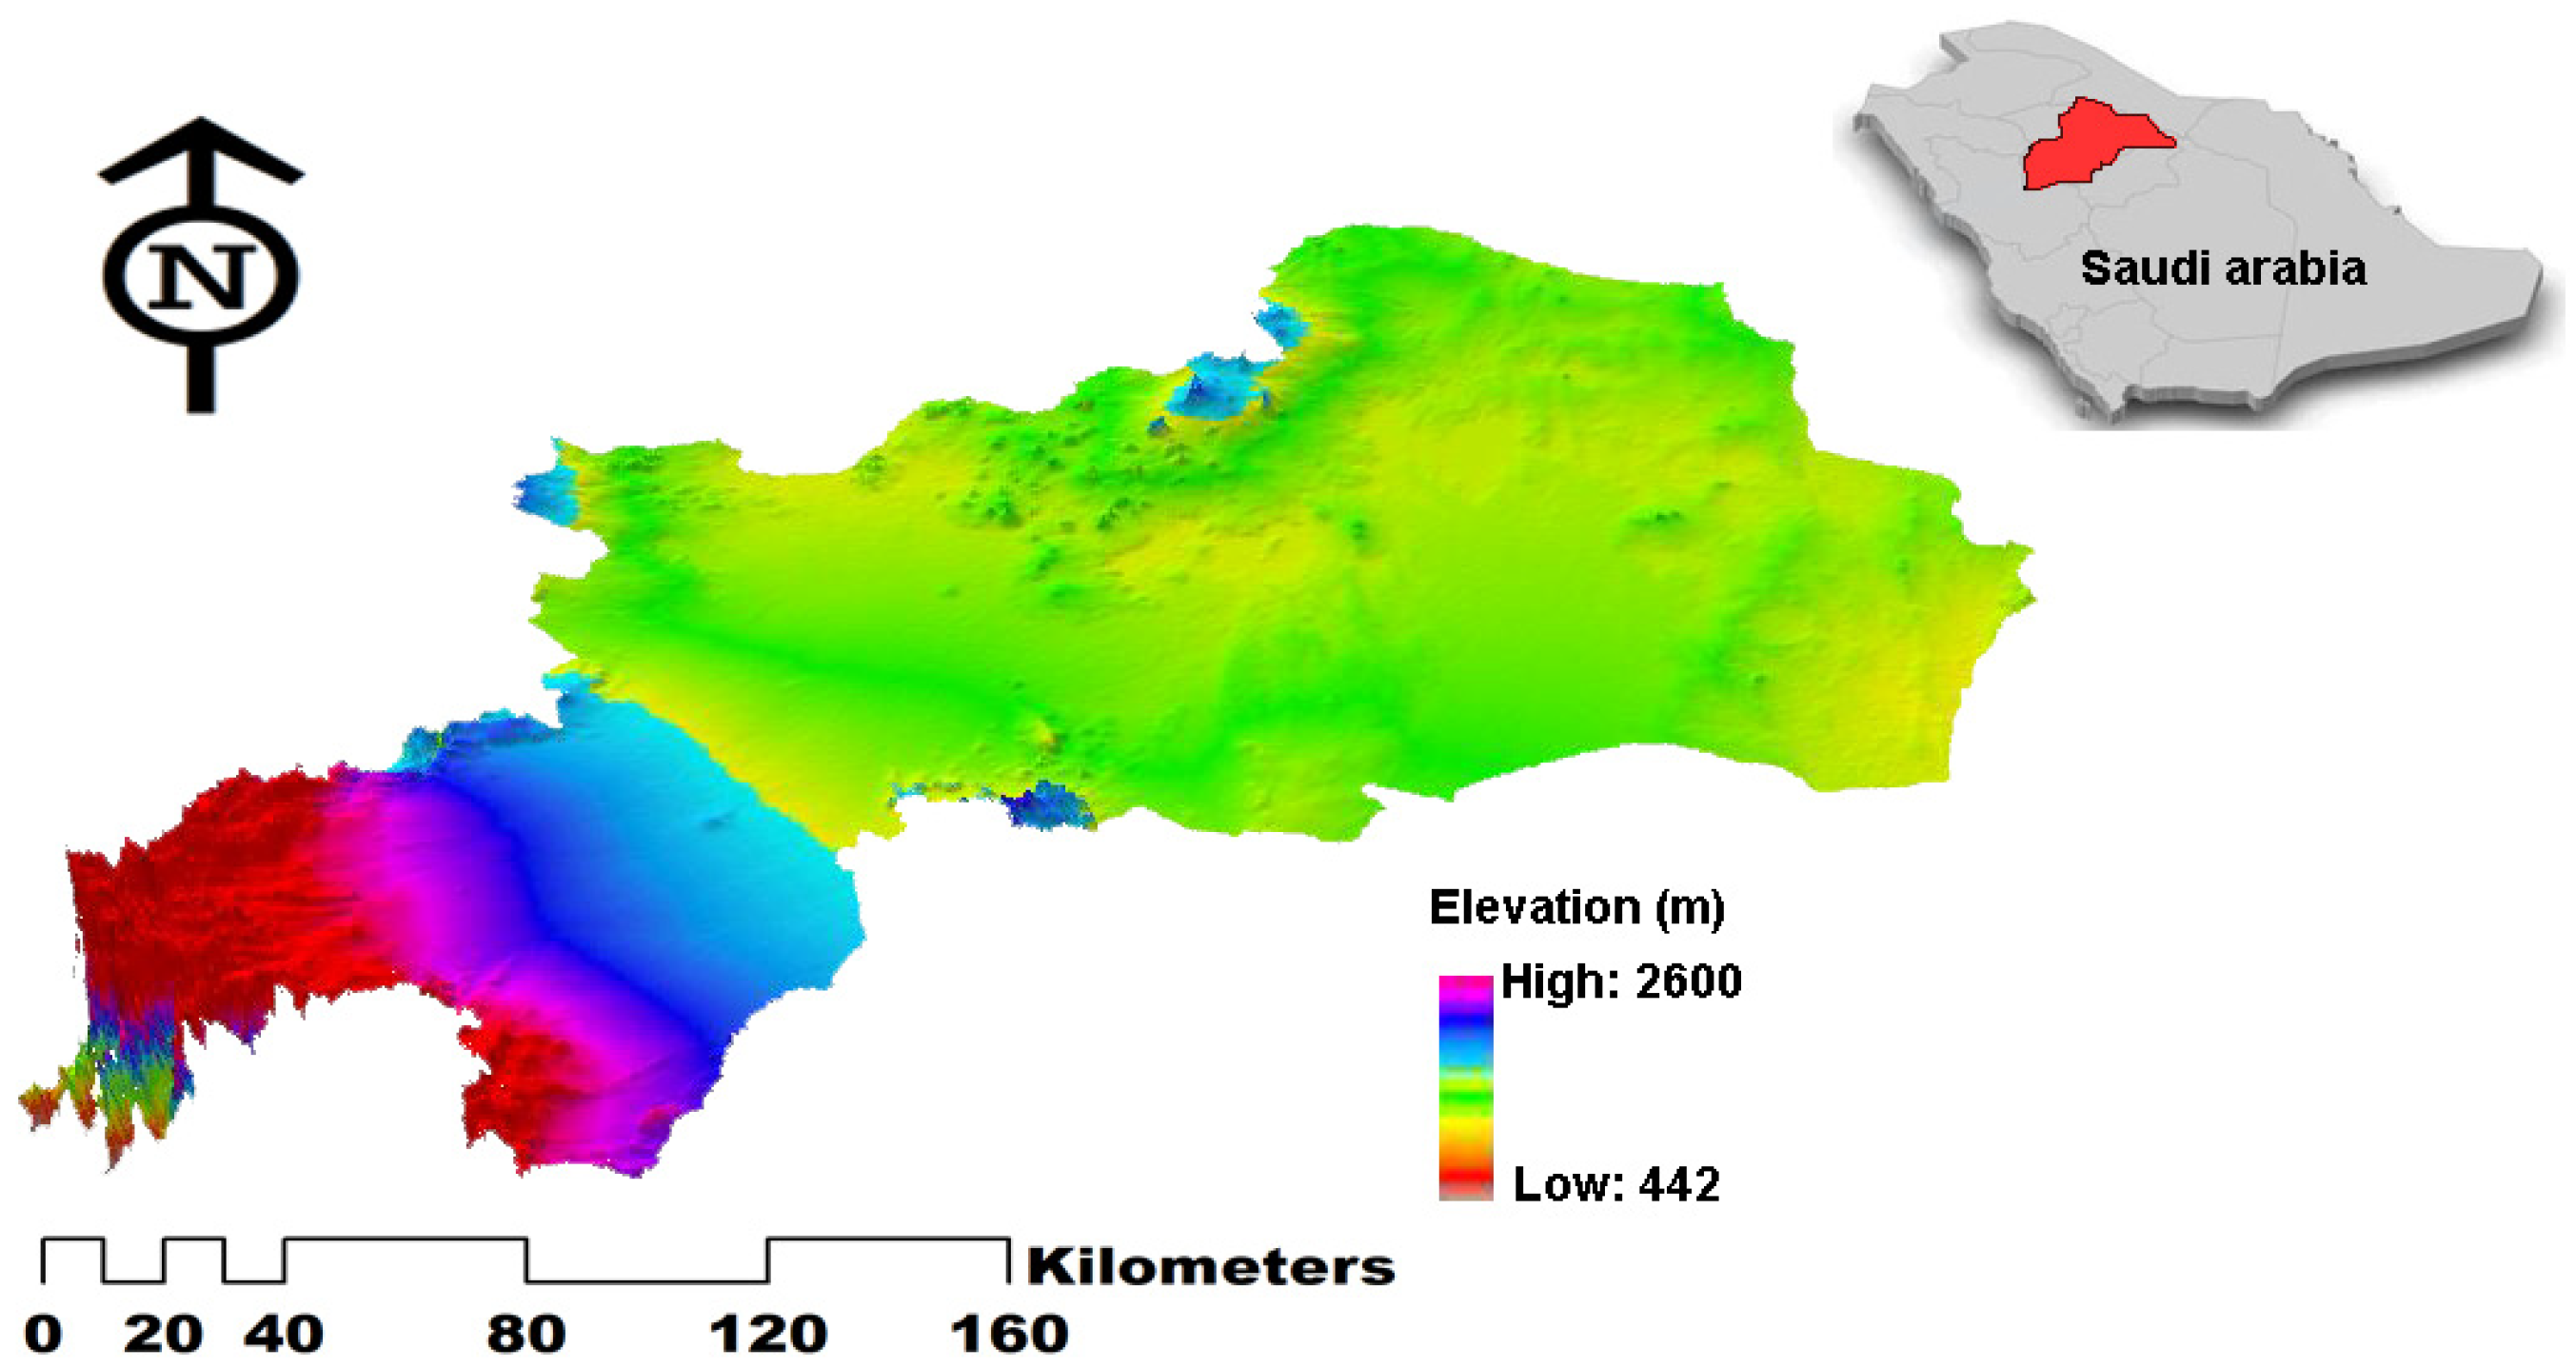
The Taif region is situated within the Mecca province of Saudi Arabia. With an elevation of approximately 1876 m above sea level, it ranks as one of the country’s highest cities (Figure 1). Geographically, the Taif region is located within the Sarawat mountain range, which stretches along the western coastline of Saudi Arabia. Enveloped by the Sarawat Mountains, which reach an elevation of about 2800 m, the city of Taif boasts an elevated terrain thanks to the presence of these mountains. This unique topography offers awe-inspiring landscapes and sweeping views of the neighboring mountains. Renowned for its lush green oases and flourishing orchards, the region is abundant in natural beauty. Within the valleys and ravines of the Sarawat Mountains, there are streams and rivers that serve as vital water sources for the fruit and vegetable plantations in the area. These waterways sustain the thriving agricultural industry of the region. Additionally, the Taif region experiences a desert climate, characterized by scorching temperatures during the summer and relatively mild winters. In the summer season, diurnal temperatures can exceed 40 °C, while in winter, cooler temperatures prevail with average daytime temperatures around 20 °C.
Unlike many other regions in the country, the Taif region of Saudi Arabia receives a comparatively high level of precipitation throughout the year. Particularly during the winter and spring months, the area experiences significant rainfall, averaging around 270 mm annually. The period from November to May witnesses the highest precipitation levels, with average monthly rainfall ranging from 20 to 40 mm. This precipitation plays a crucial role in supporting the local farming industry and the cultivation of roses, which is a prominent commodity in the area.
The region boasts indigenous woodland, consisting of oak, cypress, juniper, and dwarf palm trees. Primarily located within the Sarawat Mountains and encompassing the surroundings of Taif City, these forests contribute to the region’s biodiversity, economy, and tourism industry. It is imperative to safeguard and sustainably manage these forests, as they face multiple human pressures.

3. Materials and Methods

3.1. Database Preparation

3.1.1. SRTM Data and Its Application in GIS Technology

SRTM stands for shuttle radar topography mission, which was a NASA mission that used radar to create a high-resolution digital elevation model (DEM) of the Earth’s surface. The SRTM data are widely used in geospatial analysis and mapping, particularly in remote-sensing and GIS applications. The SRTM data were collected in 2000 using a specially modified radar system on board the space shuttle Endeavour. The radar system was able to penetrate through clouds and vegetation cover to collect elevation data for almost the entire surface of the Earth. The data were processed and used to create a DEM with a horizontal resolution of 30 m and vertical accuracy of around 16 m. SRTM data are available for free download from several sources, such as the United States Geological Survey (USGS) and the National Aeronautics and Space Administration (NASA). The data are stored in raster format, typically as GeoTIFF files, and can be processed using ArcGIS software and other geospatial analysis tools. The digital elevation model (DEM) shown in Figure 2a indicates that the Taif region is dominated by an elevation comprised of 840–1080 m, where the altitude increases in the southern part of the region to reach from 1700 to 2610 m above sea level, characterizing Mount Dhaka, which is located 25 km southwest of Taif and is part of the Hijaz Mountains. It is surrounded by several distinct rural resorts, which you can view from its location above. There is also a natural park with a path for mountaineering.

3.1.2. Slope Map

A slope map, or a slope gradient map, is a thematic map showing the steepness or slope of the terrain in a particular area. It is typically created from a digital elevation model (DEM) that provides information about the elevation and topography of an area. Slope maps are often used in various fields, including geology, geography, and environmental science. They can be used to identify areas that are prone to erosion, landslides, or other types of slope-related hazards. They can also be used to identify areas that are suitable for different types of land use, such as agriculture, forestry, or urban development. The topography of the Taif region is characterized by low slopes from 0 to 5% (Figure 2b), forming a landscape in the form of a wide courtyard paved with tiles. However, the southern part is dominated by high slopes reaching 350%. As a result, a government committee excluded separate sites on the Al-Kar tourist road, which leads to Makkah Al-Mukarramah, from establishing tourism investments through a number of projects to be approved.

3.1.3. Distance-to-River Map

A distance-to-river map is a type of thematic map that shows the distance of a particular location or area from a river or other watercourse. It is typically created using geographic information system (GIS) software, which can analyze the location and geometry of rivers and calculate the distance from a given point or area. Distance to river maps are often used in environmental analysis, land use planning, and flood risk assessment. They can help identify areas that are vulnerable to flooding, erosion, or other water-related hazards, as well as areas that may significantly impact water quality or aquatic habitats. Overall, distance to river maps are useful tools for analyzing the relationship between human activities and aquatic environments in a given area. They can help inform land use planning, conservation efforts, and environmental policy. There are about forty valleys in Taif, and they serve as beautiful recreational parks and gardens, which attract many visitors and tourists from both inside and outside the city throughout the year. Wadi Dhi Ghazala is considered one of the most beautiful amusement parks in the city of Taif in the Arabian Peninsula region. This is where the valley is famous for its picturesque nature that catches the eye and attracts visitors from everywhere. Wadi Al-Shifa is considered one of the most important valleys of the city of Taif and is located at an altitude of 2000 m above sea level (Figure 2c), giving you charming views of the city from above. The valley is famous for including many high mountains, the most famous of which are the tallest mountains in the county of Hijaz, which are Mount Dhaka and Mount Al-Saq, which is famous for cultivating grapes.

3.1.4. Distance-to-Road Map

A distance-to-road map is a type of thematic map that shows the distance of a particular location or area from a road network. It is typically created using GIS software, which can analyze the location and geometry of roads and calculate the distance from a given point or area. Distance to road maps are often used in transportation planning, emergency management, and environmental analysis. They can help identify areas that are isolated or difficult to access, as well as areas that may be impacted by noise pollution or other environmental factors associated with road traffic. The Taif Governorate is rich in many views of the mountain peaks, and there is a large number of buildings and places of an archeological nature. From this standpoint, the Ministry of Transport and Logistics continued to develop the road sector in this governorate until its total length reached 2207 km (Figure 2d). One of the major projects in the Taif Governorate is linking the Al-Sail Al-Kabeer Road with the Taif–Riyadh Expressway, which, upon completion of the project, will contribute to reducing the journey distance for all cars, especially trucks, without the need to enter the city of Taif. One of the important projects in the governorate is completing the implementation of the ring road in the Taif Governorate to link with the Taif Road. It is here to strengthen its local economy and its connection to international and global markets and to support important vital sectors, such as tourism, Hajj, and Umrah.

3.1.5. Topographic Position Index (TPI)

The topographic position index (TPI) is a quantitative measure used in geographic information systems (GISs) and landscape analysis to assess the relative position and elevation of a point within its surrounding topography. It is a calculation that compares the elevation of a specific point to the average elevation of its neighboring points within a defined radius or window. The TPI is derived by subtracting the average elevation of the surrounding points from the elevation of the focal point. The resulting value indicates whether the point is located in a depression, on a ridge, or in a relatively flat area. Positive TPI values typically indicate ridge or elevated positions, while negative values suggest depressions or lower-lying areas. This index is particularly useful in characterizing landforms and terrain features, providing valuable information for various applications, such as land use planning, hydrological modeling, ecological studies, and geomorphological analyses. By analyzing the TPI values across a landscape, researchers and practitioners can identify areas of interest, evaluate landscape heterogeneity, and understand the spatial distribution of landforms and their potential influence on various processes. Figure 3a reveals that negative TPI values were more located in the areas with high altitudes, indicating depressions compared to the surrounding areas that could represent valleys, basin bottoms, or other low-lying areas. However, values ranging between −1.033 and 0.06 (around zero) indicated that a location was at a similar elevation to its surroundings or was relatively flat (Figure 3a).

3.1.6. The Topographic Roughness Index (TRI)

The topographic roughness index (TRI) is a quantitative metric used in geospatial analysis and terrain characterization to assess the complexity and irregularity of a land surface. It provides a measure of the variability in elevation within a specified area, indicating the degree of terrain roughness. The TRI is computed by evaluating the range or standard deviation of elevation values within a defined neighborhood or window surrounding a specific location. It quantifies the vertical differences between neighboring points, reflecting the changes in elevation over a given spatial extent. The TRI is a valuable tool for numerous applications in geology, geomorphology, environmental studies, and landscape analyses. It helps researchers and practitioners understand the spatial patterns of landforms, identify areas with high or low relief, assess the suitability of terrain for various activities (e.g., construction, agriculture, or transportation), and investigate the influence of topographic roughness on hydrological processes, erosion potential, and ecological dynamics. By utilizing the topographic roughness index, analysts can gain insight into the topographic characteristics of a given area, contributing to a more comprehensive understanding of landscape and supporting informed decision-making in diverse fields.
Higher TRI values indicate greater terrain roughness with more pronounced elevation variations, which were observed in the southern region of the Taif region (Figure 3b), while lower values indicate relatively smoother and uniform terrains (Figure 3b).

3.1.7. The Topographic Wetness Index (TWI)

The topographic wetness index (TWI) is a derived geospatial parameter used to quantify and characterize the degree of wetness or soil moisture conditions within a given landscape. The topography-based index combines information about the slope and the accumulation of upslope-contributing areas to assess the potential for water accumulation or saturation in a particular location. The TWI is widely employed in hydrological and environmental studies to understand water movement, soil moisture patterns, and their implications for various ecological processes.
TWI calculation involves computing the natural logarithm of the ratio between the upslope-contributing area and the local slope. The upslope-contributing area represents an area that drains water toward a specific location, considering the accumulation of water from the surrounding terrain. The slope measures the steepness of the land surface at that location. By combining these factors, the TWI provides a quantitative measure of the terrain’s ability to retain or drain water. The TWI is computed with the following equation:
T W I = l n a tan b  
where a is the flow accumulation, and b is the terrain slope.
Lower TWI values indicate areas with higher potential for water drainage, typically associated with steeper slopes and lower-contributing areas, which may result in dry soil conditions. The lower values were more pronounced in the mountain and urban areas (Figure 3c). Conversely, a higher TWI value indicates areas with higher potential for water accumulation, typically associated with lower slopes and higher-contributing areas. These areas often exhibit higher soil moisture content, increased groundwater levels, and the likelihood of wetland formation. Positive values were marked in large areas of the northern part of the Taif region. The results of the TWI can be used for ecosystem services, where green spaces with higher soil moisture offer numerous ecosystem services (Figure 3c). They can help mitigate urban heat island effects, improve air quality, provide habitats for wildlife, and enhance overall aesthetics and recreational opportunities for people.

3.1.8. Hillshades

Hillshades in the field of cartography and geographic representation refers to a technique used to simulate shadow effects on a map or image. This is to represent the areas that are shaded or shielded from natural light, depending on the position of the sun, the time of day, and the topography of the land. Darker shades or lower-intensity values in a Hillshade represent areas that are in shadow or have less direct illumination. Dark shade areas were not observed in the study region (Figure 3d). Higher contrast indicates greater variations in elevation and a more pronounced relief that was more located in the southern part of the Taif region (Figure 3d), as well as various terrain features, such as ridges, valleys, peaks, and depressions. Ridgelines may appear as bright, elongated areas, while valleys and depressions can be represented by darker, concave areas.

3.1.9. LULC Map

Land cover refers to the physical and biological features of the land, such as forests, wetlands, grasslands, or urban areas. Land use and land cover analysis plays a vital role in environmental assessment and resource management. With the advent of remote-sensing technology, satellite imagery has become an invaluable data source for monitoring and understanding land surface dynamics. The European Space Agency’s Sentinel-2 satellite mission, in conjunction with Esri’s geographic information system (GIS) software, offers a powerful combination for conducting comprehensive land use/land cover analysis. This paper explores the integration of Sentinel-2 Level-1C imagery and Esri software to derive high-resolution land use/land cover information at a 10 m spatial resolution. By leveraging the spectral information embedded in Sentinel-2 imagery and the analytical capabilities of Esri software, researchers and environmental practitioners can gain insights into landscape patterns, changes, and trends, thereby supporting informed decision making for sustainable land management and conservation efforts. The findings from this study contribute to the growing body of knowledge on utilizing remote-sensing data and GIS tools for land use/land cover analysis, further bridging the gap between satellite-based observations and on-the-ground environmental assessment. The description of the ESRI Sentinel-2 L2A mission was well-documented by Karra et al. [47], and the images are available at [48]. The results of the LULC classification of the Taif region are represented in Table 1. According to the LULC classification, the green infrastructure and water areas did not exceed 25 km2, the built-up area was equal to 281 km2, and the area of random sites within the cities of Taif, Hawiyah, and Halaka reached 56 km2. The municipality of Taif has finished planning these sites with the aim of limiting their random growth and development by achieving sustainable urban development for urban, environmental, social, and economic elements in these sites. The plan includes an optimal distribution of land uses, public services, and the ideal planning of road networks [49]. The rangeland in the Taif region accounts for 37% (5121 km2) of the total area (Figure 4a and Table 1). As pasture-based animal husbandry provides the living needs of nearly 70% of the Kingdom’s population and the income from livestock is ranked second after oil, for example, the amount of income from the grazing craft is more than SAR 900 million. The Saudi pastures are poor, in general, and large areas of them are in most years almost devoid of vegetation, while other areas have low-density vegetation cover. Likewise, large areas have deteriorated vegetation cover, soil, and biological diversity because of intensive exploitation and agricultural and urban expansion at the expense of the best pastoral areas, and this explains the large area of barren land.

3.1.10. Global Exposure Datasets

Global exposure datasets that incorporate socio-economic factors and capital stock information provide a more comprehensive understanding of the potential impacts of hazards and risks on human populations and economies. These datasets typically combine information on population, economic activities, infrastructure, and assets to assess vulnerability and exposure to various hazards. These datasets provide socio-economic information at a global scale, including income levels, poverty rates, education levels, healthcare access, and other relevant indicators. They help identify vulnerable populations and assess the potential social impacts of hazards [50,51]. The agriculture sector in Saudi Arabia plays an important role in the economy, although it faces challenges due to the country’s arid climate and limited water resources. The government has implemented various initiatives and projects to support the sector and increase employment opportunities. In terms of employment in the agriculture sector, the Saudi government is promoting initiatives to encourage local employment in this field (Figure 4b). These initiatives include providing training programs, financial support, and technical assistance to farmers and agricultural workers. The goal is to reduce the country’s dependence on imported agricultural products and increase self-sufficiency.

3.1.11. Rainfall Data

In this study, a rainfall map was obtained from CHIRPS (Climate Hazards Group infrared precipitation with station) data, which is a high-resolution satellite-based rainfall dataset developed by the Climate Hazards Group at the University of California, Santa Barbara. It combines infrared satellite imagery with ground-based precipitation data to provide accurate and spatially detailed rainfall information on a global scale. CHIRPS utilizes a blend of satellite data from multiple sources, including the Precipitation Estimation from Remotely Sensed Information using Artificial Neural Networks (The PERSIANN system), along with gauge-based rainfall observations. By merging these different data sources, CHIRPS is able to capture both the spatial and temporal variability of rainfall patterns. The dataset is available at various spatial and temporal resolutions of 0.25° × 0.25° pixel and from daily to annual time steps, and it can be downloaded from [52]. CHIRPS data are commonly used in climate research, drought monitoring, hydrological modeling, and agricultural assessments, among other applications. In the Taif region, the annual rainfall ranges between 13 and 58 mm per year (Figure 4c), where the high amount of rainfall is more pronounced in the southern part of the region with the high topographic altitudes.

3.1.12. Wind Speed Data

By combining wind speed data and green space area information, you can evaluate the influence of green spaces on local wind patterns and assess the potential benefits of vegetation in mitigating wind effects. This analysis can be useful for urban planning, landscape design, and environmental studies. Wind speed data were obtained from WorldClimate databases [53]. Wind speed in Taif varies depending on the time of year and specific locations within the region; it is generally characterized by moderate to strong winds. Average wind speeds in Taif can range from 15 to 30 km per hour (9 to 18 miles per hour), with occasional gusts that may exceed 40 km per hour (25 miles per hour). Figure 4d explains the wind speed in the study area in m/s.

3.2. Analytic Hierarchy Process

The analytic hierarchy process (AHP) is a widely used multi-criteria decision-making (MCDM) method that enables decision makers to evaluate multiple criteria and sub-criteria [54] systematically. The AHP is valuable for assessing urban green space (UGS) suitability since it involves weighing various factors like accessibility, proximity to amenities, environmental conditions, and social preferences. The AHP provides a framework to integrate both subjective judgments (e.g., expert opinions and stakeholder preferences) and objective data (e.g., geospatial datasets) into a cohesive decision-making process. This combination of technical analysis and public perception is important for holistic UGS evaluation. The AHP offers a transparent decision-making process, allowing stakeholders to understand how final results are derived. It also promotes consistent decision making, as the method verifies pairwise comparisons for logical consistency.
The AHP is a multi-criteria decision-making technique developed by Thomas L. Saaty in the 1970s [54,55]. The AHP is used to analyze and prioritize complex decision problems where there are multiple criteria and alternatives to consider. The process involves breaking down a complex problem into smaller, more manageable parts and comparing the criteria and alternatives using a pairwise comparison approach.
The AHP involves the following steps:
  • Define the decision problem and identify the criteria and alternatives that need to be considered.
  • Create a hierarchy of criteria and alternatives, with the decision problem at the top level and the criteria and alternatives at the lower levels.
  • Conduct pairwise comparisons of the criteria and alternatives using a numerical scale, typically from 1 to 9, to indicate the relative importance or preference of one criterion or alternative over another (Table 2). The scale is typically presented as a set of pairwise comparison matrices. In these matrices, decision makers compare the elements of a given level with respect to a specific criterion and assign values from the scale to represent relative importance or preference. For example, a decision maker may assess that alternative A is three times more important than alternative B, so they would assign a value of 3 to the pair (A, B) in the comparison matrix.
  • Calculate the priority or weight of each criterion and alternative based on the pairwise comparison results.
  • Perform a consistency check to ensure that the pairwise comparison results are reliable and consistent with the decision maker’s preferences. The AHP uses a consistency ratio (CR) to determine whether the level of consistency in the pairwise comparisons is acceptable. The CR compares the coherence index (CI) value to an expected or random consistency level based on the size of the matrix.
The CI is given using the following equation.
C I = λ m a x n n 1
The RC is obtained via dividing the CI by a random consistency index (RI) value, which is derived from randomly generated matrices of the same size. The RC is given as follows:
R C = C I C A 0.1
If the RC value is below a certain threshold (typically 0.1), the judgments are considered to be sufficiently consistent. Table 3 presents the RC index for different numbers of criteria forming the calculation matrix. Typically, if the CR is below a certain threshold (e.g., 0.1), the judgments are considered sufficiently consistent. For more detail about AHP implantation, the reader is invited to read the papers of Refs. [40,41,42,43,44,45,46,47,48,49,50,51,52,53,54,55,56]. The flowchart of Figure 5 illustrates the various stages and databases used for UGS suitability.
While the AHP is a valuable multi-criterion decision-making (MCDM) technique, it also has its limitations and challenges:
  • Subjectivity in pairwise comparisons: The AHP relies on subjective pairwise comparisons to establish the importance of criteria. Inconsistent judgments may lead to biased results.
  • Sensitivity to input weights: The outcome of the AHP is sensitive to criteria weights. Small changes in weights can significantly affect results, requiring careful validation and justification.
  • Limited number of criteria: Dealing with numerous criteria in the AHP becomes complex and time-consuming due to the exponential growth of pairwise comparisons.
  • Dependence on expertise: The AHP’s success depends on expert knowledge, and biases or lack of domain expertise can affect the quality of the results.
  • Data uncertainty: Uncertain or imprecise data used in the AHP can impact the reliability of the final decision.

3.3. Weighted Overlay Model

The weighted overlay technique in a geographic information system (GIS) facilitates analysis and decision-making using spatial data layers. Also known as weighted sum or weighted combination, this method combines multiple raster layers, assigns weights to each layer based on importance, and generates an aggregated output. The key steps in ArcGIS weighted overlay are as follows:
  • Input data preparation: Start by gathering and preparing the different raster layers that represent various criteria or factors in the analysis. In this study, the ten layers above-mentioned were selected for UGS suitability.
  • Weight assignment: Next, assign weights to each of the input raster layers based on the MCMA-AHP. These weights reflect the relative importance of each criterion in the analysis. The weights are typically represented as numerical values, and they should sum up to 1 or 100% to ensure proper normalization.
  • Data normalization: Before performing the overlay, it is essential to normalize the data. Normalization is the process of rescaling the input data values to a common scale, often ranging from 0 to 1. This step ensures that different criteria with varying units or value ranges do not disproportionately influence the final result.
  • Weighted sum calculation: The weighted overlay tool takes the normalized raster layers and their corresponding weights as input. It then performs a pixel-by-pixel weighted sum for each layer, multiplying the normalized values by their respective weights and adding them together. This calculation produces a new raster output that represents the combination of the input layers, taking into account their relative importance as specified by the weights.
  • Interpretation of results: The output raster generated by the weighted overlay process represents the overall suitability or desirability of different locations based on the defined criteria and their assigned weights. High values in the resulting raster indicate areas that satisfy multiple favorable criteria, while low values indicate areas that may not meet the desired conditions.
Weighted overlay is widely used in various fields, including urban planning, environmental analysis, site selection, and processes involving multiple factors that influence a specific outcome. It helps users visualize and prioritize suitable areas, aiding in more informed spatial planning and decision-making. However, the effective application of weighted overlay requires understanding its key limitations:
  • Scale and unit compatibility: The data used in weighted overlay must have compatible scales and units. Incompatibility can lead to misleading results.
  • Normalization issues: Proper data normalization is crucial in weighted overlay, and the method chosen can affect the final output. Incorrect normalization may result in distorted results.
  • Data resolution and accuracy: The resolution and accuracy of input raster layers influence weighted overlay outcomes. Low-quality data can reduce the reliability of the final output.
  • Uncertainty in weights: Weight assignments in weighted overlay may be subjective and uncertain, potentially influencing the analysis results.
  • Data interpolation: Weighted overlay involves interpolating values between raster cells, introducing uncertainty, particularly if the original data are collected using different methods or scales.
  • Lack of consideration for spatial relationships: Weighted overlay treats each criterion independently, neglecting spatial interactions and dependencies. Complex spatial patterns may be overlooked.

4. Results

This section presents the study’s findings, which aimed to assess the criteria and factors influencing the selection of suitable locations for green infrastructure (GI) implementation. This analysis is crucial for effective urban planning and the development of sustainable and livable cities. Table 4, Table 5 and Table 6 provide a comprehensive understanding of the pairwise comparison matrix and its analysis. Table 4 displays a pairwise comparison matrix for the main criteria in the analysis. The matrix compares each criterion with every other criterion using a scale of relative importance. The values in the matrix represent the preference or importance of one criterion over another, with higher values indicating greater preference. The criteria are represented by their respective IDs: TP (topographic position index), SL (slope), TW (topographic wetness index), DW (distance to water), DR (distance to road), RF (rainfall), WS (wind speed), LC (land use/land change), TR (topographic roughness index), and EA (employment in the agriculture sector). For example, in Table 4, the topographic position index (TP) was assigned a value of 1.00 when compared to itself, indicating equal importance. However, TP was given a higher value of 3.00 when compared to the topographic wetness index (TW), suggesting a relatively higher preference for TP over TW. Similarly, TP was assigned a lower value of 0.33 when compared to distance to water (DW), indicating a lower preference for TP compared to DW.
Table 5 provides a standardized matrix for the main criteria. This matrix was derived from the pairwise comparison matrix in Table 4 and represents the relative weights of the criteria. The values in this matrix were normalized to ensure that the sum of weights for each criterion was equal to 1.00. For example, topographic position index (TP) had a weight of 0.04, indicating that it carried 4% of the overall weight in the analysis. On the other hand, employment in the agriculture sector (EA) had a weight of 0.11, suggesting that it carried a relatively higher weight of 11%.
The values in Table 6 represent the calculation of the coherence index (CI) and random consistency (CR) for the pairwise comparison matrix. These indices were used to assess the consistency and reliability of the judgments made in the analytic hierarchy process (AHP). Table 7 summarizes the parameters derived from Table 6, including the count, lambda max, CI, CR, and constant value.
These were calculated by summing the values in each column of the pairwise comparison matrix and dividing them by the sum of the corresponding values in the row. The random consistency (CR) was calculated by dividing the coherence index by the random index, which was determined based on the size of the matrix.
Based on the findings, it can be concluded that the judgments in this AHP analysis are relatively consistent since the CR value (0.097) was less than the constant value (1.490). However, it is important to note that the specific interpretations and implications of the criteria and their relative weights cannot be determined without further context or additional information.
Furthermore, based on Figure 6, the most influential criteria in the selection of suitable locations for green infrastructure implementation were distance to water, distance to road, rainfall, and land use/land change (LULC), contributing 14.5%, 15.5%, 14.2%, and 17.7%, respectively. Employment in the agriculture sector also played a significant role, contributing 12.6%. Experts and participants believed that areas with crop land and rangeland (LULC) and a high concentration of employment in the agricultural sector were extremely suitable for green infrastructure. The presence of employment in the agricultural sector in these areas eliminates the need for additional expenses related to transportation, food, and housing for workers, and their knowledge can be utilized for the creation of green spaces. Additionally, green spaces located near roads offer improved accessibility and connectivity, making them more attractive to visitors. These areas gain increased visibility and exposure to the public, serving as a visual reminder of the importance of nature and green areas in urban settings. In the Taif region, most road lines are situated in the southern region.
Additionally, as stated by Linh et al. [56], the scoring of criteria attributes involve evaluating and rating the feasibility of each location for green infrastructure. The slope map received a high score for slopes ranging between 4.23% and 16.9%. Positive values of the topographic position index (TPI) between 0.0667 and 2.27, as well as of 2.28–112, were given a score of two out of five. Topographic wetness index (TWI) received scores of four for classes ranging from 7.51 to 9.72 and scores of three for classes ranging from 9.73 to 12.5. Distance to water received high scores of four and five for distances of 0.199–0.34 km and 0.35–0.469 km, respectively. As reported by Mobarak et al. [40], distances were chosen considering safety aspects such as the prevention of accidents, like drowning and falls in wadis and valleys. The sub-criteria for rainfall received higher scores as the amount of rainfall increased, while the scores for the wind speed sub-criteria decreased as the wind speed increased. Sub-criteria with a score of 1 indicated regions that were unsuitable for GI planning, as shown in Table 8.
Figure 7 and Figure 8 provide an overview of the results regarding the suitability of urban green stormwater infrastructure (UGSI) in the Al Taif region. Figure 7 illustrates the distribution of suitability in terms of area and percentage, while Figure 8 categorizes suitability into four classifications: poor, fair, good, and excellent.
According to Figure 7, the Al Taif region had 1.3% of its total area (175 km2) classified as “poor suitability.” This indicated that these areas were not suitable for UGSI development. The largest portion of the region, accounting for 56.4% or 7595 km2, fell under the category of “fair suitability.” These areas had moderate suitability for UGSI implementation and were mainly concentrated in the northern part of the study area.
The study findings suggest that the central and northeastern parts of the Taif region were predominantly characterized by large, barren land areas, which were not suitable for the development of UGSI. These areas might have limitations or constraints that make them unsuitable for implementing green stormwater infrastructure.
On the other hand, the study identified an estimated 3.6% (482 km2) of the region as having “excellent suitability” for planning UGSI. These areas were considered highly suitable for implementing green stormwater infrastructure. Additionally, the study indicated that 38.8% (5226 km2) of the region fell under the category of “good suitability,” indicating relatively high suitability for UGSI. The good and excellent areas for UGSI implementation were primarily concentrated in the southwestern part of the Taif region.
These findings provide valuable insights into the spatial distribution of suitability for UGSI implementation in the Al Taif region, highlighting areas with poor, fair, good, and excellent suitability. This information can assist urban planners and decision makers in identifying suitable locations for implementing green stormwater infrastructure to enhance sustainable development and livability in the region.

5. Discussion

The findings of this study, which identified optimal areas for green infrastructure planning in the southern Taif region, align with the current geographic distribution of green spaces in Al Taif. The best areas for green infrastructure planning were identified and recommended in the southern part of the Taif region, which is home to Taif City. The forests of Taif attract lovers of picturesque nature, and the forests in Al-Shifa, Al-Hada, and the southern centers provide spacious green spaces through which visitors to the governorate can enjoy the natural ingredients in the distinctive environment of Taif [57]. In Bani Malik, the forests reach their maximum density at a rate of up to 70 percent in the areas of Jabal Al-Sar, Sida, Al-Wahl, Awqa, Jabal Arwan, and Aqabat Qahis. The environment of the high mountains is adorned with juniper trees that grow at high altitudes and are helped by rain to flourish and grow next to sherbin trees [58].
Saudi Arabia is one of the countries that pay great attention to the development of green tourism and environmental sustainability. It has made several efforts and initiatives in this field, including Vision 2030. The country’s Vision 2030 aims to diversify the economy, develop the tourism sector, and enhance environmental sustainability. It entails a clear plan of action to promote green tourism and protect the environment and natural resources, like Al-Ula and NEOM. These projects focus on developing coastal, mountainous, and desert areas in ways that preserve the environment and ensure the sustainability of natural resources.
Therefore, the Kingdom of Saudi Arabia places significant emphasis on scientific research related to green environment projects. Among these studies, Addas and Maghrabi [59] underscored the importance of urban parks for people’s mental and physical well-being, as they provide multiple ecosystem services and direct/indirect benefits. These results contribute to understanding the significance of urban parks as green spaces, informing actions to improve both the quality and the volume of urban green areas in cities across Saudi Arabia. Previous studies have been limited in their spatial scope, focusing on small neighborhoods or individual parks. Addas [60] examined five parks in Jeddah, finding that they were used mostly for socializing, relaxation, exercise, and family activities, with seasonal variations in usage. The research highlighted the influence of socio-demographic factors and discrepancies in management strategies. In another Jeddah study, Khalil [61] revealed that the city’s average green space per inhabitant was only 0.9 m2, with over 70% needing to travel over 500 m to access green areas. Meeting the UN standard of 30 m2 per capita would require substantial green space expansion in Jeddah. Furthermore, Addas [62] analyzed green space distribution across Saudi cities, discovering six primary urban-greening strategies backed by local evidence. The study found that Dammam had the largest per capita area at 5.4 m2, followed by Riyadh at 1.18 m2 and Jeddah at 0.5 m2. Although green spaces are used for leisure and climate regulation, 40% of those surveyed did not utilize them due to issues related to availability, access, design, management, and safety.
Maghrabi et al. [42] highlighted the significance of green spaces as nature-based solutions and their potential in mitigating and adapting to climate change in Saudi Arabian urban environments. Al-Sulbi and Alghanem’s study [63] emphasized the importance of implementing a balanced approach to managing water resources for landscape irrigation, taking into account factors such as plant growth and seasonal variations. The Imam Abdulrahman bin Faisal University Eastern Campus can maintain high-quality green spaces while optimizing resource utilization by adopting this approach.
Additionally, Mobarak et al. [40] focused on assessing and mapping green infrastructure (GI) in the Al Baha region of Saudi Arabia, utilizing GIS and the AHP to analyze and map GI suitability. The study identified areas with excellent and good suitability for GI, which were primarily concentrated in the central part of the Al Baha region, including Al Bahah, Elmandaq, and Alatawlah, and the central part of Buljurshi. Conversely, the study deemed the southern part of the area unsuitable for GI planning due to its large expanse of barren land and sand.
In summary, this study provides a visual representation of UGS (urban green space) suitability across the Taif region. This map can serve as a valuable tool for urban planners and stakeholders, aiding in the identification of suitable areas for future UGS planning and development. In comparison to previous research, this study indicated that UGSI (urban green space index) suitability could be obtained from four criteria, such as distance to water, distance to roads, rainfall, and LULC. The study underscores the visual and awareness aspects of UGS planning, acknowledging the role of green spaces as visual reminders of nature’s value in urban environments. This perspective can influence decision makers to prioritize UGS development for its broader social and environmental benefits.

6. Conclusions

In this study, a comprehensive approach was taken to assess and identify the suitability of urban green spaces (UGSs) in the Taif region of Saudi Arabia. The integration of various morphologic, topographic, climatic, and land use/land change (LULC) maps into a geographic information system (GIS) combined with a multiple-criteria decision-analysis-based analytic hierarchy process (AHP) provided a robust framework for the evaluation.
The results showed that the criteria of distance to water, distance to road, rainfall, and LULC were the most influential in determining the suitability of UGS. These criteria accounted for significant weight contributions, with distance to road being the most influential criterion. This finding suggests that green spaces located near roads can benefit from improved accessibility and visibility, making them more attractive to the public.
The study revealed that most of the Taif region (56.4% of the total area) exhibited fair suitability for urban green space (UGS) development. In contrast, the central and northeastern parts contained large swaths of barren land unsuitable for UGS planning. The southwestern portion of Taif showed the highest potential, with 38.8% of the total area classified as good suitability and 3.6% as excellent suitability for future UGS development.
Furthermore, the study provided specific characteristics and classifications for each criterion. For instance, the slope was divided into five classes, with the range from 4.23% to 16.9% rated as the most suitable for UGS development. Similarly, distance to water, distance to road, rainfall, and wind speed were categorized into different classes, with specific thresholds indicating suitability or unsuitability for UGS planning.
Overall, the integrated approach used in this study provides valuable insights into the suitability of UGS in the Taif region. The findings underscore the importance of considering topography, accessibility, climate, and other key factors in sustainable development decision making. These findings can serve as a guiding tool for decision makers to optimize the use of human and natural resources, fostering the creation of green spaces that align with the needs and preferences of the local population. However, there are limitations to the study’s scope. Focusing solely on Taif means that findings may not apply broadly across Saudi Arabia’s diverse regions and cities. In addition, the analysis did not account for future changes in environment, land use, and development, restricting insights into evolving scenarios.
To address these limitations, future studies could incorporate expanded criteria, like soil quality, biodiversity, cultural significance, and community preferences, for a more holistic evaluation. Furthermore, public participation from local stakeholders may reveal valuable perspectives on needs and aspirations.

Author Contributions

S.A.W., B.Z., A.E., M.A. and Y.J.W. conceived the framework of this research; processed the data; designed the experiments, plots, and map preparation; validated the processing results; and wrote the manuscript. N.B., A.A.A., S.I.M.A.E., C.A.G.S. and A.A.M. gave feedback on the written manuscript and helped to analyze and edit the manuscript for proper English language, grammar, punctuation, spelling, and technical improvements. All authors have read and agreed to the published version of the manuscript.

Funding

This research was funded by Deanship of Scientific Research, Taif University, for funding this work.

Data Availability Statement

The data that support the findings of this study are available from the corresponding author (Bilel Zerouali) upon reasonable request.

Acknowledgments

The researchers would like to acknowledge the Deanship of Scientific Research, Taif University, for funding this work. The authors appreciate the Fundamental Research Funds provided by the Kyoto University of Advanced Science.

Conflicts of Interest

The authors declare no conflict of interest.

References

  1. Zerouali, B.; Elbeltagi, A.; Al-Ansari, N.; Abda, Z.; Chettih, M.; Santos, C.A.G.; Boukhari, S.; Araibia, A.S. Improving the Visualization of Rainfall Trends Using Various Innovative Trend Methodologies with Time–Frequency-Based Methods. Appl. Water Sci. 2022, 12, 207. [Google Scholar] [CrossRef]
  2. Anwar, S.A.; Srivastava, A.; Bilel, Z. On the Role of Land-Surface Hydrology Schemes in Simulating the Daily Maximum and Minimum Air Temperatures of Australia Using a Regional Climate Model (RegCM4). J. Water Clim. Chang. 2023, 14, 989–1011. [Google Scholar] [CrossRef]
  3. Jayakrishnan, K.U.; Bala, G.; Cao, L.; Caldeira, K. Contrasting Climate and Carbon-Cycle Consequences of Fossil-Fuel Use versus Deforestation Disturbance. Environ. Res. Lett. 2022, 17, 064020. [Google Scholar] [CrossRef]
  4. Almaliki, A.H.; Zerouali, B.; Santos, C.A.G.; Almaliki, A.A.; da Silva, R.M.; Ghoneim, S.S.; Ali, E. Assessing coastal vulnerability and land use to sea level rise in Jeddah province, Kingdom of Saudi Arabia. Heliyon 2023, 9, e18508. [Google Scholar] [CrossRef]
  5. De Azevedo Lacerda, L.I.; Da Silveira, J.F.; Santos, C.A.G.; Da Silva, R.M.; Silva, A.M.; Nascimento, T.M.T.D.; Ribeiro, E.L.; De Freitas, P.S.L. Urban Forest Loss Using a GIS-Based Approach and Instruments for Integrated Urban Planning: A Case Study of João Pessoa, Brazil. J. Geogr. Sci. 2021, 31, 1529–1553. [Google Scholar] [CrossRef]
  6. Zerouali, B.; Santos, C.A.G.; Nascimento, T.V.M.D.; Da Silva, R.M. A Cloud-Integrated GIS for Forest Cover Loss and Land Use Change Monitoring Using Statistical Methods and Geospatial Technology over Northern Algeria. J. Environ. Manag. 2023, 341, 118029. [Google Scholar] [CrossRef]
  7. Elmqvist, T.; Setälä, H.; Handel, S.N.; Van Der Ploeg, S.; Aronson, J.; Blignaut, J.N.; Gómez-Baggethun, E.; Nowak, D.J.; Kronenberg, J.; De Groot, R. Benefits of Restoring Ecosystem Services in Urban Areas. Curr. Opin. Environ. Sustain. 2015, 14, 101–108. [Google Scholar] [CrossRef]
  8. De Sousa, C.A.F.; Da Silveira, J.A.R.; Santos, C.A.G.; Da Silva, R.M. A Methodological Proposal to Analyze Urban Sprawl, Negative Environmental Impacts, and Land Degradation in the Case of João Pessoa City (Brazil) between 1991 and 2018. Environ. Monit. Assess. 2023, 195, 738. [Google Scholar] [CrossRef]
  9. Ring, Z.; Damyanovic, D.; Reinwald, F. Green and Open Space Factor Vienna: A Steering and Evaluation Tool for Urban Green Infrastructure. Urban. For. Urban. Green. 2021, 62, 127131. [Google Scholar] [CrossRef]
  10. Cervero, R. Integration of urban transport and urban planning. In The Challenge of Urban Government: Policies and Practices; World Bank Publications: Washington, DC, USA, 2001; pp. 407–427. [Google Scholar]
  11. Wan, C.; Su, S. Neighborhood Housing Deprivation and Public Health: Theoretical Linkage, Empirical Evidence, and Implications for Urban Planning. Habitat Int. 2016, 57, 11–23. [Google Scholar] [CrossRef]
  12. Maruna, M.; Rodić, D.M.; Čolić, R. Remodelling Urban Planning Education for Sustainable Development: The Case of Serbia. Int. J. Sustain. High. Educ. 2018, 19, 658–680. [Google Scholar] [CrossRef]
  13. De Souza, E.; Silva, R.A.; Da Silva, R.M.; De Freitas, A.F.; Santos, J.A.F.D.; Santos, C.A.G.; De Lima, E.M.M. Thermal Comfort Conditions at Microclimate Scale and Surface Urban Heat Island in a Tropical City: A Study on João Pessoa City, Brazil. Int. J. Biometeorol. 2022, 66, 1079–1093. [Google Scholar] [CrossRef]
  14. Wong, Y.J.; Shimizu, Y.; He, K.; Nik Sulaiman, N.M. Comparison among different ASEAN water quality indices for the assessment of the spatial variation of surface water quality in the Selangor river basin, Malaysia. Environ. Monit. Assess. 2020, 19210, 644. [Google Scholar] [CrossRef]
  15. García-García, M.L.; Christien, L.; García-Escalona, E.C.; González-García, C. Sensitivity of Green Spaces to the Process of Urban Planning. Three Case Studies of Madrid (Spain). Cities 2020, 100, 102655. [Google Scholar] [CrossRef]
  16. Asibey, M.O.; King, R.; Lykke, A.M.; Inkoom, D.K.B. Urban Planning Trends on E-Waste Management in Ghanaian Cities. Cities 2021, 108, 102943. [Google Scholar] [CrossRef]
  17. Deng, X.; Huang, J.; Rozelle, S.; Uchida, E. Economic Growth and the Expansion of Urban Land in China. Urban Stud. 2009, 47, 813–843. [Google Scholar] [CrossRef]
  18. Dubou, G.; Bichueti, R.S.; Da Costa, C.E.; Gomes, C.M.; Kneipp, J.M.; Kruglianskas, I. Creating Favorable Local Context for Entrepreneurship: The Importance of Sustainable Urban Development in Florianópolis, SC, Brazil. Sustainability 2022, 14, 10132. [Google Scholar] [CrossRef]
  19. Turner, S.; Nurlu, E.; Tonyaloğlu, E.E.; Erdoğan, N.; Jackson, M.; Varinlioğlu, G.; Tunalı, S.P. Cultural Heritage in Landscape: Planning for Development in Turkey. In Landscape Archaeology in the Near East: Approaches, Methods and Case Studies; Archaeopress Publishing Ltd.: Stroud, UK, 2023; pp. 96–109. [Google Scholar]
  20. Beatley, T.; Beatley, T. Singapore City, Singapore: City in a Garden. In Handbook of Biophilic City Planning and Design; Springer: Berlin/Heidelberg, Germany, 2016; pp. 51–66. [Google Scholar]
  21. Schröpfer, T.; Menz, S.; Yeo, M.T. From garden city to city in a garden and beyond. In Dense and Green Building Typologies: Research, Policy and Practice Perspectives; Springer: Berlin/Heidelberg, Germany, 2019; pp. 21–25. [Google Scholar]
  22. Grossman, M. Satoyama. The Traditional Rural Landscape of Japan. Landsc. Urban Plan. 2004, 68, 139–141. [Google Scholar] [CrossRef]
  23. Shimpo, N. Urban Ecological Life in a Metropolitan Area—An Insight from Satoyama Conservation Activities in the Greater Tokyo Area. Landsc. Ecol. Eng. 2021, 18, 109–119. [Google Scholar] [CrossRef]
  24. Runkle, J.D.; Matthews, J.L.; Sparks, L.; McNicholas, L.; Sugg, M.M. Racial and Ethnic Disparities in Pregnancy Complications and the Protective Role of Greenspace: A Retrospective Birth Cohort Study. Sci. Total Environ. 2021, 808, 152145. [Google Scholar] [CrossRef]
  25. Vidova, J. Green Cities, the Internet of Things as a Prerequisite for Sustainability. In Economic and Social Development: Book of Proceedings; Victoria University: Footscray, Australia, 2022; pp. 53–60. [Google Scholar]
  26. Bell, S.; Westley, M.S.; Lovell, R.; Wheeler, B.W. Everyday Green Space and Experienced Well-Being: The Significance of Wildlife Encounters. Landsc. Res. 2017, 43, 8–19. [Google Scholar] [CrossRef]
  27. Reyes-Riveros, R.; Altamirano, A.; De La Barrera, F.; Rozas-Vásquez, D.; Vieli, L.; Benayas, J.M.R. Linking Public Urban Green Spaces and Human Well-Being: A Systematic Review. Urban For. Urban Green. 2021, 61, 127105. [Google Scholar] [CrossRef]
  28. Jabbar, M.; Yusoff, M.M.; Shafie, A. Assessing the Role of Urban Green Spaces for Human Well-Being: A Systematic Review. GeoJournal 2021, 87, 4405–4423. [Google Scholar] [CrossRef]
  29. Lencastre, M.P.A.; Vidal, D.G.; Estrada, R.; Barros, N.; Maia, R.L.; Farinha-Marques, P. The Biophilia Hypothesis Explored: Regenerative Urban Green Spaces and Well-Being in a Portuguese Sample. Int. J. Environ. Stud. 2022, 1–15. [Google Scholar] [CrossRef]
  30. Papastergiou, E.; Latinopoulos, D.; Evdou, M.; Kalogeresis, A. Exploring Associations between Subjective Well-Being and Non-Market Values When Used in the Evaluation of Urban Green Spaces: A Scoping Review. Land 2023, 12, 700. [Google Scholar] [CrossRef]
  31. Zhang, J.; Feng, X.; Shi, W.; Cui, J.; Peng, J.; Lei, L.; Zhang, J.; Astell-Burt, T.; Jiang, Y.; Ma, J. Health Promoting Green Infrastructure Associated with Green Space Visitation. Urban For. Urban Green. 2021, 64, 127237. [Google Scholar] [CrossRef]
  32. Rasidi, M.H.; Jamirsah, N.; Said, I. Urban Green Space Design Affects Urban Residents’ Social Interaction. Procedia Soc. Behav. Sci. 2012, 68, 464–480. [Google Scholar] [CrossRef]
  33. WHO. Urban Green Spaces and Health; WHO Regional Office for Europe: Copenhagen, Denmark, 2016. [Google Scholar]
  34. Porcherie, M.; Linn, N.; Gall, A.R.L.; Thomas, M.-F.; Faure, E.; Rican, S.; Simos, J.; Cantoreggi, N.; Vaillant, Z.; Cambon, L.; et al. Relationship between Urban Green Spaces and Cancer: A Scoping Review. Int. J. Environ. Res. Public Health 2021, 18, 1751. [Google Scholar] [CrossRef] [PubMed]
  35. Kwon, O.-H.; Hong, I.; Yang, J.; Wohn, D.Y.; Jung, W.-S.; Cha, M. Urban Green Space and Happiness in Developed Countries. EPJ Data Sci. 2021, 10, 28. [Google Scholar] [CrossRef]
  36. Kondo, M.C.; Fluehr, J.J.; McKeon, T.A.; Branas, C.C. Urban Green Space and Its Impact on Human Health. Int. J. Environ. Res. Public Health 2018, 15, 445. [Google Scholar] [CrossRef]
  37. Mensah, C.A. Urban Green Spaces in Africa: Nature and Challenges. Int. J. Ecosyst. 2014, 4, 1–11. [Google Scholar]
  38. Girma, Y.; Terefe, H.; Pauleit, S.; Kindu, M. Urban Green Infrastructure Planning in Ethiopia: The Case of Emerging Towns of Oromia Special Zone Surrounding Finfinne. J. Urban Manag. 2019, 8, 75–88. [Google Scholar] [CrossRef]
  39. Grand, S.; Wolff, K. Assessing Saudi Vision 2030: A 2020 Review; Atlantic Council: Wshington, DC, USA, 2020; Volume 17. [Google Scholar]
  40. Mobarak, B.; Shrahily, R.; Alsharif, M.A.; Alzandi, A.A. Assessing Green Infrastructures Using GIS and the Multi-Criteria Decision-Making Method: The Case of the Al Baha Region (Saudi Arabia). Forests 2022, 13, 2013. [Google Scholar] [CrossRef]
  41. Addas, A.; Maghrabi, A. A Proposed Planning Concept for Public Open Space Provision in Saudi Arabia: A Study of Three Saudi Cities. Int. J. Environ. Res. Public Health 2020, 17, 5970. [Google Scholar] [CrossRef]
  42. Maghrabi, A.; Alyamani, A.; Addas, A. Exploring Pattern of Green Spaces (GSs) and Their Impact on Climatic Change Mitigation and Adaptation Strategies: Evidence from a Saudi Arabian City. Forests 2021, 12, 629. [Google Scholar] [CrossRef]
  43. Alshuwaikhat, H.M.; Adenle, Y.A.; Almuhaidib, T. A Lifecycle-Based Smart Sustainable City Strategic Framework for Realizing Smart and Sustainability Initiatives in Riyadh City. Sustainability 2022, 14, 8240. [Google Scholar] [CrossRef]
  44. Yehia, E.F.; Alzahrani, H.J.M.; Reid, D.; Ali, M.A. Tourism, National Identity, and the Images on Postage Stamps: The Case of Saudi Arabia. J. Tour. Hist. 2022, 14, 70–102. [Google Scholar] [CrossRef]
  45. Abuhjeeleh, M. Rethinking tourism in Saudi Arabia: Royal vision 2030 perspective. Afr. J. Hosp. Tour. Leis. 2019, 8, 1–16. [Google Scholar]
  46. Alrawaf, T.I.; Abubakar, I.R.; Alshabibi, N.M.; Al-Matar, K.M.; Dano, U.L.; Elhadi, E.M.A.; Al-Odah, M.A. The distribution of ecotourism activities and potential consequences for the Saudi desert ecosystem. J. Arid. Environ. 2023, 213, 104950. [Google Scholar] [CrossRef]
  47. Karra, K.; Kontgis, C.; Statman-Weil, Z.; Mazzariello, J.C.; Mathis, M.M.; Brumby, S.P. Global Land Use / Land Cover with Sentinel 2 and Deep Learning. In Proceedings of the 2021 IEEE International Geoscience and Remote Sensing Symposium IGARSS, Brussels, Belgium, 11–16 July 2021. [Google Scholar]
  48. Esri | Sentinel-2 Land Cover Explorer. Available online: https://livingatlas.arcgis.com/landcoverexplorer (accessed on 5 April 2023).
  49. Besieging the Slums of Taif by Planning 30 Neighborhoods and Villages and Addressing Development Obstacles. Available online: https://www.alriyadh.com/308938 (accessed on 5 April 2023).
  50. De Bono, A.; Chatenoux, B. A Global Exposure Model for GAR 2015; UNEP-GRID, GAR: Geneva, Switzerland, 2015. [Google Scholar]
  51. Pesaresi, M.; Ehrlich, D.; Ferri, S.; Florczyk, A.; Freire, S.; Haag, F.; Soille, P. Global human settlement analysis for disaster risk reduction. Int. Arch. Photogramm. Remote Sens. Spat. Inf. Sci. ISPRS Arch. 2015, 7, 837–843. [Google Scholar] [CrossRef]
  52. Climate Hazards Group InfraRed Precipitation with Station. Available online: https://chrsdata.eng.uci.edu/ (accessed on 5 March 2023).
  53. World Climate Data. Available online: http://www.worldclimate.com (accessed on 5 March 2023).
  54. Saaty, T.L. The Analytic Hierarchy Process; Mc-Graw Hill: New York, NY, USA, 1980. [Google Scholar]
  55. Saaty, R.W. The analytic hierarchy process—What it is and how it is used. Mathematical 1987, 9, 161–176. [Google Scholar]
  56. Linh, N.H.K.; Tung, P.G.; Chuong, H.V.; Ngoc, N.B.; Phuong, T.T. The Application of Geographical Information Systems and the Analytic Hierarchy Process in Selecting Sustainable Areas for Urban Green Spaces: A Case Study in Hue City, Vietnam. Climate 2022, 10, 82. [Google Scholar] [CrossRef]
  57. Taif Governorate Forests, in the Service of Home Tourism. Available online: https://www.al-jazirah.com/2001/20010711/ia28.htm (accessed on 5 March 2023).
  58. Tree Forests in Taif Attract Nature Lovers and Provide Green Spaces. Available online: https://www.alriyadh.com/847967 (accessed on 5 March 2023).
  59. Addas, A.; Maghrabi, A. How did the COVID-19 pandemic impact urban green spaces? A multi-scale assessment of Jeddah megacity (Saudi Arabia). Urban For. Urban Green. 2022, 69, 127493. [Google Scholar]
  60. Al-Addas, A. Exploring the pattern of use and accessibility of urban green spaces: Evidence from a coastal desert megacity in Saudi Arabia. Environ. Sci. Pollut. Res. 2022, 29, 55757–55774. [Google Scholar] [CrossRef]
  61. Khalil, R.; Arabia, S. Quantitative Evaluation of Distribution and Accessibility of Urban Green Spaces (Case Study: City of Jeddah). Int. J. Geomat. Geosci. 2014, 4, 526–535. [Google Scholar]
  62. Addas, A.; Maghrabi, A. Role of Urban Greening Strategies for Environmental Sustainability—A Review and Assessment in the Context of Saudi Arabian Megacities. Sustainability 2021, 13, 6457. [Google Scholar] [CrossRef]
  63. Sulbi, A.O.; Alghanem, A.A. Synchronous management of public green spaces: The case of Imam Abdulrahman bin Faisal University’s eastern campus–Dammam, Saudi Arabia. Ain Shams Eng. J. 2022, 13, 101605. [Google Scholar]
Figure 1. 3D map representation of a digital elevation model (DEM) of the Taif region.
Water 15 03031 g001
Figure 2. A multi-layered perspective: mapping DEM (a), slope (b), road distance (c), and river distance (d).
Water 15 03031 g002
Figure 3. Visualizing terrain: (a) TPI, (b) TRI, (c) TWI, and (d) hillshades maps.
Water 15 03031 g003
Figure 4. Visualizing key factors: (a) LULC, (b) employment in the agriculture sector, (c) rainfall, and (d) wind speed maps.
Water 15 03031 g004
Figure 5. Flowchart used for UGS suitability.
Water 15 03031 g005
Figure 6. Weights as percentages for each criterion used in UGS suitability analysis.
Water 15 03031 g006
Figure 7. Area in (a) (km2) and in (b) percentage (%) of the different classes of GI suitable areas in Al Taif region.
Water 15 03031 g007
Figure 8. Suitability map for GI of Al Taif region.
Water 15 03031 g008
Table 1. LULC classes of the Taif region.
Esri IDClassesNumber of PixelsArea (%)Area (km2)
11Water15,380.000.0040.49
22Trees2700.000.0010.09
34Flooded vegetation2258.000.0010.07
45Crops751,334.000.1724.18
57Built Area8,744,051.002.03281.41
68Bare ground261,381,098.0060.788412.13
711Rangeland159,138,513.0037.015121.62
Table 2. Scale of comparison.
Importance IntensityDescriptionJustification
1Equal significanceTwo criteria contribute similarly to the objective
3Moderate significanceJudgment and experience slightly favor one criterion over another
5Strong significanceJudgment and experience strongly favor one criterion over another
7Very strong significanceOne criterion is preferred very strongly over another; dominance is confirmed in practice
9Extreme significanceThe criterion preferred over another is of the highest possible order of affirmation
Table 3. Values of random consistency (RC) according to the order of the matrix (Saaty’s CR values).
Size of Matrix12345678910
Random Consistency (RC)000.580.901.121.241.321.411.451.49
Table 4. Pairwise comparison matrix for main criteria.
Criterion IDTPSLTWDWDRRFWSLCTREA
TP1.001.003.000.330.140.330.143.001.000.14
SL1.001.000.330.200.200.200.330.141.000.14
TW0.333.001.000.200.200.330.143.005.000.20
DW3.005.005.001.001.000.333.001.005.009.00
DR7.005.005.001.001.003.003.001.005.000.33
RF5.005.003.003.000.331.003.000.333.005.00
WS5.003.007.000.330.330.331.000.200.330.20
LC1.007.000.331.001.003.005.001.009.009.00
TR1.001.000.200.200.200.333.000.111.000.33
EA3.007.005.000.113.000.205.000.113.001.00
Sum27.3338.0029.877.387.419.0723.629.9033.3325.35
Table 5. Standardized matrix for main criteria.
Criterion IDTPSLTWDWDRRFWSLCTREA
TP0.040.030.100.050.020.040.010.300.030.01
SL0.040.030.010.030.030.020.010.010.030.01
TW0.010.080.030.030.030.040.010.300.150.01
DW0.110.130.170.140.130.040.130.100.150.35
DR0.260.130.170.140.130.330.130.100.150.01
RF0.180.130.100.410.040.110.130.030.090.20
WS0.180.080.230.050.040.040.040.020.010.01
LC0.040.180.010.140.130.330.210.100.270.35
TR0.040.030.010.030.030.040.130.010.030.01
EA0.110.180.170.020.400.020.210.010.090.04
Table 6. Calculation of coherence index (CI) and random consistency (CR).
Criterion IDTPSLTWDWDRRFWSLCTREASumSum/Weight
TP0.060.020.200.050.020.050.010.530.030.021.0016.39
SL0.060.020.020.030.030.030.020.030.130.020.3918.00
TW0.020.060.070.030.030.050.010.530.170.031.0014.62
DW0.180.110.340.140.150.050.210.180.171.132.6718.41
DR0.430.110.340.140.150.430.210.180.170.042.2014.23
RF0.300.110.200.430.050.140.210.060.100.631.057.38
WS0.300.060.480.050.050.050.070.040.010.030.9012.72
LC0.060.150.020.140.150.430.350.180.311.130.382.14
TR0.060.020.010.030.030.050.210.020.030.040.133.66
EA0.180.150.340.020.460.030.350.020.100.130.695.50
Table 7. Summary of AHP parameter calculation.
ParameterCountLambda MaxCICRConstant
Value1011.3040.1450.0971.490
Table 8. Characteristics of the main criteria and sub-criteria used for GI analysis.
IDCriterionClassesWeightInfluence (%)Score (1 to 5)Area (km2)
TPTopographic position index (TPI)−168 to −2.130.0616.1%1342
−2.12 to −1.0313740
−1.02 to 0.066616979
0.0667 to 2.2722652
2.28 to 1122127
SLSlope (%)0 to 4.220.0212.1%18076
4.23 to 16.955112
17 to 37.91425
38 to 67.51185
67.6≤142
TWTopographic wetness index (TWI)2.18 to 7.50.0686.8%15687
7.51 to 9.7243797
9.73 to 12.532424
12.6 to 15.511235
15.6≤1698
DWDistance to water (km)≤0.09870.14514.5%1824
0.0987 to 0.19811039
0.199 to 0.3442000
0.35 to 0.46951116
0.47≤18861
DRDistance to road (km)≤0.0180.15515.5%53018
0.018 to 0.03942123
0.04 to 0.06532463
0.0651 to 0.112653
0.11≤13583
RFRainfall1 to 13.10.14214.2%12825
13.2 to 24.222821
24.3 to 35.333188
35.4 to 46.942466
47≤52539
WSWind speed≤2.8710.0707.0%51199
2.87 to 3.0341328
3.1 to 3.232522
3.3 to 3.324769
3.4≤14022
LCLand use/land changeWater bodies0.17717.7%11
Trees, vegetation, and crops524
Built-up area3281
Bare ground area18412
Rangeland35122
TRTopographic roughness index (TRI)≤0.3090.0343.4%1679
0.31 to 0.43722850
0.438 to 0.55636790
0.557 to 0.68542795
0.889≤5725
EAEmployment in the agriculture sector (urban population)≤10.12612.6%112,613
1 to 1.52480
1.6 to 2.33219
2.4 to 54145
5≤5382
Disclaimer/Publisher’s Note: The statements, opinions and data contained in all publications are solely those of the individual author(s) and contributor(s) and not of MDPI and/or the editor(s). MDPI and/or the editor(s) disclaim responsibility for any injury to people or property resulting from any ideas, methods, instructions or products referred to in the content.

