Article

Physical and Biological Stream Health in an Agricultural Watershed after 30+ Years of Targeted Conservation Practices

1
Riverine Landscapes Research Laboratory, University of New England, Armidale, NSW 2351, Australia
2
Large River Studies Center, Department of Biology, Winona State University, Winona, MN 55987, USA
3
Department of Mathematics, Winona State University, Winona, MN 55987, USA
4
Minnesota Department of Natural Resources, Fish and Wildlife Division, Saint Paul, MN 55155, USA
5
Minnesota Trout Unlimited, Stockton, MN 55317, USA
6
Alaska Department of Fish and Game, Division of Commercial Fisheries, Anchorage, AK 99518, USA
*
Author to whom correspondence should be addressed.
Submission received: 11 September 2023 / Revised: 29 September 2023 / Accepted: 29 September 2023 / Published: 2 October 2023

Abstract

:
Agricultural activities within watersheds can have negative effects on river ecosystems, but numerous conservation practices can be implemented that reduce soil erosion, increase water infiltration, slow runoff, and improve soil quality. Our study focused on analyzing overall stream health (instream and riparian physical, instream biological) at 56 stream sites within an agricultural watershed (83,000 hectares, 70% croplands, and rangelands) in southeastern Minnesota, USA, with a 30+-year history of targeted conservation practices to protect local water resources of importance for tourism and recreation. After implementation of >900 best management practices (BMPs) over the last 20 years in the study subwatersheds, only 20% of the stream sites examined exhibited good stream health, and 40% were in poor condition, based on a combination of instream and riparian factors and aquatic community integrity. Time since implementation, location, and total coverage of BMPs within the relatively large subwatersheds all may have contributed to the apparently limited effectiveness of these conservation management practices toward producing observable improvements in stream health to date. Many indicators of stream health (e.g., fine sediments, sediment embeddedness, fish biotic integrity) differed significantly among subwatersheds, but those differences could not be explained by differences in numbers or coverages of BMPs in those subwatersheds. Longitudinal stream health patterns were similar among subwatersheds (moderate health in headwaters, poor in mid-reaches, good in lower reaches), likely due, in part, to similarities in locations of spring discharges and channel instability. New rules protecting stream riparia, maintenance of existing BMPs, and future BMPs targeting remaining problem areas should lead to improving stream health in this large watershed.

1. Introduction

Freshwater streams and rivers are naturally dynamic, change-driven systems [1]. The role of disturbance in river ecosystems has been a central focus of stream and river ecology for several decades, as it affects both the structure and function of lotic ecosystems [2,3,4,5] by modifying flows, increasing both sediment transport and deposition, and altering fish and invertebrate communities [6]. Disturbances affecting stream systems can be either natural (e.g., floods or drought) or human-influenced (e.g., land modifications) and have been linked to changes ranging from minor to catastrophic [1,6,7].
Intensive agriculture (crop and livestock production) can have significant effects on streams and rivers, draining croplands and grazing areas [8,9,10,11]. Impacts can result from eroding soils [12], chemical runoff [9], altered hydrology [13], livestock manure [14], overgrazing [8], reduced infiltration [13], and a diverse array of other environmental side effects directly or indirectly tied to agricultural activities [15,16,17]. Ultimately, such impacts may include channel destabilization, damage to riparian areas, excessive scouring or sediment deposition, and reduced instream habitat diversity that can lead to declines in fish and aquatic macroinvertebrate diversity, loss of sensitive species, reductions in game fish abundance, and more [8,12,15,18,19].
Mitigating the impacts of agricultural activities on lotic systems has been a goal of numerous conservation projects undertaken throughout the world [19]. Mitigation often includes the implementation of best management practices (BMPs) designed to (1) reduce runoff by improving infiltration and expanding vegetated riparian buffers, (2) prevent soil erosion through tillage reduction and contour farming, and (3) manage livestock manure via improved retention systems and better application practices [20]. Both small- and large-scale mitigation projects have attempted to reduce the impacts of agriculture on streams and rivers moving forward and to help heal systems previously degraded by poor historical agricultural practices [19].
Implementing BMPs can be a costly undertaking, often too great for private landowners to pursue without some form of government assistance [13,21,22]. High costs of installing certain “hard” structures (e.g., water retention basins, manure storage structures), buying new equipment to support reduced tillage practices (e.g., new tillage, planting, and weed management equipment), or taking croplands out of production to create runoff and erosion controls (e.g., grass waterways, riparian buffer strips) may render full-scale implementation of BMPs within a watershed nearly impossible economically. Therefore, targeted conservation projects in small (e.g., <500 hectares) watersheds are more likely to be planned and implemented (and evaluated as successful) than projects encompassing much larger (e.g., >10,000 hectares) drainages [13,21,23]. However, small watershed projects may have had relatively few BMPs initiated, whereas some large watersheds have implemented hundreds of BMPs [19,21].
In the present study, we examined the health of lotic systems in a large (>80,000 hectares) agricultural watershed in the midwestern USA, specifically drainage with a long record (30+ years as a formal project, 80 years including all conservation efforts) of implementing conservation practices to mitigate the impacts of crop and livestock production on streams and rivers [19,20]. Lacking historical data on stream health prior to BMPs for comparison and also lacking information on specific BMP locations within the watershed, our study simply assessed current instream and riparian habitats along with fish and aquatic macroinvertebrate communities, expecting good to excellent stream habitats and biotic assemblages after many decades of targeted conservation BMPs.

2. Methods

2.1. Study Area

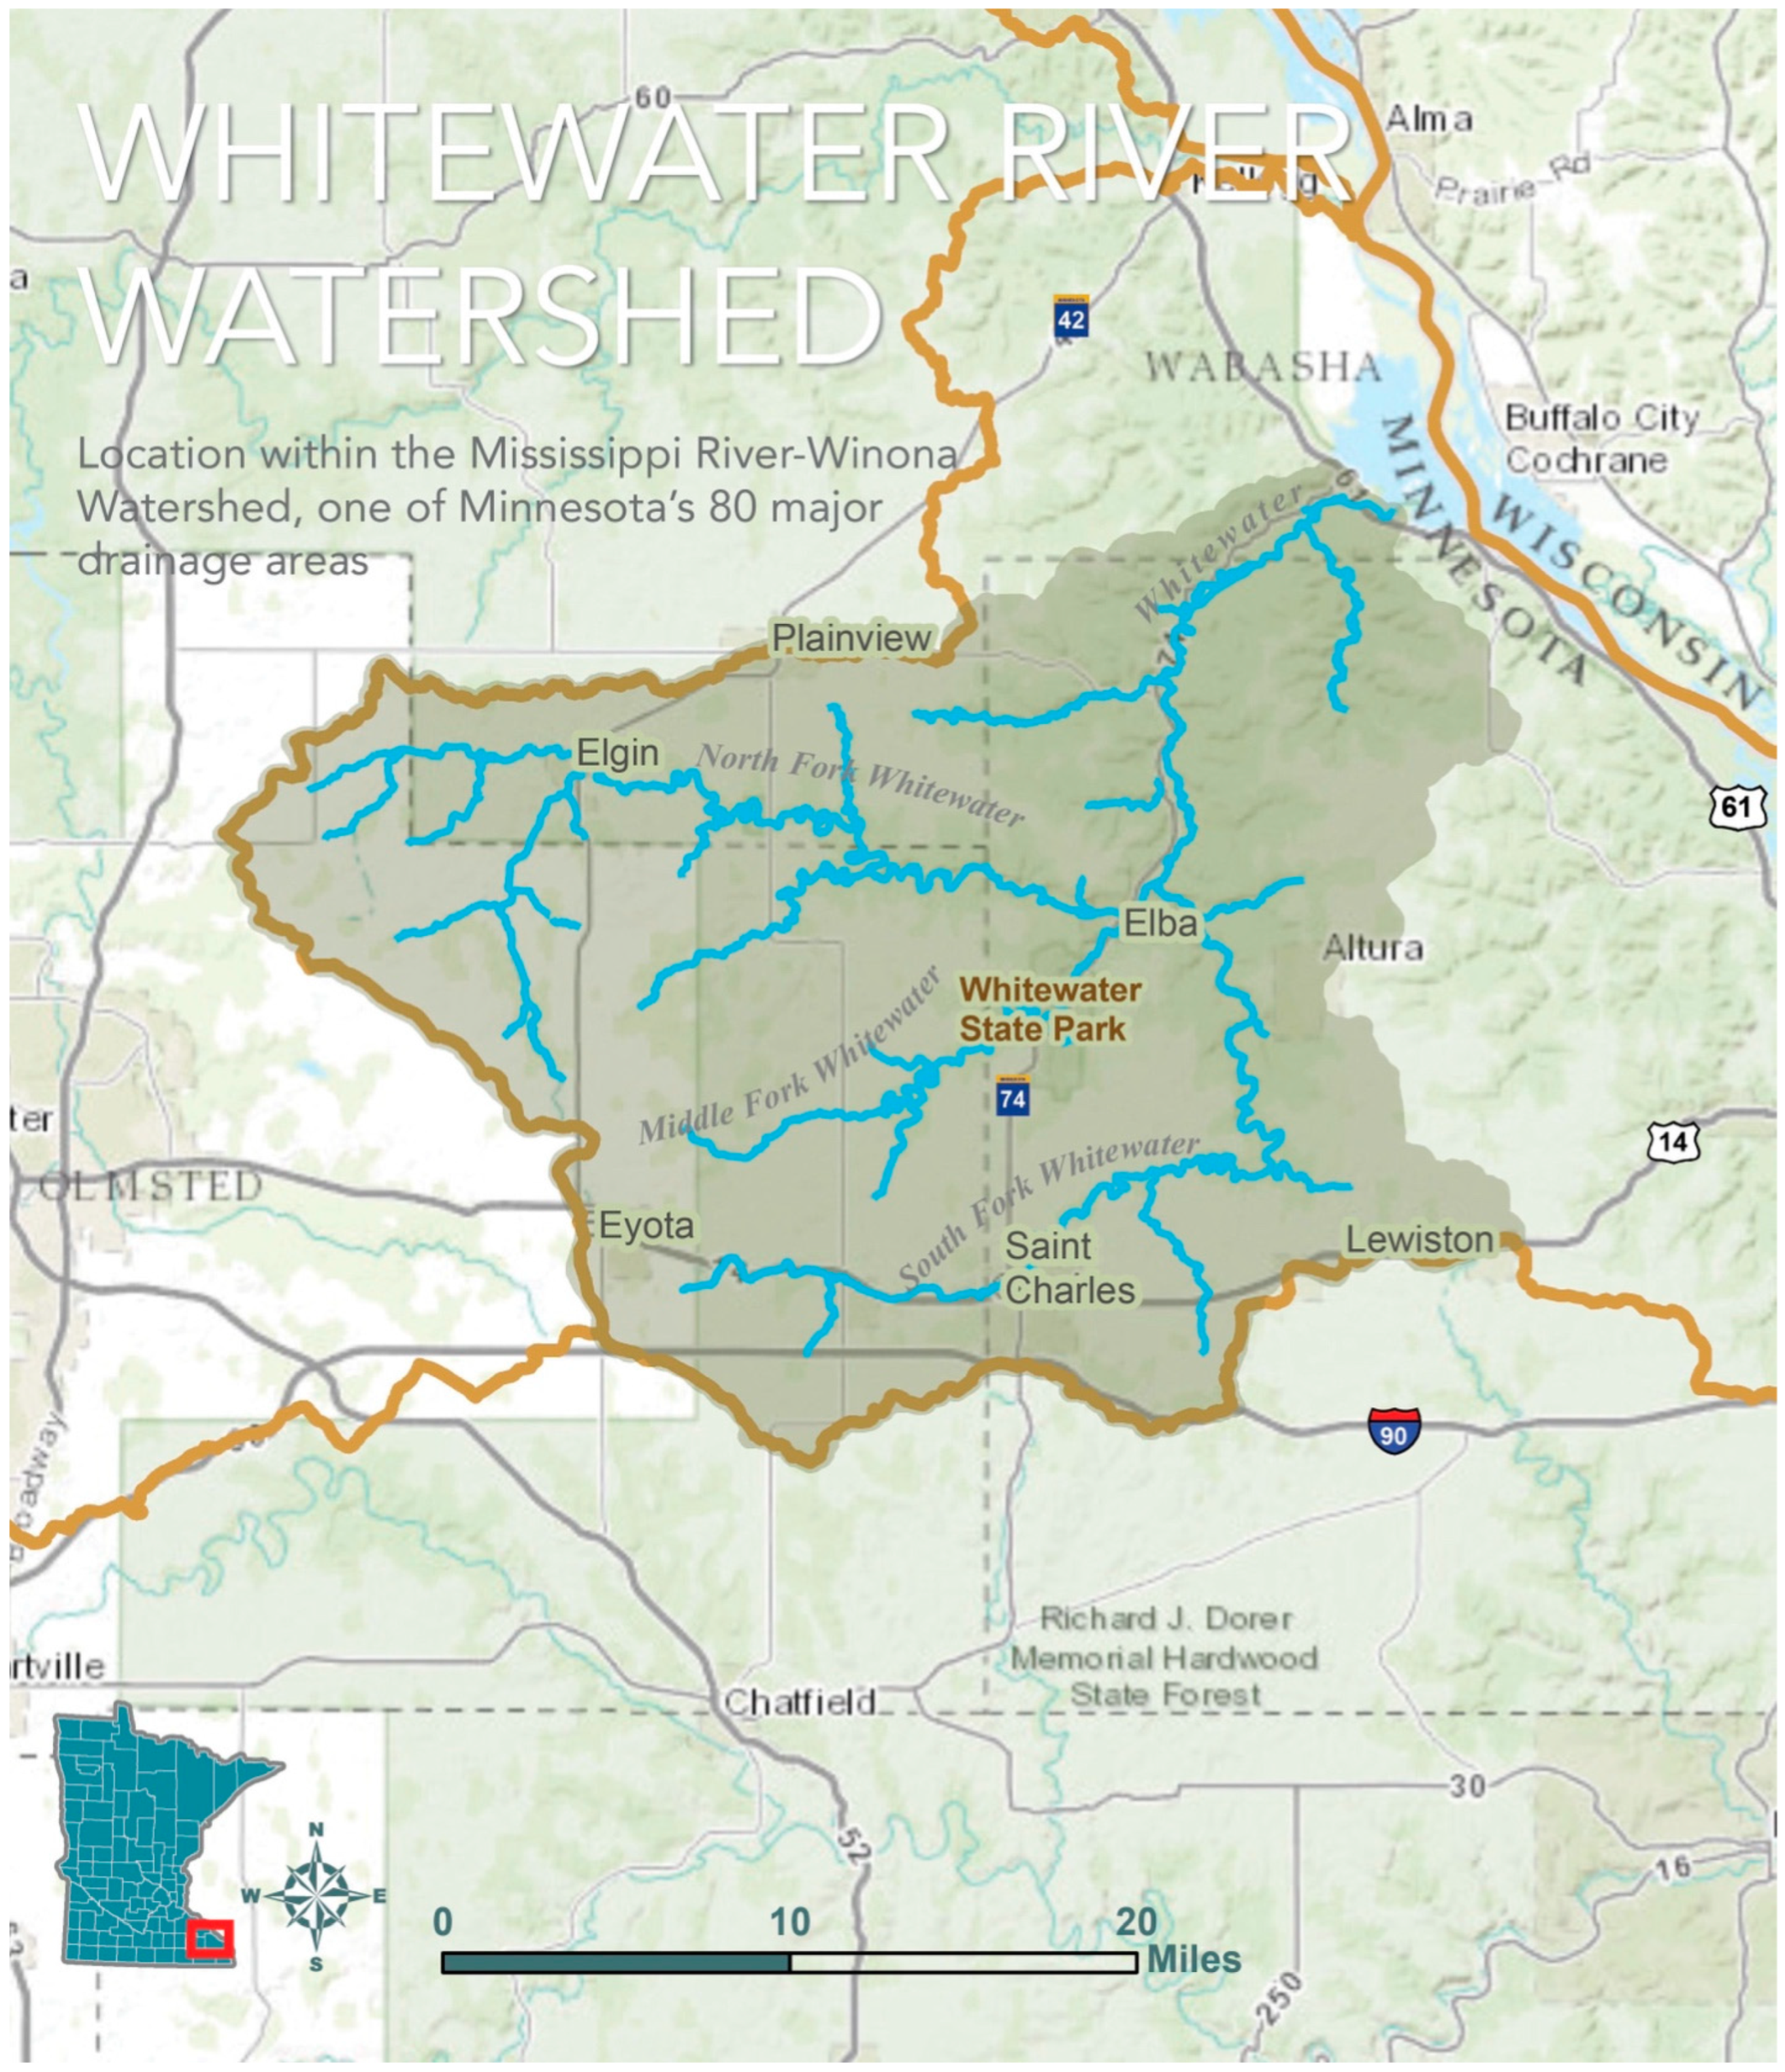
The Whitewater River watershed (44°05′19″ N, 92°01′04″ W) occupies 83,059 hectares (70.2% in agriculture) of rolling hills and valleys spanning portions of three counties (Olmsted, Winona, and Wabasha) in southeastern Minnesota, USA. The Whitewater River is a direct tributary to the upper Mississippi River, with a typical baseflow discharge of 4 m3/s. The river is comprised of the mainstem and three main forks (North, Middle, and South), plus several smaller tributaries (Logan Branch, Crow Spring, Trout Run, Beaver Creek, and Trout Valley Creek). Together, these streams comprise >240 km of fishable trout water.
Agriculture began in the Whitewater River watershed in 1853, with the region soon becoming a major producer of wheat and livestock [20]. The climate of the watershed is well suited for crop production: 87 cm of rainfall/year (75% during the April through September growing season) and a growing season length of 155 days (1600 growing-degree-days above a baseline of 12.8 °C). However, the rolling topography and fragile loess soils quickly succumbed to intensive farming practices, sending the watershed’s topsoil downslope and downstream in evermore frequent flood events [18,19]. By the 1930s, valleys in the watershed were buried under many meters of soil eroded from upland fields and grazing lands, and streams were choked with heavy loads of fine sediments [19]. Trout (native brook trout Salvelinus fontinalis and introduced brown trout Salmo trutta) were eliminated from 60% of the watershed’s streams, with the remaining 40% reduced to “poor condition” [24,25].
Pioneering environmentalist Richard J. Dorer began his visionary conservation work in the Whitewater watershed in the late 1930s, helping the land recover from the devastating effects of many unsustainable agricultural practices [18,20]. He focused his efforts on reducing soil erosion by revegetating slopes, blocking and filling gullies, removing livestock from hillsides, encouraging improved cultivation practices, and bringing abandoned lands under protective state ownership and management [18]. Gradually, the watershed began to recover.
Fifty years after Richard Dorer began his conservation work, the Whitewater Watershed Project was initiated in 1987 to expand and incentivize landowner participation in additional targeted conservation projects (BMPs). The need for expanded BMPs followed shifts in watershed agricultural land use, away from livestock, small grains, and hay and toward more row crops [20]. Contemporary BMPs include many of the same practices from Dorer’s era, plus more recent approaches, including new types of tillage and residue management, cover crops, grass waterways, riparian buffers, manure storage and (nutrient) application, stream channel rehabilitation, rotational grazing, and others [26].
Currently, the Whitewater River watershed remains dominated (70% by area) by agriculture, with two subwatersheds having >80% of the total land area in crop and livestock production (Table 1). Tilled croplands dominate (50 to 60%) the three major subwatersheds, with non-tilled agricultural lands (including livestock pastures and feedlots) averaging 21% across the watershed. BMPs implemented in the watershed before 2004 were not documented, but between 2004 and 2021, 1086 BMPs covering nearly 12,000 hectares were established in various subwatersheds of the Whitewater (Table 1). Some of these BMPs include newly installed or expanded riparian buffers along streams, mandated in the State of Minnesota by a 2014 law (Minnesota Statutes 2014, section 103B.101, subdivision 12, as amended in 2016 and 2020; https://www.revisor.mn.gov/statutes/cite/103F.48, accessed on 10 September 2023) requiring the presence of a continuous vegetated buffer (perennial rooted vegetation, 15-m average width, 9-m minimum width) between all public waters and tilled lands (livestock grazing and haying are permitted activities within buffers). In total, BMPs comprise 13 to 35% of agricultural lands in the various subwatersheds but overall include just 14% of all watershed lands. However, these values should be considered very conservative estimates of the scale of BMPs within the watershed since they do not include those BMPs (e.g., widespread contour farming, strip cropping) implemented from the 1930s through 2003.
At present, 12 different stream reaches within the Whitewater River watershed are listed as having impaired water quality due to ongoing land use issues [26] (Table 1). Those reaches are spread across all subwatersheds and together include 34 total impairments. Impairments include physical (high turbidity), chemical (high nitrates), and biological (high bacteria counts, poor macroinvertebrate and fish assemblages) problems (Table 1).
For this study, we focused our efforts on the three major subwatersheds within the greater Whitewater watershed: North Fork, Middle Fork, and South Fork (Figure 1). These subwatersheds comprised 78% of the total watershed area but >87% of the agricultural lands (Table 1). They also included 83% by number and 78% by area of the documented BMPs within the entire watershed. Unfortunately, the locations of BMPs were not public knowledge, so it was not possible to relate either the number or areal coverage of BMPs to specific stream site conditions.

2.2. Stream Surveys

During summer and early autumn (May–October) in 2018 and 2019, we surveyed stream habitats (instream and riparian), benthic macroinvertebrates, and fish at 56 sites within the three major Whitewater River subwatersheds (North = 20, Middle = 18, South = 18; Figure 2). Surveys were conducted at sites along each of the three river forks and within the larger tributaries to each fork. Sites included locations both on private lands (with landowner consent) and public lands (e.g., state parks and wildlife management areas). We attempted to select study sites located approximately every 1.5 km along each fork and larger tributary. However, there were areas within all forks that were inaccessible due to terrain and lack of roadways, causing some spatial gaps among sites, especially along the lower reaches of the North and South forks.
Habitat surveys—At each study site, instream and riparian variables were assessed along a representative 150-m stream reach with transects every 10 m (15 transects/site). At each transect spanning the width of the stream, four variables each were assessed at four equidistant points along the transect: water depth (cm), current velocity at 0.6-depth (cm/s), dominant substrate composition (estimated visually according to a modified Wentworth scale: clay, silt, sand, gravel, cobble, boulder, plus muck, vegetation, and detritus) [27], and embeddedness (the percent of large substrates such as cobbles covered by fine materials, estimated visually on a five-category scale: 5 = <5%, 4 = 5–25%, 3 = 25–50%, 2 = 50–75%, and 1 = >75% (low score indicates high embeddedness, and vice versa) [28]. Percent fines (estimated as an aggregate of sand, silt, clay, muck, vegetation, and detritus) were determined on a site-wide basis and presented as a percent of all substrates assessed. Similarly, width-to-depth ratios were determined for each site by using mean depth and width measurements.
Additional instream features were estimated visually. Percent of the channel shaded by the riparian canopy at noon, the percentage of the riffle, pool, run, and percent of the channel with instream fish cover were estimated to the nearest 5%. Fish cover included all overhanging bank vegetation, woody structures, aquatic macrophytes, boulders, and water >60 cm in depth (contributions by specific cover types were not recorded).
Riparian habitat measures were recorded on one stream bank per transect, alternating the side measured with each transect. The width of the riparian buffer was measured to the nearest meter with a rangefinder or meter tape. The average length of vegetation overhanging the stream was measured to the nearest 0.1 meter. Percentages of bank areas such as grass, forb, tree, shrub, bare soil, and rock were estimated visually to the nearest 5% for each category. Data collected from all transects were averaged to determine overall site values.
Macroinvertebrate sampling—Benthic macroinvertebrates were collected using a kick method with a D-frame net (500 µm mesh) by disturbing the substrate upstream from the net for 30 s (0.1-m2 area) in each of two locations (fast and slow current velocities) within a single riffle at each stream site. Organisms collected from both fast and slow sections were combined to form a single sample (0.2-m2 area sampled). Triplicate samples were collected at each site, preferably each sample from separate riffles. At sites with fewer than three riffles, samples were collected wherever coarse substrates or other hard structures (e.g., submerged logs) were found within the sample reach. All samples were labeled by site, date, and sample number, preserved in 70% ethanol, and later processed in the lab (organisms identified to genus [when possible] or family and counted).
Fish sampling—Fish assessments for species richness and abundance were completed within the same 150-m reach as used for habitat surveys at each stream site. A single-pass electrofishing method (downstream to upstream, Smith-Root LR-24 backpack electrofisher, two or three netters) was used to survey the fish community. Fish captured were identified, counted, and returned to the stream after capture, except for a few unidentified specimens retained for later identification.

2.3. Data Analyses

Initial analyses of biotic assemblages were conducted by separately calculating indexes of biotic integrity for benthic macroinvertebrate and fish data. Macroinvertebrate community data were used to calculate a benthic index of biotic integrity (B-IBI) [29] for each sample collected. The B-IBI is the sum of 14 metric scores (0 to 10 points each; total range from 0 to 140) representing fundamental characteristics of the invertebrate community. Triplicate B-IBI scores for each site were averaged to obtain an overall IBI rating for that site (excellent = B-IBI score of 95 to 140, good = 65 to 90, fair = 40 to 60, poor = 15 to 35, very poor = 0 to 10).
Fish survey data at each stream site were used to calculate a coldwater fish index of biotic integrity (coldwater IBI) score [30]. The fish IBI was the sum of 12 metric scores (0 to 10 points each; total range from 0 to 120) representing fundamental characteristics of the fish community (excellent = coldwater IBI score of 105 to 120, good = 70 to 100, fair = 35 to 65, poor = 10 to 30, very poor = 0 to 5).
In addition to calculating the various IBI metrics, the numbers of taxa of both macroinvertebrates and fish at each site were divided by the total number of individuals, then multiplied by 100 to describe the number of taxa per 100 individuals identified for each assemblage. These values provided additional diversity measurements for each assemblage, with characteristics not included directly in either IBI.
Physical habitat, macroinvertebrate, and fish data were summarized and compared among the three forks of the Whitewater River using single-factor analysis of variance (ANOVA; JMP Pro 14 software) to determine whether stream health conditions varied among subwatersheds. Prior to analyses, percentage data were transformed as required to meet normality assumptions.
To assess whether stream health at our sites varied spatially in some way other than among the different subwatersheds, we used a combination of cluster analysis (CA), principal component analysis (PCA), and variable selection to examine correlation patterns among our study sites. Data were analyzed using Program R version 3.5.1 [31]. A k-means algorithm was used to group stream sites together into similar clusters based on overall stream health, using a combination of stream habitat, macroinvertebrate, and fish variables. Given a number of clusters k, the algorithm finds k optimal cluster centers and assigns each data point to the cluster with the closest center. The elbow method was used to select the number of clusters in the k-means algorithm. For each possible k (1 through 10), the total within-cluster sum-of-squares (WSS) was computed and plotted versus k. The point at which the WSS leveled off was determined to be the optimal value of k. PCA was then used to decipher differences among clusters and to determine which variables were most influential for distinguishing among clusters. Kruskal-Wallis tests were used to determine whether there were significant differences among clusters in the medians of the most important variables. Stream site characterizations were then visualized using a two-dimensional biplot, with clusters based on the relative importance and weights of remaining variables. Site clusters were then characterized (i.e., good. moderate, poor) using those remaining factors.

3. Results

3.1. Instream and Riparian Variables: Comparisons among Subwatersheds

In total, 18 of the 24 instream and riparian habitat variables measured did not differ among the three subwatersheds assessed (Table 2). There were significant differences across only six variables (all instream): percent fines, percent gravel, embeddedness, percent run, percent pool, and percent instream cover. Although all streams examined had wide vegetated buffers in compliance with the new state law, stream channels at most sites were in poor condition based on high percent fines, high embeddedness, predominance of run habitats, and stream banks with high proportions of bare soil (Table 2). The Middle Fork appeared to be in slightly better condition than either the North or South forks due to reduced fines, less embeddedness, and less run and more riffle habitats.

3.2. Fish and Macroinvertebrate Variables: Comparisons among Subwatersheds

In total, 25,596 benthic macroinvertebrates representing 50 taxa (Table 3) and 9974 fish representing 21 species (Table 4) were collected at the 56 stream sites within the Whitewater River watershed. The South Fork sites together contained more taxa of both macroinvertebrates and fish than did sites on the other two forks, whereas Middle Fork sites held the fewest taxa.
Of the 13 macroinvertebrate variables compared among the subwatersheds, only three (number of Plecoptera taxa, % Plecoptera, % long-lived) displayed significant differences (Table 5). In general, B-IBI scores produced poor ratings for macroinvertebrate communities in all subwatersheds. Macroinvertebrate assemblages generally were lacking in diversity, especially among intolerant taxa such as mayflies, stoneflies, and caddisflies.
By contrast, fish communities displayed more variation among subwatersheds, with eight of the 15 fish variables examined displaying significant differences among the three forks of the Whitewater River (Table 6). Although fish communities at North and South fork sites received an average rating of poor (coldwater IBI scores of 28 and 14, respectively), Middle Fork sites received an average rating of fair (coldwater IBI score of 52). In general, Middle Fork sites held significantly higher proportions of intolerant and coldwater species and significantly fewer warmwater individuals than the other two forks. Consequently, Middle Fork subwatershed stream sites generally supported healthier coldwater fish communities than those found at sites within the other two subwatersheds examined.

3.3. Habitat, Macroinvertebrates, and Fish: Spatial Patterns of Stream Health

Cluster analysis using instream and riparian habitat variables, benthic macroinvertebrate community variables, and fish community variables indicated that our stream sites should be grouped into three clusters (notable reduction in the within-cluster sum-of-squared error through three clusters before diminishing returns from additional clusters). The 20 most influential variables (Figure 3) for distinguishing the clusters as indicated by PCA included eight instream habitat measures (width:depth ratio appeared twice), six riparian habitat variables, four fish community variables, and a single macroinvertebrate community variable. One PCA axis was influenced mostly by instream habitat and fish community variables, whereas the other PCA axis was influenced mostly by riparian and instream habitat variables. Of those influential variables, Kruskal-Wallis tests determined that 12 variables displayed significant differences in median values among site clusters (Table 7), including five instream, five riparian, and two fish variables. No macroinvertebrate variables were found to statistically separate the three site clusters.
A PCA biplot of all sites color-coded by cluster assignment and the 12 most influential variables (with direction and strength of influence) showed 12 sites clustering on the left side of the biplot, 24 on the upper right sector, and 20 on the lower right sector (Figure 4). We used the most influential variables to describe and characterize these three clusters (Table 8). Based on these characteristics, we termed the overall health of these three stream site clusters as good, moderate, and poor.
Sites belonging to each cluster were then mapped to examine the geographic distribution of overall stream site health within the three subwatersheds (Figure 5). In general, similar patterns in stream site health were exhibited in each of the three major subwatersheds. Headwaters sites were usually categorized as moderately healthy; narrow streams flowed through open, agricultural lands with grass buffers and minimal shading by trees. Mid-reach sites exhibited a mix of moderate and poor health; these sites were surrounded by agricultural lands similar to those at upstream sites, but many reaches were heavily shaded by a narrow but dense tree buffer (mostly box elder, Acer negundo). Lower reaches typically were categorized as having good health; these sites had wider stream channels with wide, forested buffers shading portions of the stream.

4. Discussion

This investigation of stream health (habitat and biotic) in an agricultural watershed, after decades of efforts and thousands of BMPs implemented to reduce soil erosion and improve water quality, resulted in three important findings. First, <25% of the stream sites examined exhibited good instream, riparian, and biotic health, with the majority (>75%) of sites categorized as having moderate or poor health. Second, stream site health differed slightly among major subwatersheds but was not related to the number or areal coverage of implemented BMPs within a subwatershed. Finally, stream site health displayed similar geographic distribution (i.e., upstream to downstream) patterns within each subwatershed, with headwater sites of moderate quality, mid-reach sites of moderate to poor quality, and downstream sites of good quality.
BMPs have been recommended and implemented for many decades to minimize the negative impacts of human activities on stream environments in both agricultural and urban environments [23,32,33,34,35]. Agricultural BMPs can take many forms [34], from physical infrastructure changes (e.g., retention basins, vegetated riparia, manure storage structures, contour farming, livestock exclusion fencing) to changes in farm management practices (e.g., conservation tillage, rotational grazing, cover crops, crop rotation, residue management). Although the effects of BMPs on agricultural stream environments can be highly variable [23,34], significant improvements have been observed in the physical, chemical, and biological conditions of streams after the implementation of many different types of BMPs (e.g., [36,37,38]). Consequently, after many decades of conservation work and thousands of implemented BMPs, we were expecting good to excellent stream habitats and biotic assemblages within the Whitewater River watershed. Instead, we found that most stream sites examined during this study displayed moderate to poor instream and riparian conditions and fair to poor biotic integrity.
There are several possible reasons why stream habitats and aquatic biota in the Whitewater River forks were not in better condition. For example, the number and/or coverage of BMPs may be insufficient relative to the size of the watersheds [34,39,40], the BMPs may not be in locations that are hydrologically most ideal for managing runoff from agricultural lands [35,41], or time since implementation may have been insufficient for BMPs to reduce agricultural impacts and for stream to respond to those reductions [13,34,39,42]. Many studies that have documented improved stream health after BMP implementation focused on small spatial scales (e.g., individual fields, farms, or headwater microwatersheds) [13,21,38,39,41,42,43] where BMPs comprised dominant proportions of the study landscapes, unlike the much larger (>13,000 hectares) Whitewater River subwatersheds examined in our study. Despite literally hundreds of documented BMPs implemented in every subwatershed over a roughly 20-year period (and many other undocumented BMPs in prior decades), comprising 13 to 25% of subwatershed agricultural land area, the majority of stream sites were not in good health. This is not an atypical observation after BMP implementation in large (>1500 hectares) watersheds [23]. Modeling studies on large watersheds suggest that BMPs can be used to improve stream health, but 50% or more of watershed agricultural lands may need to be in BMPs to produce an observable effect [35,44]. If such a BMP implementation threshold is realistic and applicable to other large watersheds, the Whitewater River subwatersheds would need to at least double the areal coverage of BMPs before widespread improvements in stream health might be observed. An extensive modeling effort of the individual subwatersheds could be undertaken to assess the possible need for additional BMP implementation in the Whitewater River watershed to improve overall stream health.
Within a watershed, BMPs ideally should be located at sites with the highest potential for mitigating the effects of runoff on receiving waters [34,35]. Such targeted placement can provide significant improvements to stream habitats and aquatic biota while holding costs of implementation at a realistic level [35,36,37,38,42,43,45]. In addition, clustering a variety of different BMPs together within the same geographic area can significantly improve the likelihood of successful mitigation [34,35,41]. We assume that many of the BMPs implemented within the Whitewater River watershed have been undertaken specifically to target problematic issues (e.g., soil erosion, feedlot runoff, gully formation) on a site-by-site basis. However, other BMPs may have been undertaken based more on the availability of financial assistance and landowner willingness (i.e., opportunistic) than on a specific hydrologic need [34]. Other than the legally mandated riparian buffers along waterways and BMPs obvious enough to be observed on publicly available aerial photos (e.g., contour farming/strip cropping, earthen dams, manure storage structures), locations of implemented BMPs are considered to be private information in Minnesota (Sheila Harms, Winona County, MN, water planner, personal communication) and elsewhere [46]. Consequently, we cannot determine with any certainty whether any of the BMPs in the Whitewater River subwatersheds have been placed in areas where they can produce observable effects on streams and their communities.
Some measures of stream health may show improvement soon after (within a few years) BMP adoption [38,42,43], especially if management efforts are concentrated geographically [34] and those efforts are continuing (e.g., upkeep and maintenance of structures, ongoing conservation tillage, livestock manure management) rather than “one and done” [11]. However, most projects undertaken to improve water quality by implementing extensive, watershed-based BMPs report little or no improvement due to the lag time between when management practices are installed and when water bodies respond to the effects of those practices in an observable way [23,34]. Those lag times can extend to many decades and beyond, depending on watershed conditions and the specific response(s) being examined [13,23,34,39]. Agricultural watersheds, including those in the geographic region of the Whitewater River, often exhibit legacy effects resulting from historical agricultural stressors (e.g., high nutrient levels, fine sediment deposits) that continue to affect present-day stream habitats and water quality despite past and present conservation efforts [19,39,47]. The persistence of those stressors may simply overwhelm and delay BMP effectiveness [39]. In addition, historically incised and unstable stream channel habitats can inhibit the recovery of biotic communities [48,49], possibly even for many decades [40], potentially requiring extreme intervention in the form of stream habitat restoration before biota can respond favorably to watershed BMPs [13].
Since the Whitewater River subwatershed differed substantially in both the numbers (231 to 385) and proportional areal coverages (13 to 25%) of implemented BMPs, we expected that those differences would translate into differences in indicators of stream site health among subwatersheds. Indeed, 33% of the indicators examined (six of 24 habitat variables, three of 13 invertebrate variables, and eight of 15 fish variables) differed among the major subwatersheds of the Whitewater River. However, more BMPs did not correlate with better stream health. For example, several sediment, habitat type, and fish variables were significantly better at Middle Fork sites, even though that specific subwatershed had the lowest number of BMPs and the least coverage of BMPs compared to the other subwatersheds examined. These results suggest that simply implementing large numbers or large areas of BMPs within a watershed may not lead directly to improved stream health [50], even over several decades of effort. For example, the locations of BMPs may be more important than BMP number or size in improving indicators of stream health [34,38,43,51,52]. Since watershed headwaters and their biota can be less susceptible to agricultural activities than those in downstream reaches [53] (but also see [17] regarding channelized headwaters), BMPs placed lower in the watershed may be more successful at improving stream health, especially when those BMPs are actively managed and maintained [11,52]. There is considerable evidence that conservation BMPs within the upper Mississippi River region where this study was conducted historically focused on upper watershed areas [19]. Although these BMPs controlled the heavy soil erosion produced previously by excessive grazing and row-cropping on steep slopes during the late 19th and early 20th centuries, current problem areas have shifted downstream along with the legacy eroded soils, continuing to compromise stream health in mid-to-lower reaches in many regional watersheds [19]. Relatively recent stream rehabilitation projects in the mid-to-lower reaches of the Middle and South forks of the Whitewater River have begun to address some of the poor stream habitat conditions present within the system [54].
Patterns of stream health were similar among the three subwatersheds examined in the Whitewater River system, with moderate-quality headwater sites, moderate- to poor-quality mid-reach sites and good-quality downstream sites. Previous studies in the Whitewater system have observed a similar pattern [7,50]. All three forks of the Whitewater River arise from shallow, high-elevation springs within the same 10-km2 area atop a low ridge on the extreme western edge of the watershed (see Figure 5). Although surrounded by agricultural lands, headwater stream sites were moderately healthy. Their locations are high in the watershed (180 m elevation change from headwater spring sources to subwatershed confluences with the mainstem Whitewater River), which may make them less susceptible than downstream sites to runoff from heavy rain events and therefore, less likely to receive runoff from croplands and livestock pastures [53]. In addition, the steady spring discharges may have both stabilizing and healing effects on headwater stream channels [55]. Further downstream, study sites exhibited moderate or poor health. These mid-reach sites are less influenced by springs and likely are more susceptible to intense precipitation events, which can deliver agricultural runoff to stream sites and scour stream channels.
Sites with the best health typically were located within the lower reaches of each subwatershed, where instream and riparian habitats were good, and fish communities had the highest coldwater IBI ratings. Good stream health in these reaches is possibly the result of the stream habitat rehabilitation projects undertaken recently [54], combined with the stable to increasing discharges of deep, low-elevation coldwater springs into the lower sections of each fork [7,56]. These low-elevation springs produce higher-volume discharges than the headwater springs, significantly reducing stream water temperatures and shifting biotic communities to those more tolerant of cold water [7]. The influence of local geology and deep spring discharges on stream site health has been reported previously within this region [57]. As stated above, steady stream flows resulting from consistent spring discharges can serve to stabilize stream channels and help channels recover more quickly if damaged or disturbed [55].

5. Conclusions

The hundreds of conservation practices and BMPs implemented within the Whitewater River watershed since the mid-1900s by conservationist Richard Dorer and his successors have significantly lessened the impacts of agriculture on streams within the watershed [18,19,25]. However, this and previous studies [7,41,49,50] have found that many stream locations within the watershed continue to display indicators of moderate to poor stream health, encompassing both the poor physical condition of the stream channels themselves and the poor integrity of the biotic communities within those channels. Even with 20% of all agricultural lands within the watershed involved in BMPs within the past 20 years alone, nearly 40% of the stream sites examined currently are in poor health.
At over 80,000 hectares in size, the Whitewater River watershed is large compared to many others where BMP effectiveness has been assessed [21,37,38,52]. It likely is much simpler to demonstrate BMP effectiveness by implementing a clustered group of targeted BMPs simultaneously in a small watershed and focusing on a few select stream health outcomes (e.g., [21,37]) rather than it is to assess the overall stream health impacts of watershed- or subwatershed-wide BMPs undertaken over many decades (e.g., [15,34,35,40]), especially when BMP locations may be largely unknown. In the Whitewater River watershed, many BMPs have proven effective at improving stream health when viewed on a small spatial scale [41,50,52], but when viewed on a larger scale, benefits are less obvious [7]. Although some stream health indicators are suggestive of improving stream conditions (e.g., reduced fine sediments and substrate embeddedness) in the Whitewater system during the past 20 years, other indicators (increasing stream width, more bare soil on banks) point to worsening conditions, especially at sites in the middle of the subwatersheds [49]. It is possible that stream channels damaged and incised prior to conservation management may continue to exhibit poor physical and biotic health due to continuing channel instability exacerbated by increases in flood frequency and/or magnitude [49,58].
The riparian buffer law instituted in Minnesota in 2014 likely will serve to improve stream health throughout the state, including within the Whitewater watershed. Although some stream health indicators in the Whitewater River displayed improvement soon after the installation of new or expanded streamside buffers [49], it may yet be too soon (<10 years) to observe the true impacts of the buffer law on stream health. In fact, true improvements in instream conditions and biotic integrity still could be decades away due to the lag time between BMP installation and ecosystem response [13,23,34,39].
Even with new rules protecting stream riparia within the Whitewater watershed, total areal coverage of BMPs within the watershed likely will remain well below the possible 50% threshold [35,44] needed to truly protect stream systems from agricultural activities. Consequently, successful conservation management of watershed lands leading to improved stream health probably will require that future efforts focus on targeting BMPs within remaining problem areas and continuing maintenance of already existing BMPs. Future BMPs should be clustered in hydrologically sensitive areas [34,35,41], especially around mid-reach stream segments where storm event runoff continues to impact unstable channels and compromise biotic recovery, and within floodplain and terrace areas where legacy soils eroded from the watershed during past decades serve as the main sources for suspended sediments in regional streams and river today [59]. Many stream segments may require intensive stream channel rehabilitation to remove legacy deposits of eroded soils, restore stream access to historic floodplains, and stabilize channels [19]. Maintaining existing BMPs (e.g., continue conservation grazing, manure management, grass waterways, and conservation tillage practices) will be necessary to ensure that existing agricultural activities and any possible future changes in agricultural practices within the watershed (e.g., changes in livestock rearing methods, converting hay lands and pasture to row crops) [20] do not compromise the progress already made within the watershed.

Author Contributions

W.L.V. and N.D.M. developed the concept for the paper. W.L.V., N.D.M., C.R.W. and J.C.-B. participated in field work and benthic invertebrate sample sorting and identification. W.L.V., S.B. and D.F.S. performed the analyses, and N.D.M. and W.L.V. led the writing of the paper. All authors have edited the manuscript and approved the submitted version. All authors have read and agreed to the published version of the manuscript.

Funding

This project was funded by Minnesota’s Environment and Natural Resources Trust Fund, as recommended by the Legislative-Citizen Commission on Minnesota Resources (M.L. 2017, Chp. 96, Sec. 2, Subd. 04d/Water Quality Monitoring in Southeastern Minnesota Trout Streams).

Institutional Review Board Statement

Fish surveys were made under special permits (Numbers 12769, 23668, 28374) from the Minnesota Department of Natural Resources, Division of Fish and Wildlife, Section of Fisheries, and were conducted with the approval of the Winona State University Institutional Animal Care and Use Committee (1317064-1, 1310072-2). This research complied with all ethical standards.

Data Availability Statement

Data are available directly from the authors per reasonable request.

Acknowledgments

We thank the private landowners who granted us permission to access the river for this study. T. Biederman, O. Graziano, and many others assisted with field sampling and processing invertebrate samples.

Conflicts of Interest

The authors declare no conflict of interest.

References

  1. Thorp, J.H.; Thoms, M.C.; Delong, M.D. The Riverine Ecosystem Synthesis: Toward Conceptual Cohesiveness in River Science; Academic Press: London, UK, 2008. [Google Scholar]
  2. Resh, V.H.; Brown, A.V.; Covich, A.P.; Gurtz, M.E.; Li, H.W.; Minshall, G.W.; Reice, S.R.; Sheldon, A.L.; Wallace, J.B.; Wissmar, R.C. The role of disturbance in stream ecology. J. N. Am. Benthol. Soc. 1988, 7, 433–455. [Google Scholar] [CrossRef]
  3. Lake, P.S. Disturbing hard and soft bottom communities: A comparison of marine and freshwater environments. Aust. J. Ecol. 1990, 15, 477–488. [Google Scholar] [CrossRef]
  4. Poff, N.L. Why disturbances can be predictable: A perspective on the definition of disturbance in streams. J. N. Am. Benthol. Soc. 1992, 11, 86–92. [Google Scholar] [CrossRef]
  5. Lake, P.S. Disturbance, patchiness, and diversity in streams. J. N. Am. Benthol. Soc. 2000, 19, 573–592. [Google Scholar] [CrossRef]
  6. Delong, M.D.; Thoms, M.C. Changes in the trophic status of fish feeding guilds in response to flow modification. J. Geophys. Res. Biogeosci. 2016, 121, 949–964. [Google Scholar] [CrossRef]
  7. Mundahl, N.D.; Mundahl, E.D. Aquatic community structure and stream habitat in a karst agricultural landscape. Ecol. Process. 2022, 11, 18. [Google Scholar] [CrossRef]
  8. Armour, C.L.; Duff, D.A.; Elmore, W. The effects of livestock grazing on riparian and stream ecosystems. Fisheries 1991, 16, 7–11. [Google Scholar] [CrossRef]
  9. Matthaei, C.D.; Piggott, J.J.; Townsend, C.R. Multiple stressors in agricultural streams: Interactions among sediment addition, nutrient enrichment and water abstraction. J. Appl. Ecol. 2010, 47, 639–649. [Google Scholar] [CrossRef]
  10. Hall, L.W., Jr.; Anderson, R.D.; Killen, W.D.; Alden, R.W., III. An analysis of multiple stressors on resident benthic communities in a California agricultural stream. Air Soil Water Res. 2018, 11, 1–18. [Google Scholar] [CrossRef]
  11. Derose, K.L.; Battaglia, C.F.; Eastburn, D.J.; Roche, L.M.; Becchetti, T.A.; George, H.A.; Lile, D.F.; Lancaster, D.L.; McDougald, N.K.; Tate, K.W. Riparian health improves with managerial effort to implement livestock distribution practices. Rangel. J. 2020, 42, 153–160. [Google Scholar] [CrossRef]
  12. Burdon, F.J.; McIntosh, A.R.; Harding, J.S. Habitat loss drives threshold response of benthic invertebrate communities to deposited sediment in agricultural streams. Ecol. Appl. 2013, 23, 1036–1047. [Google Scholar] [CrossRef]
  13. Agouridis, C.T.; Workman, S.R.; Warner, R.C.; Jennings, G.D. Livestock grazing management impacts on stream water quality: A review. J. Am. Water Resour. Assoc. 2005, 41, 591–606. [Google Scholar] [CrossRef]
  14. Davis, S.; Golladay, S.W.; Vellidis, G.; Pringle, C.M. Macroinvertebrate biomonitoring in intermittent coastal plain streams impacted by animal agriculture. J. Environ. Qual. 2003, 32, 1036–1043. [Google Scholar] [CrossRef] [PubMed]
  15. Fitzpatrick, F.A.; Scudder, B.C.; Lenz, B.N.; Sullivan, D.J. Effects of multi-scale environmental characteristics on agricultural stream biota in eastern Wisconsin. J. Am. Water Resour. Assoc. 2001, 37, 1489–1507. [Google Scholar] [CrossRef]
  16. Dale, V.H.; Polasky, S. Measures of the effects of agricultural practices on ecosystem services. Ecol. Econ. 2007, 64, 286–296. [Google Scholar] [CrossRef]
  17. Teufl, B.; Weigelhofer, G.; Fuchsberger, J.; Hein, T. Effects of hydromorphology and riparian vegetation on the sediment quality of agricultural low-order streams: Consequences for stream restoration. Environ. Sci. Pollut. Res. 2013, 20, 1781–1793. [Google Scholar] [CrossRef]
  18. Waters, T.F. The Streams and Rivers of Minnesota; University of Minnesota Press: Minneapolis, MN, USA, 1977. [Google Scholar]
  19. Trimble, S.W. Historical Agriculture and Soil Erosion in the Upper Mississippi Valley Hill Country; CRC Press: Boca Raton, FL, USA, 2013. [Google Scholar]
  20. Whitewater River Watershed Project. A History of the Whitewater Watershed in Minnesota; Whitewater River Watershed Project: Lewiston, MN, USA, 2015. [Google Scholar]
  21. Yates, A.G.; Bailey, R.C.; Schwindt, J.A. Effectiveness of best management practices in improving stream ecosystem quality. Hydrobiologia 2007, 583, 331–344. [Google Scholar] [CrossRef]
  22. Minnesota Board of Soil and Water Resources. The Minnesota Conservation Reserve Enhancement Program (MN CREP); Minnesota Board of Soil and Water Resources: St. Paul, MN, USA, 2017.
  23. Meals, D.W.; Dressing, S.A.; Davenport, T.E. Lag time in water quality response to best management practices: A review. J. Environ. Qual. 2010, 39, 85–96. [Google Scholar] [CrossRef]
  24. Waters, T.F. Sediment in Streams: Sources, Biological Effects and Controls; American Fisheries Society Monograph 7: Bethesda, MD, USA, 1995. [Google Scholar]
  25. Thorn, W.C.; Anderson, C.; Lorenzen, W.; Hendrickson, D.; Wagner, J. A review of trout management in southeast Minnesota stream. N. Am. J. Fish. Manag. 1997, 17, 860–872. [Google Scholar] [CrossRef]
  26. Minnesota Pollution Control Agency. Healthy Watersheds: Tracking the Actions Taken; Minnesota Pollution Control Agency: St. Paul, MN, USA, 2023. Available online: https://www.pca.state.mn.us/business-with-us/healthier-watersheds-tracking-the-actions-taken (accessed on 10 September 2023).
  27. Minnesota Department of Natural Resources. Fisheries Stream Survey Manual: Stream Survey Methods; Special Publication No. 165; Minnesota Department of Natural Resources, Division of Fish and Wildlife, Section of Fisheries: St. Paul, MN, USA, 2007.
  28. Platts, W.S.; Meaghan, W.F.; Minshall, G.W. Methods for Evaluating Stream Riparian Biotic Conditions; Technical Report INT-138; U.S. Department of Agriculture, Forest Service, Intermountain Forest and Range Experimental Station: Ogden, UT, USA, 1982.
  29. Wittman, E.; Mundahl, N.D. Development and Validation of a Benthic Index of Biotic Integrity (B-IBI) for Streams in Southeastern Minnesota; Winona State University Floruit (Student and Faculty Research from the College of Science and Engineering): Winona, MN, USA, 2004; Volume 1, pp. 41–48. [Google Scholar]
  30. Mundahl, N.D.; Simon, T.P. Development and application of an index of biotic integrity for coldwater streams of the upper midwestern United States. In Assessing the Sustainability and Biological Integrity of Water Resource Quality Using Fish Assemblages; Simon, T.P., Ed.; Lewis Publishers: Boca Raton, FL, USA, 1998; pp. 383–415. [Google Scholar]
  31. R Core Team. R: A Language and Environment for Statistical Computing; R Foundation for Statistical Computing: Vienna, Austria, 2018; Available online: https://www.R-project.org (accessed on 1 October 2023).
  32. Maxted, J.R.; Shaver, E. The use of retention basins to mitigate stormwater impacts to aquatic life. In Proceedings of the National Conference on Retrofit Opportunities for Water Resource Protection in Urban Environments, Chicago, IL, USA, 9–12 February 1998; EPA/625/R-99/022. U.S. Environmental Protection Agency: Washington, DC, USA, 1999; pp. 6–15. [Google Scholar]
  33. Roesner, L.A.; Bledsoe, B.P.; Brashear, R.W. Are best-management-practice criteria really environmentally friendly? J. Water Resour. Plan. Manag. 2001, 127, 150–154. [Google Scholar] [CrossRef]
  34. Kroll, S.A.; Oakland, H.C. A review of studies documenting the effects of agricultural best management practices on physiochemical and biological measures of stream system integrity. Nat. Areas J. 2019, 39, 58–77. [Google Scholar] [CrossRef]
  35. Herman, M.R.; Nejadhashemi, A.P.; Daneshvar, F.; Ross, D.M.; Woznicki, S.A.; Zhang, Z.; Esfahanian, A.-H. Optimization of conservation practice implementation strategies in the context of stream health. Ecol. Eng. 2015, 84, 1–12. [Google Scholar] [CrossRef]
  36. Wang, L.; Lyons, J.; Kanehl, P. Effects of watershed best management practices on habitat and fish in Wisconsin streams. J. Am. Water Resour. Assoc. 2002, 38, 663–680. [Google Scholar] [CrossRef]
  37. Bishop, P.L.; Hively, W.D.; Stedinger, J.R.; Rafferty, M.R.; Lojpersberger, J.L.; Bloomfield, J.A. Multivariate analysis of paired watershed data to evaluate agricultural best management practice effects on stream water phosphorus. J. Environ. Qual. 2005, 34, 1087–1101. [Google Scholar] [CrossRef] [PubMed]
  38. Miller, J.; Chanasyk, D.; Curtis, T.; Entz Willms, W. Influence of streambank fencing with a cattle crossing on riparian health and water quality of the Lower Lottel Bow River in Southern Alberta, Canada. Agric. Water Manag. 2010, 97, 247–258. [Google Scholar] [CrossRef]
  39. Pearce, N.J.T.; Yates, A.G. Agricultural best management practice abundance and location does not influence stream ecosystem function or water quality in the summer season. Water 2015, 7, 6861–6876. [Google Scholar] [CrossRef]
  40. Kua, Z.X.; Davis, C.M.; Townley, L.A.; Stella, J.C.; Shaw, S.B. Analyzing the impact of agricultural BMPs on stream nutrient load and biotic health in the Susquehanna-Chemung basin of New York. J. Environ. Manag. 2023, 335, 117521. [Google Scholar] [CrossRef]
  41. Vondracek, B.; Blann, K.L.; Cox, C.B.; Nerbonne, J.F.; Mumford, K.G.; Nerbonne, B.A.; Sovell, L.A.; Zimmerman, J.K.H. Land use, spatial scale, and stream systems: Lessons from an agricultural region. Environ. Manag. 2005, 36, 775–791. [Google Scholar] [CrossRef] [PubMed]
  42. Rhodes, H.M.; Closs, G.P.; Townsend, C.R. Stream ecosystem health outcomes of providing information to farmers and adoption of best management practices. J. Appl. Ecol. 2007, 44, 1106–1115. [Google Scholar] [CrossRef]
  43. Barfield, B.J.; Blevins, R.L.; Fogle, A.W.; Madison, C.E.; Inamdar, S.; Carey, D.I.; Evangelou, V.P. Water quality impacts of natural filter strips in karst areas. Trans. Am. Soc. Agric. Biol. Eng. 1998, 41, 371–381. [Google Scholar] [CrossRef]
  44. Ahsan, A.; Das, S.K.; Khan, M.H.R.B.; Ng, A.W.M.; Al-Ansari, N.; Ahmed, S.; Imteaz, M.; Tariq, M.A.U.R.; Shafiquzzaman, M. Modeling the impacts of best management practices (BMPs) on pollution reduction in the Yarra River catchment, Australia. Appl. Water Sci. 2023, 13, 98. [Google Scholar] [CrossRef]
  45. Holmes, R.; Armanini, D.G.; Yates, A.G. Effects of best management practice on ecological condition: Does location matter? Environ. Manag. 2016, 57, 1062–1076. [Google Scholar] [CrossRef]
  46. Yates, A.G.; Bailey, R.C. Improving the description of human activities potentially affecting rural stream ecosystems. Landsc. Ecol. 2010, 25, 371–382. [Google Scholar] [CrossRef]
  47. Mc Tammany, M.E.; Benfield, E.F.; Webster, J.R. Recovery of stream ecosystem metabolism from historical agriculture. J. N. Am. Benthol. Soc. 2007, 26, 532–545. [Google Scholar] [CrossRef]
  48. Talmage, P.J.; Perry, J.A.; Goldstein, R.M. Relation of instream habitat and physical conditions to fish communities of agricultural streams in the northern Midwest. N. Am. J. Fish. Manag. 2002, 22, 825–833. [Google Scholar] [CrossRef]
  49. Mundahl, N.D.; Varela, W.L.; Weaver, C.; Mundahl, E.D.; Cochran-Biederman, J.L. Stream habitats and aquatic communities in an agricultural watershed: Changes related to a mandatory riparian buffer law. Environ. Manag. 2023, 72, 945–958. [Google Scholar] [CrossRef]
  50. Nerbonne, B.A.; Vondracek, B. Effects of local land use on physical habitat, benthic macroinvertebrates, and fish in the Whitewater River, Minnesota, USA. Environ. Manag. 2001, 28, 87–99. [Google Scholar] [CrossRef]
  51. Heitke, J.D.; Pierce, C.L.; Gelwicks, G.T.; Simmons, G.A.; Siegwarth, G.L. Habitat, land use, and fish assemblage relationships in Iowa streams: Preliminary assessment in an agricultural landscape. Am. Fish. Soc. Symp. 2006, 48, 287–303. [Google Scholar]
  52. Magner, J.A.; Vondracek, B.; Brooks, K.N. Grazed riparian management and stream channel response in southeastern Minnesota (USA) streams. Environ. Manag. 2008, 42, 377–390. [Google Scholar] [CrossRef]
  53. Walser, C.A.; Bart, H.L., Jr. Influence of agriculture on in-stream habitat and fish community structure in Piedmont watersheds of the Chattahoochee River system. Ecol. Freshw. Fish 1999, 8, 237–246. [Google Scholar] [CrossRef]
  54. Mundahl, N.D. Analysis of a catch-and-harvest fishing contest for brown trout spanning 50+ years: Long-term trends influenced by fisheries management actions and angler behavior. N. Am. J. Fish. Manag. 2022, 42, 1653–1664. [Google Scholar] [CrossRef]
  55. Rosgen, D. Watershed Assessment of River Stability and Sediment Supply (WARSSS); Wildland Hydrology: Fort Collins, CO, USA, 2006. [Google Scholar]
  56. Ayers, J.R.; Villarini, G.; Jones, C.; Schilling, K. Changes in monthly baseflow across the U.S. Midwest. Hydrol. Process. 2019, 33, 748–758. [Google Scholar] [CrossRef]
  57. Troelstrup, N.H., Jr.; Perry, J.A. Water quality in southeastern Minnesota streams: Observations along a gradient of land use and geology. J. Minn. Acad. Sci. 1989, 55, 32–37. [Google Scholar]
  58. Mallakpour, I.; Villarini, G. The changing nature of flooding across the central United States. Nat. Clim. Chang. 2015, 5, 250–254. [Google Scholar] [CrossRef]
  59. Stout, J.C.; Belmont, P.; Schottler, S.P.; Willenbring, J.K. Identifying sediment sources and sinks in the Root River, southeastern Minnesota. Ann. Assoc. Am. Geogr. 2014, 104, 20–39. [Google Scholar] [CrossRef]
Figure 1. Map depicting the study area consisting of the three forks of the Whitewater River in southeastern Minnesota, USA. Courtesy of Whitewater River Watershed Project (2015).
Water 15 03475 g001
Figure 2. Map displaying locations of the 56 study sites along the North, Middle, and South forks of the Whitewater River, southeastern Minnesota, USA.
Water 15 03475 g002
Figure 3. Contributions of stream habitat and biotic variables to each of the two axes of the PCA biplot of Whitewater River study sites. The dashed lines represent expected contribution levels if variables were uniform in effect. Variables above the dotted lines were selected because they were more important for distinguishing among sampling sites.
Water 15 03475 g003
Figure 4. PCA biplot of 56 Whitewater River sites based on stream habitat and biotic variables. Points are color-coded according to cluster assignment from k-means clustering. Arrows indicate the influence of variables in clustering sites, with arrow length indicating the degree of influence. Points toward arrowheads indicate stream locations with larger values of that variable. Blue clusters are “good quality” sites, green “moderate quality”, and red “poor quality”. The large points in each cluster indicate cluster centroids. Ellipses are bivariate normal approximations of the distributions of points within each cluster.
Water 15 03475 g004
Figure 5. Distribution of good, moderate, and poor quality sites along the North, Middle, and South forks of the Whitewater River in southeastern Minnesota, USA.
Water 15 03475 g005
Table 1. Characteristics of four subwatersheds within the Whitewater River watershed, southeastern Minnesota, USA. Non-tilled agricultural lands included livestock pastures and feedlots. Documented BMPs (from 2004 to 2021) are targeted best management practices applied to lands to protect soil health, reduce soil erosion, and protect streams from runoff. Stream impairments include excess turbidity, high nitrate concentration, high Escherichia coli and fecal coliform bacteria counts, and compromised benthic macroinvertebrate and fish assemblages.
Subwatersheds
VariableNorth ForkMiddle ForkSouth ForkOtherTotals
Total watershed area (ha)26,91113,83124,06418,25383,059
Area in agriculture (%)81.382.173.540.370.2
Tilled croplands (%)60.459.951.121.849.1
Non-tilled ag lands (%)20.922.222.418.521.1
Total BMPs2862313851841086
Area of BMPs (ha)291819784408259911,903
Agriculture lands in BMPs (%)13.317.424.935.320.4
Subwatershed lands in BMPs (ha)10.814.318.314.214.3
Number of listed stream impairments91010534
Number of impaired stream reaches433212
Table 2. Instream and riparian habitat variables were measured across the three main subwatersheds (North, Middle, and South) of the Whitewater River watershed in the summer of 2018 and 2019. Values are means with one standard deviation in parentheses. Results of single-factor ANOVAs comparing variables among subwatersheds are shown. CV = current velocity, AOV = average length of overhanging vegetation, WRB = width of riparian buffer.
VariableNorthMiddleSouthFp Value
Width (m)7 (4)7 (3)6 (3)0.150.860
Depth (cm)39 (18)36 (16)41 (16)0.700.503
Temp °C11 (4)12 (5)11 (3)1.220.302
Width/Depth7 (4)7 (4)7 (2)0.110.893
CV (cm/s)28 (21)35 (25)35 (25)1.830.170
Fines %41 (33)25 (22)43 (18)3.230.048 *
Gravel %10 (10)24 (20)30 (16)5.770.005 *
Rubble %30 (26)34 (21)21 (15)1.680.196
Boulder %9 (14)15 (21)3 (6)2.470.094
Bedrock %0.1 (0.4)0.3 (1.2)0 (0)0.770.468
Embed3 (1)2 (1)3 (1)5.150.009 *
Shade %47 (25)32 (28)29 (22)2.470.093
Riffle %21 (28)36 (39)21 (34)2.050.137
Run %55 (37)53 (39)70 (37)3.580.035 *
Pool %23 (27)11 (20)9 (16)5.580.006 *
AOV (cm)16 (18)12 (13)18 (20)1.330.273
Cover %33 (26)25 (20)20 (18)3.660.032 *
WRB (m)103 (38)127 (28)98 (37)1.120.334
Rock %8 (13)10 (13)4 (6)0.960.387
Bare soil %39 (23)30 (26)43 (28)1.610.209
Grass %37 (25)39 (27)41 (26)0.110.899
Forbs %12 (14)19 (19)12 (14)1.820.170
Shrub %1 (2)0.4 (2)1 (2)0.490.615
Tree %3 (6)2 (4)2 (5)0.810.450
Note: * Indicates p < 0.05.
Table 3. Macroinvertebrate taxa were collected within the three major subwatersheds (North, Middle, and South) of the Whitewater River watershed in 2018 and 2019.
Whitewater River Subwatersheds
PhylumOrderFamily or GenusNorthMiddleSouth
ArthropodaEphemeroptera
Baetis124646801269
Baetisca142
Caenis 21
Ephemerella16 11
Heptagenia621011
Hexagenia 1
Pseudocloeon 129
Stenonema9891
Tricorythodes 23
Plecoptera
Acroneuria 2
Isoperla 27
Pteronarcys2 7
Trichoptera
Brachycentrus531461159
Cheumatopsyche325167268
Hydropsyche108217241537
Hydroptila11410623
Lepidostoma342
Limnephilus4
Odonata
Anisoptera1 2
Zygoptera1
Coleoptera
Agabus37
Dubiraphia 3
Dytiscus12
Helichus217
Optioservus208211501
Stenelmis4827371
Megaloptera
Corydalus3
Nigronia63
Sialis 1
Diptera
Antocha26319
Atherix4022177
Chironomidae8412890760
Chrysops664
Dicranota4112199
Empididae82434
Hexatoma 4
Limnophila10711
Limonia 3
Simulium8341377
Tipula14817
Non-insects
Asellus91
Crayfish6 1
Gammarus13218981312
Water mite 1
Mollusca
Gyraulus8318
Physella37309
Sphaeriidae57105
Annelida
Leeches4686
Oligochaetes9323876
Nematomorpha
Horsehair worms12459
Totals632612,2107060
Grand total 25,596
Table 4. Fish species abundances within the three major subwatersheds (North, Middle, and South) of the Whitewater River watershed in 2018 and 2019. Values are sums of all individuals collected at all sites.
Whitewater River Subwatersheds
FamilyScientific/Common NameNorthMiddleSouth
PetromyzontidaeLethenteron appendix3 6
American brook lamprey
SalmonidaeSalvelinus fontinalis 33
Brook trout
Salmo trutta156369156
Brown trout
Oncorhynchus mykiss19 17
Rainbow trout
CyprinidaeCampostoma anomalum310147
Central stoneroller
Luxilus cornutus 1761
Common shiner
Notropis stramineus 24
Sand shiner
Chrosomus erythrogaster1578
Southern redbelly dace
Pimephales notatus 35
Bluntnose minnow
Pimephales promelas2 3
Fathead minnow
Rhinichthys obtusus40165466
Western blacknose dace
Rhinichthys cataractae738351239
Longnose dace
Semotilus atromaculatus360202957
Creek chub
CatostomidaeCatostomus commersonii312216805
White sucker
GasterosteidaeCulaea inconstans101133463
Brook stickleback
CentrarchidaeLepomis cyanellus8 51
Green sunfish
Lepomis macrochirus 1
Bluegill
PercidaeEtheostoma flabellare95191068
Fantail darter
Etheostoma nigrum302176295
Johnny darter
CottidaeCottus bairdii 7801
Mottled sculpin
Cottus cognatus393 92
Slimy sculpin
253324764965
Total 9974
Table 5. Benthic macroinvertebrate variables were assessed across the three main subwatersheds (North, Middle, and South) of the Whitewater River watershed in the summer of 2018 and 2019. Values are means, with one standard deviation in parentheses. Results of single-factor ANOVAs comparing variables among subwatersheds are shown.
MetricNorth MiddleSouthFp Value
IBI Score19 (10)17 (8)19 (8)0.200.82
Total90 (64)159 (136)109 (93)2.350.10
Taxa8 (3)8 (2)9 (1)1.850.17
Taxa per 10013 (8)9 (6)13 (9)2.050.14
Plecoptera0 (0)0 (0)2 (1)3.590.03 *
Trichoptera2 (1)2 (1)2 (1)2.100.13
Diptera1 (1)2 (1)2 (1)2.850.07
Long-lived taxa1 (1)1 (1)1 (0)1.700.19
Intolerant spp1 (1)1 (0)1 (1)1.570.22
Filterer spp3 (1)3 (1)2 (1)1.680.20
Plecoptera %0 (0.1)0 (0.12)0.4 (1)4.680.01 *
Predator %3 (3)3 (5)8 (8)2.530.09
Long lived %2 (3)0.6 (0.8)1.1 (1.4)6.140.004 *
Note: * Indicates p < 0.05.
Table 6. Coldwater IBI scores and metrics used to calculate scores, as measured across the three main subwatersheds (North, Middle, and South) of the Whitewater River watershed in the summer of 2018 and 2019. Values are means with one standard deviation in parentheses. Results of single-factor ANOVAs comparing metrics among subwatersheds are shown.
MetricNorthMiddleSouthFp Value
IBI score28 (18)52 (31)14 (17)15.12<0.0001 *
Total fish/150 m121 (106)126 (50)236 (225)3.870.03 *
Number of spp6 (2)6 (3)10 (2)13.62<0.0001 *
Taxa/100 fish9 (6)5 (2)7 (5)3.070.054
Number of coldwater spp2 (1)2 (1)2 (1)2.090.132
Number of minnow spp2 (1)2 (2)5 (2)19.23<0.0001 *
Number of benthic spp3 (1)3 (2)4 (1)0.250.776046
Number of tolerant spp2 (1)2 (1)4 (1)26.49<0.0001 *
% as brook trout0 (0)5 (21)0 (0)1.170.317
% intolerant individuals9 (14)35 (27)2 (6)14.94<0.0001 *
% coldwater individuals29 (28)58 (34)20 (25)6.130.004 *
% white suckers16 (16)10 (9)18 (10)2.840.066
% top carnivores8 (10)22 (25)8 (12)2.950.060
Coldwater individuals/150 m32 (42)65 (44)35 (59)2.640.080
Warmwater individuals/150 m89 (83)61 (59)201 (227)5.280.008 *
Note: * Indicates p < 0.05.
Table 7. Stream habitat and biotic variables important in characterizing biplot clusters of Whitewater River sites. Values are medians for each cluster, and p values indicate the significance of differences among clusters based on Kruskal-Wallis tests. AOV = average length (cm) of overhanging bank vegetation (grasses and forbs).
VariableCluster 1 (Good)Cluster 2 (Moderate)Cluster 3 (Poor)p Value
% bank grass36.764.312.1<0.001
% bank bare soil18.717.866.0<0.001
Embed. score1.43.12.9<0.001
% fines6.740.838.3<0.001
Width-to-depth ratio0.30.10.2<0.001
% intolerant fish38.502.2<0.001
% shade286.771<0.001
% riffle50.013.316.3<0.001
% rubble58.317.523.30.001
% bank rock16.30.00.5<0.001
Fish taxa per 1004.55.59.70.001
AOV16.622.13.6<0.001
Table 8. Characterizations and defining qualities for each biplot cluster of Whitewater River stream sites.
ClusterCharacterizationDefining Qualities
1Good qualityLow embeddedness; high % riffle; high % rubble substrate; high % intolerant fish; high % bank rock; low % fines; high width:depth ratio
2Moderate qualityLow width:depth ratio; high % bank grass; high % fines; long overhanging vegetation; low % bank bare soil; high embeddedness; low shade; low % riffle
3Poor qualityHigh % bank bare soil; high fish diversity; high % fines; high shade; high embeddedness; low % riffle
Disclaimer/Publisher’s Note: The statements, opinions and data contained in all publications are solely those of the individual author(s) and contributor(s) and not of MDPI and/or the editor(s). MDPI and/or the editor(s) disclaim responsibility for any injury to people or property resulting from any ideas, methods, instructions or products referred to in the content.

