
Health Risk Appraisal of Trace Elements in Groundwater in an Urban Area: A Case Study of Sichuan Basin, Southwest China


1
Sichuan Hua Di Building Engineering Co., Ltd., Chengdu 610081, China
2
Sichuan Province Engineering Technology Research Center of Geohazard Prevention, Chengdu 610081, China
3
Yibin Research Institute, Southwest Jiaotong University, Yibin 644000, China
*
Author to whom correspondence should be addressed.
Water 2023, 15(24), 4286; https://0-doi-org.brum.beds.ac.uk/10.3390/w15244286
Submission received: 20 November 2023
/
Revised: 10 December 2023
/
Accepted: 12 December 2023
/
Published: 15 December 2023
(This article belongs to the Topic Groundwater Pollution Control and Groundwater Management)
Abstract
:Intense anthropogenic activities pose a serious threat to groundwater quality in urban areas. Assessing pollution levels and the health risks of trace elements within urban groundwater is crucial for protecting the groundwater environment. In this study, the heavy metal pollution index (HPI) and health risk assessment were conducted to analyze trace element pollution levels and the non-carcinogenic and carcinogenic risks of groundwater resources in Sichuan Basin, SW China, based on the hydrochemical results of 114 groundwater samples. The HPI results displayed that 14.92% of groundwater samples were contaminated, primarily attributed to anthropogenic influence. The health risk assessment indicated that children faced the highest non-carcinogenic risk while adults had the highest carcinogenic risk. The Monte Carlo simulation further enhanced the reliability of the health risk model. A sensitivity analysis indicated that Pb was the most sensitive element affecting both non-carcinogenic and carcinogenic risks. The achievements of this research would provide a basis for groundwater management in urban areas.
1. Introduction
Groundwater is regarded as one of the primary freshwater sources due to its wide distribution, safety, and clean properties [1,2]. Due to intense anthropogenic activities by increasing urbanization, groundwater quality is degrading worldwide [3]. Urban groundwater is often contaminated by industry and municipal sewage [4]. Heavy metals, such as Manganese (Mn), Copper (Cu), Zinc (Zn), and Lead (Pb), and toxic elements, such as Arsenic (As), are easily enriched in the groundwater of industrial areas, causing health diseases like poisoning, skin abnormalities, and cancer [5,6]. Hence, it is of great benefit to analyze the pollution level and health risks of contaminated groundwater in urban areas.
Trace elements are vital to human health in appropriate quantities but can be harmful to the body in excessive consumption [7]. Iron (Fe) is an important component of hemoglobin and is no danger to health [8]. Exposure to excessive Mn, Cu, Zn, As, and Pb contents will lead to serious health issues [9,10,11,12,13]. Ascertaining the quality of groundwater in terms of heavy metals is necessary for ensuring water security. The heavy metal pollution index (HPI) was usually used to calculate the collective pollution effect of heavy metals [14,15]. Nowadays, the health risk model proposed by the United States Environmental Protection Agency (USEPA) is a popular approach for health risk appraisal [16]. Increasing research has focused on assessing health risks caused by trace elements in groundwater [17,18,19]. Health risk evaluation is divided into non-carcinogenic risk and carcinogenic risk based on the toxicity of chemical elements. However, there is significant uncertainty due to large variations in age, weight, eating habits, and parameter selection among individuals and calculations. Ignoring uncertainty in health risk assessment will lead to wrong results [3]. To solve this scientific problem, the Monte Carlo method was adopted to calculate uncertainty, making the risk model robust [20,21,22]. Monte Carlo simulation is a widely used method due to its flexibility and high efficiency. In addition, the sensitivity of health risk parameters was analyzed by the Sobol method [1,23,24]. This approach can deal with nonlinear data and provide a comprehensive analysis of global sensitivity [25].
The Sichuan Basin of southwestern China has flat terrain, fertile soil, and a large population. Research on the groundwater quality and health risks within the basin is of great significance to sustainable groundwater exploitation. However, existing studies mainly focused on nitrate pollution in the basin [26,27,28,29], and scarce studies focus on the contamination of trace elements. The objective of this research is to (1) clarify the pollution level and spatial distribution of trace elements; (2) evaluate the non-carcinogenic and carcinogenic risk for infants, children, and adults; and (3) analyze the uncertainty and sensitivity of the health risk model. The achievements of this study would make a vital contribution to groundwater management and protection in urban areas.
2. Materials and Methods
2.1. Study Area
The study area is situated in the northwest Sichuan basin, covering an area of 235.26 km2 (Figure 1). In the study area. the annual average temperature is 16.43 °C and the annual average precipitation is 1485.1 mm. The topography of the study area is a valley, which is high on the northwest and southeast sides and low in the middle. The strata exposed in the study area include the Quaternary sediments and Jurassic to Cretaceous sandstone and mudstone. The aquifers consist of the Quaternary pore aquifer and Jurassic to Cretaceous pore and fissure aquifers. The groundwater level is shallow, with a depth of 5 to 20 m. Groundwater is recharged by atmospheric precipitation and discharged as springs in the local area. Agriculture is the primary industry of the study area, with rice fields covering 104 km2. Residential areas, industrial parks, and other artificial surfaces are distributed, accounting for 16% of the total study area. Forests and grasslands are continuously distributed on both sides of the study area.
2.2. Sample Collection and Laboratory Testing
In the present study, a total of 114 groundwater samples were collected from 37 domestic wells in the study area in the wet, normal, and dry seasons of 2022. After 15 min of pumping wells, groundwater samples were bottled in pre-washed bottles. Meanwhile, the parameters of pH, total dissolved solids (TDS), and temperature were detected by a portable apparatus (WTW multi 3400i). The samples were finally measured by the laboratory of the Sichuan Bureau of Geology and Mineral Resources. Cation and anion contents were measured by ion chromatography (IC6100; Wayee, China). Each groundwater sample was tested three times to ensure accuracy. The precisions of laboratory testing for Mn, Fe, Cu, Zn, As, and Pb were 0.00012 mg/L, 0.00082 mg/L, 0.00008 mg/L, 0.00067 mg/L, 0.0003 mg/L, and 0.00009 mg/L. The charge balance was lower than 5%.
2.3. HPI
The heavy metal pollution index (HPI) was an effective method for evaluating heavy metal pollution [30]. The appraisal scores of the groundwater samples were calculated based on arithmetic weighted average value as Equation (1) [31]. The weight (Wi) of heavy metals is the inverse of the standard value Si (Equation (2)). Class III in the Chinese standard [32] was determined to be Si (Table 1). The quality level index (Qi) is calculated from the measured concentration Ci and Si (Equation (3)).
2.4. Health Risk Assessment
Heavy metals and toxic elements in groundwater can infiltrate the human body, causing harm to vital organs such as the brain, heart, and kidneys. A comprehensive model proposed by the USEPA has been applied to quantify human health risks [34]. The chronic daily intake (CDI) of trace elements for humans is determined by ion concentrations and various exposure parameters as Equation (4). The hazard quotient (HQ) is the risk caused by a single non-carcinogenic element (Mn, Cu, Zn, Pb, or As) (Equation (5)). The hazard index (HI) represents the total non-carcinogenic element (Equation (7)). The cancer risk (CR) resulting from lifetime exposure to Pb and As is calculated using Equation (6). Considering the physiological differences of various peoples, the population is categorized into three groups: infants (<6 months), children (6 months–17 years), and adults (>17 years) [35]. The exposure parameters for both the non-carcinogenic and carcinogenic models are presented in Table 2 and Table 3.
According to the HI, groundwater samples were divided into 2 grades: suitable (≤1) and not suitable (>1) for drinking water.
According to the CR, groundwater samples were divided into 5 grades: very suitable (<10−6), suitable (1 × 10⁻⁶–1 × 10⁻⁵), should be considered as drinking water (1 × 10⁻⁵–1 × 10⁻⁴), safety measures should be taken (1 × 10⁻⁴–1 × 10⁻³), and not suitable (>1 × 10⁻³) for drinking water.
2.5. Monte Carlo Simulation
In traditional health risk assessment, hydrochemical data were gathered from a restricted number of sampling sites, which led to the uncertainty of the sampling process. In addition, exposure parameters were usually considered as fixed values, resulting in uncertainty in the parameter selection [1]. To address this uncertainty, the Monte Carlo approach was employed in the health risk model. In this study, the libraries of Numpy [36] and Scipy [37] in Python 3.10 were adopted to achieve Monte Carlo simulation. To assure precision, the simulation time was set to 10,000.
2.6. Sensitivity Analysis
Sobol’s method, suggested by Sobol in 1993, was widely used to conduct the global sensitivity analysis [24]. This method is based on the variance decomposition methodology. The total variance was divided into the sum of the variance of a single parameter and the variance of multiple parameter interactions [38]. It has the ability to process nonlinear data. To implement Sobol’s method, the SALib library in Python 3.10 was utilized [39].
3. Results
3.1. Statistical Results
The statistical results were presented in Table 4 and Figure 2, respectively. The pH exhibited a range of 6.81 to 8.63. The mean concentrations of trace elements, in descending order, were as follows: Mn (109.46 μg/L) > Fe (70.09 μg/L) > Zn (12.83 μg/L) > Cu (2.12 μg/L) > As (1.51 μg/L) > Pb (0.24 μg/L). Notably, 13.16% and 5.26% of groundwater samples exceeded the Chinese drinking water guidelines for Mn (n = 15) and Fe (n = 6), respectively. Furthermore, Mn and Fe exhibited high coefficients of variation (CV), suggesting that their concentrations were influenced by abnormal human activities or specific geological settings.
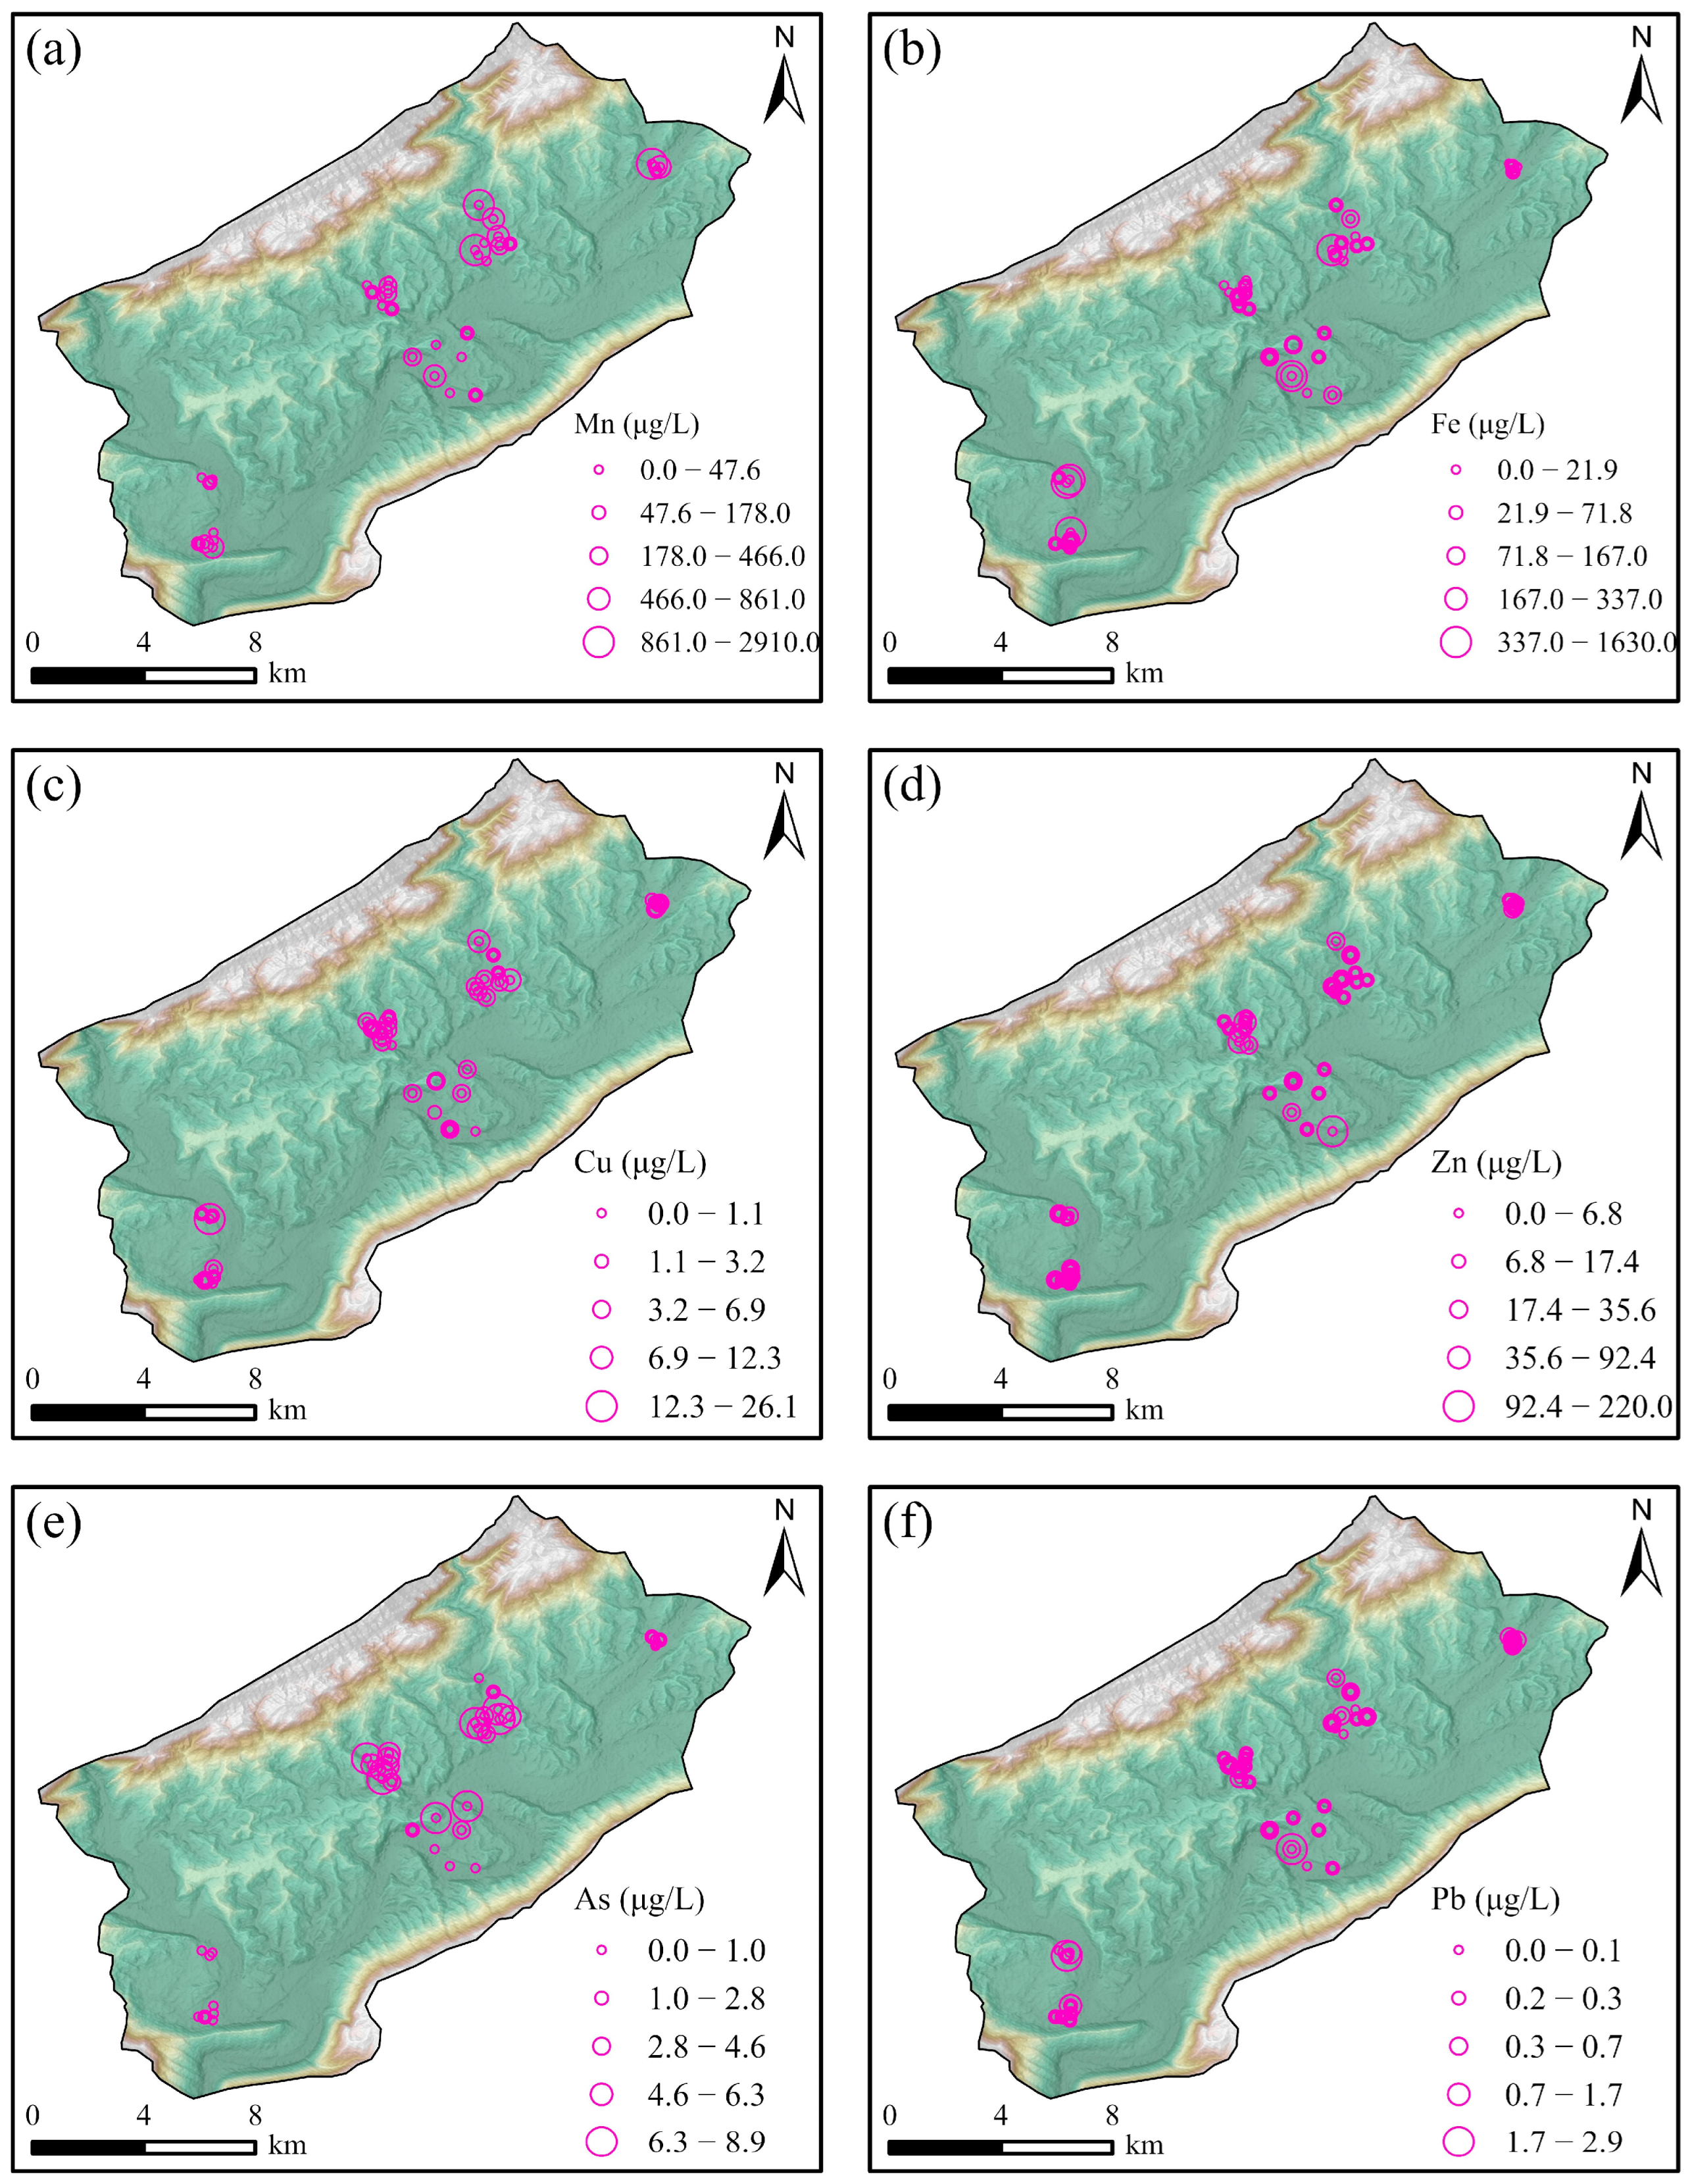
3.2. Distribution of Trace Elements
The Mn presented the highest concentration and CV value, which exceeded the Chinese limit of 100 μg/L. The samples with high Mn concentrations were situated in the northeastern part (Figure 3a), posing a significant potential risk to nearby residents. Following Mn, Fe concentrations exceeded the Chinese limit of 300 μg/L, respectively, ranked second in terms of concentration. Notably, high Fe concentrations were observed in the central and northeastern parts of the study area (Figure 3b).
The concentrations of Cu were all below the limit of 1000 μg/L. The relatively high values of Cu were located southeast of the study area (Figure 3c). Zn had minimal outliers (number = 4) and was slightly contaminated. The highest Zn content (220 μg/L) was distributed near the river (Figure 3d). The maximum As concentration was very close to the standard value. The distribution map of As presented that the samples situated near the city center had the highest concentrations (Figure 3e). Pb displayed the lowest concentration compared with other trace elements (Figure 3f). High Pb concentrations were distributed near the rivers.
The central and northeastern parts of the study area were mainly covered by artificial surfaces. The high levels of trace elements were distributed in the central and northeastern parts of the study area (Figure 3). This indicated that urban activities have led to an increase in the concentrations of chemical elements. For example, petrol contains lead, which can contaminate soil and groundwater. Industrial sewage increases the concentrations of heavy metals in groundwater.
High Mn concentrations harm the health status of the nervous system [9]. Exposure to excessive Cu content can affect cellular activities [10]. Exposure to high Zn concentrations will cause gastrointestinal disorders [11]. Long-term intake of arsenic will cause abnormal skin and can even cause skin cancer [12]. Excessive Pb will damage the central nervous system [13]. Therefore, knowing the pollution level and potential health risks of trace elements within groundwater is fundamental to developing pollution prevention policies and protecting human health.
4. Discussion
4.1. Pollution Level
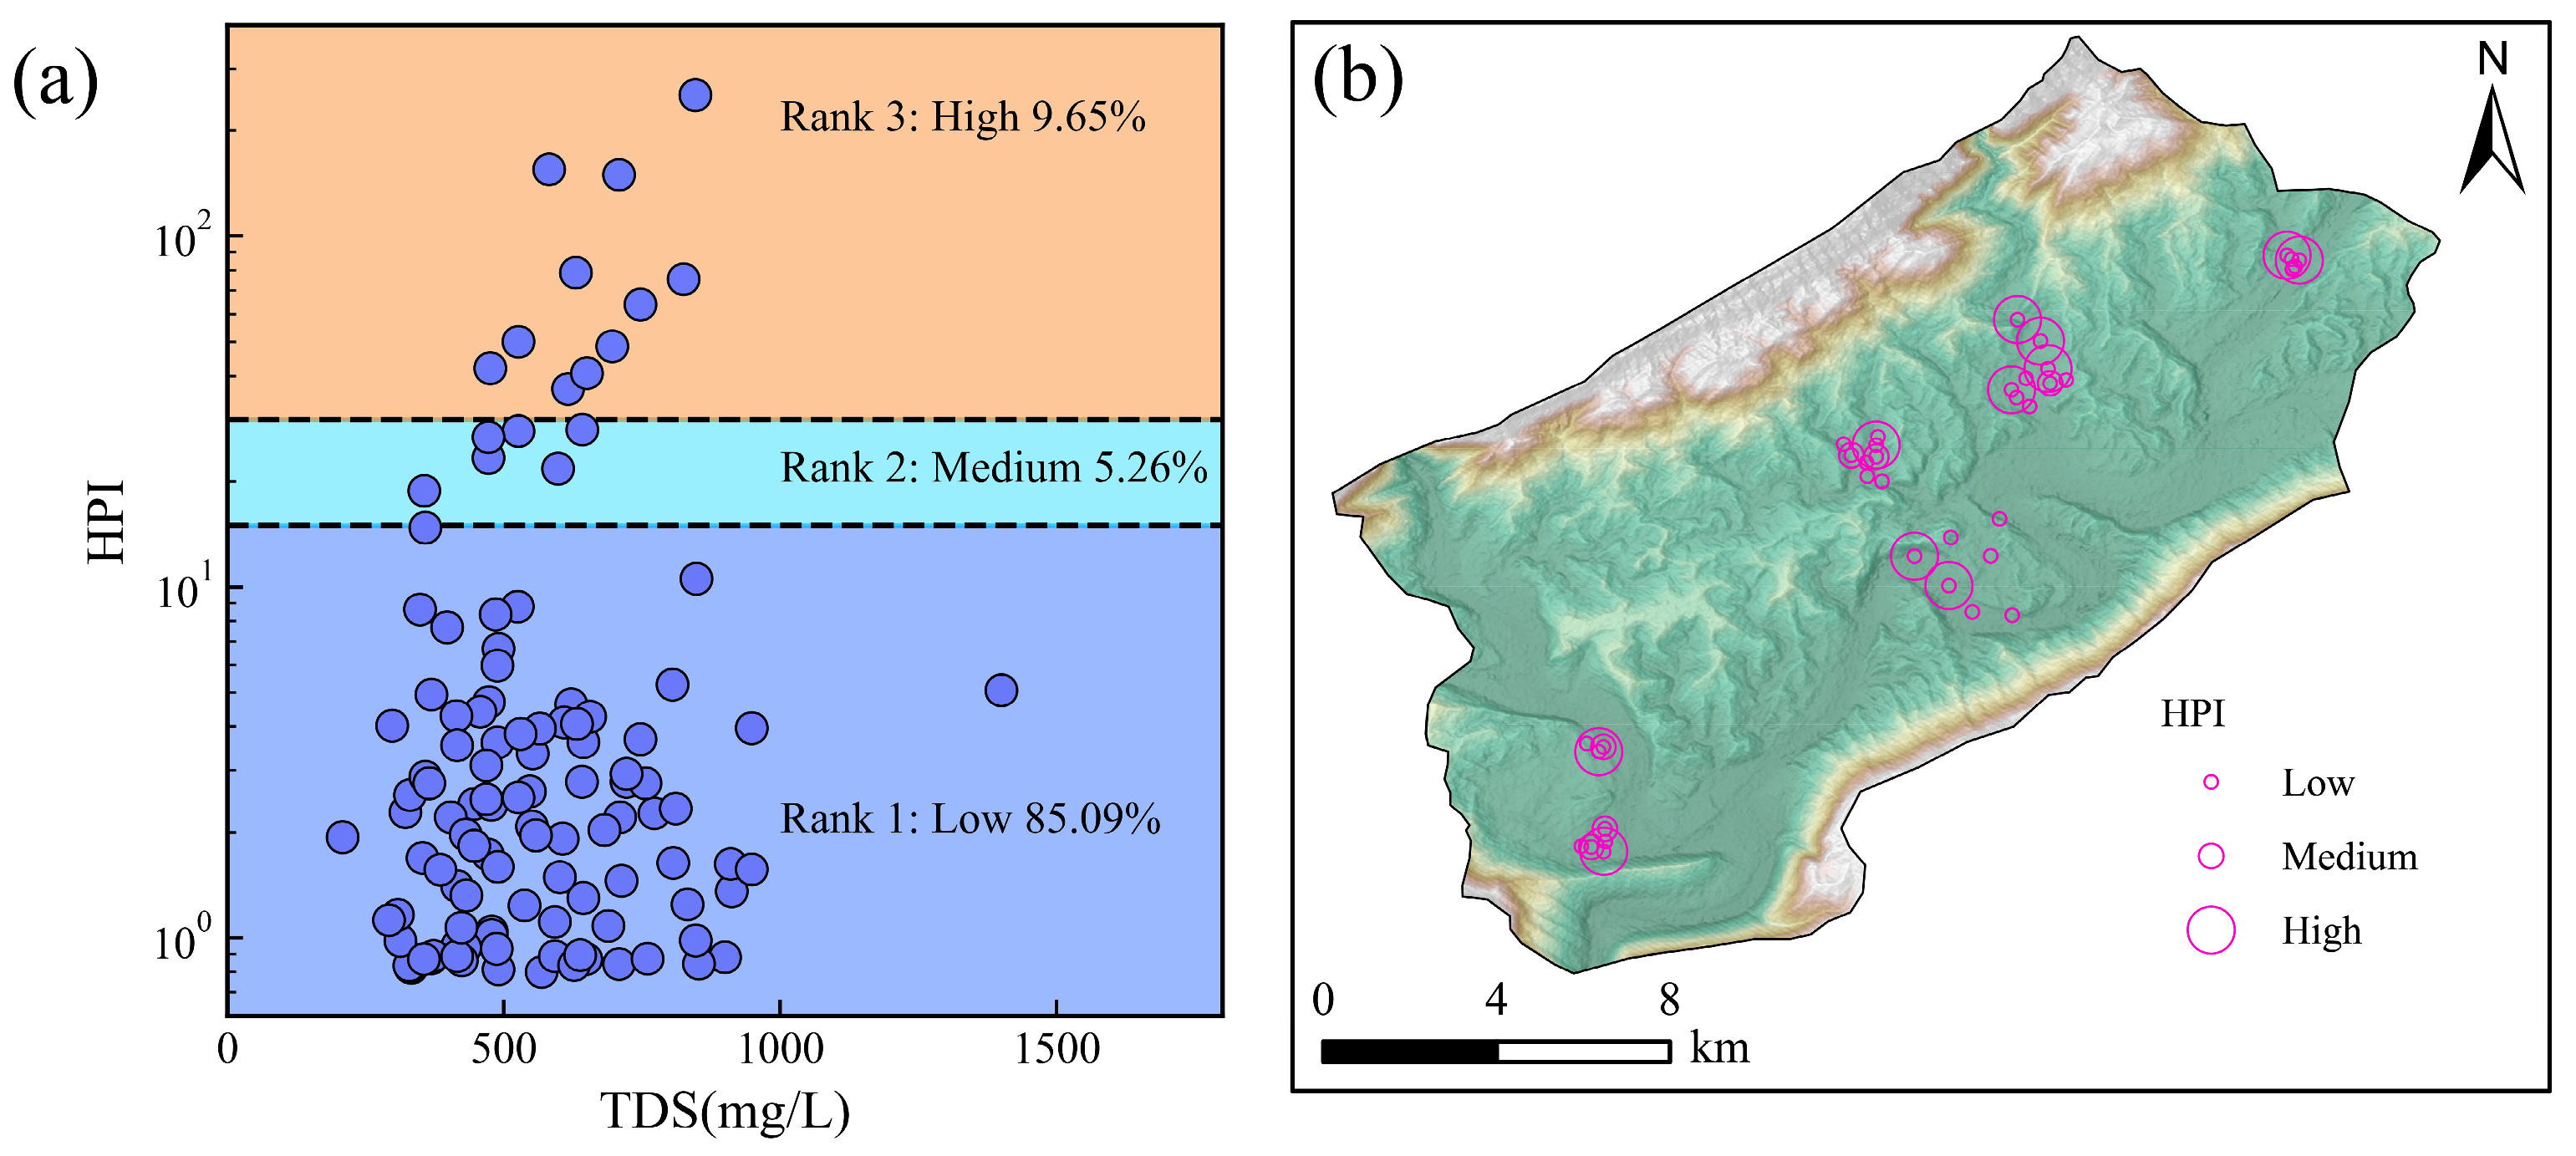
Compared with other trace elements, the weight and normalized weight of Pb were the highest in the HPI computation (Table 1). This is because Pb is a toxic chemical element. Even under low exposure levels, Pb would pose harmful effects on human health. The HPI values ranged from 0.80 to 253.49, with an average value of 12.30 (Figure 4a). A total of 85.69% of samples were categorized as low pollution, which was safe for humans to utilize and drink. A total of 5.26% of samples were medium pollution, which can be drunk after purification. A total of 9.65% of samples were high pollution, which was too seriously contaminated to be drunk by humans.
Most elevated pollution samples were distributed in the central and northeastern part of the study area (Figure 4b). Residual elevated pollution samples were situated southwest of the study area. The levels of heavy metal pollution in groundwater were closely related to the intensity of urban activities (Figure 1). More importantly, the groundwater flowed majorly from northeast to southwest (Figure 1). Therefore, the southwestern part is easily contaminated by heavily polluted groundwater in the central and northeastern parts. It is important to monitor groundwater in the central and northeastern parts.
4.2. Health Risk Evaluation
The ingestion of groundwater contaminated with trace elements poses significant threats to human health [40,41]. Elevated levels of Mn, Cu, Zn, As, and Pb can create non-carcinogenic risks, including central nervous effects, decreased blood enzymes, gastrointestinal system irritation, hyperpigmentation, keratosis, and possible vascular complications. Furthermore, exposure to As and Pb has been linked to the development of multiple internal organ cancers (respiratory system, liver, kidney, lung, and bladder). Therefore, this study conducted comprehensive assessments, encompassing both non-carcinogenic risk evaluation (for Mn, Cu, Zn, As, and Pb) and carcinogenic risk appraisal (specifically for As and Pb).
4.2.1. Non-Carcinogenic Risk
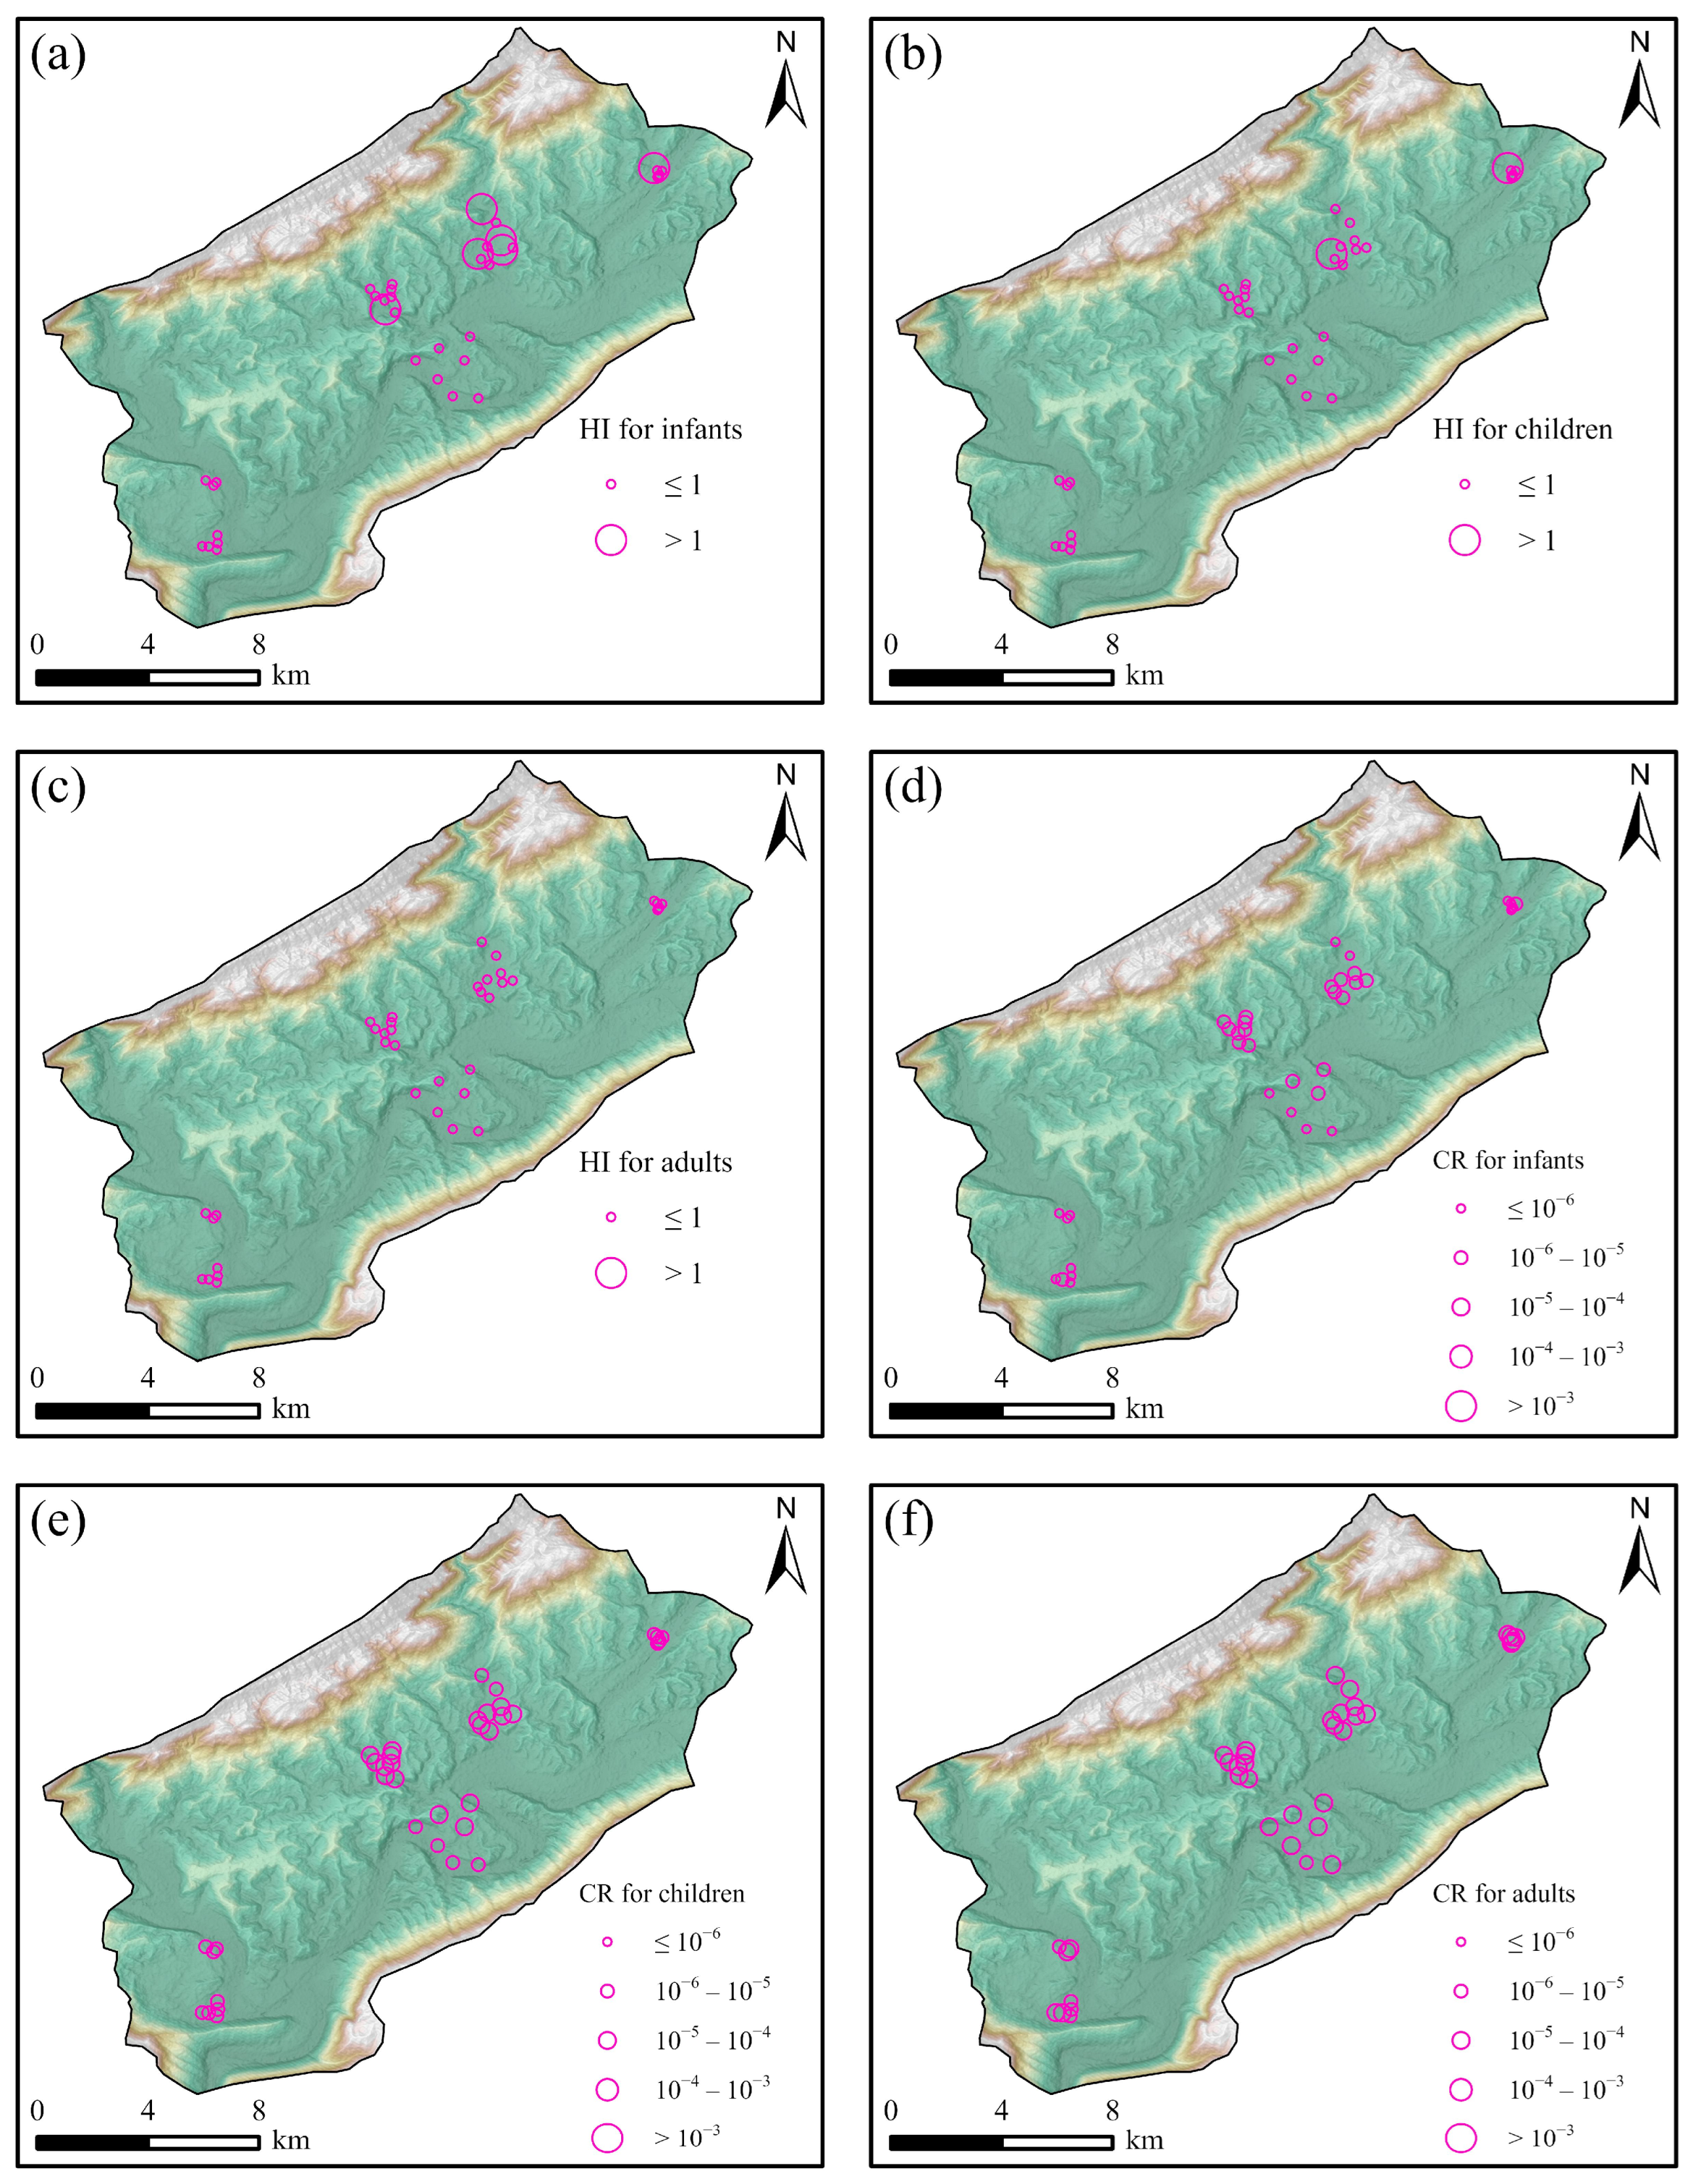
Generally, non-carcinogenic risks do not lead to cancer directly but are particularly capable of bringing toxicity to human health. The study identified significant distinctions in non-carcinogenic risks among their demographic groups (Figure 5a–c). On average, infants presented a greater health risk (0.66), adults exhibited the lowest health risk (0.41), and children fell in the middle (0.22). Additionally, the rate of exceedance (HI > 1) for infants, children, and adults was 15.79%, 5.26%, and 0%, respectively. These findings underscore the adverse effects of Mn, Cu, Zn, As, and Pb on both infants and children. Notably, infants presented the highest health risk based on both the average value and the rate of exceedance for the HI.
It is well known that infants are lighter than children and adults in weight. Consequently, the enzyme metabolism ability in infants was extremely inadequate, leading to a diminished ability to process toxic substances effectively [27,42]. As a result, the infants had the worst HI values, which should be further examined. The areas that caused non-carcinogenic risks were mainly distributed in the central and northeastern parts. In particular, the city center posed more non-carcinogenic risks for infants. Hence, it is advisable to designate these areas as crucial monitoring targets.
4.2.2. Carcinogenic Risk
The CR of groundwater samples that were assessed for infants, children, and adults, were presented in Table 5 and Figure 5. For infants, the CR ranged from 4.4 × 10⁻⁷ to 3 × 10⁻⁶, with an average value of 2 × 10⁻⁶. Account for 47.37% of the samples had CR values below 10−6, indicating a low risk. The remaining 52.63% fell within the range of 10−6–10−5. Therefore, the groundwater in the study area was considered safe for the infants, with a negligible cancer risk.
For children, the range of the CR was 3.26 × 10⁻⁶–2.5 × 10⁻⁵ with a mean value of 1.1 × 10⁻⁵. 52.63% and 47.37% of possible exposure processes were classified as suitable to drink and categorized as “need caution”, respectively. This suggests that approximately half of the samples, notably those located near the central part of the study area, warrant focus attention (Figure 6).
For adults, the CR values ranged between 8.67 × 10⁻⁶ and 6.7 × 10⁻⁵, with a mean value of 3 × 10⁻⁵. Only 13.16% of samples were deemed suitable for drinking, while the remaining 86.74% of samples posed cancer risks, particularly those located near the central part (Figure 6). The automobile industry produces a lot of sewages containing Pb and As. The discharge of industrial sewages with Pb and As into groundwater may result in high Pb and As concentrations. The average order of CR for different age groups was adults (3 × 10⁻⁵) > children (1.1 × 10⁻⁵) > infants (1.5 × 10⁻⁶). This order can be attributed to the long exposure duration of adults (ED = 30 years) to carcinogens compared to children (ED = 6 years) and infants (ED = 0.5 years).
4.3. Uncertainty Analysis
To assess the uncertainty associated with parameter selection and sampling in the process, Monte Carlo simulation was employed to simulate hazardous substances and their respective parameters using statistical parameters (Table 6). The distribution type of Mn, Cu, Zn, Pb, and As was examined through the K-S test in Python. Meanwhile, the distribution type of EF was referenced from a previous study [43].
The simulated health risk exhibited a conformity with lognormal distribution (Figure 7). Analysis of the HI revealed the percentage of simulated values exceeding 1 for infants, children, and adults at 15.29%, 8.05%, and 3.07%, respectively (Figure 7a–c). In comparison with the deterministic non-carcinogenic risk (Figure 6a–c), the mean of simulated HI, and the over-standard rate demonstrated a close alignment, indicating minimal uncertainty in the HI.
Examining the percentage of simulated carcinogenic risk (CR) exceeding 1 for infants, children, and adults (Figure 7d–f) yielded values of 0%, 0.14%, and 2.93%, respectively. Notably, the simulated CR values surpassed the actual values depicted in Figure 6d–f. This discrepancy can be attributed to the incorporation of uncertainties associated with health risks during groundwater sampling and parameter selection. The simulation process contributed to a more robust health risk analysis by capturing and integrating the inherent uncertainties in these phases.
4.4. Sobol Sensitivity Analysis
The Sobol method was used to identify the impact of dynamic parameters associated with health risk on HI and CR across diverse populations (Figure 8). Among the factors investigated, namely EF; IR; BW; and concentrations of Pb, As, Zn Cu, and Mn, it was observed that Pb concentration exerted the most substantial influence on both HI and CR. Additionally, EF contributed approximately 8% of the overall effect, followed by IR and BW.
The sensitivity analysis, when ordered by age group, revealed that the sensitivity of the HI was highest in infants, followed by children and adults. Conversely, the sensitivity order of CR exhibited a different pattern, with adults being the most sensitive, followed by children and infants. These findings underscore the significance of age-specific considerations in assessing health risks associated with groundwater contamination.
Pb concentration is a key factor affecting groundwater health. Addressing the source of Pb and reducing its concentration in groundwater could effectively mitigate health risks. Consequently, strategies aimed at minimizing the intake of groundwater contaminated by hazardous substances are crucial for safeguarding the health of the population in this region.
4.5. Measures for the Security of Groundwater Quality
Based on the results of the health risks, the following recommendations are proposed:
- (1)
- For industrial zones, it is advisable to establish focal monitoring sites and enhance surveillance of industrial wastewater, particularly for hazardous substances such as Pb and As.
- (2)
- Considering the heightened susceptibility of individuals in lower age groups to non-carcinogenic risks, additional protective measures are suggested. These may include implementing safety restrictions in children’s recreational areas to minimize their exposure to pollution sources.
- (3)
- Residents are encouraged to consume purified drinking water to mitigate the accumulation of carcinogenic risks.
5. Conclusions
In this study, a comprehensive analysis of trace elements in 134 groundwater samples from a typical urban area was conducted, encompassing heavy metal pollution assessment, health risk evaluation, uncertainty analysis, and sensitivity analysis. The principal findings and conclusions are illustrated as follows:
- (1)
- A substantial majority, specifically 85.09% of groundwater samples exhibited no signs of pollution. However, 5.26% and 9.65% of samples ranked as medium and high levels in the HPI, respectively. Areas with heavy contamination were identified in the central and northeastern regions of the study area. Highly contaminated groundwater should be paid more attention.
- (2)
- The rates of HI exceeding 1 were observed in 15.97%, 5.26%, and 0% of cases for infants, children, and adults, respectively. The percentages of CR surpassing 1 × 10⁻⁴ were all 0% for infants, children, and adults. The health risk appraisal mean values indicated the highest non-carcinogenic risk to infants and notable carcinogenic risk to adults. More importantly, the uncertainty analyses revealed results that complemented the absence of risk in the actual risk assessments, thereby enhancing the robustness of the calculations.
- (3)
- The Pb was the most influential indicator in health risk calculations. Small variations in lead levels were found to result in significant fluctuations in health risk outcomes. Following Pb, EF emerged as the second most sensitive indicator, reflecting the influence of dietary habits on health risks. Higher frequencies of intake were associated with elevated health risks.
Author Contributions
Conceptualization, Z.Y.; data curation, X.H.; formal analysis, R.Y.; investigation, Z.Y.; methodology, R.Y.; software, R.Y.; supervision, Y.Y.; validation, X.H. and Y.Y.; writing—original draft, Z.Y.; writing—review and editing, Y.Y. All authors have read and agreed to the published version of the manuscript.
Funding
This research was funded by the Yibin government, grant number SWJTU2021020007, SWJTU2021020008.
Data Availability Statement
The data presented in this study are available upon request from the corresponding author.
Conflicts of Interest
Author Zhongyou Yu was employed by the company Sichuan Hua Di Building Engineering Co., Ltd. The remaining authors declare that the research was conducted in the absence of any commercial or financial relationships that could be construed as a potential conflict of interest.
References
- Gao, Y.; Qian, H.; Zhou, Y.; Chen, J.; Wang, H.; Ren, W.; Qu, W. Cumulative health risk assessment of multiple chemicals in groundwater based on deterministic and Monte Carlo models in a large semiarid basin. J. Clean. Prod. 2022, 352, 131567. [Google Scholar] [CrossRef]
- Wang, Y.; Yuan, X.; Zhang, Y.; Zhang, X.; Xiao, Y.; Duo, J.; Huang, X.; Sun, M.; Lv, G. Hydrochemical, D–O–Sr isotopic and electromagnetic characteristics of geothermal waters from the Erdaoqiao area, SW China: Insights into genetic mechanism and scaling potential. Ore Geol. Rev. 2023, 158, 105486. [Google Scholar] [CrossRef]
- Feng, B.; Ma, Y.; Qi, Y.; Zhong, Y.; Sha, X. Health risk assessment of groundwater nitrogen pollution in Yinchuan plain. J. Contam. Hydrol. 2022, 249, 104031. [Google Scholar] [CrossRef]
- Marghade, D. Detailed geochemical assessment & indexing of shallow groundwater resources in metropolitan city of Nagpur (western Maharashtra, India) with potential health risk assessment of nitrate enriched groundwater for sustainable development. Geochemistry 2020, 80, 125627. [Google Scholar] [CrossRef]
- Zhu, Y.; Yang, Q.; Wang, H.; Yang, J.; Zhang, X.; Li, Z.; Martín, J.D. A hydrochemical and isotopic approach for source identification and health risk assessment of groundwater arsenic pollution in the central Yinchuan basin. Environ. Res. 2023, 231, 116153. [Google Scholar] [CrossRef]
- World Health Organization. Guidelines for Drinking-Water Quality: Fourth Edition Incorporating the First Addendum; World Health Organization: Geneva, Switzerland, 2017.
- Li, P.; Wu, J.; Qian, H.; Lyu, X.; Liu, H. Origin and assessment of groundwater pollution and associated health risk: A case study in an industrial park, northwest China. Environ. Geochem. Health 2014, 36, 693–712. [Google Scholar] [CrossRef]
- Podgorski, J.; Araya, D.; Berg, M. Geogenic manganese and iron in groundwater of Southeast Asia and Bangladesh—Machine learning spatial prediction modeling and comparison with arsenic. Sci. Total Environ. 2022, 833, 155131. [Google Scholar] [CrossRef]
- Rushdi, M.I.; Basak, R.; Das, P.; Ahamed, T.; Bhattacharjee, S. Assessing the health risks associated with elevated manganese and iron in groundwater in Sreemangal and Moulvibazar Sadar, Bangladesh. J. Hazard. Mater. Adv. 2023, 10, 100287. [Google Scholar] [CrossRef]
- Cai, L.-M.; Wang, Q.-S.; Luo, J.; Chen, L.-G.; Zhu, R.-L.; Wang, S.; Tang, C.-H. Heavy metal contamination and health risk assessment for children near a large Cu-smelter in central China. Sci. Total Environ. 2019, 650, 725–733. [Google Scholar] [CrossRef]
- Traven, L.; Marinac-Pupavac, S.; Žurga, P.; Linšak, Ž.; Žeželj, S.P.; Glad, M.; Linšak, D.T.; Cenov, A. Arsenic (As), copper (Cu), zinc (Zn) and selenium (Se) in northwest Croatian seafood: A health risks assessment. Toxicol. Rep. 2023, 11, 413–419. [Google Scholar] [CrossRef]
- Alarcón-Herrera, M.T.; Martin-Alarcon, D.A.; Gutiérrez, M.; Reynoso-Cuevas, L.; Martín-Domínguez, A.; Olmos-Márquez, M.A.; Bundschuh, J. Co-occurrence, possible origin, and health-risk assessment of arsenic and fluoride in drinking water sources in Mexico: Geographical data visualization. Sci. Total Environ. 2020, 698, 134168. [Google Scholar] [CrossRef]
- Guan, Q.; Wang, F.; Xu, C.; Pan, N.; Lin, J.; Zhao, R.; Yang, Y.; Luo, H. Source apportionment of heavy metals in agricultural soil based on PMF: A case study in Hexi Corridor, northwest China. Chemosphere 2018, 193, 189–197. [Google Scholar] [CrossRef] [PubMed]
- Zainudin, A.M.i.; Zulkefli, S.N.; Looi, L.J.; Aris, A.Z.; Sefie, A.; Isa, N.M. Spatial and temporal evaluation of groundwater hydrochemistry in an active phreatic zone of developed basin in selangor, Malaysia. Appl. Geochem. 2023, 154, 105656. [Google Scholar] [CrossRef]
- Singh, K.K.; Tewari, G.; Kumar, S.; Busa, R.; Chaturvedi, A.; Rathore, S.S.; Singh, R.K.; Gangwar, A. Understanding urban groundwater pollution in the Upper Gangetic Alluvial Plains of northern India with multiple industries and their impact on drinking water quality and associated health risks. Groundw. Sustain. Dev. 2023, 21, 100902. [Google Scholar] [CrossRef]
- USEPA. Exposure Factors Handbook (2011 Edition); United States Environmental Protection Agency: Washington, DC, USA, 2011.
- Vasseghian, Y.; Almomani, F.; Dragoi, E.-N. Health risk assessment induced by trace toxic metals in tap drinking water: Condorcet principle development. Chemosphere 2022, 286, 131821. [Google Scholar] [CrossRef]
- Hossain, M.; Patra, P.K. Contamination zoning and health risk assessment of trace elements in groundwater through geostatistical modelling. Ecotoxicol. Environ. Saf. 2020, 189, 110038. [Google Scholar] [CrossRef]
- Rashid, A.; Ayub, M.; Bundschuh, J.; Gao, X.; Ullah, Z.; Ali, L.; Li, C.; Ahmad, A.; Khan, S.; Rinklebe, J.; et al. Geochemical control, water quality indexing, source distribution, and potential health risk of fluoride and arsenic in groundwater: Occurrence, sources apportionment, and positive matrix factorization model. J. Hazard. Mater. 2023, 460, 132443. [Google Scholar] [CrossRef] [PubMed]
- Nj, A.; Kh, B.; Am, C.; Hk, C.; Aam, D.; Goc, E. Non-carcinogenic risk assessment of exposure to heavy metals in underground water resources in Saraven, Iran: Spatial distribution, monte-carlo simulation, sensitive analysis. Environ. Res. 2021, 204, 112002. [Google Scholar]
- Peng, S.; Xiao, X.; Zou, H.; Yang, Z.; Ahmad, U.M.; Zhao, Y.; Chen, H.; Li, G.; Liu, G.; Duan, X.; et al. Levels, origins and probabilistic health risk appraisal for trace elements in drinking water from Lhasa, Tibet. Environ. Geochem. Health 2022, 45, 3405–3421. [Google Scholar] [CrossRef]
- Lei, M.; Li, K.; Guo, G.; Ju, T. Source-specific health risks apportionment of soil potential toxicity elements combining multiple receptor models with Monte Carlo simulation. Sci. Total Environ. 2022, 817, 152899. [Google Scholar] [CrossRef]
- Wang, Y.; Cao, D.; Qin, J.; Zhao, S.; Lin, J.; Zhang, X.; Wang, J.; Zhu, M. Deterministic and Probabilistic Health Risk Assessment of Toxic Metals in the Daily Diets of Residents in Industrial Regions of Northern Ningxia, China. Biol. Trace Elem. Res. 2023, 201, 4334–4348. [Google Scholar] [CrossRef]
- Sobol, I.M. Sensitivity estimates for nonlinear mathematical models. Math. Model. Comput. Exp. 1993, 1, 112–118. [Google Scholar]
- Mukherjee, I.; Singh, U.K. Characterization of groundwater nitrate exposure using Monte Carlo and Sobol sensitivity approaches in the diverse aquifer systems of an agricultural semiarid region of Lower Ganga Basin, India. Sci. Total Environ. 2021, 787, 147657. [Google Scholar] [CrossRef]
- Zhang, Y.; Li, X.; Luo, M.; Wei, C.; Huang, X.; Xiao, Y.; Qin, L.; Pei, Q.; Gao, X. Hydrochemistry and Entropy-Based Groundwater Quality Assessment in the Suining Area, Southwestern China. J. Chem. 2021, 2021, 5591892. [Google Scholar] [CrossRef]
- Wang, Y.; Li, R.; Wu, X.; Yan, Y.; Wei, C.; Luo, M.; Xiao, Y.; Zhang, Y. Evaluation of Groundwater Quality for Drinking and Irrigation Purposes Using GIS-Based IWQI, EWQI and HHR Model. Water 2023, 15, 2233. [Google Scholar] [CrossRef]
- Zhang, Y.; Dai, Y.; Wang, Y.; Huang, X.; Xiao, Y.; Pei, Q. Hydrochemistry, quality and potential health risk appraisal of nitrate enriched groundwater in the Nanchong area, southwestern China. Sci. Total Environ. 2021, 784, 147186. [Google Scholar] [CrossRef] [PubMed]
- Zhang, H.; Xu, Y.; Cheng, S.; Li, Q.; Yu, H. Application of the dual-isotope approach and Bayesian isotope mixing model to identify nitrate in groundwater of a multiple land-use area in Chengdu Plain, China. Sci. Total Environ. 2020, 717, 137134. [Google Scholar] [CrossRef] [PubMed]
- Pan, Y.; Peng, H.; Hou, Q.; Peng, K.; Shi, H.; Wang, S.; Zhang, W.; Zeng, M.; Huang, C.; Xu, L.; et al. Priority control factors for heavy metal groundwater contamination in peninsula regions based on source-oriented health risk assessment. Sci. Total Environ. 2023, 894, 165062. [Google Scholar] [CrossRef] [PubMed]
- Sheng, D.; Meng, X.; Wen, X.; Wu, J.; Yu, H.; Wu, M. Contamination characteristics, source identification, and source-specific health risks of heavy metal(loid)s in groundwater of an arid oasis region in Northwest China. Sci. Total Environ. 2022, 841, 156733. [Google Scholar] [CrossRef]
- GB/T 14848-2017; Standard for Groundwater Quality. AQSIQ: Beijing, China, 2017.
- Prasad, B.; Kumari, P.; Bano, S.; Kumari, S. Ground water quality evaluation near mining area and development of heavy metal pollution index. Appl. Water Sci. 2014, 4, 11–17. [Google Scholar] [CrossRef]
- USEPA. Risk Assessment Guidance for Superfund Volume I Human Health Evaluation Manual (Part A); USEPA: Washington, DC, USA, 1989.
- Zeng, Y.; Lu, H.; Zhou, J.; Zhou, Y.; Sun, Y.; Ma, C. Enrichment Mechanism and Health Risk Assessment of Fluoride in Groundwater in the Oasis Zone of the Tarim Basin in Xinjiang, China. Expo. Health 2023, 1–16. [Google Scholar] [CrossRef]
- Harris, C.R.; Millman, K.J.; Van Der Walt, S.J.; Gommers, R.; Virtanen, P.; Cournapeau, D.; Wieser, E.; Taylor, J.; Berg, S.; Smith, N.J.; et al. Array programming with NumPy. Nature 2020, 585, 357–362. [Google Scholar] [CrossRef]
- Virtanen, P.; Gommers, R.; Oliphant, T.E.; Haberland, M.; Reddy, T.; Cournapeau, D.; Burovski, E.; Peterson, P.; Weckesser, W.; Bright, J.; et al. SciPy 1.0: Fundamental Algorithms for Scientific Computing in Python. Nat. Methods 2020, 17, 261–272. [Google Scholar] [CrossRef]
- Mukherjee, I.; Singh, U.K. Environmental fate and health exposures of the geogenic and anthropogenic contaminants in potable groundwater of Lower Ganga Basin, India. Geosci. Front. 2022, 13, 101365. [Google Scholar] [CrossRef]
- Iwanaga, T.; Usher, W.; Herman, J. Toward SALib 2.0: Advancing the accessibility and interpretability of global sensitivity analyses. Socio-Environ. Syst. Model. 2022, 4, 18155. [Google Scholar] [CrossRef]
- Haghnazar, H.; Johannesson, K.H.; González-Pinzón, R.; Pourakbar, M.; Aghayani, E.; Rajabi, A.; Hashemi, A.A. Groundwater geochemistry, quality, and pollution of the largest lake basin in the Middle East: Comparison of PMF and PCA-MLR receptor models and application of the source-oriented HHRA approach. Chemosphere 2022, 288, 132489. [Google Scholar] [CrossRef]
- Chen, R.; Chen, H.; Song, L.; Yao, Z.; Meng, F.; Teng, Y. Characterization and source apportionment of heavy metals in the sediments of Lake Tai (China) and its surrounding soils. Sci. Total Environ. 2019, 694, 133819. [Google Scholar] [CrossRef]
- Adimalla, N.; Qian, H.; Li, P. Entropy water quality index and probabilistic health risk assessment from geochemistry of groundwaters in hard rock terrain of Nanganur County, South India. Geochemistry 2020, 80, 125544. [Google Scholar] [CrossRef]
- Mukherjee, I.; Singh, U.K.; Singh, R.P.; Anshumali; Kumari, D.; Jha, P.K.; Mehta, P. Characterization of heavy metal pollution in an anthropogenically and geologically influenced semi-arid region of east India and assessment of ecological and human health risks. Sci. Total Environ. 2020, 705, 135801. [Google Scholar] [CrossRef]
Figure 1.
(a) The location of Sichuan Basin. (b) The position of study area in the Sichuan Basin. (c) The location of the study area with cover land-use types, including cultivated land, forest, grass land, artificial surfaces, and groundwater flow directions.
Figure 1.
(a) The location of Sichuan Basin. (b) The position of study area in the Sichuan Basin. (c) The location of the study area with cover land-use types, including cultivated land, forest, grass land, artificial surfaces, and groundwater flow directions.

Figure 2.
Box plot of trace elements concentrations with guidelines for drinking.

Figure 3.
The distribution and concentration of trace elements in the study area. The spatial distribution of concentration for (a) Mn, (b) Fe, (c) Cu, (d) Zn, (e) As, and (f) Pb.
Figure 3.
The distribution and concentration of trace elements in the study area. The spatial distribution of concentration for (a) Mn, (b) Fe, (c) Cu, (d) Zn, (e) As, and (f) Pb.

Figure 4.
The heavy pollution index of trace elements in the study area. (a) HPI vs. TDS (b) Spatial distribution of the HPI values.
Figure 4.
The heavy pollution index of trace elements in the study area. (a) HPI vs. TDS (b) Spatial distribution of the HPI values.

Figure 5.
Cumulative permeability and probability density of HI and CR for infants, children, and adults. The PDF is defined as the probability density function. The CDF denotes the cumulative distribution function. (a) HI for infants, (b) HI for children, (c) HI for adults, (d) CR for infants, (e) CR for children, and (f) CR for adults.

Figure 6.
The distribution of HI and CR for infants, children, and adults in the study area. The distribution of (a) HI for infants, (b) HI for children, (c) HI for adults, (d) HI for infants, (e) CR for children, and (f) CR for adults.
Figure 6.
The distribution of HI and CR for infants, children, and adults in the study area. The distribution of (a) HI for infants, (b) HI for children, (c) HI for adults, (d) HI for infants, (e) CR for children, and (f) CR for adults.

Figure 7.
Cumulative permeability and probability density of HI and CR for infants, children, and adults based on Monte Carlo simulation. (a) HI for infants, (b) HI for children, (c) HI for adults, (d) HI for infants, (e) CR for children, and (f) CR for adults.
Figure 7.
Cumulative permeability and probability density of HI and CR for infants, children, and adults based on Monte Carlo simulation. (a) HI for infants, (b) HI for children, (c) HI for adults, (d) HI for infants, (e) CR for children, and (f) CR for adults.

Figure 8.
Sensitivity analysis of HI and CR for infants, children, and adults. (a) HI for infants, (b) HI for children, (c) HI for adults, (d) HI for infants, (e) CR for children, and (f) CR for adults.
Figure 8.
Sensitivity analysis of HI and CR for infants, children, and adults. (a) HI for infants, (b) HI for children, (c) HI for adults, (d) HI for infants, (e) CR for children, and (f) CR for adults.


Table 1.
The standard value, weight, and normalized weight of trace elements in the calculation of HPI.
Table 1.
The standard value, weight, and normalized weight of trace elements in the calculation of HPI.
| Parameters | Unit | Standard Value | Weight | Normalized Weight |
|---|---|---|---|---|
| Mn | μg/L | 100 | 0.01 | 0.087 |
| Fe | μg/L | 300 | 0.003333 | 0.029 |
| Cu | μg/L | 1000 | 0.001 | 0.009 |
| Zn | μg/L | 1000 | 0.001 | 0.009 |
| Pb | μg/L | 10 | 0.1 | 0.867 |
Table 2.
The exposure parameters for infants, children, and adults.
| Parameters | Definition | Units | Infants | Children | Adult |
|---|---|---|---|---|---|
| IR | Ingestion rate for water | L/day | 0.65 | 1.5 | 2 |
| EF | Exposure frequency for water | days/year | 365 | 365 | 365 |
| ED | Exposure duration for water | years | 0.5 | 6 | 30 |
| BW | Body weight | kg | 6.94 | 25.9 | 65 |
| AT non-cancer | Average time (ED × 365) | days | 182.5 | 2190 | 10,950 |
| AT cancer | Average time (365 × 70) | days | 25,550 | 25,550 | 25,550 |
Table 3.
The reference dose (RfD) of Mn, Cu, Zn, Pb, and As and the slope factor (SF) of Pb and As.
| Parameter | Definition | Unit | Mn | Cu | Zn | Pb | As |
|---|---|---|---|---|---|---|---|
| RfD | Reference dose | mg/(kg·day) | 0.06 | 1.6 | 0.06 | 0.002 | 0.0003 |
| SF | Slope factor | kg·day/mg | – | – | – | 0.055 | 1.5 |
Table 4.
Statistical results of pH and trace elements.
| Parameters | Unit | Min | Max | Mean | Std. | CV (%) | Guideline for Drinking |
|---|---|---|---|---|---|---|---|
| pH | – | 6.81 | 8.63 | 7.65 | 0.39 | 5.04 | 6.5–8.5 |
| Mn | μg/L | 0.13 | 2910.00 | 109.46 | 369.48 | 337.54 | 100 |
| Fe | μg/L | 0.82 | 1630.00 | 70.09 | 222.71 | 317.73 | 300 |
| Cu | μg/L | 0.08 | 26.10 | 2.12 | 3.21 | 151.27 | 1000 |
| Zn | μg/L | 0.67 | 220.00 | 12.83 | 23.46 | 182.78 | 1000 |
| As | μg/L | 0.30 | 8.90 | 1.51 | 2.18 | 144.44 | 10 |
| Pb | μg/L | 0.09 | 2.86 | 0.24 | 0.39 | 158.48 | 10 |
Table 5.
The statistical results of HI and CR caused by hazardous substances for infants, children, and adults.
Table 5.
The statistical results of HI and CR caused by hazardous substances for infants, children, and adults.
| Parameter | Infants | Children | Adults | ||||||
|---|---|---|---|---|---|---|---|---|---|
| Min | Max | Mean | Min | Max | Mean | Min | Max | Mean | |
| Mn | 2.35 × 10⁻³ | 1.52 | 0.171 | 1.45 × 10⁻³ | 0.937 | 0.106 | 7.73 × 10⁻⁴ | 0.498 | 5.61 × 10⁻² |
| Cu | 2.54 × 10⁻⁵ | 5.22 × 10⁻⁴ | 1.24 × 10⁻⁴ | 1.57 × 10⁻⁵ | 3.23 × 10⁻⁴ | 7.69 × 10⁻⁵ | 8.33 × 10⁻⁶ | 1.72 × 10⁻⁴ | 4.09 × 10⁻⁵ |
| Zn | 7.19 × 10⁻³ | 0.118 | 2.00 × 10⁻² | 4.45 × 10⁻³ | 7.29 × 10⁻² | 1.24 × 10⁻² | 2.36 × 10⁻³ | 3.87 × 10⁻² | 6.58 × 10⁻³ |
| As | 0.135 | 1.05 | 0.47 | 8.37 × 10⁻² | 0.65 | 0.291 | 4.44 × 10⁻² | 0.345 | 0.155 |
| Pb | 4.21 × 10⁻³ | 5.62 × 10⁻² | 1.15 × 10⁻² | 2.61 × 10⁻³ | 3.47 × 10⁻² | 7.09 × 10⁻³ | 1.38 × 10⁻³ | 1.85 × 10⁻² | 3.77 × 10⁻³ |
| HI | 0.16 | 1.83 | 0.66 | 0.10 | 1.13 | 0.41 | 0.05 | 0.6 | 0.22 |
| As | 4.35 × 10⁻⁷ | 3.38 × 10⁻⁶ | 1.51 × 10⁻⁶ | 3.23 × 10⁻⁶ | 2.51 × 10⁻⁵ | 1.12 × 10⁻⁵ | 8.57 × 10⁻⁶ | 6.66 × 10⁻⁵ | 2.98 × 10⁻⁵ |
| Pb | 3.31 × 10⁻⁹ | 4.42 × 10⁻⁸ | 9.01 × 10⁻⁹ | 2.46 × 10⁻⁸ | 3.28 × 10⁻⁷ | 6.69 × 10⁻⁸ | 6.53 × 10⁻⁸ | 8.7 × 10⁻⁷ | 1.78 × 10⁻⁷ |
| CR | 4.40 × 10⁻⁷ | 3.00 × 10⁻⁶ | 2.00 × 10⁻⁶ | 3.26 × 10⁻⁶ | 2.5 × 10⁻⁵ | 1.1 × 10⁻⁵ | 8.67 × 10⁻⁶ | 6.7 × 10⁻⁵ | 3 × 10⁻⁵ |
Table 6.
The distribution types and distribution parameters of Mn, Cu, Zn, Pb, As, and parameters.
| Parameter | Distribution Type | Infants | Children | Adult |
|---|---|---|---|---|
| EF | Triangle | (180,345,365) | (180,345,365) | (180,345,365) |
| IR | Lognormal | (0.65, 0.065) | (1.5, 0.15) | (2, 0.2) |
| BW | Lognormal | (6.94, 0.694) | (25.9, 2.59) | (65, 6.5) |
| Mn | Lognormal | (3.54, 1.74) | (3.54, 1.74) | (3.54, 1.74) |
| Cu | Lognormal | (6.34, 0.62) | (6.34, 0.62) | (6.34, 0.62) |
| Zn | Lognormal | (4.55, 0.54) | (4.55, 0.54) | (4.55, 0.54) |
| Pb | Lognormal | (8.53, 0.59) | (8.53, 0.59) | (8.53, 0.59) |
| As | Lognormal | (6.74, 0.73) | (6.74, 0.73) | (6.74, 0.73) |
Disclaimer/Publisher’s Note: The statements, opinions and data contained in all publications are solely those of the individual author(s) and contributor(s) and not of MDPI and/or the editor(s). MDPI and/or the editor(s) disclaim responsibility for any injury to people or property resulting from any ideas, methods, instructions or products referred to in the content. |
© 2023 by the authors. Licensee MDPI, Basel, Switzerland. This article is an open access article distributed under the terms and conditions of the Creative Commons Attribution (CC BY) license (https://creativecommons.org/licenses/by/4.0/).
Share and Cite
MDPI and ACS Style
Yu, Z.; Yao, R.; Huang, X.; Yan, Y. Health Risk Appraisal of Trace Elements in Groundwater in an Urban Area: A Case Study of Sichuan Basin, Southwest China. Water 2023, 15, 4286. https://0-doi-org.brum.beds.ac.uk/10.3390/w15244286
AMA Style
Yu Z, Yao R, Huang X, Yan Y. Health Risk Appraisal of Trace Elements in Groundwater in an Urban Area: A Case Study of Sichuan Basin, Southwest China. Water. 2023; 15(24):4286. https://0-doi-org.brum.beds.ac.uk/10.3390/w15244286
Chicago/Turabian StyleYu, Zhongyou, Rongwen Yao, Xun Huang, and Yuting Yan. 2023. "Health Risk Appraisal of Trace Elements in Groundwater in an Urban Area: A Case Study of Sichuan Basin, Southwest China" Water 15, no. 24: 4286. https://0-doi-org.brum.beds.ac.uk/10.3390/w15244286
Note that from the first issue of 2016, this journal uses article numbers instead of page numbers. See further details here.