Article

Effects of Clay Content on Non-Linear Seepage Behaviors in the Sand–Clay Porous Media Based on Low-Field Nuclear Magnetic Resonance

1
School of Earth Science and Engineering, Hohai University, Nanjing 210098, China
2
China Water Investment Co., LTD., Beijing 100053, China
*
Authors to whom correspondence should be addressed.
Submission received: 6 February 2024 / Revised: 15 March 2024 / Accepted: 15 March 2024 / Published: 19 March 2024
(This article belongs to the Topic Organic Pollution in Soil and Groundwater)

Abstract

:
Clay is widely encountered in nature and directly influences seepage behaviors, exerting a crucial impact on engineering applications. Under low hydraulic gradients, seepage behaviors have been observed to deviate from Darcy’s law, displaying a non-linear trend. However, the impacts of clay content on non-linear seepage behavior and its pore-scale mechanisms to date remain unclear. In this study, constant-head seepage experiments were conducted in sand–clay porous media under various hydraulic gradients. Low-field nuclear magnetic resonance (LF-NMR) technology was utilized to monitor the bound-water and free-water contents of sand–clay porous media under different seepage states. The results show a threshold hydraulic gradient (i0) below which there is no flow, and a critical hydraulic gradient (icr) below which the relationship between the hydraulic gradient (i) and seepage velocity (v) is non-linear. Both hydraulic gradients increased with clay content. Moreover, the transformation between bound water and free water was observed during the seepage-state evolution (no flow to pre-Darcy or pre-Darcy to Darcy). As the hydraulic gradient reached the i0, the pore water pressure gradually overcame the adsorption force of the bound-water film, reducing the thickness of the bound-water film, and causing non-linear seepage behavior. When i0 < i < icr, the enlarging hydraulic gradient triggers the thinning of bound water and enhances the fluidity of pore water. Moreover, the increasing clay content augments the bound-water content required for the seepage state’s change.

1. Introduction

In the development of hydrodynamic-response-mechanism models for saturated clay-containing layers, conventional approaches in groundwater studies employed Darcy’s law to describe pore water behavior in clay-containing porous media [1]. Darcy’s law states that the pressure gradient is linearly proportional to the fluid velocity in porous media. However, previous research has revealed that Darcy’s law is effective only within a certain range [2,3,4,5]. When the samples contain clay, their seepage behavior deviates from Darcy’s law at low or high hydraulic gradients [6]. Therefore, it is of great importance to achieve an in-depth understanding of hydraulic conductivity in the clay-containing porous media for addressing these challenges [7]. Elucidating the transformation mechanism of pore water in clay-containing porous media during the pre-Darcy stage and the hydrodynamic response under the transformation are crucial to advance the study of the pre-Darcy seepage theory. Furthermore, the research is practical to address the engineering geological problems associated with clay-containing porous media. Özer Bağcı et al. discovered that the relationship between flow velocity and pressure gradient does not obey Darcy’s law and exhibits a pre-Darcy effect during the seepage process [8]. Researchers have also acknowledged over the years that the pre-Darcy effect not only signifies a deviation from linearity, but also indicates the presence of a threshold hydraulic gradient [9,10,11].
Scholars have traditionally relied on laboratory seepage test results to quantify the low-velocity non-Darcy seepage process of clay samples [12,13,14,15,16,17]. Currently, around ten characteristic curves have been established, with the power function curve being the most commonly used [18,19]. While the microscopic mechanism influencing the seepage state remains unclear, it has been suggested that the presence of bound water in clay-containing porous media affects the seepage state. However, the research on the transformation process of bound water from a microscopic perspective deserves to be explored. It is generally acknowledged that there is a strong interaction between pore water and clay particles [20], and the essence of non-Darcy seepage is the result of the mutual transformation of different water states under the specified hydraulic gradient. Osipov proposed that clay particles combine with water molecules to form a bound-water film with a certain thickness [21]. Studies by Wang et al. indicate the presence of two key hydraulic gradients in clay samples, with bound water in clay being the main factor affecting the deviation of the hydraulic conductivity from Darcy’s law [22]. This is due to the electrical double layer of bound water in clay, with shear force existing in each part of the bound water in the electrical double layer. When the pore water pressure exceeds the shear force of the bound water, the bound water moves, resulting in a thresholding hydraulic gradient in the clay seepage, and the thresholding hydraulic gradient is linearly related to the shear force of the bound water. While previous studies have examined the hydration, expansion, and dispersion characteristics of clay particles, focusing on the mechanisms of a strongly bound-water layer and weakly-bound-water layer [23,24], no research has delved into the microscopic-level mechanism of water transformation during medium- and low-velocity non-Darcy seepage in clay samples. Further investigation into these microscopic mechanisms is necessary to enhance our understanding of the complex interplay between bound water and clay particles during non-Darcy seepage processes.
Investigating the transformation process of bound water in clay-containing porous media necessitates the precise measurement of the bound-water content. However, current methods for determining water content in porous media, such as X-ray diffraction [25,26], isothermal adsorption [27,28], and thermogravimetric analysis [29,30], have limitations, including difficult operation, long test periods, and low accuracy. This presents a significant technical impediment constraining the advancement of the low-velocity non-Darcy seepage theory in clay-containing porous media at the microscopic level. LF-NMR (low-field nuclear magnetic resonance) has emerged as a promising alternative, enabling the rapid, non-destructive, quantitative, and accurate measurement of sample porosity and other parameters. Consequently, a large number of researchers have exploited LF-NMR for experimental research [31,32]. For instance, Lu et al. utilized LF-NMR to ascertain the T2 cutoff value for distinguishing between free water and bound water in samples [33]. Lapasin et al. investigated the aging dynamics and structural evolution of salt-free Laponite aqueous dispersion through a combination of LF-NMR and rheological analysis [34]. The application of LF-NMR has significantly advanced the study of seepage in porous media. Xie et al. explored the hydration behavior of sodium montmorillonite using LF-NMR [35]. Furthermore, researchers have employed LF-NMR to investigate pore structure [36], imbibition [37], volatilization [38], solute transport [39], and biological [40] aspects of porous media. However, research on the transformation of water state during seepage in porous media is still lacking.
This study aims to quantify the transformation of bound water and free water during the seepage process, which further investigates the impact of clay content in sand–clay porous media on seepage behaviors from a microscopic perspective. To achieve this objective, we employ a comprehensive research methodology that integrates LF-NMR with seepage experiments. This innovative approach not only circumvents the abovementioned limitations, but also enables a more nuanced analysis of the internal moisture dynamics within the porous medium as it transitions into the seepage state. Four distinct sample sets are established, and constant-head seepage experiments are conducted under varying hydraulic gradients. LF-NMR facilitates the real-time monitoring of water-state evolution during the seepage process in samples with varying clay contents, enabling the microscopic observation and detailed analysis of the water state within the clay matrix. This study performs an in-depth analysis of the transformation process of bound water and free water in sand–clay porous media, elucidating the mechanisms through which this process influences the transition between seepage states.

2. Materials and Methods

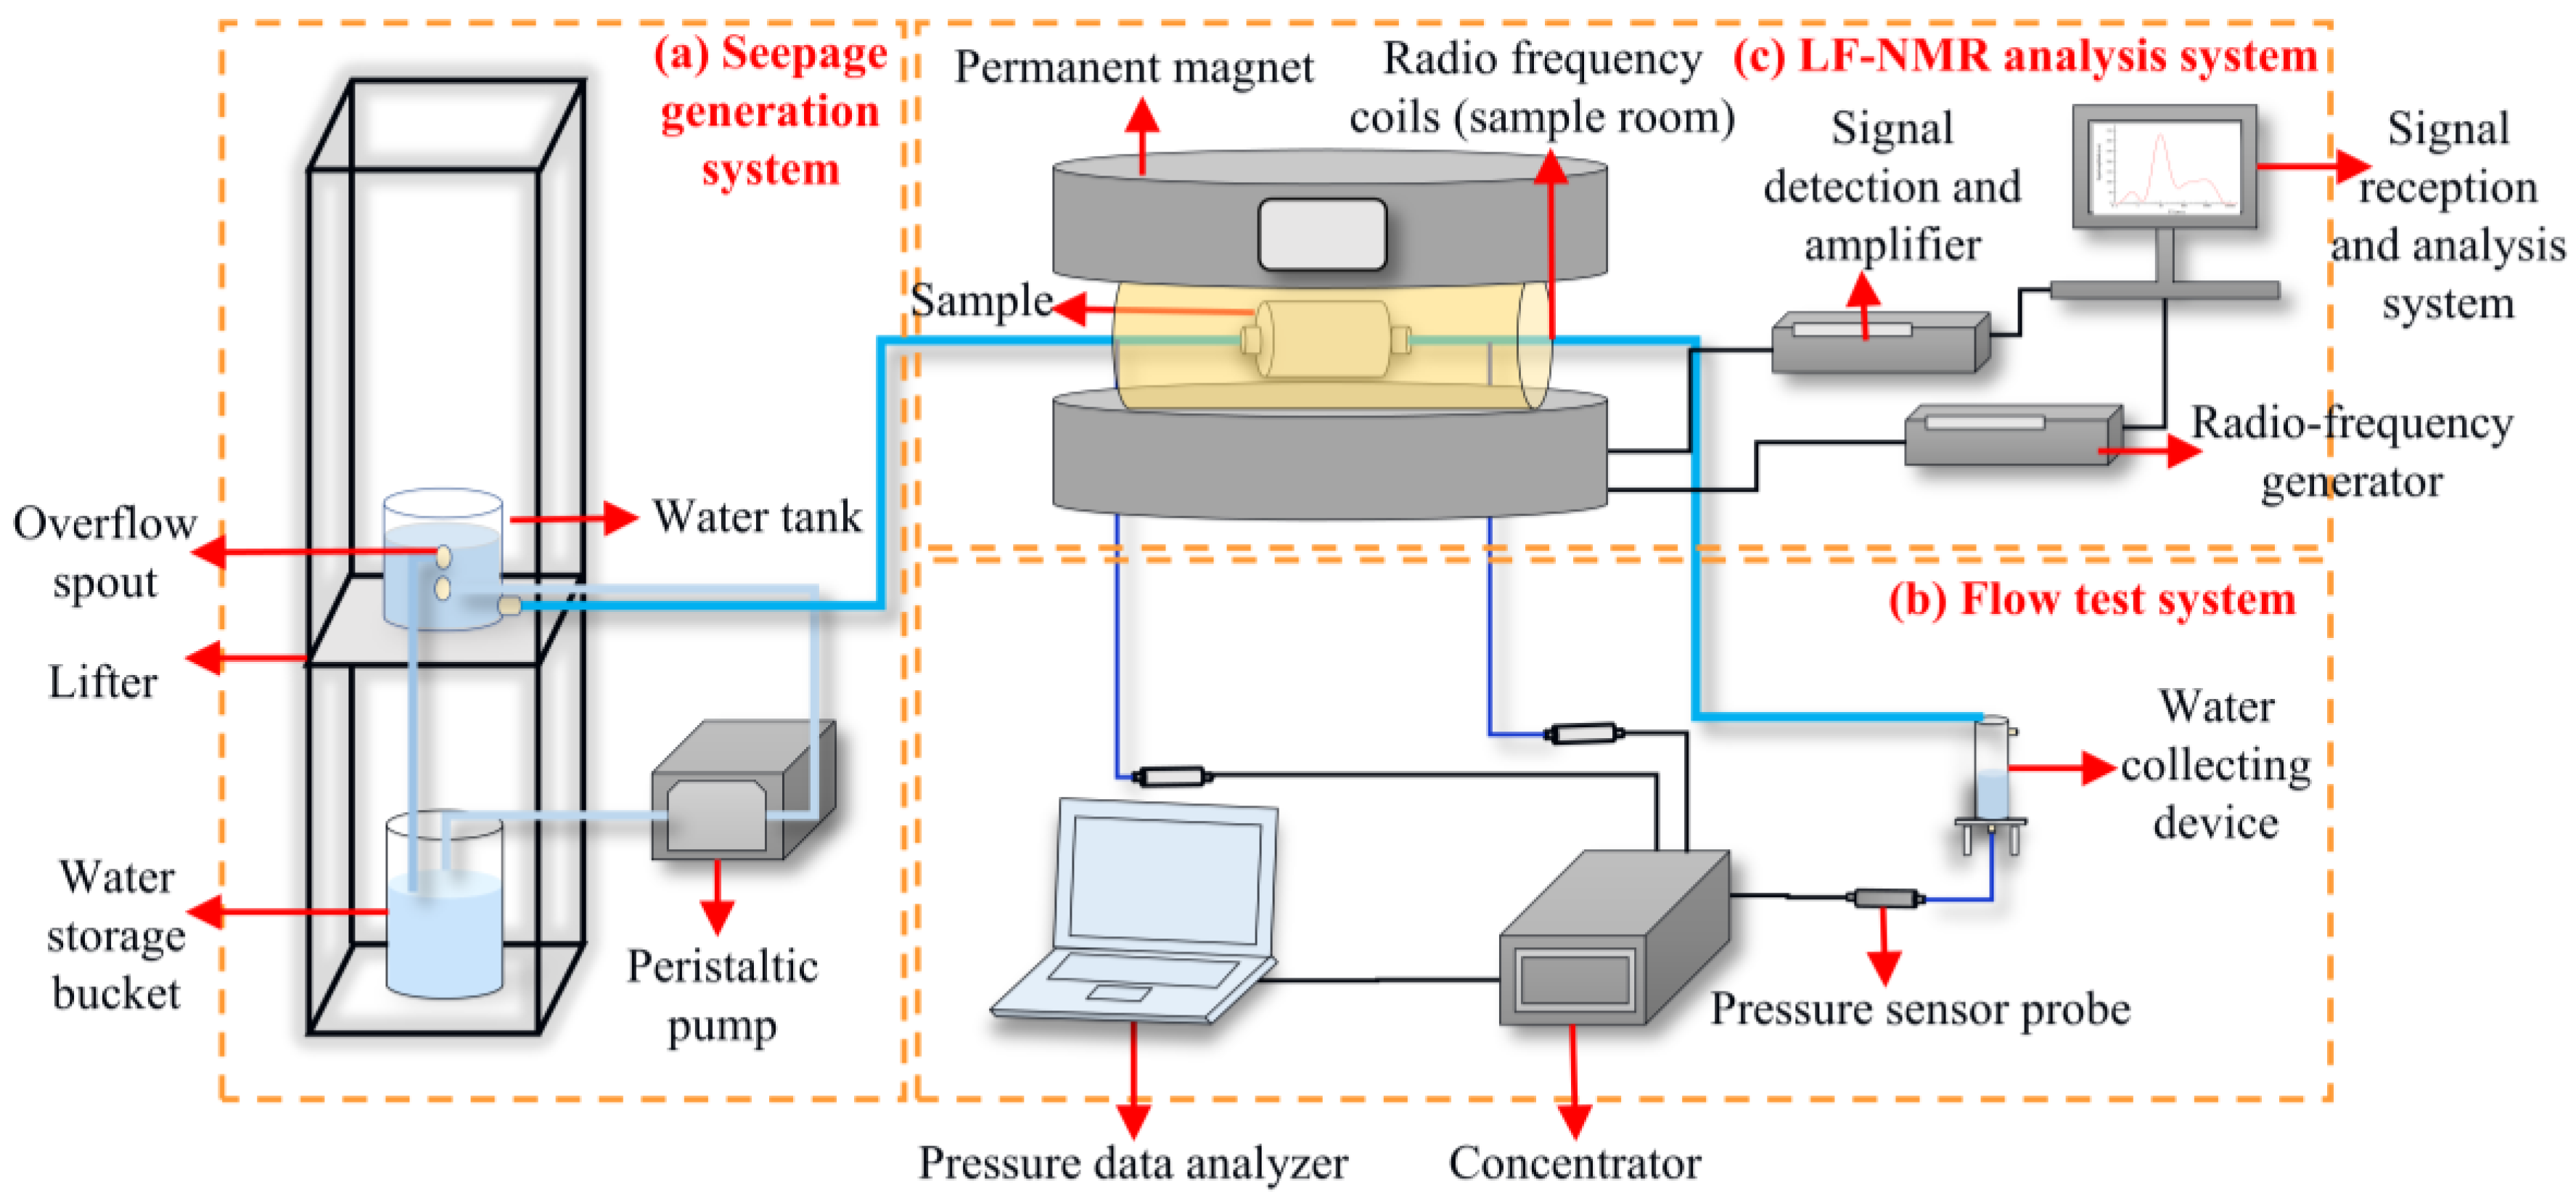
2.1. Experimental Setup

Figure 1 illustrates the experimental setup used in this study, which included: (a) the seepage generation system: comprising deionized water, a lifting frame (40 cm × 40 cm × 200 cm), a lifting platform (40 cm × 40 cm), a peristaltic pump (operating at an injection rate of 2 mL/min), a water storage tank, a water supply bucket, silicone tubes (De 4.8 × 1.6 mm), and polytetrafluoroethylene (PTFE) tubes (De 3.17 × 0.795 mm). (b) The seepage test system, which consisted of a DY1000 digital pressure sensor (0~110 kPa), DY1000 pressure sensor hub, pressure analyzer, and water collection device. (c) An LF-NMR analysis system, including a PTFE column and an LF-NMR instrument (MacroMR12-150H-I, manufactured by Suzhou Niumag Co., Ltd., Suzhou, China), featuring a magnetic field strength of 0.3 T and a constant magnet temperature of 32 °C. The PTFE column measured 100 mm in length, 50 mm in outer diameter, with a 12.5 mm wall thickness, an inner cylinder diameter of 25 mm, and a length of 60 mm. To prevent water leakage during the experiments, both ends of the sample tube were sealed with silicone gaskets and 500 mesh filter.

2.2. Sand–Clay Porous Media

Two sets of samples were prepared, each consisting of sand–clay porous media with four clay contents. One of the four sand–clay porous media was pure quartz sand, and the remaining three were sand–clay porous media. The samples were denoted as C0, C12, C15, and C18, and detailed information is summarized in Table 1. A set of samples was used to determine the T2 cutoff values that was necessary for NMR quantification in online seepage tests, while the other samples were employed for NMR online constant-head permeability tests. To ensure uniform porosity and dry density across both sample groups, an identical preparation method was utilized for sample filling. Specifically, quartz sand with a particle size of 0.45–0.6 mm (sourced from Hong Dingxing Company, Chengdu, China) and illite powder (obtained from Xincheng Mineral Company, Kaiyuan, China) with a particle size of 0.075 mm were used. The physical parameters of the quartz sand and illite powder are summarized in Table 2.
Prior to the initiation of the test, deionized water was boiled to reduce impurities. After boiling and cooling, the water was degassed to eliminate bubbles and impurities, thus preventing their influence on the test results. Additionally, the quartz sand was dried in an oven (HN101-2/+) to eliminate impurities and mitigate their impact on the test. Initially, illite powder and quartz sand were combined for various weight-based ratios, followed by the addition of deionized water and thorough mixing. Subsequently, sand–clay porous media with a specific moisture content were then prepared and layered into the sample tube. Each layer was compacted, and the surface was roughened before the addition of the subsequent layer, ensuring a seamless transition between layers. The filled sample was then positioned in a vacuum-saturated barrel (model ZK-270) for over 12 h. Upon extraction from the barrel, both ends of the sample tube were promptly sealed to prevent test errors resulting from evaporation.

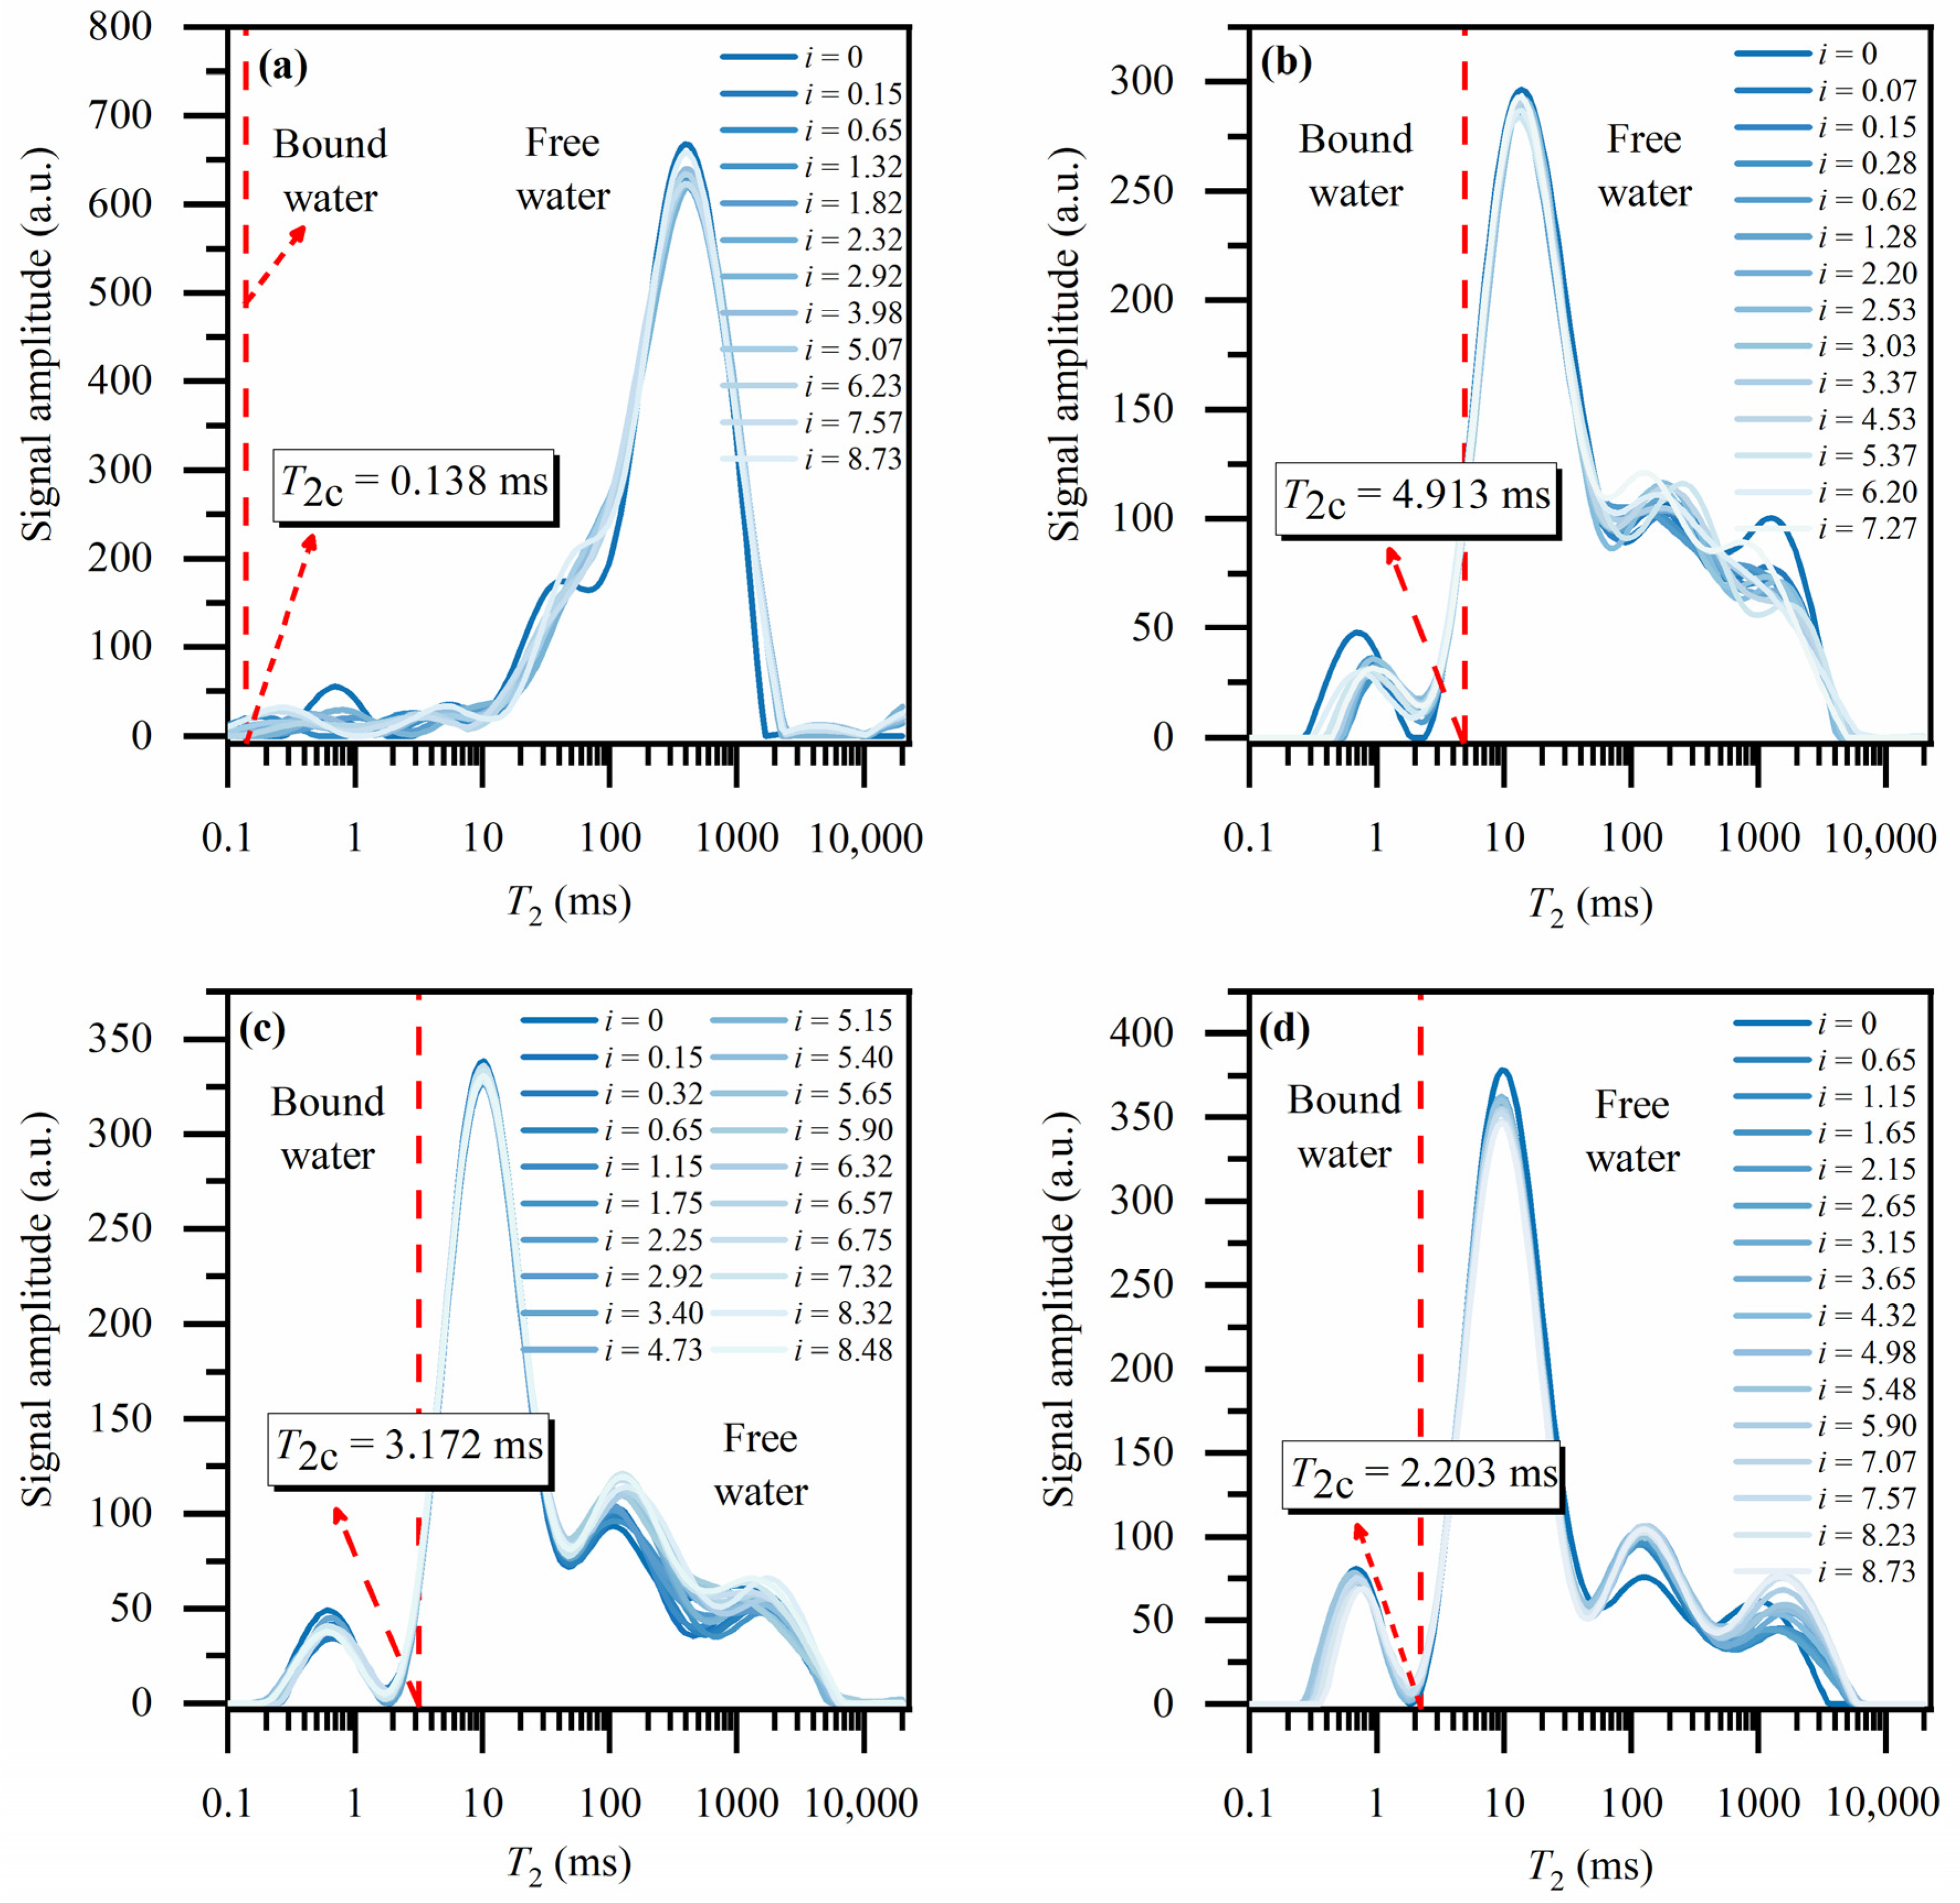
2.3. Bound-Water Detection Using LF-NMR

LF-NMR primarily analyzes the response signal of hydrogen atoms in pore water when testing the material. The strength of the signal is indicative of the sample’s developed pore structure. Given PTFE’s molecular formula (C2F4), its use as a sample-filling container is not anticipated to influence the results of the NMR analysis. Furthermore, the LF-NMR inversion of the signal attenuation degree provides the sample’s relaxation signal, serving as the basis for investigating the physical property parameters of the porous media. As per the NMR relaxation mechanism, transverse relaxation encompasses three components: transverse bulk relaxation, transverse surface relaxation, and transverse diffusion relaxation [37]:
1 T 2 = 1 T 2 B + 1 T 2 S + 1 T 2 D ,
T 2 D = C m d γ G T E 12 ,
where T2 is the transverse relaxation time, T2B is the transverse bulk relaxation time, T2S is the transverse surface relaxation time, T2D is the transverse diffusion relaxation time, Cmd is the molecular diffusion coefficient, G is the cyclotron magnetic ratio of protons, and TE is the echo spacing. Because the diffusion of water molecules is very fast, 1/T2D is negligible when TE is small. T2B is inversely proportional to fluid viscosity, and due to the low viscosity of water, 1/T2B is small enough to be negligible [37]. T2S is the transverse relaxation time caused by surface relaxation, which is inversely proportional to the self-diffusion coefficient of the liquid and the square of the echo spacing, TE [41]. Because the diffusion rate of water molecules is very fast, when the magnetic field is uniform, that is, when G is small, TE is small enough and T2D is negligible. Therefore, Equation (1) can be simplified by T2S to [42,43,44].
1 T 2 = ρ 2 S V p o r e ρ 2 2 R ,
where ρ2 is the surface relaxation ratio; R is the radius of the pore.
Based on Equation (3), it can be inferred that T2 is directly proportional to the pore size and inversely proportional to the adsorption degree of water molecules and soil particles. This implies that larger pore sizes correspond to weaker binding forces of water molecules within the pore, resulting in stronger NMR signals. The distribution of the T2 spectral curve serves as an indicator of the strength of the binding forces between water molecules and the sample. The distinct disparity between free water and bound water, influenced by the soil particles’ binding force during the seepage process, enabled the clear differentiation of water molecule states within the samples. Therefore, this study relies on the reliability of this method to monitor the transformation process of water molecules in sand–clay porous media, which is crucial for investigating the pivotal aspects of the transition between seepage states. Table 3 shows the parameters set for the CPMG pulse sequence.
Subsequently, the sample was analyzed during the experiment to determine the boundary point (T2 cutoff) between the relaxation times of bound water and free water in the T2 distribution curve of the sample. This measurement served as a foundation for the analysis of the constant-head seepage experiment. The saturated sample was dried in an oven, and every three hours, it was taken out and cooled to 32 °C for NMR measurements to obtain the T2 distribution curve. This procedure was repeated until the weight of the sand–clay porous media no longer decreased after drying for three hours. Lu’s [33] drying method was used to determine the sample’s T2 cutoff. Figures S1 and S2 display the measured T2 distribution curves for each sample group along with the corresponding T2 cutoff values. Both Figures S2 and S3 demonstrate that, in the absence of clay from the sand–clay porous media, the T2 cutoff value is nearly zero, indicating a minimal bound-water content. However, as the clay content increases, the T2 cutoff values decrease, measuring 4.913 ms, 3.172 ms, 2.203 ms, and 0.138 ms.
The NMR measurements included two primary steps. Initially, the seepage state of the saturated sample was assessed, and the signal of the water status within the sample was obtained. During this section of the test, the sand–clay porous media were continuously monitored using NMR. The sand–clay porous medium’s T2 distribution curve was created under each hydraulic gradient, and the water status and seepage state were analyzed from a microscopic perspective. Before the test starts, all of the system’s components’ devices must be connected. Once the device is connected, seepage can start once the sample’s T2 distribution curve has been measured as static. In this experiment, the height of the outlet pipe of the sample was fixed, and the height of the water tank was changed to achieve different hydraulic gradients. When the sample reached a stable state, which was indicated by the pressure gauge on both sides of the sample, the flow rate, Q, and the pressure difference, ΔP, were measured. The hydraulic gradients (i) and seepage velocity are calculated by Equations (4) and (5):
i = Δ P ρ g L ,
where i is the hydraulic gradient, ΔP is the pressure difference (Pa), ρ is the density of water (g/cm3), g is the acceleration of gravity (cm/s2), and L is the seepage path length (cm).
ν = Q S ,
where v is the seepage velocity (cm/s), Q is the seepage flux (cm3/s), and S is the cross-sectional area of the sample (cm2).
Concurrently, NMR measurements were conducted on the sand–clay porous media, revealing the samples’ T2 distribution curves under the hydraulic gradient. It is important to note that several preliminary experiments were conducted ahead of the official experiment to ensure that the information sequence and filling technique were most suitable for the experimental conditions.

3. Results

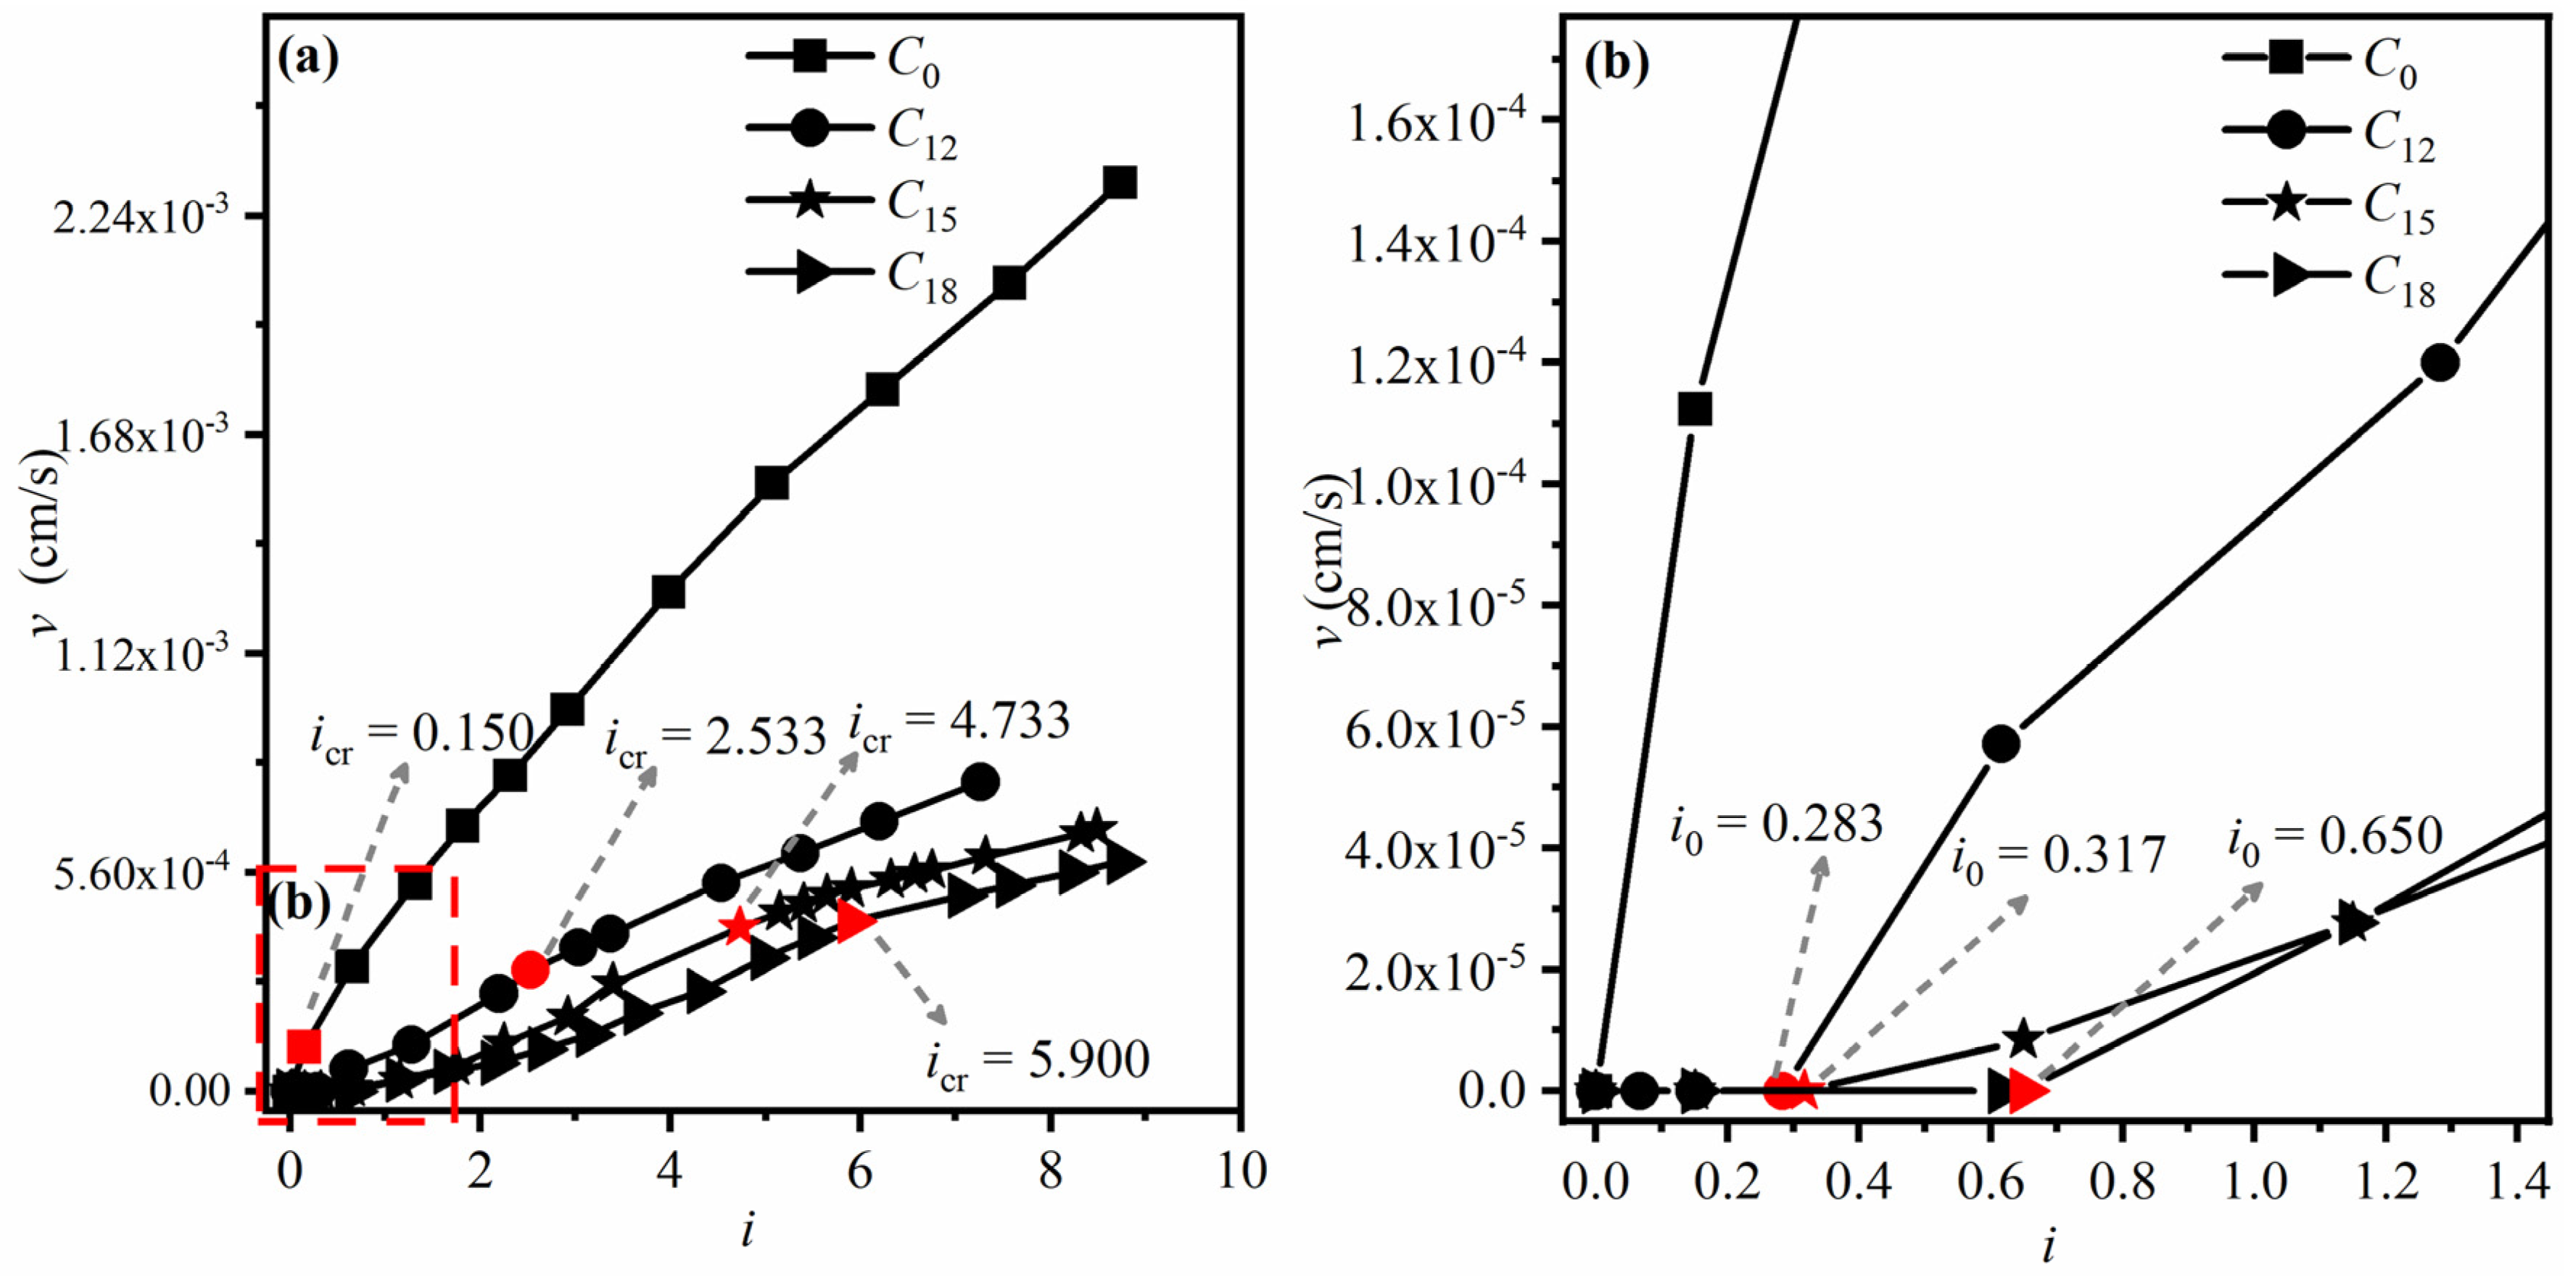
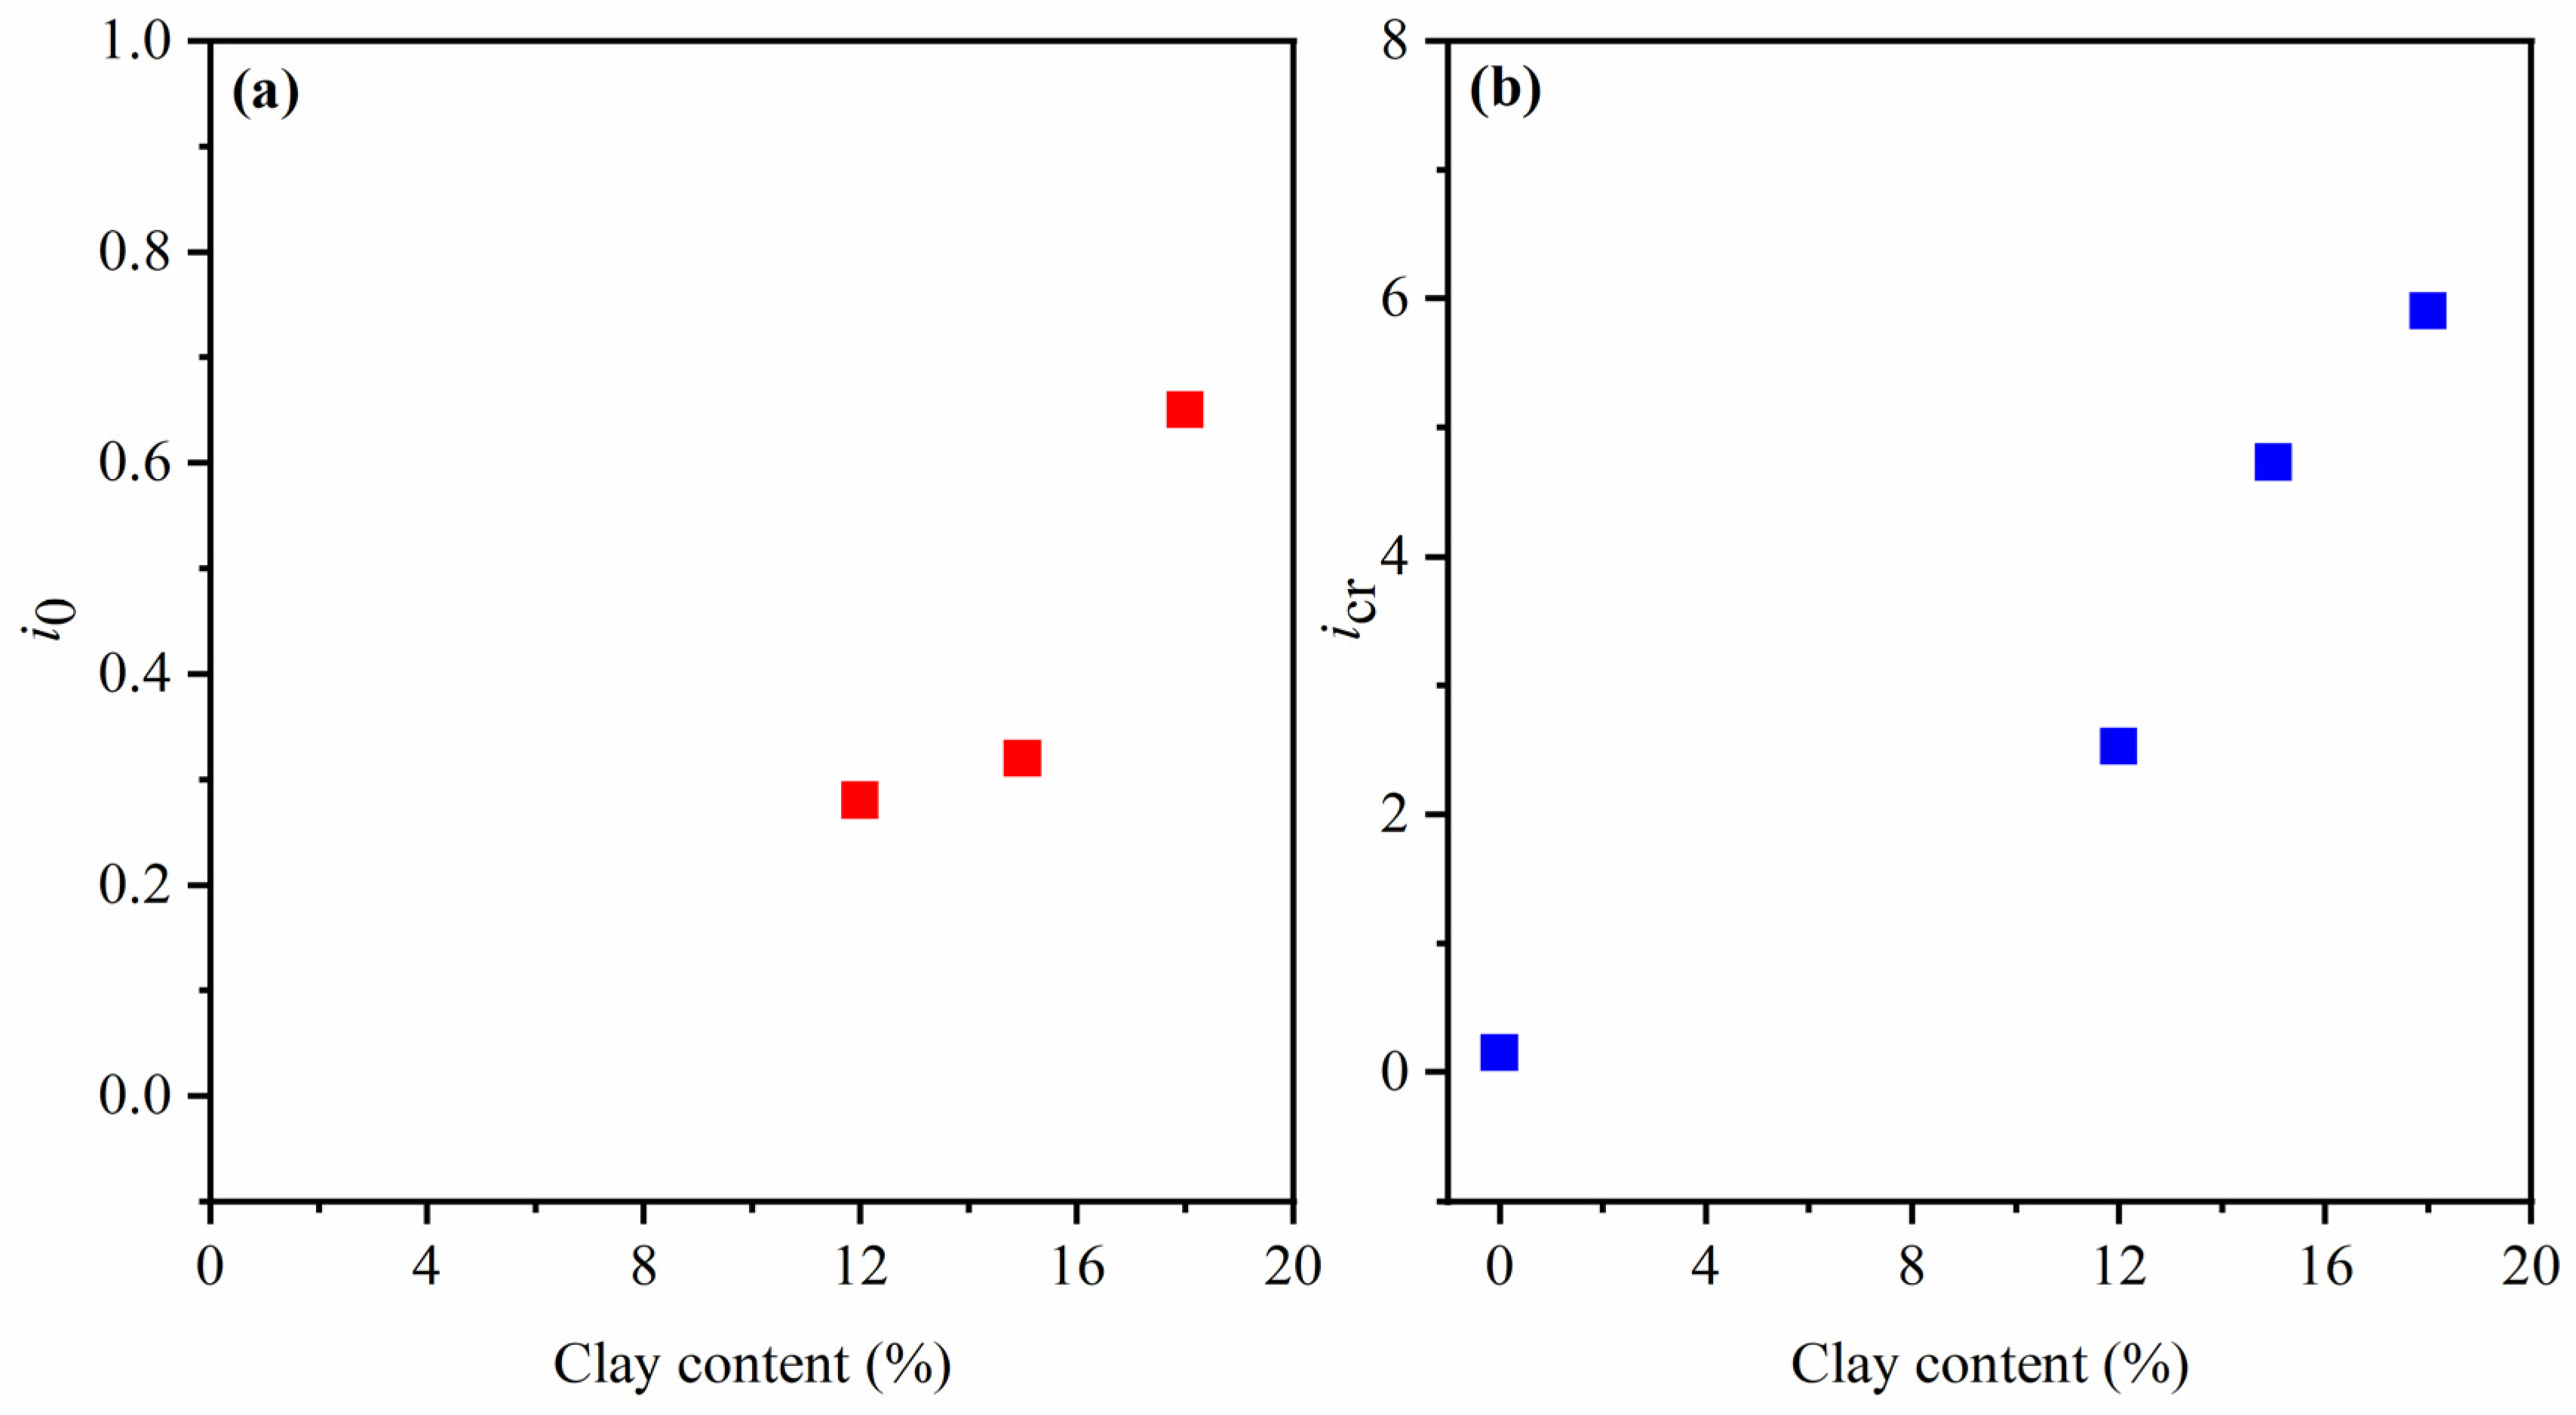
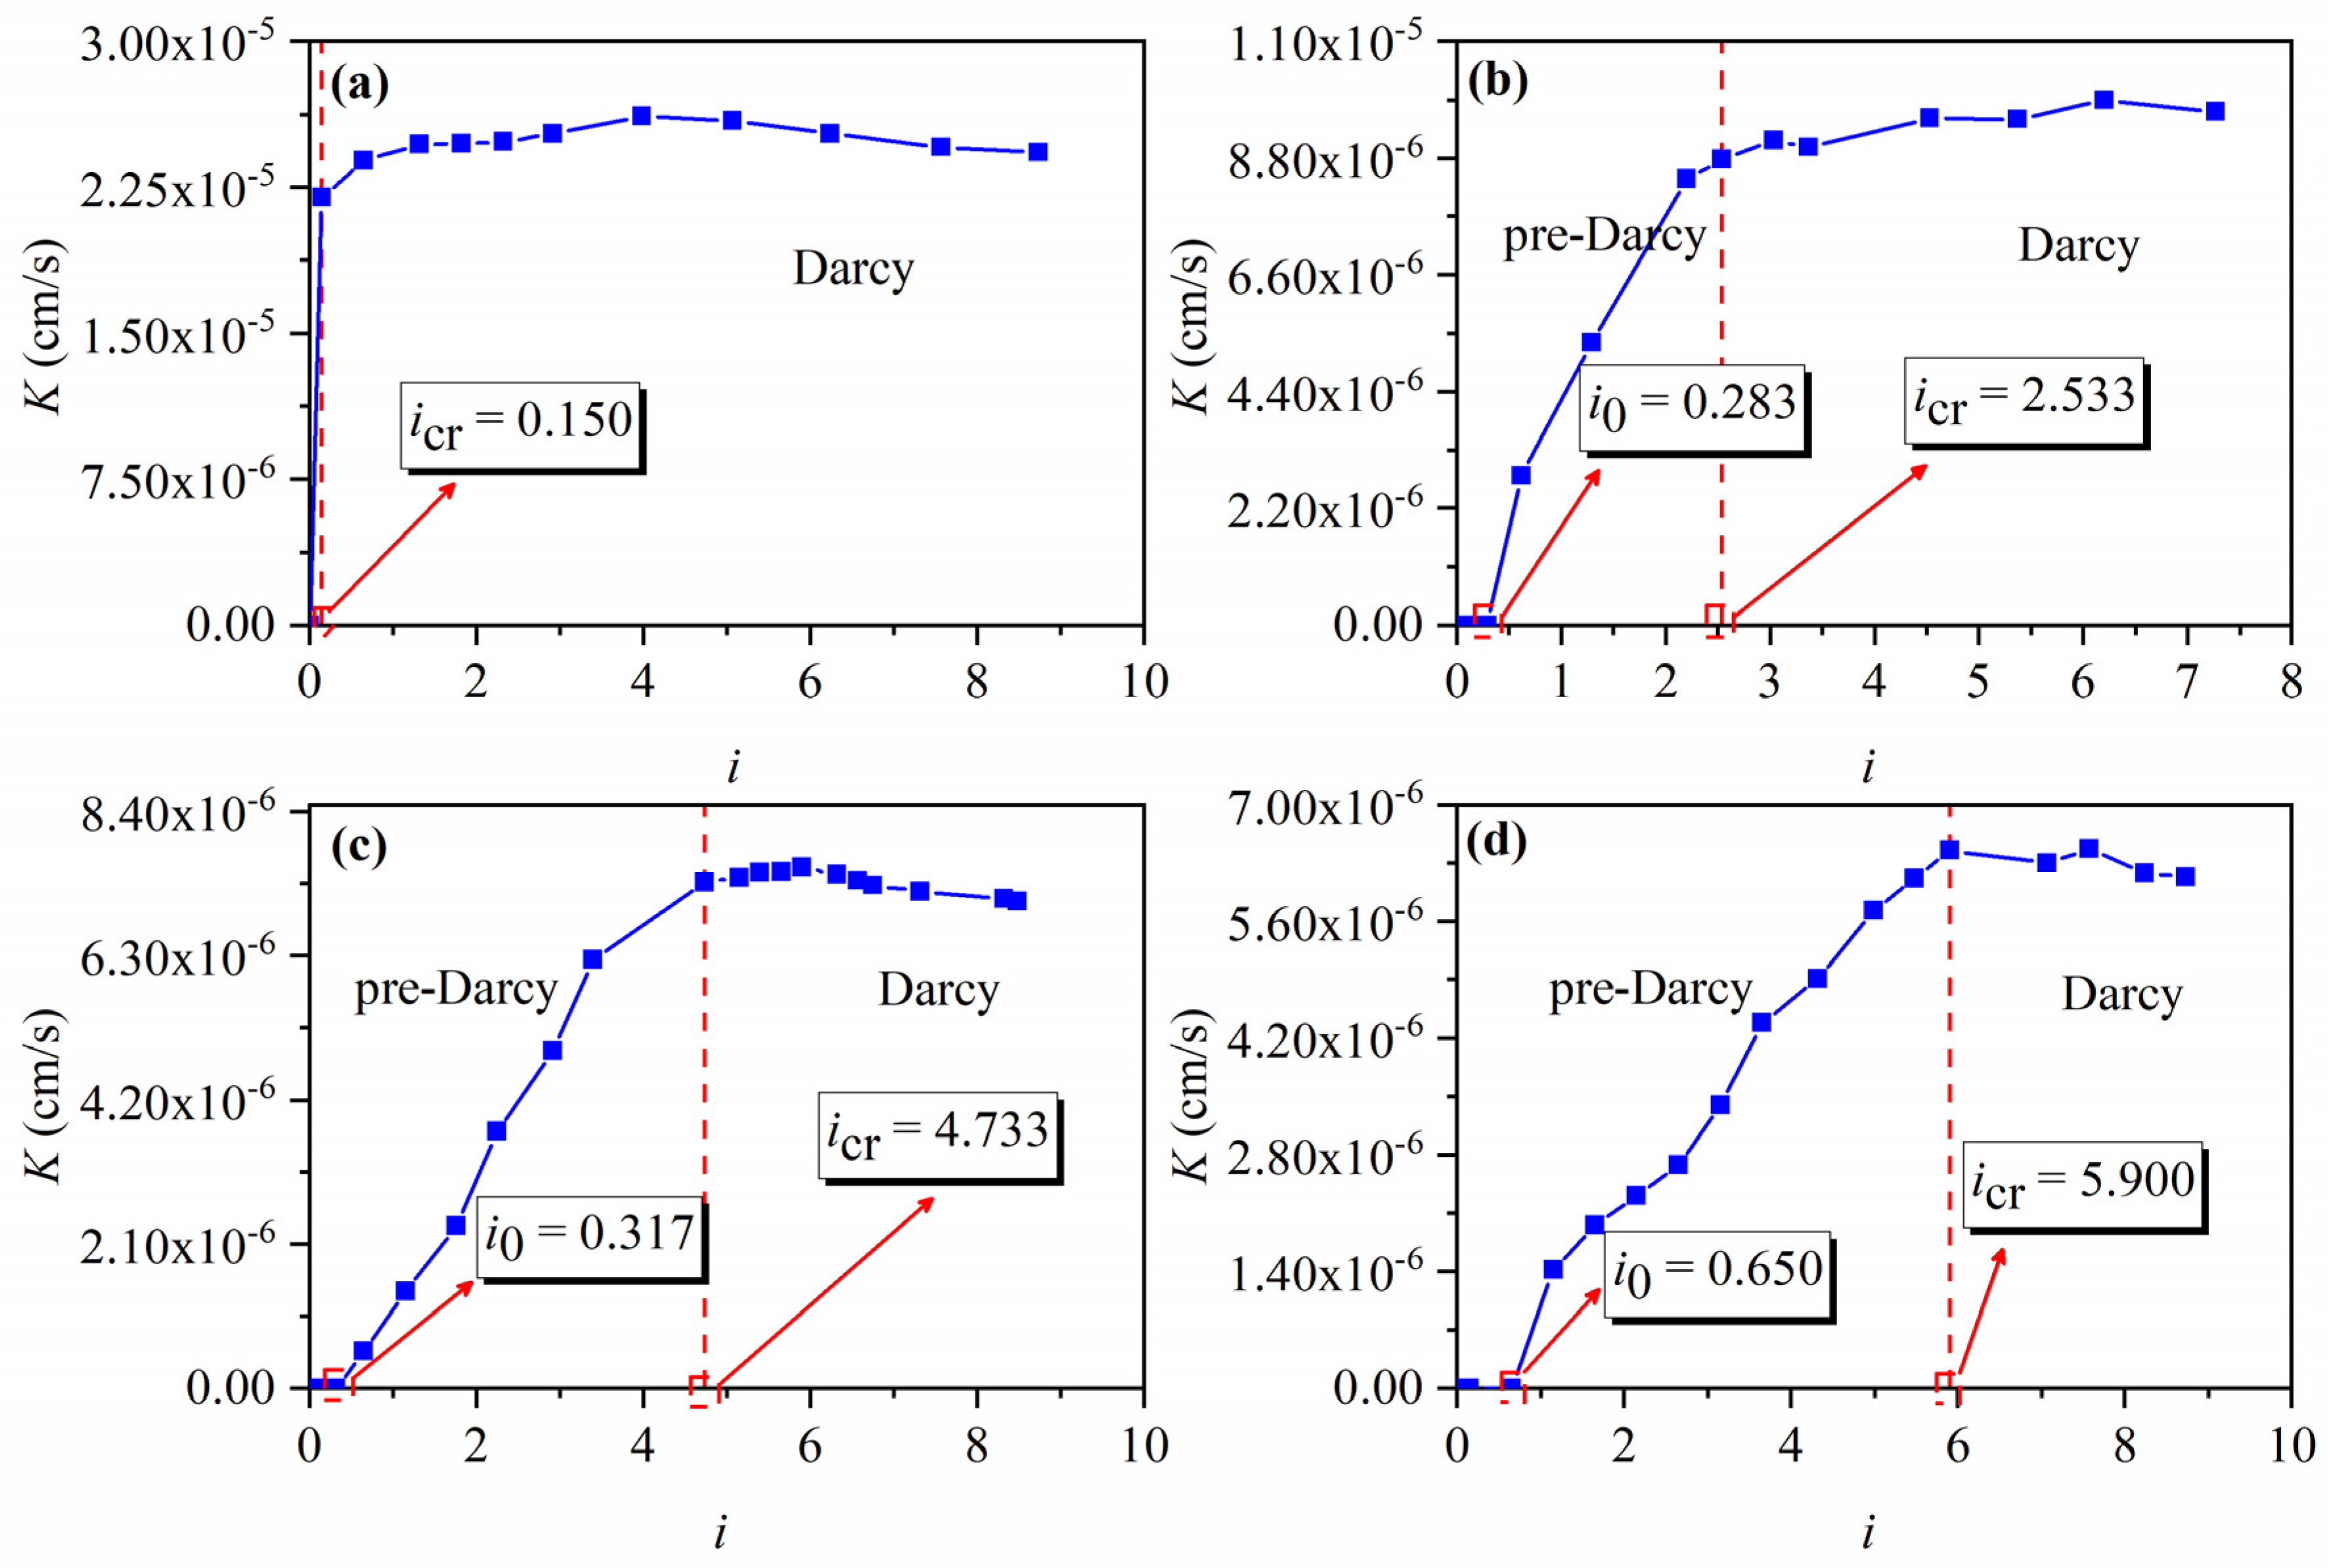
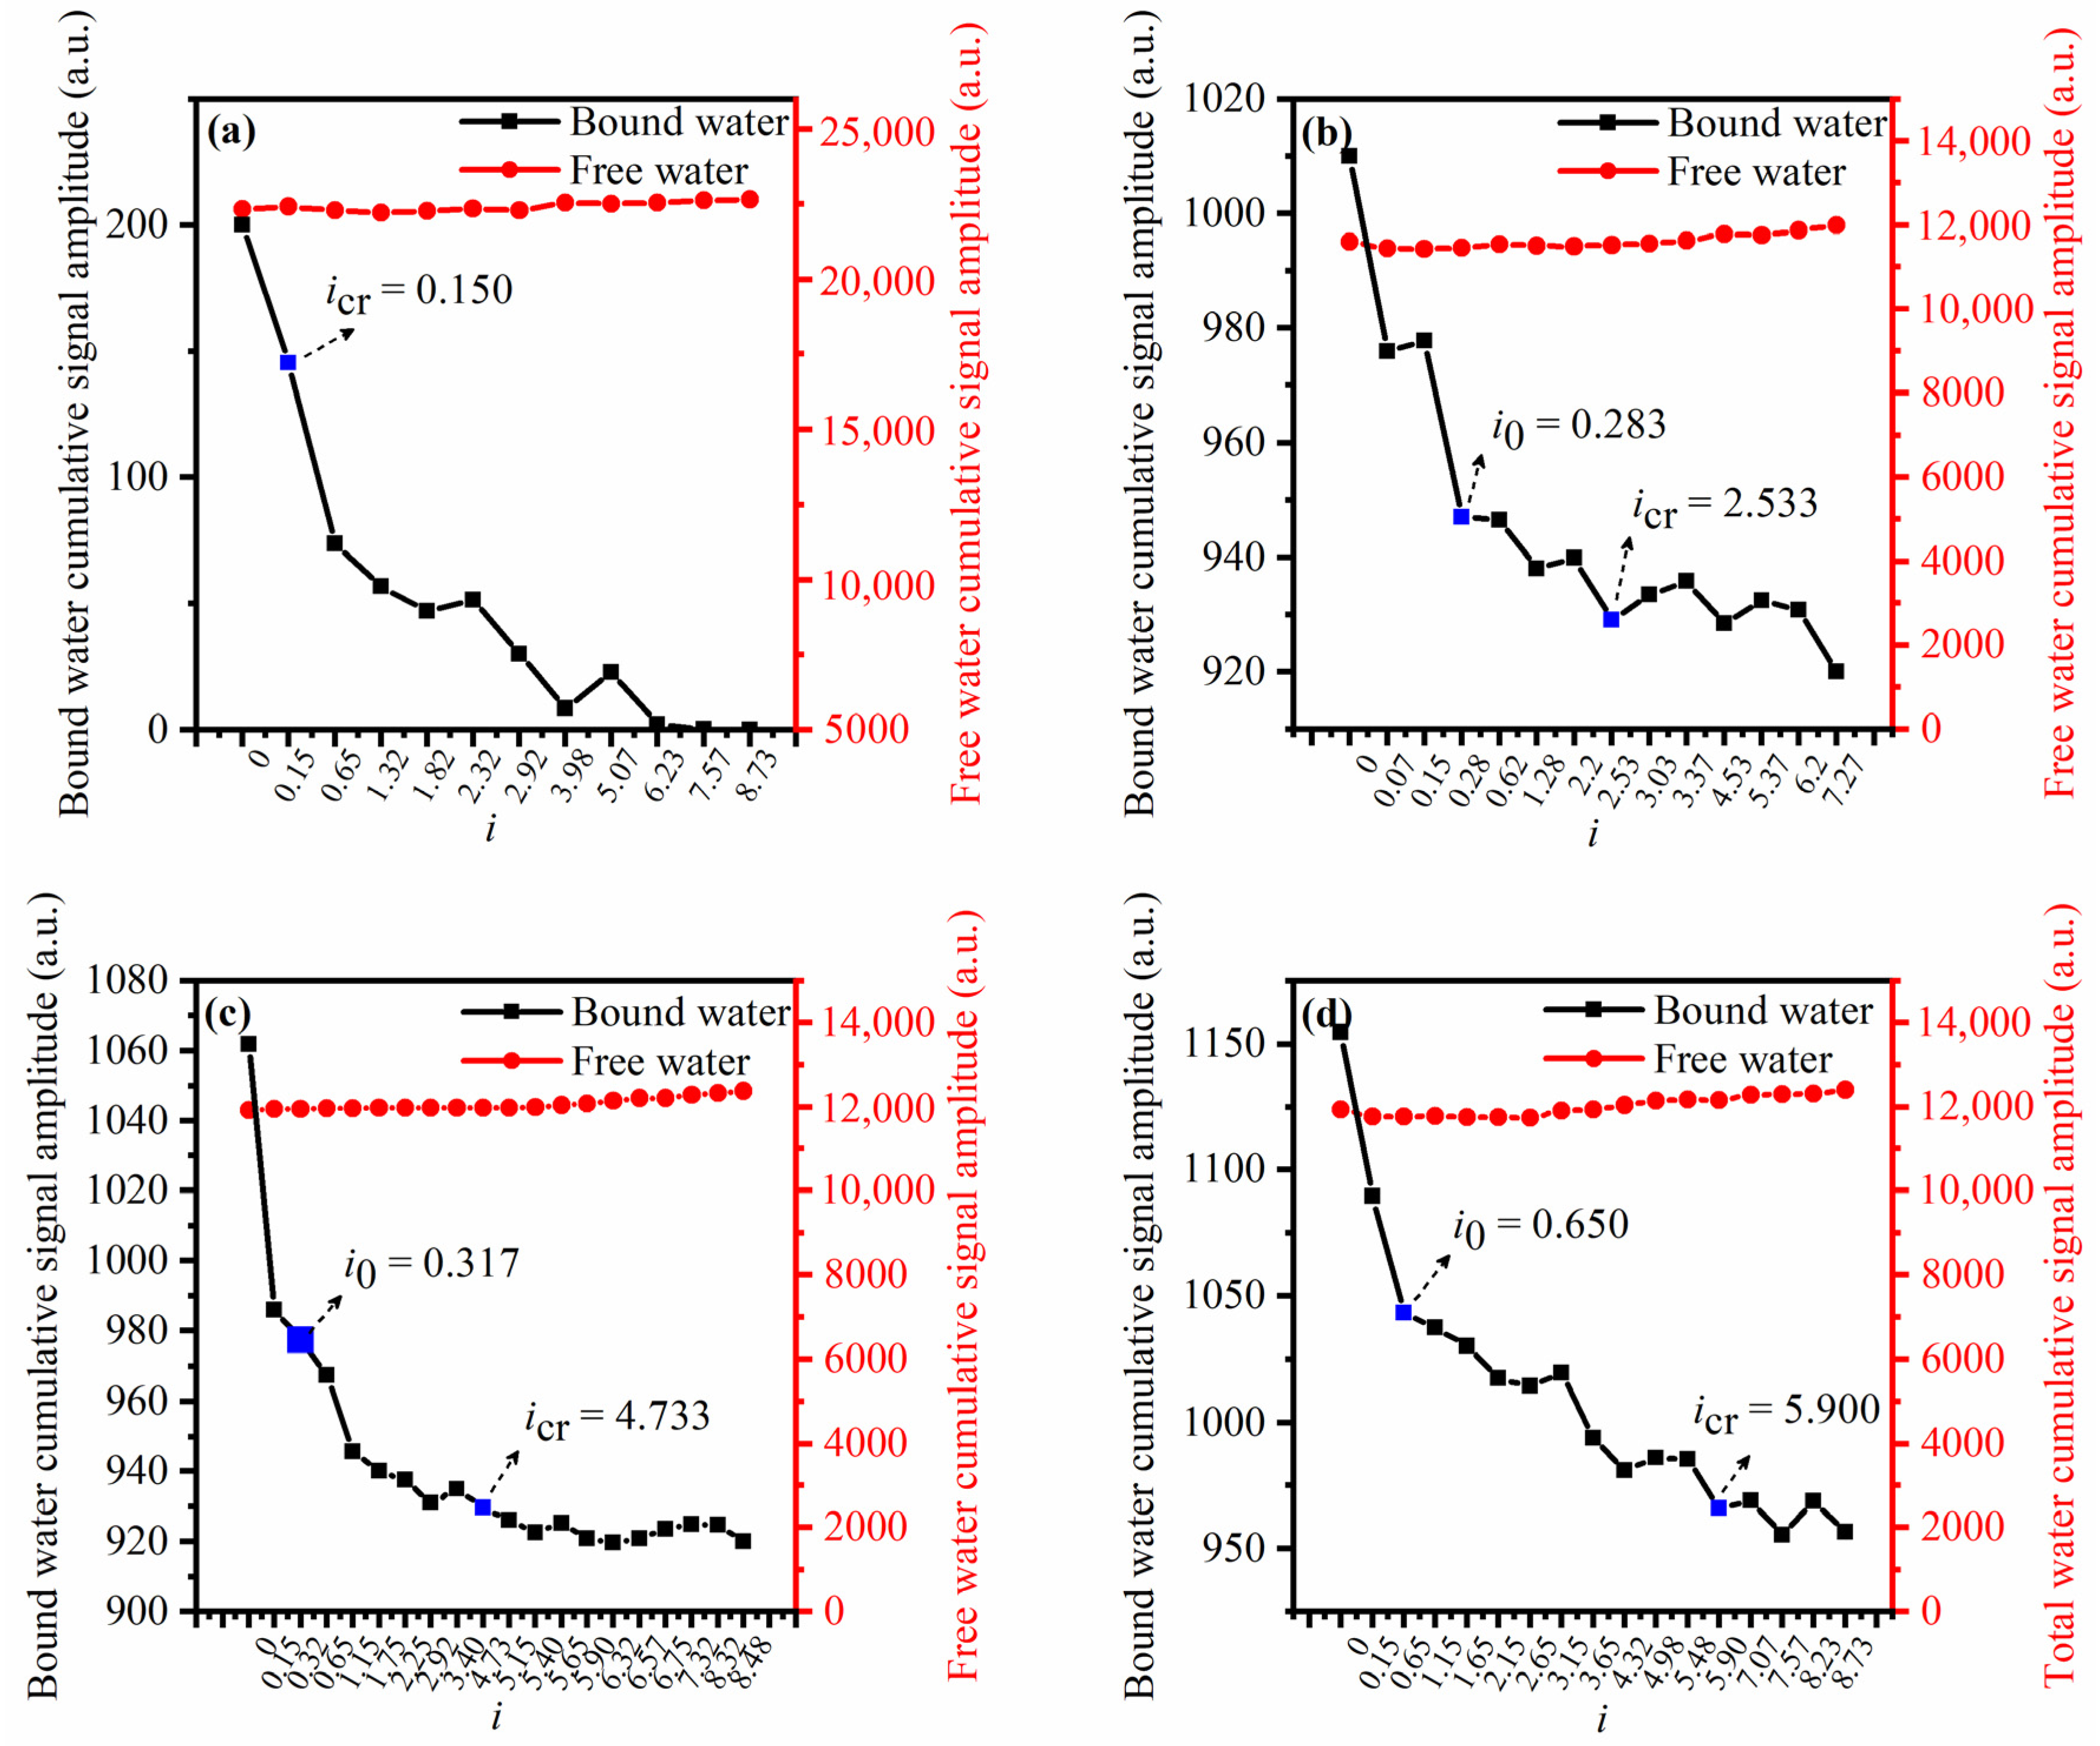
3.1. Effects of Clay Content on Threshold Hydraulic Gradients

The relationships between seepage velocity (v) and hydraulic gradient (i) for the sand–clay porous media are illustrated in Figure 2. The results show that seepage occurs when the hydraulic gradient reaches a threshold hydraulic gradient (i0) for the sand–clay porous media. When the hydraulic gradient increases to a critical hydraulic gradient (icr), the v-i curves transfer into a linear relationship. The non-seepage and non-linear regimes are identified as a pre-Darcy regime, while the linear regime is known as the Darcy’s law.
In porous media without clay (C0), the threshold hydraulic gradient was either very small or undetectable in the current experiment. The sand–clay porous media with clay contents of 12%, 15%, and 18% (C12, C15, and C18, respectively) show threshold hydraulic gradients of 0.283, 0.317, and 0.650, respectively (Figure 2b). Notably, for porous media without clay (C0), the transition from non-linear seepage to linear seepage occurred when the hydraulic gradient exceeded 0.150. In the case of porous media C12, C15, and C18, the shift in seepage behavior occurred at critical hydraulic gradients of 2.533, 4.733, and 5.900, respectively.
The observed trend indicates a positive correlation between the threshold hydraulic gradient and critical hydraulic gradient and clay content (Figure 3). This relationship is linked to the conversion of bound water into free water, a process that occurs as pore water pressure is overcome. Moreover, as the clay content increases, a more pronounced non-linear relationship emerges, and the transition from non-linear to linear seepage encompasses a wider hydraulic gradient range. This can be attributed to the interaction between clay particles and pore water, leading to the formation of a bound-water film. The presence of this bound-water film reduces the pore size within the sand–clay porous medium, impeding the passage of free water through the pores. The transformation of bound water and free water is elaborated upon in the subsequent section.
The hydraulic conductivity, K, under various hydraulic gradients is calculated according to Darcy’s law:
K = v i = Q · L A · Δ h ,
where Q is the seepage flux (cm3/s); L is the seepage path length (cm); A is the flow cross-section (cm2); Δh is the frictional head loss; and K is the hydraulic conductivity (cm/s).
As shown in Figure 4, when the hydraulic gradient satisfies i0 < i < icr, the hydraulic conductivity exhibits a positive correlation with i rather than maintaining a constant value. As icr < i, the hydraulic conductivity stabilizes, becoming independent of the hydraulic gradient, thus indicating adherence to Darcy’s law for seepage behavior. Concurrently, the hydraulic conductivity in the Darcy regime diminishes with increasing clay content. Notably, the transitional range of hydraulic gradients for the transfer of seepage behavior from pre-Darcy to Darcy becomes broader with a higher clay content, aligning with the observed trend in the previous v-i relation (see Figure 2).
The Reynolds number is a dimensionless indicator to distinguish the pore water flow state, which is the function of the particle diameter of porous media, seepage velocity, fluid viscosity coefficient, and density. The formula to calculate the Reynolds number is stated as follows:
R e = v ρ d μ ,
where v is the seepage velocity (m/s); ρ is the fluid density (kg/m3); d is the mean particle size of porous media (m); and µ is the dynamic viscosity (Pa·s).
The Reynolds number at a critical hydraulic gradient is determined for sand–clay porous media with different clay contents. The pre-Darcy critical Reynolds number was the highest for the porous medium without clay (C0), and gradually decreased with increasing clay content. Specifically, the values were 5.81 × 10⁻⁴, 4.25 × 10⁻⁵, 1.95 × 10⁻⁵, and 1.85 × 10⁻⁵ for sand–clay porous media C0, C12, C15, and C18, respectively. The exact critical Reynolds number that delineates the transition between pre-Darcy and Darcy flow regimes remains unknown. Kundu et al. [45] used glass beads with diameters of 2.5 mm and 5 mm to investigate the critical Reynolds numbers between pre-Darcy and Darcy regimes, and indicated critical values of 0.2 and 0.5, respectively. In a separate study, Dudgeon determined a pre-Darcy critical Reynolds number of 8 × 10⁻⁴ for porous media consisting of river gravel sand [46]. In Dukha’s experiments [47], a critical Reynolds number of 0.4 was obtained. The smaller critical Reynolds numbers obtained in this study were due to the particle size of the clay. This study used quartz sand and clay with particle sizes of 0.45 mm and 0.075 mm, respectively. The size in this study was two orders of magnitude smaller than that in previous studies.

3.2. Bound-Water Control on Seepage Behavior

Transformations of bound water and free water in sand–clay porous media were monitored using the LF-NMR technique, and their quantification was based on the T2 signal analysis. The resulting T2 signal distribution curve under different hydraulic gradients is visually depicted in Figure 5. The T2 signal distribution curve illustrates the relationship between relaxation time, pore size, and water molecule activity within the sand–clay porous media. Generally, larger pore sizes correspond to stronger water activity and longer relaxation times in the saturated state. Typically, free water exhibits a relaxation time greater than 10 ms, while bound water exhibits a relaxation time less than 10 ms. By analyzing the relaxation time range of the peak, the water status in the sand–clay porous media can be effectively categorized.
The T2 signal distribution curves of the four sand–clay porous media exhibit a primary peak accompanied by several smaller peaks. The T2 range of the largest peak for C0, C12, C15, and C18 is summarized in Table 4. Equation (3) indicates that the leftward shift observed in the T2 signal distribution curves may be attributed to an increase in the sand–clay porous medium’s surface relaxation ratio or a decrease in pore size as the clay content increases. As the clay content increases, the pores within the sand–clay porous media gradually diminish, leading to an increase in bound-water content.
In sand–clay porous media, bound water is typically located at the solid–liquid interface, while free water is present outside the bound-water region. The interaction between clay particles and water molecules leads to the formation of a bound-water film with a specific thickness. By establishing the T2 cutoff value for each sand–clay porous media, the signal intensities of bound water and free water under different hydraulic gradients were calculated and depicted in Figure 6. As the hydraulic gradient increases, the signal intensity of bound water demonstrates a decrease, while free water exhibits an escalating trend, particularly in sand–clay porous media containing clay.
When the hydraulic gradient increases from 0 to the threshold hydraulic gradient, the signal intensity of bound water decreases, while free water exhibits an increasing trend, particularly in sand–clay porous media containing clay. However, under low hydraulic gradients, the bound-water film does not transmit pore water pressure, but occupies part of the pore space and reduces the pore diameter (Figure 7a). Therefore, the free water within the soil cannot smoothly pass through the pores of sand–clay porous media, resulting in no seepage. When i0 < i < icr, the signal intensity of bound water continues to decrease. During this stage, the pore water pressure gradually overcomes the adsorption force of the bound-water film [48]. This causes the weakly bound water in the outer layer of the bound-water film to transform Into free water. As a result, the thickness of the bound-water film (Figure 7b) continuously reduces, leading to gradual seepage that demonstrates a non-linear pattern. As the hydraulic gradient increases to a critical hydraulic gradient, seepage reaches the Darcy regime. The signal intensity of bound water decreases to a constant value, indicating that the thickness of the bound-water film reaches the minimum value. At this point, the bound-water film only consists of strongly bound water, which cannot flow or participate in pressure diffusion.

3.3. Effects of Clay Content on Seepage Behavior

Due to the adsorption of clay particles, the more clay particles in the sand–clay porous media, the higher the contents of bound-water film and bound water [21]. As shown in Figure 6, a higher clay content can be observed in sand–clay porous media C12, C15, and C18 compared to C0. The bound-water film diminishes the effective pore size for flow, which directly influences the transition of seepage behavior. The hydraulic conductivity (see Figure 8) serves as a crucial indicator for identifying the seepage stage, and its evolution provides an insight into the effects of clay content on seepage behavior. Figure 8 illustrates the inverse relationship between the increasing bound-water proportion and the hydraulic conductivity in sand–clay porous media. As the hydraulic gradient increases, a gradual transformation of bound water into free water occurs, resulting in a reduction in the bound-water proportion and an increase in water mobility. This leads to a progressive rise in hydraulic conductivity, indicating a gradual shift in the seepage states from no flow to non-linear flow and to linear behavior.
The increase in clay particles augments the number of micropores in the soil sample, resulting in a higher amount of bound water. Therefore, the proportion of transformed bound water required for seepage and the transition from non-linear to linear seepage states increase with the clay content. When icr < i, the rate of bound-water transformation into free water decelerates to zero, stabilizing the bound-water proportion in the sand–clay porous media, and consequently leading to a stabilization of hydraulic conductivity.

4. Conclusions

In this study, a series of constant-head seepage experiments were conducted in sand–clay porous media with different clay contents, and LF-NMR technology was utilized to directly measure the change in water status in the sand–clay porous media during the seepage processes. From a microscopic point of view, we analyzed how bound water transformed and affected the seepage processes in sand–clay porous media with different clay contents. The findings of this study reveal that, under the influence of a hydraulic gradient, weakly bound water can be transformed into free water and participate in seepage, consequently impacting the seepage state of soil. The main conclusions derived from this study are as follows:
  • The threshold hydraulic gradient and the critical hydraulic gradient are related to the clay content of sand–clay porous media. The threshold hydraulic gradient (i0), representing the minimum gradient for flow initiation, demonstrates an increasing trend with higher clay content. Additionally, an expansion in the range of hydraulic gradients in the pre-Darcy flow is observed as the clay content of the porous media increases.
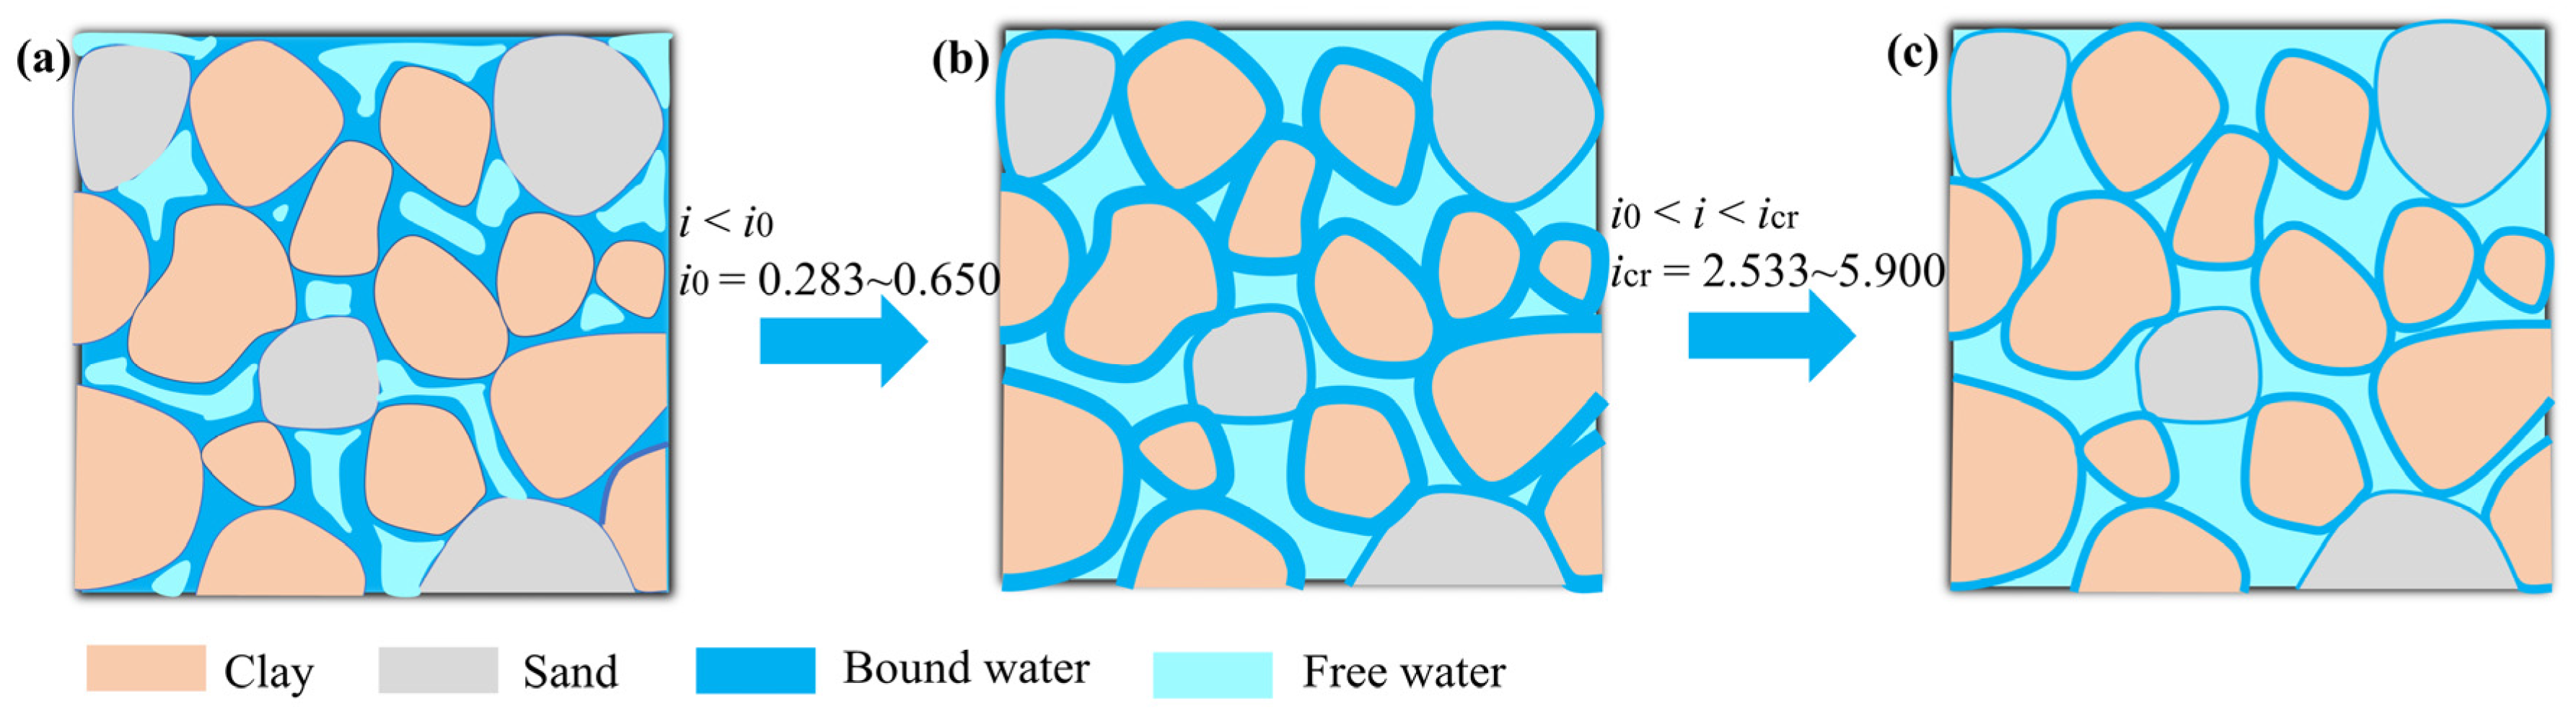
  • The adsorption of water molecules by clay particles, leading to the formation of a bound-water film, significantly influences the threshold hydraulic gradient. The bound water within the pores of sand–clay porous media particles restricts the flow of water molecules. This phenomenon causes a deviation in seepage behavior from Darcy’s law in sand–clay porous media with a high clay content under low-hydraulic-gradient conditions. As the hydraulic gradient gradually increases, the seepage behavior of the sand–clay porous media becomes non-linear when i0 < i < icr, accompanied by an increase in the hydraulic conductivity of the sand–clay porous media.
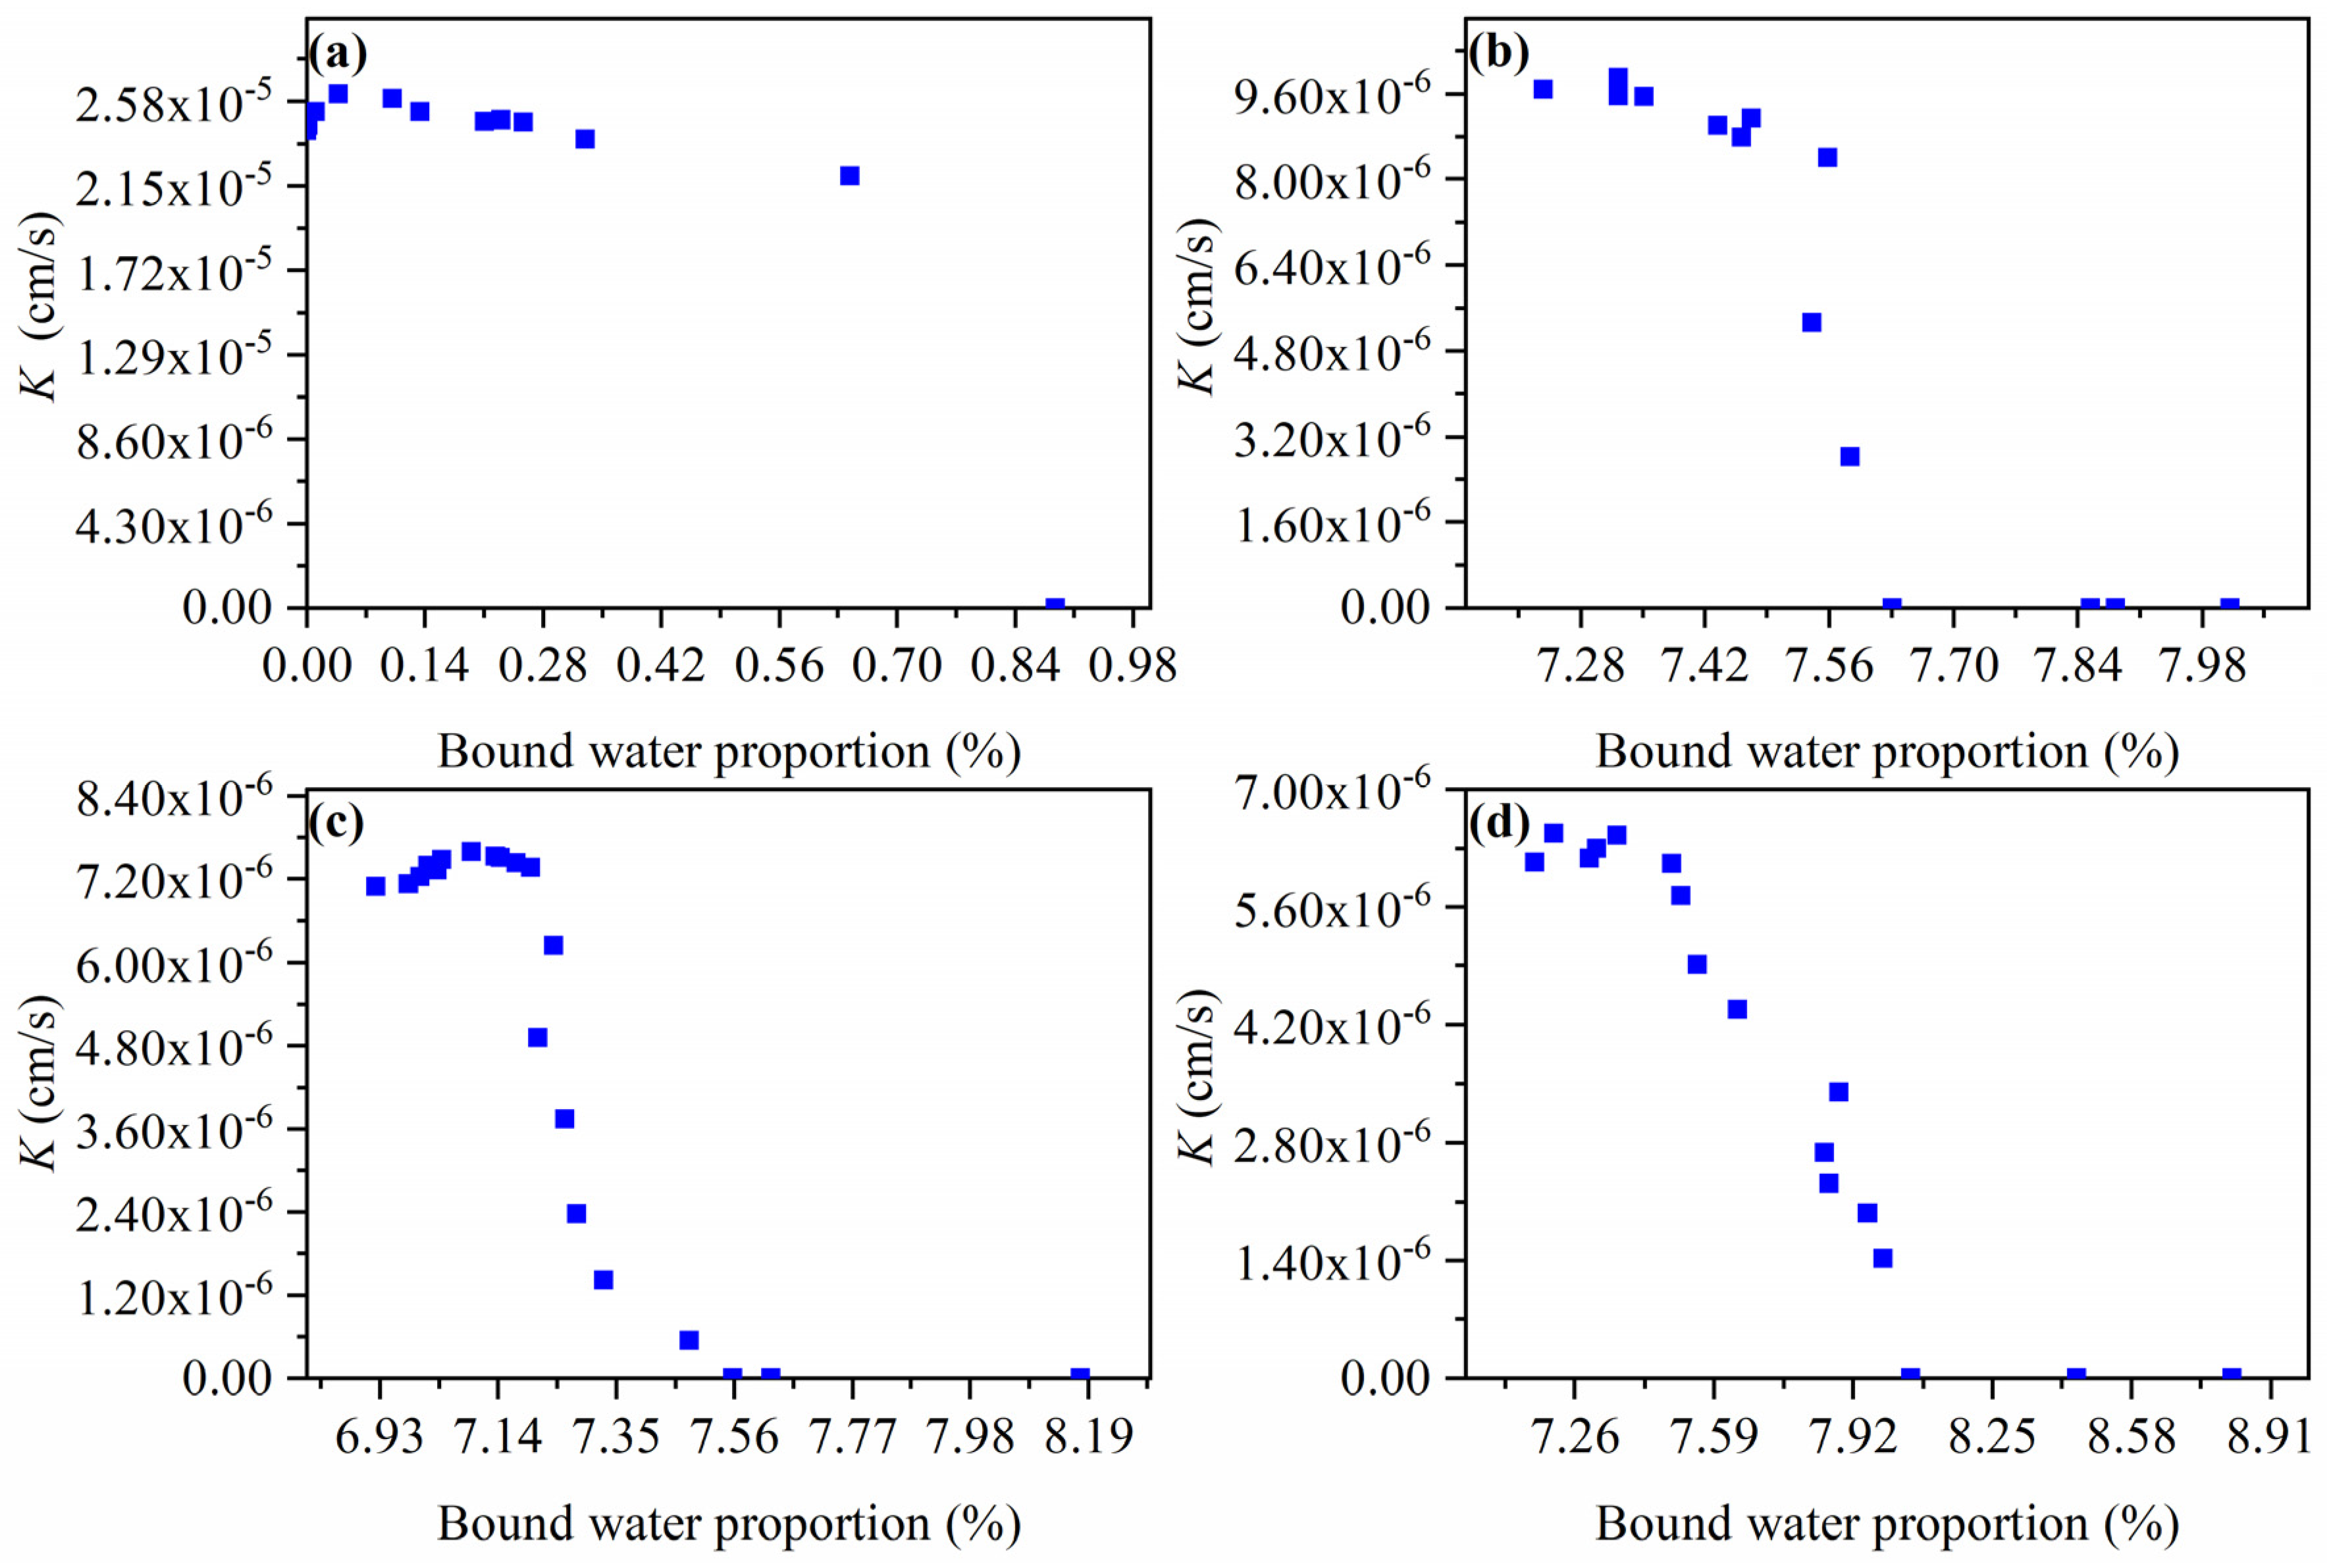
  • LF-NMR technology can be employed to characterize the transformation between bound-water and free-water contents during seepage processes. The alteration in the semaphore as the hydraulic gradient increases indicates the shift from bound water to free water. It can be observed that the hydraulic conductivity is inversely correlated to the proportion of bound water in clay–sand porous media.
  • The transition of bound water, including both weakly bound water and strongly bound water, near the threshold and critical hydraulic gradients elucidate the microscopic mechanism of the change in the seepage state. As the hydraulic gradient increases, the weakly bound water on soil particle surfaces gradually transitions into free water, causing a continuous thinning of the bound-water film. This transformation plays a role in soil seepage, ultimately altering its seepage state. As a result, soil particle pores fill with highly-mobile free water, leading to a transition in the seepage state from non-linear to linear seepage.

Supplementary Materials

The following supporting information can be downloaded at: https://0-www-mdpi-com.brum.beds.ac.uk/article/10.3390/w16060883/s1, Figure S1: T2 distribution curve of soil samples (a) C0, (b) C12, (c) C15 and (d) C18 with drying time.; Figure S2:T2 cutoff values of soil samples (a) C0, (b) C12, (c) C15 and (d) C18, the black and red dashed lines respectively indicate the cumulative signal amplitude under saturated soil sample and after drying for a certain time, while the black and red solid lines respectively indicate the T2 signal amplitude under saturated soil sample and after drying for a certain time. Figure S3: Relationship curve between T2 cutoff value and clay content.

Author Contributions

Conceptualization, Z.D. and X.Z. (Xueyi Zhang); Z.D.; methodology, Z.D., J.S and X.Z. (Xueyi Zhang); validation, Z.D. and X.Z. (Xueyi Zhang); formal analysis, Y.Y., Z.D., J.S. and X.Z. (Xueyi Zhang); investigation, Z.D. and X.Z. (Xueyi Zhang); resources, Z.D.; data curation, Z.D.; writing—original draft preparation, Y.Y., X.Z. (Xiao Zhang), Z.C., Z.D., J.S., Y.C. and X.Z. (Xueyi Zhang); writing—review and editing, Y.Y., X.Z. (Xiao Zhang), Z.C., Z.D., Y.C. and X.Z. (Xueyi Zhang); visualization, Z.D. and X.Z. (Xueyi Zhang); supervision, Z.D.; project administration, Z.D.; funding acquisition, Z.D. All authors have read and agreed to the published version of the manuscript.

Funding

This work was financially supported by the National Key Research and Development Program of China (No. 2023YFC3209700); the key research project of Shandong Provincial Water Diversion Project Operation and Maintenance Center (202306); and the Postgraduate Research and Practice Innovation Program of Jiangsu Province (KYCX23_0734).

Data Availability Statement

The original contributions presented in the study are included in the article/Supplementary Materials; further inquiries can be directed to the corresponding authors.

Conflicts of Interest

Authors Ziteng Cui and Xiao Zhang were employed by the company China Water Investment Co., LTD. The remaining authors declare that the research was conducted in the absence of any commercial or financial relationships that could be construed as a potential conflict of interest.

References

  1. Dejam, M.; Hassanzadeh, H.; Chen, Z. Pre-Darcy Flow in Porous Media. Water Resour. Res. 2017, 53, 8187–8210. [Google Scholar] [CrossRef]
  2. Farmani, Z.; Azin, R.; Fatehi, R.; Escrochi, M. Analysis of Pre-Darcy flow for different liquids and gases. J. Pet. Sci. Eng. 2018, 168, 17–31. [Google Scholar] [CrossRef]
  3. Bloshanskaya, L.; Ibragimov, A.; Siddiqui, F.; Soliman, M.Y. Productivity Index for Darcy and pre-/post-Darcy Flow (Analytical Approach). J. Porous Media 2015, 20, 769–786. [Google Scholar] [CrossRef]
  4. Elsanoose, A.; Abobaker, E.; Khan, F.; Rahman, M.A.; Aborig, A.; Butt, S.D. Characterization of a Non-Darcy Flow and Development of New Correlation of NON-Darcy Coefficient. Energies 2022, 15, 7616. [Google Scholar] [CrossRef]
  5. Elsanoose, A.; Abobaker, E.; Khan, F.; Rahman, M.A.; Aborig, A.; Butt, S.D. Estimating of Non-Darcy Flow Coefficient in Artificial Porous Media. Energies 2022, 15, 1197. [Google Scholar] [CrossRef]
  6. Fang, Y.G.; Gu, R.G.; Pan, W.D. Theoretical Model Study of Micro-Electric Field Effects on Seepage in Micro Particle Clays. AMR 2011, 239–242, 2946–2952. [Google Scholar] [CrossRef]
  7. Basak, P. Non-Darcy Flow and its Implications to Seepage Problems. J. Irrig. Drain. Div. 1977, 103, 459–473. [Google Scholar] [CrossRef]
  8. Bağcı, Ö.; Dukhan, N.; Özdemir, M. Flow Regimes in Packed Beds of Spheres from Pre-Darcy to Turbulent. Transp. Porous Med. 2014, 104, 501–520. [Google Scholar] [CrossRef]
  9. Tek, M.R. Development of a Generalized Darcy Equation. J. Pet. Technol. 1957, 9, 45–47. [Google Scholar] [CrossRef]
  10. Hubbert, M.K. Darcy’s Law and the Field Equations of the Flow of Underground Fluids. Trans. AIME 1956, 207, 222–239. [Google Scholar] [CrossRef]
  11. Prada, A.; Civan, F. Modification of Darcy’s law for the threshold pressure gradient. J. Pet. Sci. Eng. 1999, 22, 237–240. [Google Scholar] [CrossRef]
  12. Costa, U.M.S.; Andrade, J.S., Jr.; Makse, H.A.; Stanley, H.E. The role of inertia on fluid flow through disordered porous media. Phys. A Stat. Mech. Appl. 1999, 266, 420–424. [Google Scholar] [CrossRef]
  13. Hlushkou, D.; Tallarek, U. Transition from creeping via viscous-inertial to turbulent flow in fixed beds. J. Chromatogr. A 2006, 1126, 70–85. [Google Scholar] [CrossRef] [PubMed]
  14. Agnaou, M.; Lasseux, D.; Ahmadi, A. Origin of the inertial deviation from Darcy’s law: An investigation from a microscopic flow analysis on two-dimensional model structures. Phys. Rev. E 2017, 96, 043105. [Google Scholar] [CrossRef] [PubMed]
  15. Choi, E.; Chakma, A.; Nandakumar, K. A bifurcation study of natural convection in porous media with internal heat sources: The non-Darcy effects. Int. J. Heat Mass Transf. 1998, 41, 383–392. [Google Scholar] [CrossRef]
  16. Zhang, X.-Y.; Dou, Z.; Wang, J.-G.; Zhou, Z.-F.; Zhuang, C. Non-Darcy flows in layered porous media (LPMs) with contrasting pore space structures. Pet. Sci. 2022, 19, 2004–2013. [Google Scholar] [CrossRef]
  17. Moret-Fernández, D.; Latorre, B. A novel double disc method to determine soil hydraulic properties from drainage experiments with tension gradients. J. Hydrol. 2022, 615, 128625. [Google Scholar] [CrossRef]
  18. Xue, W.; Twenda, C.; Alam, M.S.; Xu, L.; Wang, Z. Experimental study on seepage characteristics and stress sensitivity of desulfurization gypsum based concrete under triaxial stress. J. Mater. Res. Technol. 2023, 24, 6425–6437. [Google Scholar] [CrossRef]
  19. Liu, J.; Yang, Q.; Bai, X.; Song, K.; Luo, C.; Sa, Y. Parameters Quantification of Forchheimer Equation and Critical Point of Transition from Darcian to Non-Darcian Flow. J. Southwest Jiaotong Univ. 2020, 55, 218–224. [Google Scholar] [CrossRef]
  20. Ding, W.; Liu, X.; Hu, F.; Zhu, H.; Luo, Y.; Li, S.; Li, H. How the particle interaction forces determine soil water infiltration: Specific ion effects. J. Hydrol. 2019, 568, 492–500. [Google Scholar] [CrossRef]
  21. Osipov, V.I. Nanofilms of adsorbed water in clay: Mechanism of formation and properties. Water Resour. 2012, 39, 709–721. [Google Scholar] [CrossRef]
  22. Wang, H.; Qian, H.; Gao, Y. Non-darcian flow in loess at low hydraulic gradient. Eng. Geol. 2020, 267, 105483. [Google Scholar] [CrossRef]
  23. Chu, Q.; Lin, L.; Zhao, Y. Hyperbranched polyethylenimine modified with silane coupling agent as shale inhibitor for water-based drilling fluids. J. Pet. Sci. Eng. 2019, 182, 106333. [Google Scholar] [CrossRef]
  24. Min, F.; Peng, C.; Song, S. Hydration Layers on Clay Mineral Surfaces in Aqueous Solutions: A Review/Warstwy Uwodnione Na Powierzchni Minerałów Ilastych W Roztworach Wodnych: Przegląd. Arch. Min. Sci. 2014, 59, 489–500. [Google Scholar] [CrossRef]
  25. Da Silva, G.J.; Fossum, J.O.; DiMasi, E.; Måløy, K.J. Hydration transitions in a nanolayered synthetic silicate: A synchrotron x-ray scattering study. Phys. Rev. B 2003, 67, 094114. [Google Scholar] [CrossRef]
  26. Scherb, S.; Beuntner, N.; Thienel, K.-C.; Neubauer, J. Quantitative X-ray diffraction of free, not chemically bound water with the PONKCS method. J. Appl. Crystallogr. 2018, 51, 1535–1543. [Google Scholar] [CrossRef]
  27. Rivera-Hernández, J.R.; Green-Ruiz, C. Geosorption of As(III) from Aqueous Solution by Red Clays: Kinetic Studies. Bull. Environ. Contam. Toxicol. 2014, 92, 596–601. [Google Scholar] [CrossRef] [PubMed]
  28. Yang, E.-J.; Zeng, Z.-T.; Mo, H.-Y.; Hu, T.; Yang, C.-L.; Tang, S.-H. Analysis of Bound Water and Its Influence Factors in Mixed Clayey Soils. Water 2021, 13, 2991. [Google Scholar] [CrossRef]
  29. Li, S.; Wang, C.; Zhang, X.; Zou, L.; Dai, Z. Classification and characterization of bound water in marine mucky silty clay. J. Soils Sediments 2019, 19, 2509–2519. [Google Scholar] [CrossRef]
  30. Kok, M.V. Thermogravimetry of Selected Bentonites. Energy Sources 2002, 24, 907–914. [Google Scholar] [CrossRef]
  31. Dou, Z.; Chen, Y.; Zhuang, C.; Zhou, Z.; Wang, J. Emergence of non-aqueous phase liquids redistribution driven by freeze-thaw cycles in porous media based on low-field NMR. J. Hydrol. 2022, 612, 128106. [Google Scholar] [CrossRef]
  32. Cong, X.; Zhou, W.; Geng, X.; Elchalakani, M. Low field NMR relaxation as a probe to study the effect of activators and retarders on the alkali-activated GGBFS setting process. Cem. Concr. Compos. 2019, 104, 103399. [Google Scholar] [CrossRef]
  33. Lu, Z.; Sha, A.; Wang, W. Permeability Evaluation of Clay-Quartz Mixtures Based on Low-Field NMR and Fractal Analysis. Appl. Sci. 2020, 10, 1585. [Google Scholar] [CrossRef]
  34. Lapasin, R.; Grassi, M.; Abrami, M.; Šebenik, U. Structural evolution of salt-free aqueous Laponite dispersions: A study based on low-field NMR relaxometry and rheological investigations. Colloids Surf. A Physicochem. Eng. Asp. 2020, 602, 125126. [Google Scholar] [CrossRef]
  35. Xie, G.; Xiao, Y.; Deng, M.; Zhang, Q.; Huang, D.; Jiang, L.; Yang, Y.; Luo, P. Quantitative Investigation of the Hydration Behavior of Sodium Montmorillonite by Thermogravimetric Analysis and Low-Field Nuclear Magnetic Resonance. Energy Fuels 2019, 33, 9067–9073. [Google Scholar] [CrossRef]
  36. Shi, J.; Chun, Q.; Feng, S.; Liu, C.; Liu, Z.; Wang, D.; Zhang, Y. Pore structure and fractal dimension analysis of ancient city wall bricks in China. J. Build. Eng. 2023, 76, 107324. [Google Scholar] [CrossRef]
  37. Xu, G.; Jiang, Y.; Shi, Y.; Han, Y.; Wang, M.; Zeng, X. Experimental investigations of fracturing fluid flowback and retention under forced imbibition in fossil hydrogen energy development of tight oil based on nuclear magnetic resonance. Int. J. Hydrogen Energy 2020, 45, 13256–13271. [Google Scholar] [CrossRef]
  38. Saito, N.; Kitamaki, Y.; Ihara, T. Accurate determination of highly volatile chloroethylene by quantitative 1H-NMR. Environ. Chem. Lett. 2021, 19, 1893–1901. [Google Scholar] [CrossRef]
  39. Kwaw, A.K.; Dou, Z.; Wang, J.; Zhang, X.; Chen, Y. Advancing the knowledge of solute transport in the presence of bound water in mixed porous media based on low-field nuclear magnetic resonance. J. Hydrol. 2023, 617, 129059. [Google Scholar] [CrossRef]
  40. Stanisic, D.; Martins, L.G.; Tasic, L. Nuclear Magnetic Resonance Spectroscopy in Analyses of Biological Samples. In Tools and Trends in Bioanalytical Chemistry; Kubota, L.T., da Silva, J.A.F., Sena, M.M., Alves, W.A., Eds.; Springer International Publishing: Cham, Switzerland, 2022; pp. 203–221. ISBN 978-3-030-82381-8. [Google Scholar]
  41. Bendel, P. Spin-echo attenuation by diffusion in nonuniform field gradients. J. Magn. Reson. (1969) 1990, 86, 509–515. [Google Scholar] [CrossRef]
  42. Chen, Y.; Zhou, Z.; Wang, J.; Zhao, Y.; Dou, Z. Quantification and division of unfrozen water content during the freezing process and the influence of soil properties by low-field nuclear magnetic resonance. J. Hydrol. 2021, 602, 126719. [Google Scholar] [CrossRef]
  43. Hun, L.; Bing, Y.; Xixiang, S.; Xinyi, S.; Lifei, D. Fracturing fluid retention in shale gas reservoir from the perspective of pore size based on nuclear magnetic resonance. J. Hydrol. 2021, 601, 126590. [Google Scholar] [CrossRef]
  44. Wang, X.-W.; Yang, Z.-M.; Li, H.-B.; Guo, H.-K. Experimental study on pore structure of low permeability core with NMR spectra. J. Southwest Pet. Univ. (Sci. Technol. Ed.) 2010, 32, 69–72. [Google Scholar] [CrossRef]
  45. Kundu, P.; Kumar, V.; Mishra, I.M. Experimental and numerical investigation of fluid flow hydrodynamics in porous media: Characterization of pre-Darcy, Darcy and non-Darcy flow regimes. Powder Technol. 2016, 303, 278–291. [Google Scholar] [CrossRef]
  46. Dudgeon, C.R. An experimental study of the flow of water through coarse granular media. La Houille Blanche 1966, 52, 785–801. [Google Scholar] [CrossRef]
  47. Dukhan, N.; Bağcı, Ö.; Özdemir, M. Metal foam hydrodynamics: Flow regimes from pre-Darcy to turbulent. Int. J. Heat Mass Transf. 2014, 77, 114–123. [Google Scholar] [CrossRef]
  48. Tang, L.; Chen, H.; Song, J. Process of pore pressure diffusion in saturated clay soil and impact of adsorbed water. Geosci. J. 2016, 20, 649–665. [Google Scholar] [CrossRef]
Figure 1. Scheme of the experimental setup: (a) seepage generation system; (b) flow test system; (c) LF-NMR analysis system.
Water 16 00883 g001
Figure 2. The v-i curves of sand–clay porous media with different clay contents. (a) The critical hydraulic gradients of sand–clay porous media. (b) The threshold hydraulic gradients of sand–clay porous media.
Water 16 00883 g002
Figure 3. (a). The relationship between i0 and clay content. (b). The relationship between icr and clay content.
Water 16 00883 g003
Figure 4. K-i curves of sand–clay porous media (a) without clay and with different clay contents of (b) 12%, (c) 15%, and (d) 18%.
Water 16 00883 g004
Figure 5. T2 signal distribution curves of sand–clay porous media: (a) C0, (b) C12, (c) C15, and (d) C18 under different hydraulic gradients.
Water 16 00883 g005
Figure 6. Signal intensities of bound water, free water, and total water in sand–clay porous media (a) C0, (b) C12, (c) C15, and (d) C18 under different hydraulic gradients, where the red line is the change in the cumulative signal amplitude of free water, the black line is the change in the cumulative signal amplitude of bound water.
Water 16 00883 g006
Figure 7. Microscopic diagram of the pores during the percolation process of sand–clay porous media. (ac) Microscopic diagrams of the distributions of bound water and free water in the pores of soil particles during the seepage process.
Water 16 00883 g007
Figure 8. Relationship between hydraulic conductivity and percentage of bound water in seepage of sand–clay porous media: (a) C0, (b) C12, (c) C15, and (d) C18.
Water 16 00883 g008
Table 1. The compositions of the sand–clay porous media.
Sample NameClay ContentDry Density (g/cm3)Porosity
C00%1.65 ± 0.050.37 ± 0.05
C1212%1.68 ± 0.050.36 ± 0.05
C1515%1.67 ± 0.050.38 ± 0.05
C1818%1.69 ± 0.050.37 ± 0.05
Table 2. Physical parameters of the sand–clay porous media.
NameParticle Size/mmMineral CompositionSpecific Gravity
Illite Powder0.075Muscovite, Potassium Feldspar2.6
Quartz Sand0.45–0.6/2.65
Table 3. The parameters used for the CMPG pulse sequence.
CPMGValue
Sampling Frequency (kHz)200
RF Delay (ms)0.002
Waiting Time (ms)6000
Cumulative Frequency8
Echo Time (ms)0.25
Number of Echoes14,000
Table 4. Relaxation time range of the main peak in the T2 spectrum of the sample.
SampleC0C12C15C18
Relaxation Time130.69–2244.53 ms3.17–60.03 ms2.54–35.18 ms2.20–30.47 ms
Disclaimer/Publisher’s Note: The statements, opinions and data contained in all publications are solely those of the individual author(s) and contributor(s) and not of MDPI and/or the editor(s). MDPI and/or the editor(s) disclaim responsibility for any injury to people or property resulting from any ideas, methods, instructions or products referred to in the content.

