
Automatic Group Decision-Making for Algal Bloom Management Based on Information Self-Learning


1
College of Computer and Artificial Intelligence, Beijing Technology and Business University, Beijing 100048, China
2
Beijing Laboratory for Intelligent Environmental Protection, Beijing Technology and Business University, Beijing 100048, China
3
China Conservatory of Music, Beijing 100101, China
*
Author to whom correspondence should be addressed.
Water 2024, 16(6), 909; https://0-doi-org.brum.beds.ac.uk/10.3390/w16060909
Submission received: 7 February 2024
/
Revised: 18 March 2024
/
Accepted: 19 March 2024
/
Published: 21 March 2024
Abstract
:The phenomenon of algal bloom seriously affects the function of the aquatic ecosystems, damages the landscape of urban river and lakes, and threatens the safety of water use. The introduction of a multi-attribute decision-making method avoids the shortcomings of traditional algal bloom management that relies on manual experience. However, the weight-calculation part of this method still receives the artificial influence of human factors, which reduces the accuracy and scientific rigor of the decision. This paper presents a group decision-making method based on information self-learning which makes decision weights automatically clustered and assigned. A general framework of decision-making management is constructed for the algal bloom management process. In the decision-making process, an improved density-based clustering algorithm is used to automatically cluster and rank the decision data in the form of the three-parameter interval number, and ultimately obtain the optimal management method that meets the management objectives. Finally, the method was applied at the monitoring station of Sanjiadian Reservoir in Beijing, China. Based on the treatment objectives and water quality monitoring data of the station, relevant experts were invited to evaluate the management solutions, and the information self-organizing algorithm of this paper was used to automatically rank the decision-making methods, and finally obtain the most suitable management method for the station. Comparison with the water quality data and treatment inputs after the previous man-made selection of treatment options, and discussion among experts, show that the decision-making method is feasible and effective, and contributes to the sustainable treatment of algal blooms.
1. Introduction
Eutrophication is a phenomenon in which, under the influence of human activities, a large amount of nitrogen, phosphorus, and other nutrients required by living organisms enters slow-flowing water bodies such as lakes, rivers, and bays, causing rapid reproduction of algae and other plankton, a decrease in the amount of dissolved oxygen in the water body, a deterioration of the quality of the water, and the death of a large number of fish and other living organisms [1]. When eutrophication occurs in the lake, pollution is formed by planktonic algal blooms. At present, the more common eutrophication problems include Cyanobacteria, watermilfoil, floating weeds, black moss, and so on [2]. Algal blooms not only threaten human health, but also adversely affect fisheries, industry, and the ecological environment.
Algal blooms, influenced by climate, environment, and human activities, have been observed in 126 out of 153 coastal countries [3,4]. The United States has experienced a significant increase in harmful algal bloom events over the past three decades, with a wider range of impacted resources and areas affected [5]. Globally, algal blooms and water eutrophication have become serious challenges, posing health risks to humans, livestock, poultry, and aquatic organisms due to the toxins produced by certain algal species [6,7]. As a result, governments, scientists, and all sectors of society around the world are striving to find solutions to the problems of algal blooms and eutrophication of water bodies. The Great Lakes region, located on the US–Canada border, faces challenges from algal blooms due to high nitrogen and phosphorus levels in fertilizers. Governments have implemented legislation and agricultural strategies to reduce the environmental impact [8]. The Han River in Korea has experienced severe algal blooms due to pollution. Researchers have used machine-learning algorithms to forecast blooms and developed software for monitoring water quality [9]. Chiloé Island in Chile has a management crisis caused by harmful algal blooms. An ecosystem-based approach using holographic biome data is being proposed as government policy [10]. Two lake basins, La Brava and Los Padres, are highly susceptible to pollution and algal blooms, which can lead to algal bloom outbreaks. By combining a conceptual modelling tool (the DPSIR framework) with the development of a quantitative model (the Multi-Criteria Decision Making Model), the researchers propose a methodology for assessing water pollution problems that provides a practical and flexible assessment tool for the integrated assessment of eutrophication and agrochemicals in shallow lakes that depend on groundwater, as well as guidelines for decision-making environmental managers in developing countries in the context of medium-sized cities [11].
Currently, agal bloom treatment methods mainly focus on four categories: physical, chemical, biological, and ecological [12]. Physical methods include mechanical salvage, air flotation, ultrasonic, adsorption, filtration, and so on [13,14,15,16]. Chemical methods mainly refer to the use of chemical algaecides and flocculants to achieve the effect of algae removal and inhibition. At present, most algaecides in China use copper salts [17]. The use of flocculants added to the water body can coagulate the algal blooms, form precipitation, and remove them [18]. Physical and chemical control methods play a role in many specific environments, but most of them are costly, inefficient, and ecologically damaging compared to biological control methods. Biological methods include aquatic plant management, biological filter feeding, algae management, and microbiological management [19,20,21,22,23].
The advantages and conditions of each method are different, so it is a crucial task to scientifically judge the generation of algal blooms and automate the selection of treatment options to achieve timely and efficient treatment of the algal blooms [24,25]. Most water management departments rely on manual experience for algal bloom management, lacking theoretical support and standardized decision-making mechanisms [26]. Human experience in decision-making has many disadvantages, such as overlooking important information and leading to inconsistent results. Data-driven automated rational decision-making offers a more accurate basis through extensive data analysis, in contrast to relying solely on human experience [27,28,29].
The introduction of multi-attribute decision-making methods addresses the shortcomings and deficiencies of relying on manual experience. Multiple-attribute decision-making integrates and ranks criterion values under multiple criteria, providing a structured approach for complex decision-making [30]. It involves obtaining decision information, including attribute weights and values, and assembling the information to rank and select options [31,32]. Over the years, various methods have been developed, such as the Analytic Hierarchy Process (AHP) by T.L. Saaty and the TOPSIS method by C.L. Hwang [33,34]. C.L. Hwang developed the TOPSIS method in 1981, focusing on determining an ideal point for evaluation [35]. In recent years, due to the complexity and uncertainty of objective things as well as the ambiguity of human thinking, the study of uncertain multiple-attribute decision-making problems has attracted extensive attention from the academic community [36]. Multiple-attribute decision-making has also evolved to encompass fuzzy clustering, gray fuzzy comprehensive evaluation, and innovative clustering methods [37,38,39,40,41,42].
Previously, other members of our team did exploratory research on the decision-making problem of algal bloom management methods. Yuting Bai [43] introduced the concept of hierarchical decision-making into algal bloom management for the first time, based on which, the multi-objective decision-making method based on vague sets and the multi-attribute decision-making method based on the real-time data for algae bloom management have been studied respectively. Yang et al. [44] proposes quantitative calculation methods, including expert selection and opinion integration, and used the form of the two-tuple linguistic to express and calculate the decision-making opinions. Wang Xiaoyi et al. [45] proposed a group decision-making method based on heterogeneous in-formation from multiple sources, using clustering and TOPSIS methods to achieve the synthesis of different types of decision-making data.
All of these studies adopted the method of group decision-making. Group decision-making can integrate the diverse perspectives and experiences of different members to allow for a more comprehensive analysis that can help identify the best solution to a problem. It can reduce the subjective bias and blind spots of individuals, improve the objectivity and fairness of decision-making, and reduce the possibility of serious errors in decision-making. After the research, it is found that the problem of algal bloom outbreaks has been paid attention to all over the world, and researchers have conducted in-depth analyses of the causes of algal bloom outbreaks, and some of them have focused on the mechanism of algal bloom management methods, but most of the decision-making of water bloom management in most of the regions still relies on human decision-making, which is mainly based on experience and common sense, and has not gone through the rigorous analysis of data; therefore, this method makes it difficult to cope with the complexity of the problem or unknown problems, and is highly susceptible to the interference of subjective factors. The previous explorations of our team members mainly focused on introducing rational decision-making into the decision-making of algal bloom, and developed a detailed decision-making process, which laid a good foundation for the subsequent in-depth research. Although these studies have used multiple-attribute decision-making, they have not conducted in-depth research on the weighting problem in the decision-making process; most of the weights are given by human beings, and the calculation process is relatively vague, which does not take advantage of the objective data statistics and analyses.
In the research on multi-attribute decision-making methods, most scholars focus on the proposal and optimization of decision-making structural models and introduce fuzzy theory into decision-making in a way that is more flexible and closer to human cognition. Therefore, it is very reliable to introduce the multi-attribute decision-making method into the decision-making of algal bloom. Aiming at the characteristics of algal bloom decision-making with many management methods and rich management objectives, this study invites several water environment experts to make group decision-making, and their decision-making opinions are shown in a richer and more detailed expression—a three-parameter interval number. A density-clustering algorithm is introduced in multi-attribute decision-making, using its information self-learning characteristics to automatically obtain the weight information of different experts and methods, so that the decision-making information of each expert plays a different role. Finally, it obtains the comprehensive ranking results of the methods under the influence of multi-objectives, decides on the best management method, and realizes scientific automatic rational decision-making.
Aiming at the above difficulties in decision-making, we introduce the multi-expert-group processes method in decision-making, The use of group processes allows for the synthesis of various views and experiences and determine the weights more objectively. Information self-learning algorithms are integrated into multi-objective decision-making to automatically select from a certain number of alternatives that can fully meet the given goal. On the issue of fuzziness, the evaluation index is transformed into the three-parameter interval number, which can provide a more accurate and comprehensive result, and optimize the overall decision-making algorithm by combining the characteristics of the three-parameter interval number, so that the decision-making of the algal bloom management can be made more accurately and scientifically. Finally, we describe the proposed method to study the Sanjiadian Reservoir in Beijing.
The rest of this paper is organized as follows. Section 2 introduces the problem, source information, and the main method. In Section 3, the whole decision-making process is presented, along with the case study of Sanjiadian Reservoir. Furthermore, the method and results are discussed. Finally, the conclusions are presented in Section 4.
2. Materials and Methods
2.1. Decision-Making Tool Structure
For the sustainable management of algal bloom in urban lakes, a suitable and optimal management method should be selected first. The optimal choice of the method is the decision problem studied in this paper.
First of all, the water environment monitoring technology and system is used to monitor the water quality, obtain and analyze the parameters that characterize the status of algal bloom, including water quality, hydrological data, and meteorological conditions, and promptly classify the monitoring results according to the standard of algal bloom classification based on the level, if the status of algal bloom is normal, then continue to monitor it, and if the level of the status of algal bloom has reached the alert value, then immediately enter the emergency state, and analyze the decision-making through the system to obtain the best method for the emergency situation. The inputs to the decision-making model and algorithm include quantitative water quality parameters, and the subjective opinions of experts and management objectives, which can result in the decision values under the influence of the decision-making objectives, and ultimately provide the results of the advantages and disadvantages of the management programs to the decision-makers of the environmental protection department.
Based on the decision model established in this paper, the decision matrix is established. There are K decision experts to be selected and the expert set is . There are management methods that can be selected and they form the alternative set . Experts will assess the alternatives from the objectives, and the elements are named as decision objectives. The decision objective set is . For each expert, opinions can be organized in a decision matrix:
where k is the sequence number of the expert and the matrix element indicates the degree of satisfaction of the i-th method to the j-th objective. The experts give the degree of satisfaction of each method for the different objectives in the rating scale. The form of evaluation in this paper is expressed in terms of the number of a three-parameter interval number, which covers the information more comprehensively and allows the experts to give a more fine-grained description of the evaluation of the methods.
The main tasks of the paper are two. First, integrate the experts’ evaluations of each method, and in the process of integration, use the information self-learning ability of the improved the density-based spatial clustering of applications with noise (DBSCAN) to obtain the weights automatically. Secondly, the results of multi-objective, multi-expert cluster decision-making are obtained, and the integrated evaluation values of each method are ranked using the likelihood ranking method based on the three-parameter interval number to obtain the final decision-making results.
2.2. Study Area and Experimental Data
This paper analyzes the Sanjiadian Reservoir in Mentougou District, Beijing as an example, proving that this decision-making method can be clearly and accurately applied in the management of Sanjiadian waters, and that the method can be applied in other similar management.
Beijing’s Sanjiadian Reservoir, located west of Sanjiadian Village in Mentougou District, is a large-scale water conservancy hub project on the main stream of Yongding River.
Sanjiadian Reservoir stops the Yongding River, so that the rushing river water can rest for a long time and achieve precipitation purification here. At present, the water quality of Sanjiadian Reservoir reaches the standard of three types of surface water, which basically meets the water quality requirements of drinking water sources, and is ready to activate the Guanting Reservoir at any time to supply water to the urban area in case of emergency.
The vertical pole water quality automatic monitoring equipment is installed on the shore of the study waters, and the overall system contains water quality monitoring sensors and automatic water quality analyzers, which performs the acquisition of water quality data once an hour, with reference to the local water quality parameter standards, and sets an early warning threshold for the management decision-making system, which is activated if the early warning threshold is exceeded, or else the monitoring is continued. The real-time water quality monitoring data for this example is shown in Table 1, in which DO (Dissolved Oxygen) and Chl_a (Chlorophyll a) are the main characteristic indicators triggering the growth of algae, and decision-making is carried out once the real-time concentration of DO and Chl_a reaches the early warning threshold (at 15:00).
In the decision-making process, it is necessary to select experts whose professional ability matches the decision-making needs from a number of alternative experts to provide experiential knowledge. Therefore, we screened and selected the experts in the early stage, and selected 9 experts as the evaluation experts of this decision-making system from 50 experts based on their education level, professional title, and relevance to the paper. The experts need to evaluate the management method to satisfy different management objectives. The evaluation is carried out in the form of three-parameter interval number results, and the specific evaluation results are shown in Table 2.
2.3. Decision-Making Framework
In recent years, the research on decision-making theory and methods has developed in the direction of information and intelligence. In the era of information intelligence, scientific decision-making should be done in such a way as to take full account of the empirical knowledge of managers and experts, water pollution control objectives, and the real-time environment of lakes and reservoirs, which involve a wide range of sources and types of information, and the decision-making mechanism of algal bloom control needs to solve the problem of comprehensive processing and analysis of diversified information.
The initiation of the decision-making process for algal bloom management is determined by the bloom outbreak, and algal bloom in rivers and lakes generally pass through the germination stage, growth stage, outbreak stage, and extinction stage. Based on the analysis and judgement of the water quality monitoring information, the growth status of the bloom can be determined, and when the main phenological indicators of the bloom exceed the preset thresholds, the treatment decision-making method is initiated.
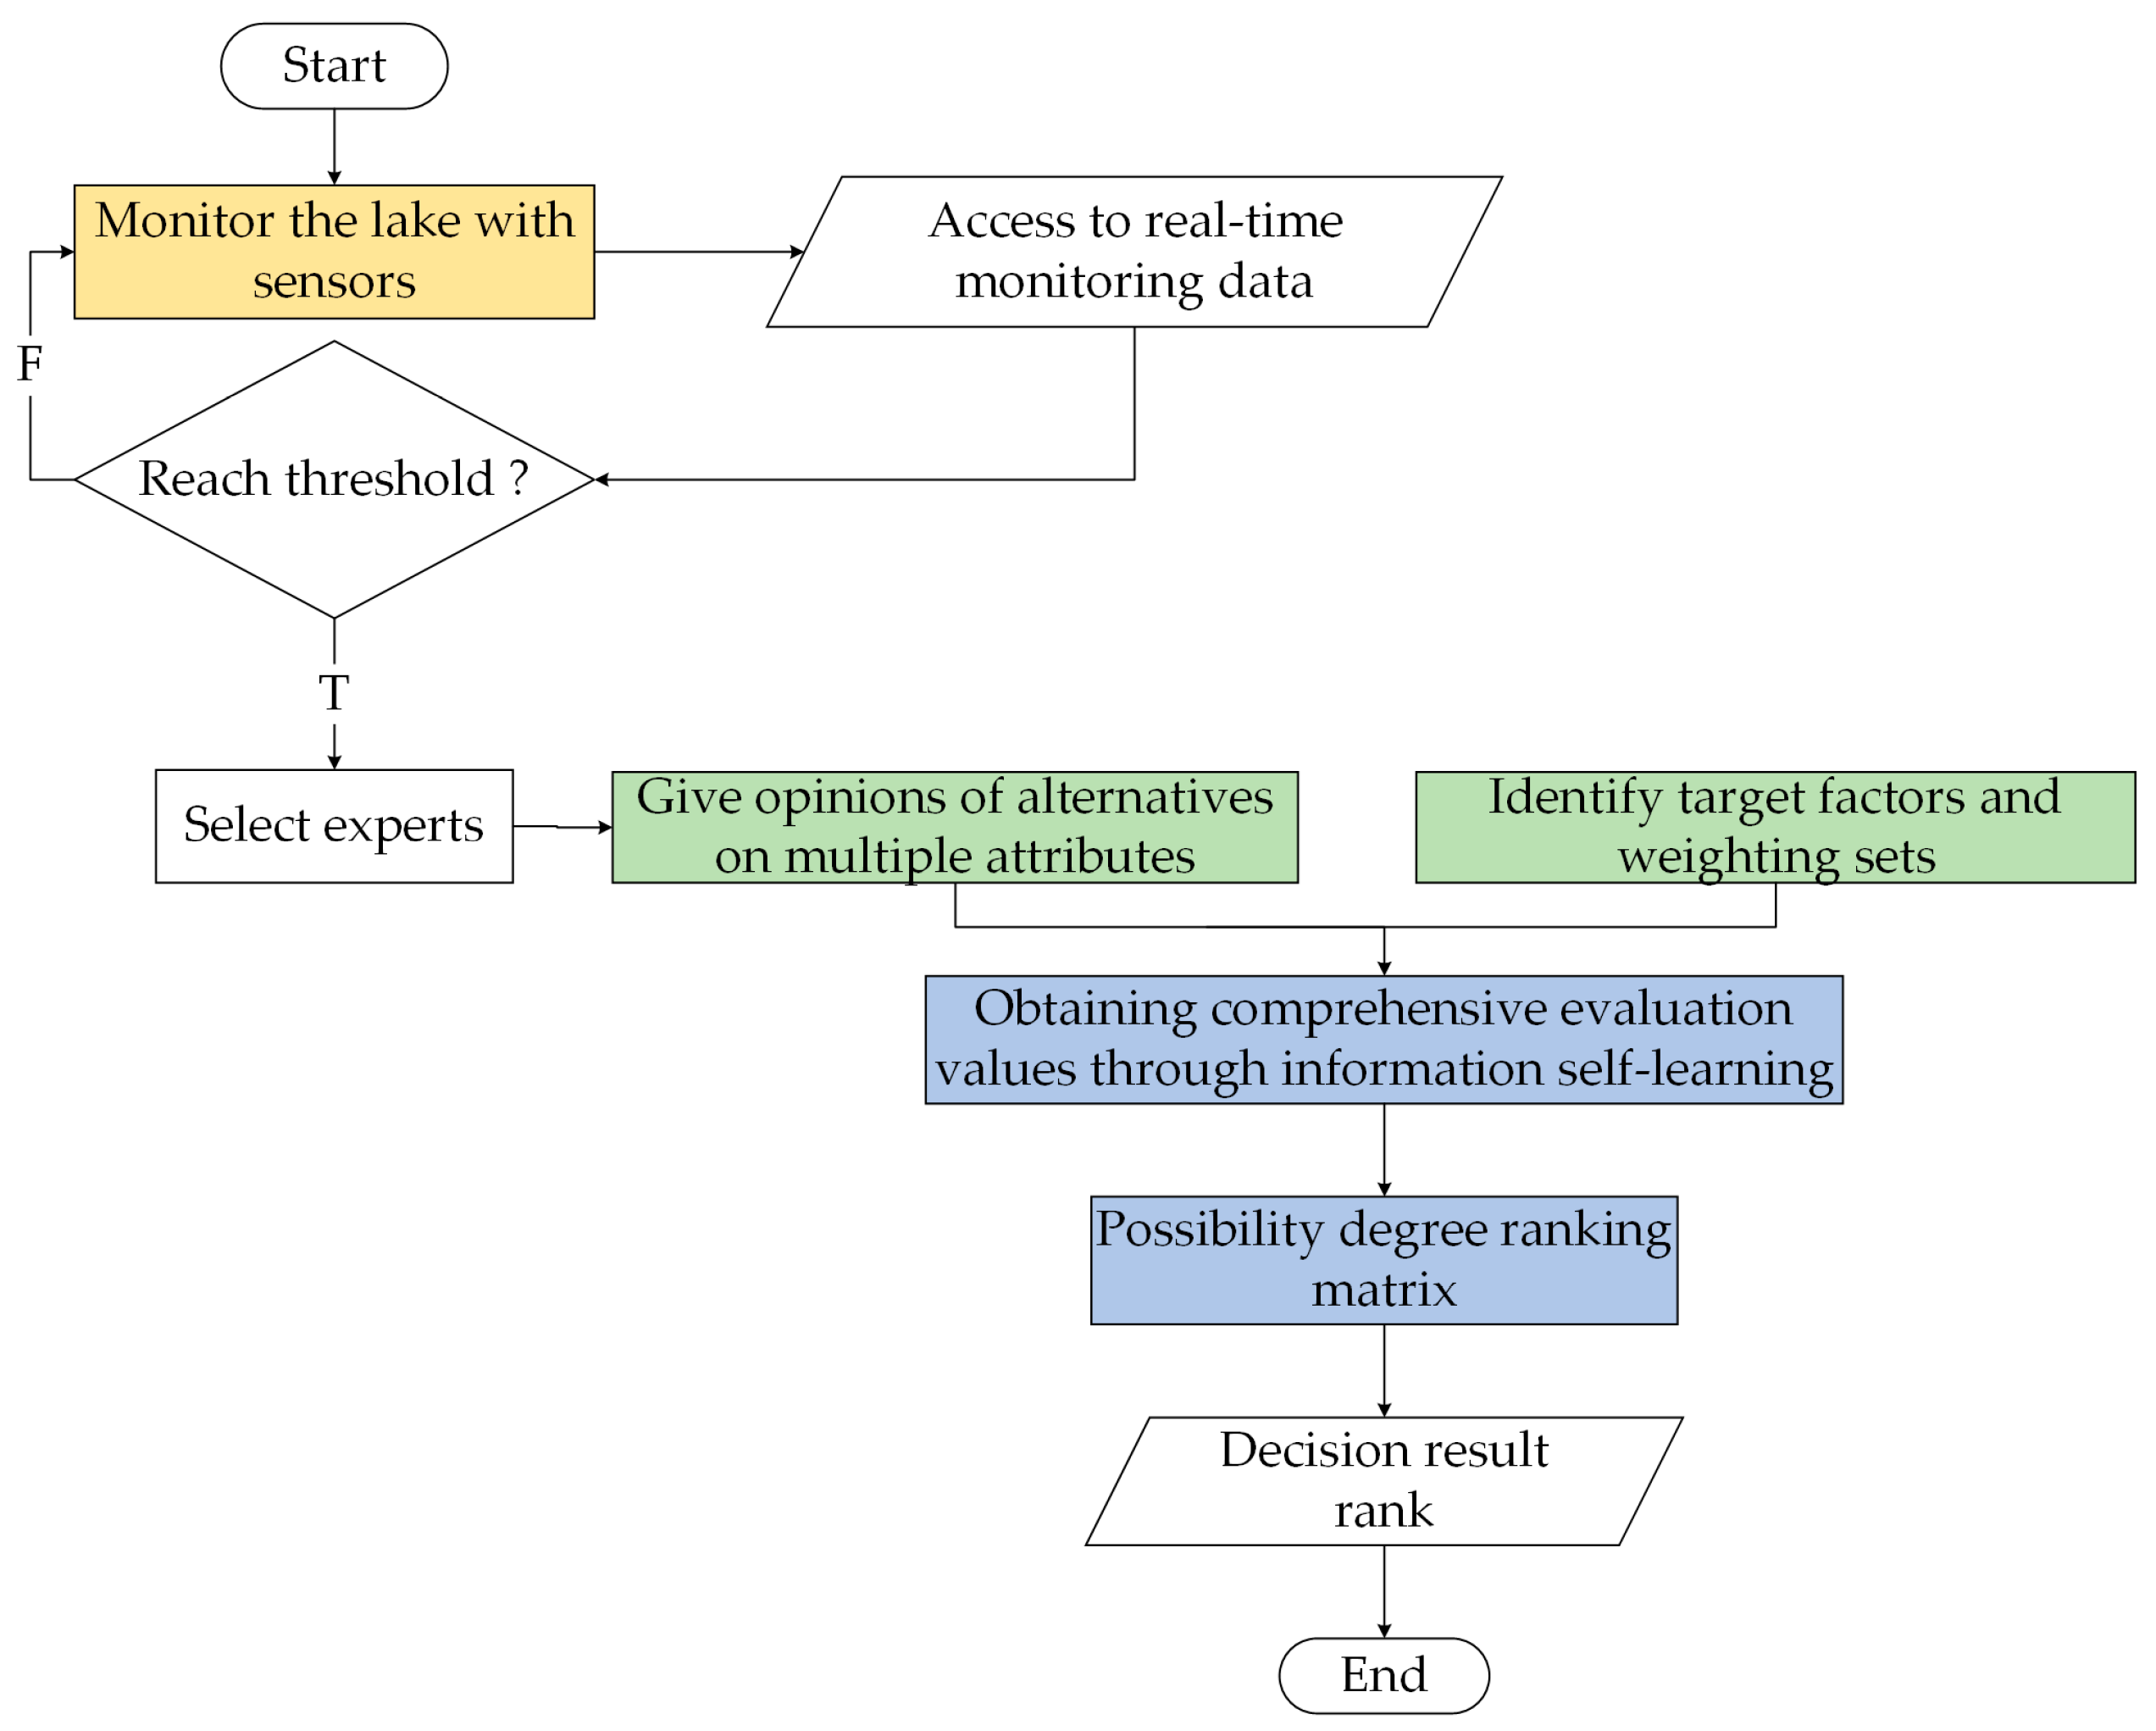
Based on the decision-making model, the evaluation information of experts in water environment management and the real-time water quality monitoring data are used as inputs for the decision-making algorithm. The results of ranking the pros and cons of the management methods that have taken into account the decision-making objectives and are in line with the current state of water quality can be obtained, and the results can be used as a reference for the main body of the decision-making process. The decision-making process for emergency management of river and lake algal bloom is shown in Figure 1.
The decision-making process has three main components. The yellow block is the real-time monitoring of water quality status. The processing of expert opinions and the calculation of target weights is shown in the green blocks, and the blue block is the calculation of target weights and the integration and ranking of decision-making opinions.
2.4. Conversion Method for Three-Parameter Interval Number
In the group decision-making process, due to the complexity and uncertainty of the decision problem and the differences in the personal preferences of the decision makers, it is often impractical to use a deterministic form of preference to portray a complex problem, and mathematical methods of uncertainty, such as interval numbers, fuzzy numbers, random variables, etc., have been widely used in the field of decision-making.
The source of information for decision-making on algal bloom management is the decision-making evaluation opinions of experts, and it is set up to invite a number of experts in the field to publish their decision-making opinions on the same lake and reservoir algal bloom management problem, the expert set is . In order to facilitate computer processing, the form of the statements in which the experts expressed their opinions was restricted, and all of them were in the form of a three-parameter interval number. A three-parameter interval number means that three parameters are used to represent an interval number, for example and , where, and are the upper and lower limits of the interval, is the most probable number in the interval, called the center of gravity of the interval.
The method covers the information more comprehensively and enables the experts to describe the evaluation of the method more finely. Compared with the traditional interval number representation, the three-parameter interval number is simple to compute and can be easily used for basic operations such as addition, subtraction, multiplication, and division, and is also adapted to fields such as fuzzy mathematics and grey theory. When there are outliers or errors in the data, this interfering information can be better eliminated, providing a more robust description of the data. Three-parameter interval numbers are widely used in practical applications and have many advantages.
For three-parameter interval numbers, there are the following algebraic algorithms as shown in Equations (2)–(5).
There are two three-parameter interval numbers, .
Addition:
Subtraction:
Multiplication:
Division:
2.5. A Multiple-Attribute Decision-Making Approach Based on Self-Information
Multiple-attribute decision-making is the process of integrating and ranking the criterion values of multiple solutions under multiple criteria. In decision-making for a particular problem, the goal that is usually set after the problem is solved, so it is hoped that the final selected method can satisfy the given goal, and the method of multiple-attribute decision-making is to select the method that can comprehensively satisfy the given goal from a certain number of alternatives through a certain method.
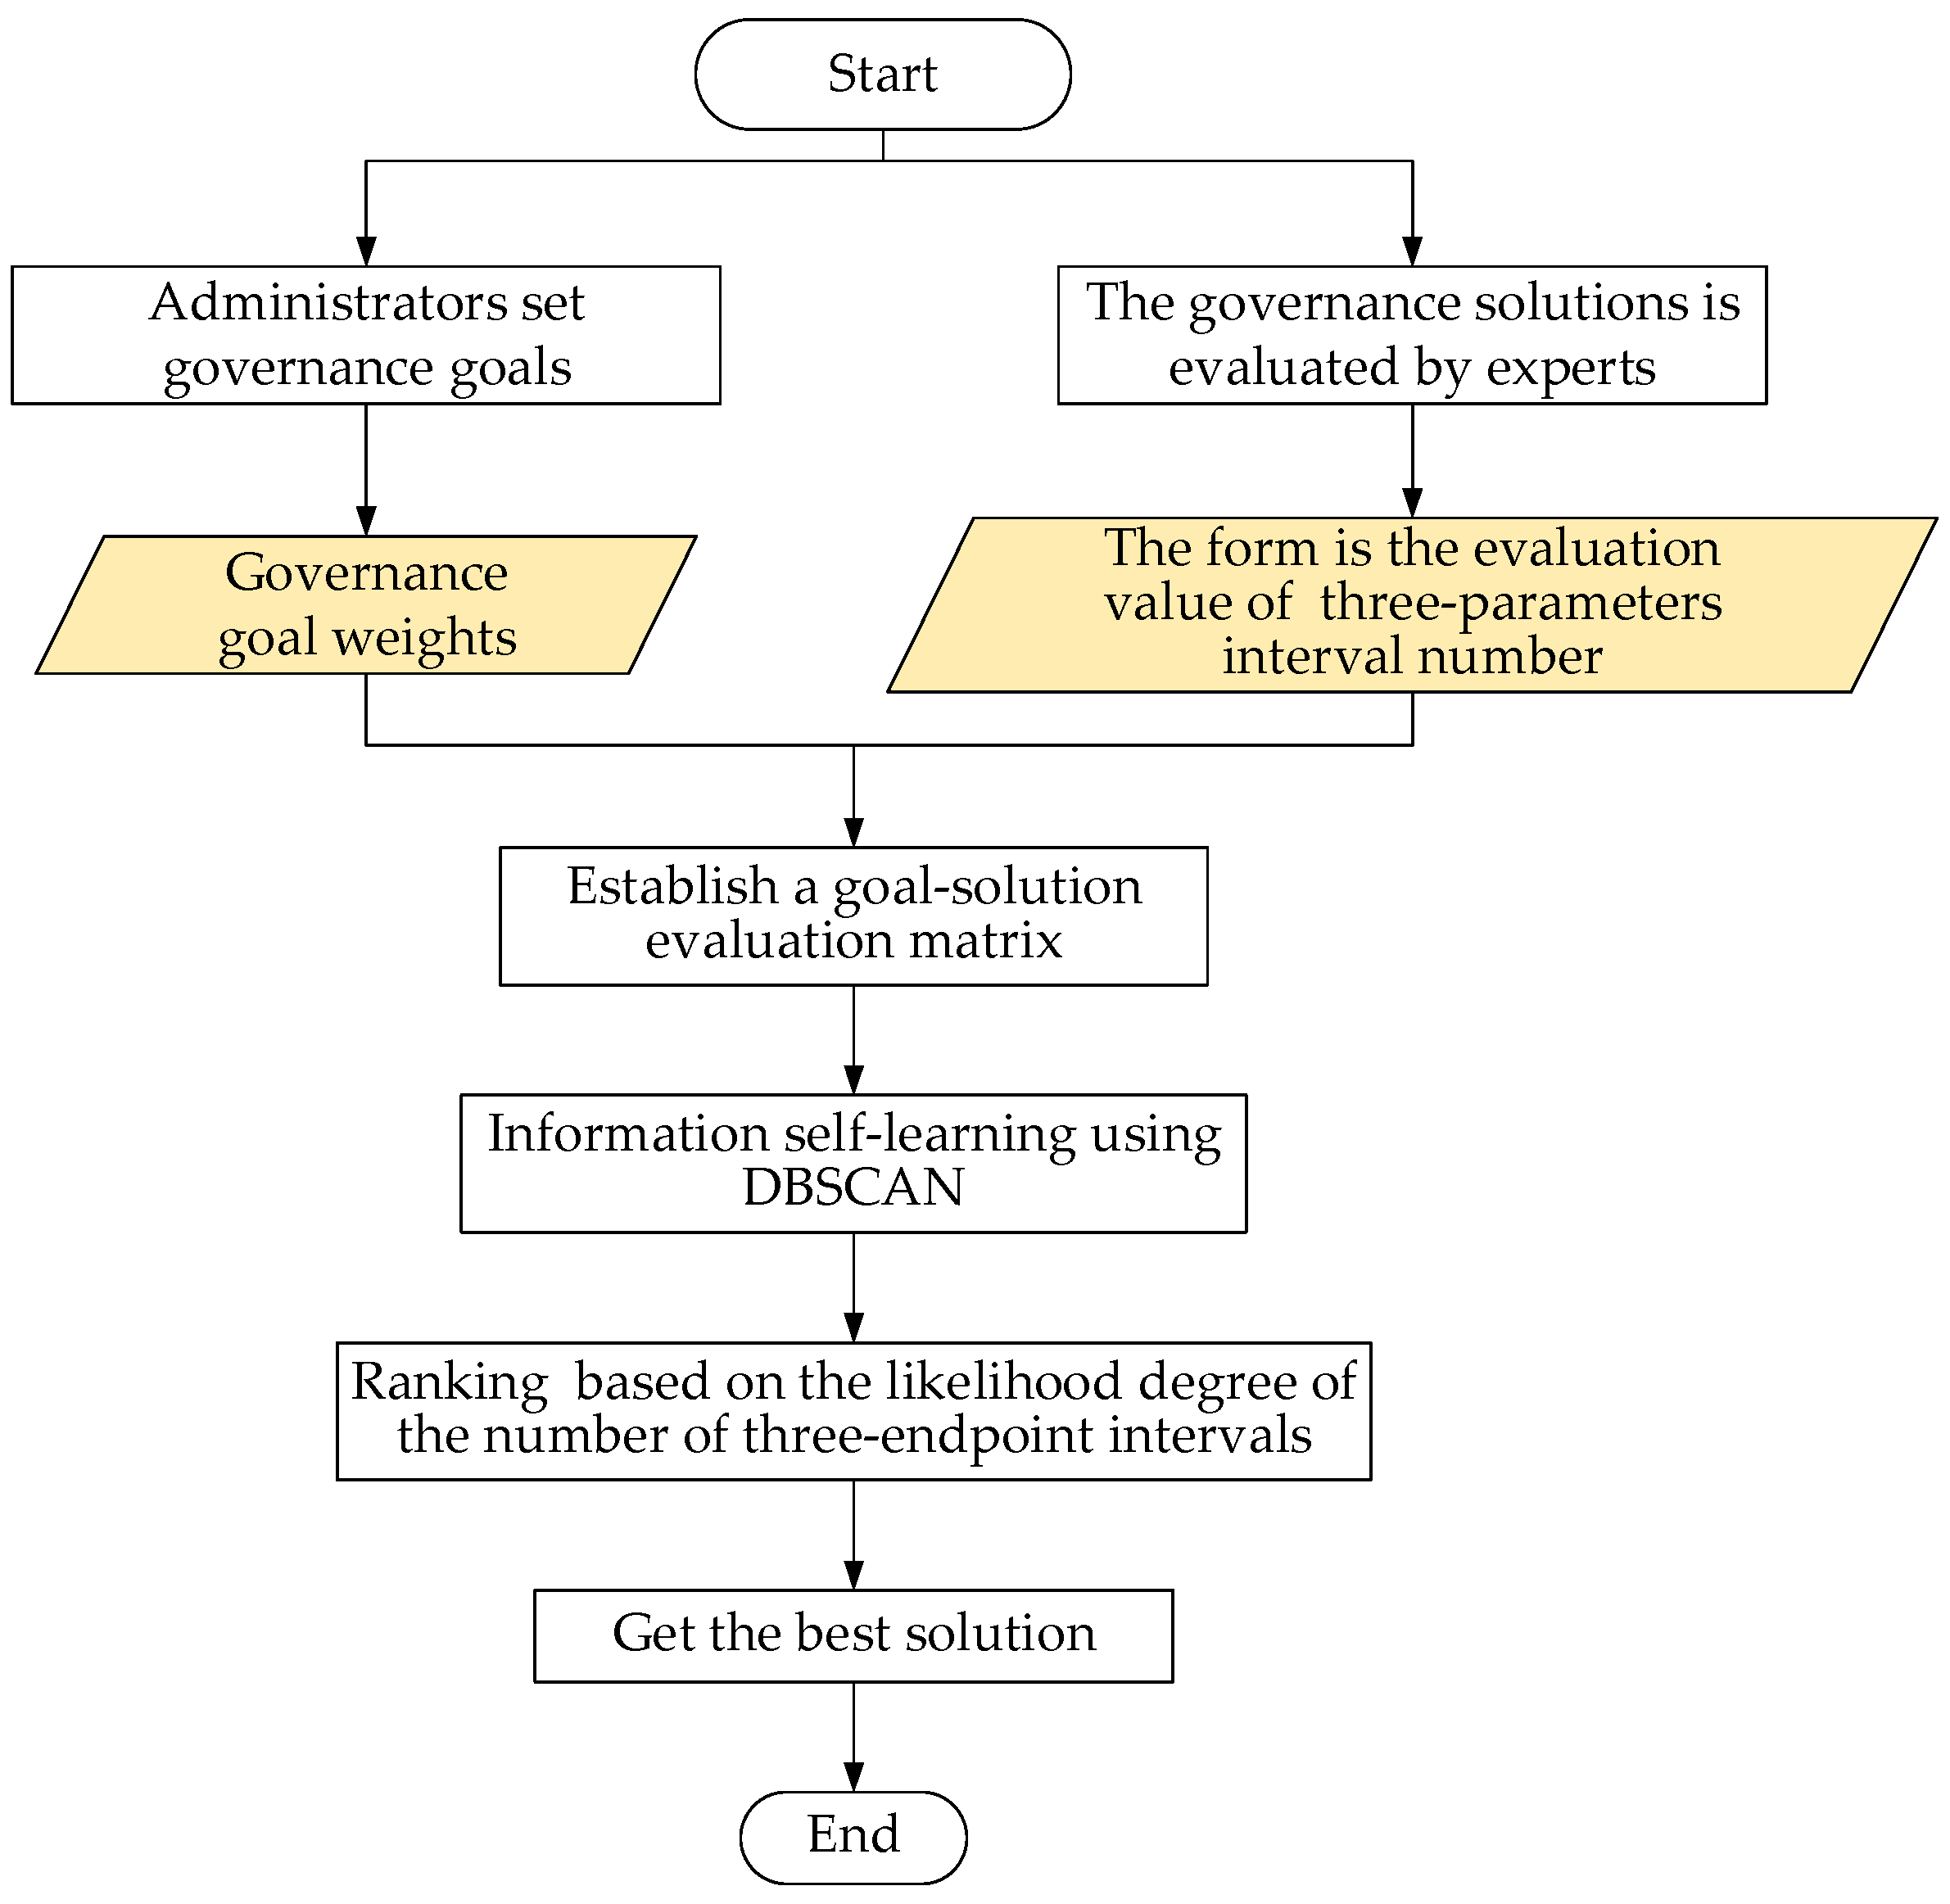
In order to overcome the limitation of individual experience knowledge and improve the reliability and comprehensiveness of decision-making opinions, multiple experts are invited to express decision-making opinions in group decision-making. In order to achieve the fusion of expert opinions, this paper proposes a group decision-making method based on DBSCAN. The algorithm framework is shown in Figure 2. First, cluster the evaluation information of k experts of method i. According to the clustering results, different weights of the class clusters are automatically obtained, and finally all the class clusters are weighted and summed up, so as to complete the fusion calculation of expert opinions.
DBSCAN (Density-Based Spatial Clustering of Applications with Noise) is a very typical density-based clustering algorithm [46]. DBSCAN is capable of automatically determining the number of clusters based on the distribution of the data, and it can discover clusters of arbitrary shape. It defines a cluster as the largest set of densely connected points. The core idea of DBSCAN is to define a density threshold by setting a radius (r) and a minimum number of points (minPts) to classify the data points into core point, border point, and outlier as shown in Figure 3.
In the figure, A is the core point, the number of points in the radius r around it is greater than or equal to the minimum number of points (minPts), then these points will be classified as a cluster. B and C represent the border points, the number of points in the radius r around it is less than the minPts, but it belongs to the boundary of a certain cluster and will be classified into this cluster. N is the noise point, the radius r around it is also less than the minPts, is regarded as outliers or noise points, and does not belong to any cluster. N is an outlier, the number of points in radius r around it is also less than the minPts, it is regarded as an outlier, and it does not belong to any cluster. DBSCAN algorithm does not need to pre-specify the number of clusters and the shape of the clusters, but it is automatically determined by the density threshold, so for some complex datasets, DBSCAN can achieve better results than the traditional clustering algorithm.
The original DBSCAN algorithm uses the formula for calculating the Euclidean distance, and the data in this study is in the form of a three-parameter interval number; in order to take advantage of this interval number, we improve the algorithm of DBSCAN. When calculating the distance, different weights are given to the upper and lower limits and the center of gravity, and it is guaranteed that the center-of-gravity point has the largest weight; this distance formula can be adjusted according to the decision-maker’s experience and risk appetite, and the improved distance algorithm is shown in Equation (6).
i.e., ,
The multi-objective decision-making steps based on self-learning of information are given according to the algorithm of the three-parameter interval number.
- First step: Determination of target factors and weighting sets
According to the algal bloom management objectives, determine the decision-making objectives of the factors affecting: the overall input scale, the degree of bloom clean-up, the degree of environmental impact, management efficiency, the degree of sustainable development. According to the different management objectives of different regions, i.e., the importance of each influencing factor in the judgement process, the weight of each objective is given by the managers and experts according to the actual situation, and then aggregated and totaled to obtain the weights of the objective factors. Expressed in the form of three-parameter interval numbers as (7)
Normalize to obtain [47], This is example (8) of an equation:
- Second step: Establishment of a judgement matrix
The judgement matrix representation is a mapping relationship between the set of options and the set of objectives, i.e., the degree to which an option satisfies a certain objective factor. It is given through experts based on practical experience and engineering reality, and is expressed in terms of the number of triple-endpoint intervals as Equation (9)
- Third step: Conducting a comprehensive judgement
A combined judgement based on and yields a vector of three endpoint interval numbers. This is example (10) of an equation:
Since the normalization of the weight set is only to the center of gravity of the interval, and the upper and lower bounds do not satisfy the normalization condition at the same time, the center of gravity and the upper and lower bounds are calculated separately. For the calculation of the center of gravity, the operator is used in order to retain as much information as possible, while for the upper and lower bounds the operator is used [48]. This is shown as Equations (11)–(13):
- Fourth step: Information self-learning using DBSCAN
The comprehensive judgement data is used as input for the density-based clustering algorithm for clustering, and the weights are automatically obtained based on the clustering results.
The training algorithm is as follows (Algorithm 1):
| Algorithm 1: Self-learning algorithm for expert evaluation information |
| Input: DB: Database, ɛ:Radius, minPts: Density threshold, dist: Distance function.
Data: label: Point labels, initially undefined. Output: (Weighted data, cluster). foreach point p in database DB do if label(p) ≠ undefined then continue Neighbors N ← RangeQuery(DB, dist, p, ɛ) If |N| < minPts then Label(p) ← Noise noise number + 1 noisy+ = p continue c ← next cluster label label(p) ← c Seed set S ← N\{p} foreach q in S do if label(q) = Noise then label(q) ← c if label(q) ≠ undefined then continue Neighbors N ← RangeQuery(DB, dist, q, ɛ) Label(q) ← c If |N| < minPts then continue S ← S ∪ N number + 1 all+ = q r = all/q end for return r, number end for R = (r × number) + (noisy × noise number) Return R |
Through the above algorithm, the number of clusters is q and the number of the point in the cluster is . In order to obtain the final evaluation value of the method, the weight of the noise cluster is set to 0.1. The weight for the other clusters is shown as Equation (14)
Calculate the centroids of various clusters . The evaluation value of the final method is the weighted sum of each centroid and shown as Equation (15)
The evaluation information of each method is automatically clustered and the weights are obtained to achieve the self-learning of the information of the method agglomeration, and, finally, the comprehensive evaluation value of R each method by k experts can be obtained.
- Fifth step: Ordering of three-parameter interval numbers
Selection of the optimal method from the results of the three-parameter interval number vector requires that the comprehensive evaluation value be ranked according to a certain method, and the method corresponding to the largest interval number obtained is the optimal method. In this paper, we refer to the ranking method based on the likelihood degree of the number of three-endpoint intervals established in the literature [49]. The method takes into account the three characteristic quantities of the three-parameter interval number: the midpoint, the interval length, and the center of gravity, which is more in line with the needs of objective reality.
i.e., Number of two three-parameter intervals: , and , , .
The possibility function is shown as Equation (16)
It can be seen by the nature that two interval numbers can be sorted according to whether the likelihood is greater than 0.5. In accordance with the above method, the final evaluation results of each method are ranked to arrive at the ranking likelihood matrix. This is shown as Equation (17). Obtaining the ranking of the methods through the matrix
3. Results and Discussion
According to the decision-making mechanism for algal bloom management, the decision-making process starts when the real-time data reaches the set threshold. In accordance with the decision-making management framework, experts are first asked to provide an evaluation of the set options based on the current lake status and to rank the management options according to the management needs of the area. In this section, the experimental results are presented using Sanjiadian Reservoir as an example.
The water of the Sanjiadian Reservoir on the Yongding River flows into Beijing from the Youzhou Gorge in Guanting Town, Huailai, Hebei Province. After investigation, most of the algae in this water area are harmful cyanobacteria such as Microcystis. In the study of Sanjiadian Reservoir, the decision-making target set {overall input scale, degree of bloom clean-up, degree of environmental impact, treatment efficiency, and degree of sustainability}, the alternative set {salvage machinery, air flotation, ultrasonic method, adsorption method, algaecide, coagulating sedimentation, electrochemical, algophagous, and Microorganisms}, and the seven experts were selected from a large number of experts, and the opinions were obtained in the form of a moderated questionnaire.
According to the decision-making steps, first we obtain the objective weight set, according to the location and function of Sanjadian Reservoir, the weight set of the five management objectives is = {(0.4,0.5,0.55), (0.3,0.44,0.56), (0.45,0.5,0.6), (0.2,0.3,0.35), (0.1,0.25,0.3)}, perform normalization calculations is = {(0.2,0.25,0.27), (0.15,0.22,0.28), (0.22,0.25,0.3), (0.2,0.15,0.17), (0.05,0.12,0.15)}.
The judgement matrix is converted from the evaluation of the options by each expert, and Table 3 shows a table of the evaluation of the options by some of the experts.
In the table K = expert, C = management target, A = management method. All 7 experts are rated in the form of the above table, and the comprehensive evaluation . In the comprehensive evaluation matrix, we divide all the evaluation values of the same method into one group, and a total of nine groups of evaluation information can be obtained, which is divided into the nine groups of data in the information self-learning algorithm, and results in the total evaluation of each method . The clustering results of the nine kinds of methods are shown in Figure 4. Among them, different colored dots represent different class clusters; yellow dots represent the center of mass of the class clusters, and red big round dots represent the weighted center of mass of all class clusters.
Using the DBSCAN algorithm, the clustering result graphs and indicators of the nine methods are obtained. The number of cluster classes and points in the cluster is obtained and the center of gravity of the cluster is calculated. In order to ensure the comprehensiveness of the evaluation, the noise points are also grouped together. In order to obtain the final evaluation value of the method, different weights were given to each cluster. The weight of the noise cluster is set to 0.1, and the weight of the rest of the clusters is proportional to the number of particles in each cluster. Finally, the center of gravity of each cluster is weighted and summed. The obtained value is the comprehensive evaluation value of the method, to achieve automatic rational decision-making. The clustering results and the weighted results of each method are shown in Table 4.
The final weighted center of mass coordinates obtained are the comprehensive evaluation values of each method, and the likelihood is calculated according to Equation (14), which establishes the likelihood matrix P for comparing the intervals with each other.
From P, the order of advantages and disadvantages of the 9 options is as follows A1, A8, A2, A9, A3, A5, A4, A6, A7. i.e., {salvage machinery > algophagous > air flotation > microorganisms > adsorption method > algaecide > ultrasonic method > coagulating sedimentation> electrochemical.
The combined results of the nine methods are ranked in a graph shown in Figure 5. The X-axis represents the management method and the Y-axis represents the evaluation value. The patch area is determined by the upper and lower limits of the coordinate of the final weighted results. The black dot is the centroid of the weighted results. For example, the weighted results of method A1 are (0.72, 0.75, 0.84). In this figure, the interval range of the salvage machinery (A1) block is (0.72, 0.84), and the black dot is 0.75.
Figure 5 compares and analyzes the results of probability ranking. The order of the centroid of the weighted results is consistent with the order of probability. When the centroid values are the same, the closer the upper and lower limits of the evaluation value, and the greater the probability; that is, the higher the evaluation of the method. The upper and lower limits of the evaluation value indicate that the smaller the difference in the evaluation value of the method, the more the scheme meets the management objectives.
The analysis of the decision-making results in Sanjiadian Reservoir reveals that the managers’ objectives revolve around two main aspects: the degree of environmental impact and the overall investment scale. These two factors play a crucial role in determining the prioritization of treatment methods. In line with the characteristics identified during the early research phase, the mechanical algal-removal method and the algal-feeding biological method emerge as the top-ranked options. The high ranking of these methods can be attributed to their favorable attributes in terms of environmental impact and investment requirements. The decision-makers aim to strike a balance between achieving effective algal bloom control and managing costs efficiently. The findings of this analysis provide valuable scientific references for the managers involved in algal bloom treatment decision-making. By considering a range of factors, including environmental impact, investment requirements, and treatment efficiency, the decision-makers can make informed choices that best meet their objectives and the specific needs of the Sanjiadian Reservoir. This enhanced decision-making process ensures a more balanced and sustainable approach to algal bloom management, ultimately benefiting both the ecosystem and the management goals.
The methodology of this paper has the following advantages over the previous related studies conducted by our team members. First, the evaluation data are expressed in a more detailed form, and the three-parameter interval numbers express richer and more comprehensive information than the traditional intervals, which is very important for decision-making relying on the evaluation data. Second, in terms of the selection and optimization of clustering methods, this method combines the density clustering algorithm with the three-parameters interval number. The density clustering algorithm does not need to pre-specify the number of clusters, and it is capable of automatically detecting and determining the number of clusters in the data, which reduces the need for subjective interventions and provides a more flexible clustering analysis. While expert evaluation data varies and is not centralized, density clustering algorithms work well with datasets that have irregular shapes, noise, and outliers. It makes all the experts’ evaluation data available for the decision-making process, which makes the decision-making results more comprehensive and scientific.
Automatic group decision-making methods can streamline the decision-making process by quickly gathering input from multiple stakeholders and generating consensus-based decisions. The algorithm in this study can help improve the accuracy of decision-making regarding algal bloom management. This can lead to more effective strategies for mitigating the impact of algal blooms on ecosystems and ensuring water safety. This method can adapt quickly to changing conditions and new information, allowing decision-makers to adjust strategies in real-time as new data on algal blooms and water quality become available. This method can lead to faster responses to algal bloom events and water safety issues.
4. Conclusions
Algal bloom management decision-making is a complex system engineering problem. Based on the analysis of the current situation of algal bloom management decision-making, this study proposes a group decision-making method based on self-learning of information, integration, and sorting of experts’ opinions with regard to the subjectivity caused by human-assigned weights in the decision-making process and the inability to use the advantages of data. The automatic rational decision-making process of multi-objective, multi-expert, and self-learning of decision-making information is realized. It also applies the three-parameter interval number to the decision-making process, and optimizes the original algorithm according to its characteristics, so that the experts’ opinions can be applied more directly and accurately in the decision-making process. The experiments in Beijing Sanjiadian Reservoir also show that this method can help managers to choose the management method more scientifically according to the actual engineering needs.
We provide a more detailed discussion of the applicability of the algal bloom management decision-making based on information self-learning elsewhere. The data sources for this decision-making method are mainly water quality monitoring stations and evaluation indicators from experts in the field. These data are finally transformed into a set of intervals for decision analysis. Therefore, if the decision-making data is a set of intervals, the method can be used for decision-making.
However, this paper has only conducted an in-depth study of decision data fusion techniques in multi-attribute decision-making, and has not considered the overall decision-making process or other forms of decision-making information; therefore, more information can be introduced into decision-making, such as water quality prediction data, in future work. Subsequently, multi-source data, including satellite remote-sensing data, water quality monitoring data, and ecosystem parameters, can be combined to provide more comprehensive and multi-dimensional information support for group decision-making, so as to enhance the comprehensiveness and reliability of decision-making. This method still requires expert intervention in data processing methods; therefore, the investment in manpower and time is still too high. Subsequent research could delve deeper into data transformation and representation in order to automate the overall decision-making process. At the same time, further research can also be carried out on decision-making information-mining work to achieve more scientific and faster intelligent decision-making.
Author Contributions
Conceptualization, Y.B.; Methodology, Y.N.; Supervision, Z.Z. and X.W.; Validation, Z.Z.; Writing—original draft, Y.N.; Writing—review & editing, X.J. All authors have read and agreed to the published version of the manuscript.
Funding
This research is supported by MOE (Ministry of Education in China) Project of Humanities and Social Sciences No. 22YJCZH006, National Natural Science Foundation of China No. 62203020.
Data Availability Statement
The data presented in this study are available on request from the corresponding author.
Conflicts of Interest
The authors declare no conflicts of interest.
References
- Lin, S.S.; Shen, S.L.; Zhou, A.; Lyu, H.-M. Assessment and management of lake eutrophication: A case study in Lake Erhai, China. Sci. Total Environ. 2020, 751, 141618. [Google Scholar] [CrossRef]
- Luo, Y.; Liu, J.-W.; Wu, J.-W.; Yuan, Z.; Zhang, J.-W.; Gao, C.; Lin, Z.-Y. Comprehensive Assessment of Eutrophication in Xiamen Bay and Its Implications for Management Strategy in Southeast China. Int. J. Environ. Res. Public Health 2022, 19, 13055. [Google Scholar] [CrossRef]
- Dai, Y.H.; Yang, S.B.; Zhao, D.; Hu, C.M.; Xu, W.; Anderson, D.M.; Li, Y.; Song, X.P.; Boyce, D.G.; Zheng, C.M.; et al. Coastal phytoplankton blooms expand and intensify in the 21st century. Nature 2023, 615, 280–284. [Google Scholar] [CrossRef]
- Anderson, D.M.; Fensin, E.; Gobler, C.J.; Hoeglund, A.E.; Hubbard, K.A.; Kulis, D.M.; Landsberg, J.H.; Lefebvre, K.A.; Provoost, P.; Richlen, M.L.; et al. Marine harmful algal blooms (HABs) in the United States: History, current status and future trends. Harmful Algae 2021, 102, 101975. [Google Scholar] [CrossRef]
- Wen, G.; Bai, Y.N.; Wang, R.; Cao, R.H.; Huang, T.L. A Review of Cause and Control Technology of Freshwater Diatom Blooms. Res. Environ. Sci. 2023, 37, 316–325. [Google Scholar] [CrossRef]
- Mirza Esmaeili, F.; Mortazavi, M.S.; Dehghan Banadaki, A.R. An overview of management and monitoring of harmful algal blooms in the northern part of the Persian Gulf and Oman Sea (Hormuzgan Province). Environ. Monit. Assess. 2020, 192, 42. [Google Scholar] [CrossRef] [PubMed]
- Chakraborty, S.; Tiwari, P.K.; Sasmal, S.K.; Misra, A.K.; Chattopadhyay, J. Effects of fertilizers used in agricultural fields on algal blooms. Eur. Phys. J. Spec. Top. 2017, 226, 2119–2133. [Google Scholar] [CrossRef]
- Binding, C.E.; Stumpf, R.P.; Shuchman, R.A.; Sayers, M.J. Advances in Remote Sensing of Great Lakes Algal Blooms. In Contaminants of the Great Lakes. In The Handbook of Environmental Chemistry; Crossman, J., Weisener, C., Eds.; Springer: Cham, Switzerland, 2020; pp. 217–232. [Google Scholar] [CrossRef]
- Ly, Q.V.; Nguyen, X.C.; Lê, N.C.; Truong, T.-D.; Hoang, T.-H.T.; Park, T.J.; Maqbool, T.; Pyo, J.C.; Cho, K.H.; Lee, K.-S.; et al. Application of Machine Learning for eutrophication analysis and algal bloom prediction in an urban river: A 10-year study of the Han River, South Korea. Sci. Total Environ. 2021, 797, 149040. [Google Scholar] [CrossRef] [PubMed]
- Gajardo, G.; Morón-López, J.; Vergara, K.; Ueki, S.; Guzmán, L.; Espinoza-González, O.; Sandoval, A.; Fuenzalida, G.; Murillo, A.A.; Riquelme, C.; et al. The holobiome of marine harmful algal blooms (HABs): A novel ecosystem-based approach for implementing predictive capabilities and managing decisions. Environ. Sci. Policy 2023, 143, 44–54. [Google Scholar] [CrossRef]
- Romanelli, A.; Lima, M.L.; Ondarza, P.M.; Esquius, K.S.; Massone, H.E. A decision support tool for water pollution and eutrophication prevention in groundwater-dependent Shallow lakes from Periurban areas based on the DPSIR framework. Environ. Manag. 2021, 68, 393–410. [Google Scholar] [CrossRef] [PubMed]
- Wang, M.; Liu, H.; Wang, J.N.; Qiu, Y.; Ma, Z.L. Research progress on the biological control of cyanobacterial blooms. J. Environ. Eng. Technol. 2022, 12, 92–99. [Google Scholar] [CrossRef]
- Zhan, M.M.; Liu, P.R.; Liu, X.Y.; Hong, Y.; Xie, X. Inactivation and Removal Technologies for Algal-Bloom Control: Advances and Challenges. Curr. Pollut. Rep. 2021, 7, 392–406. [Google Scholar] [CrossRef]
- Zhao, Z.; Zi, J.; Huang, B. A Preliminary Study on the Algicidal Experiment of Plant Flocculant in Erhai Lake. J. Environ. Sci. Guide 2018, 37, 2. [Google Scholar] [CrossRef]
- Lin, L.; Zhan, R.Y.; Li, Q.Y.; Jin, H.Y.; Sun, T.T. Occurrence Mechanism and Key Technologies for Prevention and Control of Water Bloom in Lakes and Reservoirs. Technl. Econ. Chang. 2019, 3, 91–98. [Google Scholar] [CrossRef]
- Rubio, J.; Souza, M.L.; Smith, R.W. Overview of flotation as a wastewater treatment technique. Miner. Eng. 2002, 15, 139–155. [Google Scholar] [CrossRef]
- Pang, Y.H.; Ding, Y.S.; Sun, B. Removal of Red Tide Organism by a Novel Cationic Polymeric Flocculant. Procedia Environ. Sci. 2013, 18, 602–609. [Google Scholar] [CrossRef]
- Ye, Y.H.; Yang, X.N.; Chen, J.J.; Chen, L.T. Algicidal characteristics of Pseudomonas 2-4: Based on ecological risk assessment. Acta Microbiol. Sin. 2022, 62, 3631–3645. [Google Scholar] [CrossRef]
- Li, S.J.; Chen, S.S.; Luan, T.G. Advances in mechanisms and applications of algae-bacteria/fungi symbiosis in sewage treatment. Acta Microbiol. Sin. 2022, 62, 918–929. [Google Scholar] [CrossRef]
- Chen, J.; Liu, J.R.; Han, S.P.; Su, H.J.; Xia, W.L.; Wang, H.J.; Liu, Y.; Zhang, L.; Ke, Z.X.; Zhang, X.; et al. Nontraditional biomanipulation: A powerful ecotechnology to combat cyanobacterial blooms in eutrophic freshwaters. Innov. Life 2023, 1, 100038. [Google Scholar] [CrossRef]
- Wang, D.S.; Gan, X.Y.; Wang, Z.Q.; Jiang, S.F.; Zheng, X.Y.; Zhao, M.; Zhang, Y.H.; Fan, C.Z.; Wu, S.Q.; Du, L.N. Research status on remediation of eutrophic water by submerged macrophytes: A review. Process Saf. Environ. Prot. 2023, 169, 671–684. [Google Scholar] [CrossRef]
- Fang, F.; Su, Y.F.; Zhu, W.H.; Gan, L. The mechanism of buoyancy regulation in the process of cyanobacterial bloom. J. Lake Sci. 2023, 35, 1139–1152. [Google Scholar] [CrossRef]
- He, L.H.; Yao, L.M.; Varbanov, P.S. A Bi-level optimization approach to reduce the pollution burden of lake water with ecological compensation. Ecol. Indic. 2023, 151, 110334. [Google Scholar] [CrossRef]
- Ni, Y.; Zhao, H.; Xu, Z.S.; Wang, Z.Y. Multiple attribute decision-making method based on projection model for dual hesitant fuzzy set. Fuzzy Optim. Decis. Mak. 2022, 21, 263–289. [Google Scholar] [CrossRef]
- Zhang, Y.J.; Xie, A.; Wu, Y.T. A hesitant fuzzy multiple attribute decision making method based on linear programming and TOPSIS. IFAC-PapersOnLine 2015, 48, 427–431. [Google Scholar] [CrossRef]
- Berthet, V. The Impact of Cognitive Biases on Professionals’ Decision-Making: A Review of Four Occupational Areas. Front. Psychol. 2022, 12, 802439. [Google Scholar] [CrossRef]
- Vilela, M.J.; Oluyemi, G.F. Decision-Making: Concepts, Principles, and Uncertainty. In Value of Information and Flexibility; Springer: Cham, Switzerland, 2022; pp. 1–20. [Google Scholar] [CrossRef]
- Cialdini, R.B.; Goldstein, J.G. Social Influence: Compliance and Conformity. Annu. Rev. Psychol. 2004, 55, 591–621. [Google Scholar] [CrossRef]
- Minson, J.A.; Mueller, J.S. The Cost of Collaboration: Why Joint Decision Making Exacerbates Rejection of Outside Information. Psychol. Sci. 2012, 23, 219–224. [Google Scholar] [CrossRef] [PubMed]
- Pavel, A.A.; Alessio, I.; Luis, M. Multiple-criteria decision-making sorting methods: A survey. Expert Syst. Appl. 2021, 183, 115368. [Google Scholar] [CrossRef]
- Zhu, Y.M.; Gu, J.X.; Chen, W.D.; Luo, D.D.; Zeng, S.Z. Multiple attribute decision-making based on a prospect theory-based TOPSIS method for venture capital selection with complex information. Granul. Comput. 2023, 8, 1751–1766. [Google Scholar] [CrossRef]
- Simanaviciene, R.; Liaudanskiene, R.; Ustinovichius, L. A New Synthesis Method Of Structural, Technological And Safety Decisions (SyMAD-3). J. Civ. Eng. Manag. 2012, 18, 265–276. [Google Scholar] [CrossRef]
- Churchman, C.; Ackoff, R.; Arnoff, E. Introduction to Operations Research; John Wiley and Sons Inc.: Hoboken, NJ, USA, 1957. [Google Scholar]
- Lee, S.W. Determination of Priority Weights under Multiattribute Decision-Making Situations: AHP versus Fuzzy AHP. J. Constr. Eng. Manag. 2015, 141, 05014015. [Google Scholar] [CrossRef]
- Subrata, C. TOPSIS and Modified TOPSIS: A comparative analysis. Decis. Anal. J. 2022, 2, 100021. [Google Scholar] [CrossRef]
- Song, J.; He, Z.; Jiang, L.; Liu, Z.; Leng, X. Research on Hybrid Multi-Attribute Three-Way Group Decision Making Based on Improved VIKOR Model. Mathematics 2022, 10, 2783. [Google Scholar] [CrossRef]
- Cao, L.W.; Cheng, Y.H.; Zhang, J.; Zhou, X.Z.; Lian, C.X. Application of Grey Situation Decision-Making Theory in Site Selection of a Waste Sanitary Landfill. J. China Univ. Min. Technol. 2006, 16, 393–398. [Google Scholar] [CrossRef]
- Bu, G.Z.; Zhang, Y.M. Grey Fuzzy Comprehensive Evaluation based on Grey Fuzzy Relation. Syst. Eng. Theory Pract. 2002, 22, 141–144. [Google Scholar]
- Zhu, F.X.; Chen, H.Y. An Review on the Interval Multi-attribute Decision-making Problem. Fuzzy Syst. Math. 2013, 27, 149–159. [Google Scholar]
- Zhu, J.; Liu, S.; Wang, H. Aggregation approach of two kinds of three-point interval number comparison matrix in group decision making. Acta Autom. Sin. 2007, 33, 297. [Google Scholar] [CrossRef]
- Liu, Y.; Zhou, T.; Quan, B.T.; Liu, S.F. Object Multi-attribute Differences Based Grey Dynamic Clustering Method and Its Application. Oper. Res. Manag. Sci. 2018, 27, 57–63. [Google Scholar] [CrossRef]
- Yang, H.; Xu, G.L.; Wang, F.; Zhang, Y.F. A clustering-based method for large-scale group decision making in the hesitant fuzzy set environment. Comput. Ind. Eng. 2023, 183, 109526. [Google Scholar] [CrossRef]
- Bai, Y.T.; Wang, X.Y.; Wang, S.M.; Zhu, Q.W.; Xu, J.P. The decision-making system design for the emergence governance of water bloom in reservoirs. In Environmental Science and Information Application Technology; CRC Press: Boca Raton, FL, USA, 2015; pp. 123–127. [Google Scholar] [CrossRef]
- Yang, Y.; Bai, Y.T.; Wang, X.Y.; Wang, L.; Jin, X.B.; Sun, Q. Group decision-making support for sustainable governance of algal bloom in urban lakes. Sustainability 2020, 12, 1494. [Google Scholar] [CrossRef]
- Wang, X.Y.; Bai, Y.T.; Yang, Y.; Zhao, Z.Z.; Wang, L.; Jin, X.B. Group Decision-making method for algal bloom governance based on multisource heterogeneous information. J. Saf. Environ. 2021, 22, 1575–1584. [Google Scholar] [CrossRef]
- Ghanbarpour, A.; Minaei, B. EXDBSCAN: An extension of DBSCAN to detect clusters in multi-density datasets. In Proceedings of the Iranian Conference on Intelligent Systems (ICIS 2014), Bam, Iran, 4–6 February 2014; pp. 1–5. [Google Scholar] [CrossRef]
- Ahmad, Q.S.; Khan, M.F.; Ahmad, N. A Group Decision-Making Approach in MCDM: An Application of the Multichoice Best–Worst Method. Appl. Sci. 2023, 13, 6882. [Google Scholar] [CrossRef]
- Abootalebi, S.; Hadi-Vencheh, A.; Jamshidi, A. Ranking the Alternatives With a Modified TOPSIS Method in Multiple Attribute Decision Making Problems. IEEE Trans. Eng. Manag. 2022, 69, 1800–18005. [Google Scholar] [CrossRef]
- Yan, S.L.; Liu, S.F.; Zhu, J.J.; Fang, Z.G.; Liu, J. TOPSIS decision-making method with three-parameter interval number based on entropy measure. Chin. J. Manag. Sci. 2013, 21, 145–151. [Google Scholar] [CrossRef]
Figure 1.
General process of group decision-making for algal bloom management.

Figure 2.
A multiple-attribute decision-making algorithm based on self-information.

Figure 3.
Map of core point, border point, and outlier relationships.

Figure 4.
Clustering results graphs.

Figure 5.
Ranking chart of management methods integrated results.


Table 1.
Real-time monitoring data for the Sanjaya Reservoir study area on 28 October 2021.
| Time | Temperature (°C) | pH | DO | NO3-N | NH3-N | Chl_a | TP |
|---|---|---|---|---|---|---|---|
| 6:00 | 11.1 | 9.7 | 12.10 | 2.98 | 0.08 | 28.5 | 0.13 |
| 7:00 | 11.6 | 9.8 | 11.90 | 3.0 | 0.09 | 27.4 | 0.16 |
| 8:00 | 12.1 | 9.8 | 11.90 | 2.91 | 0.09 | 29.6 | 0.19 |
| 9:00 | 12.6 | 9.6 | 11.80 | 2.96 | 0.09 | 30.3 | 0.2 |
| 10:00 | 13.0 | 9.4 | 11.70 | 2.87 | 0.10 | 32.6 | 0.22 |
| 11:00 | 13.4 | 9.2 | 11.60 | 3.03 | 0.10 | 32.5 | 0.41 |
| 12:00 | 13.8 | 9.0 | 11.60 | 2.94 | 0.10 | 35.8 | 0.23 |
| 13:00 | 14.2 | 8.7 | 11.50 | 2.96 | 0.11 | 37.5 | 0.26 |
| 14:00 | 14.5 | 8.6 | 11.30 | 2.99 | 0.11 | 38.2 | 0.59 |
| 15:00 | 14.9 | 8.5 | 11.30 | 3.05 | 0.12 | 33.6 | 0.11 |
Table 2.
Results of an expert evaluation (A = management methods, C = decision objective).
| C1 | C2 | C3 | C4 | C5 | |
|---|---|---|---|---|---|
| A1 | (0.68,0.7,0.8) | (0.82,0.85,0.9) | (0.83,0.85,0.9) | (0.87,0.9,1) | (0.1,0.15,0.25) |
| A2 | (0.4,0.45,0.6) | (0.5,0.5,0.5) | (0.5,0.5,0.5) | (0.83,0.85,0.9) | (0.68,0.7,0.85) |
| A3 | (0.82,0.85,0.9) | (0.42,0.45,0.6) | (0.46,0.5,0.5) | (0.68,0.7,0.85) | (0.43,0.45,0.58) |
| A4 | (0,0.15,0.18) | (0.5,0.5,0.5) | (0.68,0.7,0.85) | (0.43,0.45,0.6) | (0.5,0.5,0.5) |
| A5 | (0.57,0.6,0.8) | (0.88,0.9,1) | (0,0,0) | (0.82,0.85,0.9) | (0.48,0.5,0.5) |
| A6 | (0.48,0.5,0.5) | (0.82,0.85,0.9) | (0,0.15,0.12) | (0.42,0.45,0.6) | (0.44,0.45,0.6) |
| A7 | (0.1,0.15,0.3) | (0.25,0.3,0.45) | (0.4,0.45,0.6) | (0.41,0.45,0.6) | (0.55,0.6,0.8) |
| A8 | (0.85,0.9,1) | (0.6,0.75,0.8) | (0.86,0.9,1) | (0.1,0.15,0.3) | (0.45,0.5,0.5) |
| A9 | (0.82,0.85,0.9) | (0.57,0.6,0.8) | (0.82,0.85,0.9) | (0.13,0.15,0.3) | (0.82,0.85,0.9) |
Table 3.
Table of expert evaluation of the extent to which each option meets the different objectives.
Table 3.
Table of expert evaluation of the extent to which each option meets the different objectives.
| C1 | C2 | C3 | C4 | C5 | ||
|---|---|---|---|---|---|---|
| (0.68,0.7,0.8) | (0.82,0.85,0.9) | (0.83,0.85,0.9) | (0.87,0.9,1) | (0.1,0.15,0.25) | ||
| (0.4,0.45,0.6) | (0.5,0.5,0.5) | (0.5,0.5,0.5) | (0.83,0.85,0.9) | (0.68,0.7,0.85) | ||
| (0.82,0.85,0.9) | (0.42,0.45,0.6) | (0.46,0.5,0.5) | (0.68,0.7,0.85) | (0.43,0.45,0.58) | ||
| (0,0.15,0.18) | (0.5,0.5,0.5) | (0.68,0.7,0.85) | (0.43,0.45,0.6) | (0.5,0.5,0.5) | ||
| (0.57,0.6,0.8) | (0.88,0.9,1) | (0,0,0) | (0.82,0.85,0.9) | (0.48,0.5,0.5) | ||
| (0.48,0.5,0.5) | (0.82,0.85,0.9) | (0,0.15,0.12) | (0.42,0.45,0.6) | (0.44,0.45,0.6) | ||
| (0.1,0.15,0.3) | (0.25,0.3,0.45) | (0.4,0.45,0.6) | (0.41,0.45,0.6) | (0.55,0.6,0.8) | ||
| (0.85,0.9,1) | (0.6,0.75,0.8) | (0.86,0.9,1) | (0.1,0.15,0.3) | (0.45,0.5,0.5) | ||
| (0.82,0.85,0.9) | (0.57,0.6,0.8) | (0.82,0.85,0.9) | (0.13,0.15,0.3) | (0.82,0.85,0.9) | ||
| (0.95,1,1) | (0.88,0.9,1) | (0.82,0.85,0.9) | (0.87,0.9,1) | (0.1,0.15,0.3) | ||
| (0.12,0.15,0.3) | (0.57,0.6,0.75) | (0.6,0.7,0.85) | (0.83,0.85,0.9) | (0.5,0.5,0.5) | ||
| (0.6,0.75,0.8) | (1,1,1) | (0,0.05,0.15) | (0.8,0.85,0.9) | (0.45,0.5,0.55) | ||
| (0.5,0.5,0.5) | (0.5,0.5,0.5) | (0.68,0.7,0.85) | (0.43,0.45,0.6) | (0.5,0.5,0.5) | ||
| (0.57,0.6,0.8) | (0.82,0.85,0.9) | (0,0.12,0.15) | (0.42,0.45,0.6) | (0.4,0.45,0.6) | ||
| (0.48,0.5,0.5) | (0.82,0.85,0.9) | (0,0.15,0.12) | (0.42,0.45,0.6) | (0.44,0.45,0.6) | ||
| (0,0.1,0.15) | (0.25,0.3,0.45) | (0,0.13,0.15) | (0.4,0.45,0.6) | (0.6,0.7,0.8) | ||
| (0.85,0.9,1) | (0.6,0.7,0.8) | (1,1,1) | (0.7,0.8,0.85) | (0.5,0.5,0.5) | ||
| (0.81,0.85,0.9) | (0.62,0.7,0.85) | (0.87,0.9,1) | (0,0.15,0.18) | (0.84,0.9,1) | ||
| (0.56,0.6,0.8) | (0.49,0.5,0.5) | (0.42,0.45,0.6) | (0.82,0.85,0.9) | (0.28,0.3,0.45) | ||
| (0.58,0.6,0.8) | (0.8,0.9,1) | (0.82,0.85,0.9) | (0.48,0.5,0.5) | (0,0,0) | ||
| (0.4,0.5,0.5) | (0.87,0.9,1) | (0.11,0.15,0.18) | (0.42,0.45,0.6) | (1,1,1) | ||
| (0.4,0.45,0.6) | (0.43,0.45,0.6) | (0.82,0.85,0.9) | (0.1,0.15,0.3) | (0.25,0.3,0.45) | ||
| (0.57,0.6,0.8) | (0.82,0.85,0.9) | (0,0.12,0.15) | (0.42,0.45,0.6) | (0.4,0.45,0.6) | ||
| (0.48,0.5,0.5) | (0.82,0.85,0.9) | (0,0.15,0.12) | (0.42,0.45,0.6) | (0.44,0.45,0.6) | ||
| (0,0.1,0.15) | (0.25,0.3,0.45) | (0,0.13,0.15) | (0.4,0.45,0.6) | (0.6,0.7,0.8) | ||
| (0.11,0.15,0.3) | (0.57,0.6,0.8) | (0.47,0.5,0.5) | (0.82,0.85,0.9) | (0.47,0.5,0.5) | ||
| (1,1,1) | (0.87,0.9,1) | (0.8,0.85,0.9) | (0.13,0.15,0.3) | (0.5,0.5,0.5) |
Table 4.
Clustering results and center-of-mass coordinates for 9 methods.
| A1 | A2 | A3 | |
| Cluster 1 | (0.83,0.86,0.94) | (0.45,0.48,0.55) | (0.82,0.85,0.90) |
| Cluster 2 | (0.12,0.15,0.29) | (0.83,0.85,0.91) | (0.44,0.47,0.55) |
| Cluster 3 | (0.63,0.66,0.83) | (0.63,0.66,0.83) | |
| Cluster 4 | |||
| Cluster 5 | |||
| outlier | (0.19,0.25,0.48) | (3.39,3.55,4.53) | (2.52,2.65,3.30) |
| Weighted results | (0.72,0.75,0.84) | (0.62,0.65,0.75) | (0.55,0.59,0.68) |
| A4 | A5 | A6 | |
| Cluster 1 | (0.06,0.11,0.19) | (0.58,0.66,0.80) | (0.43,0.47,0.57) |
| Cluster 2 | (0.45,0.48,0.55) | (0.87,0.90,0.95) | (0.81,0.85,0.90) |
| Cluster 3 | (0.61,0.64,0.82) | (0.03,0.06,0.12) | (0.03,0.13,0.20) |
| Cluster 4 | (0.81,0.87,0.93) | (0.44,0.49,0.54) | (0.25,0.30,0.45) |
| Cluster 5 | |||
| outlier | (0.75,0.90,1.35) | ||
| Weighted results | (0.44,0.47,0.58) | (0.52,0.56,0.63) | (0.42,0.47,0.56) |
| A7 | A8 | A9 | |
| Cluster 1 | (0.04,0.13,0.22) | (0.89,0.93,1.00) | (0.75,0.78,0.89) |
| Cluster 2 | (0.24,0.30,0.45) | (0.62,0.70,0.82) | (0.03,0.12,0.21) |
| Cluster 3 | (0.39,0.45,0.60) | (0.11,0.18,0.30) | |
| Cluster 4 | (0.57,0.63,0.80) | (0.48,0.50,0.50) | |
| Cluster 5 | |||
| outlier | |||
| Weighted results | (0.29,0.36,0.49) | (0.63,0.68,0.77) | (0.60,0.65,0.76) |
Disclaimer/Publisher’s Note: The statements, opinions and data contained in all publications are solely those of the individual author(s) and contributor(s) and not of MDPI and/or the editor(s). MDPI and/or the editor(s) disclaim responsibility for any injury to people or property resulting from any ideas, methods, instructions or products referred to in the content. |
© 2024 by the authors. Licensee MDPI, Basel, Switzerland. This article is an open access article distributed under the terms and conditions of the Creative Commons Attribution (CC BY) license (https://creativecommons.org/licenses/by/4.0/).
Share and Cite
MDPI and ACS Style
Bai, Y.; Niu, Y.; Zhao, Z.; Jin, X.; Wang, X. Automatic Group Decision-Making for Algal Bloom Management Based on Information Self-Learning. Water 2024, 16, 909. https://0-doi-org.brum.beds.ac.uk/10.3390/w16060909
AMA Style
Bai Y, Niu Y, Zhao Z, Jin X, Wang X. Automatic Group Decision-Making for Algal Bloom Management Based on Information Self-Learning. Water. 2024; 16(6):909. https://0-doi-org.brum.beds.ac.uk/10.3390/w16060909
Chicago/Turabian StyleBai, Yuting, Yijie Niu, Zhiyao Zhao, Xuebo Jin, and Xiaoyi Wang. 2024. "Automatic Group Decision-Making for Algal Bloom Management Based on Information Self-Learning" Water 16, no. 6: 909. https://0-doi-org.brum.beds.ac.uk/10.3390/w16060909
Note that from the first issue of 2016, this journal uses article numbers instead of page numbers. See further details here.