
Cost Studies of Reverse Osmosis Desalination Plants in the Range of 23,000–33,000 m3/day

1
School of Industrial and Civil Engineering, Department of Electronic and Automatic Engineering, University of Las Palmas de Gran Canaria, 35017 Las Palmas de Gran Canaria, Spain
2
School of Industrial and Civil Engineering, Electrical Engineering Department, University of Las Palmas de Gran Canaria, 35017 Las Palmas de Gran Canaria, Spain
3
Faculty of Science, University of Cádiz, 11519 Cádiz, Spain
4
School of Industrial and Civil Engineering, Department of Civil Engineering, University of Las Palmas de Gran Canaria, 35017 Las Palmas de Gran Canaria, Spain
*
Author to whom correspondence should be addressed.
Water 2024, 16(6), 910; https://0-doi-org.brum.beds.ac.uk/10.3390/w16060910
Submission received: 18 February 2024
/
Revised: 12 March 2024
/
Accepted: 19 March 2024
/
Published: 21 March 2024
(This article belongs to the Special Issue Advanced Desalination Technologies for Water Treatment)
Abstract
:The analysis of energy consumption in reverse osmosis desalination plants is the most important and relevant factor to study, because this parameter indicates the level of efficiency and competitiveness of the plant. The direct consequence of the high specific energy consumption (SEC) of a desalination plant in the production of water is one of the main obstacles to the exponential expansion of this technology worldwide. The methodological procedure used to carry out the work is based on the analysis of energy consumption, maintenance costs, staff, membranes, and reagents of three desalination plants with a production of more than 23,000 m3/day located in the Canary Islands (Spain); all data are obtained from real analyses collected “in situ” from 2015 to 2018. One of the main objectives of the current research on desalination plants is to reduce the SEC of seawater desalination plants (SWRO), incorporating energy recovery systems (ERS) and high efficiency pumps (HEP), and to implement different operational configurations with the aim of minimizing the energy requirements necessary to obtain a good product quality at minimum production cost.
1. Introduction
Water desalination is the technological process that makes it possible to remove salts from water to convert it into water without excess salts, through a physical and/or chemical process, using seawater or brackish water from the subsoil. From this process, it can be converted into a water resource perfectly suitable for human consumption [1], and can be used to irrigate agricultural crop fields [2,3] and in the food industry [4], etc.
In ancient Greece, it is believed that Thales of Miletus, in around 600 B.C., had already experimented with the evaporation of saltwater to obtain freshwater. As a pre-Socratic philosopher, he considered water to be the fundamental principle of all things in existence, asserting that “water is the origin that gave rise to the universe”. Thus, the first Western theory about the physical world was born, proposing the ultimate nature of the world based on a primary and final element: water [5]. Three centuries later, Aristotle mentioned in his works the physical principles by which water loses its salt through evaporation. This long-cherished human dream of utilizing seawater as a freshwater resource, nurtured since classical Greece, embraced the physical principles necessary for separating water from salts. In the Renaissance, Leonardo da Vinci proposed that coastal populations could self-supply potable water by desalinating seawater using stills installed in the wood-fired kitchens of their homes [6].
After various inventions in subsequent centuries, in 1851, a steamship-based evaporation–condensation system was developed, harnessing the heat from boilers to generate potable water for the crew during long voyages [7,8]. These developments laid the groundwork for early desalination technologies. In the 1950s, the first prototypes of reverse osmosis desalination emerged [9], marking it as an emerging technology. In 1965, what is now known as the reverse osmosis desalination of saltwater was developed [10], a technology that remains relevant today [11]. This technology, currently in use [11], is the most widely employed in seawater desalination plants or brackish water desalination from low salinity wells [12,13].
With the progressive decline in natural freshwater sources, a considerable amount of energy resources is required to produce water for human consumption, agriculture, livestock, and industrial use from unconventional alternative water sources. Seawater is one of the most easily accessible water sources to achieve the goal of freshwater production [14]. With current desalination methods, seawater can, under various circumstances, become a solution to freshwater scarcity, emerging as one of the most effective options to alleviate water stress [15] in regions with low precipitation rates [16], prolonged drought effects [17], aquifers contaminated with heavy metals [18] due to agricultural or livestock activities [19,20], uncontrolled mining activities [21], or unregulated discharge of sewage or industrial wastewater [22,23]. For all these reasons, this technology is indispensable in many areas of the planet. Its study and optimization are fundamental to achieving global sustainable development.
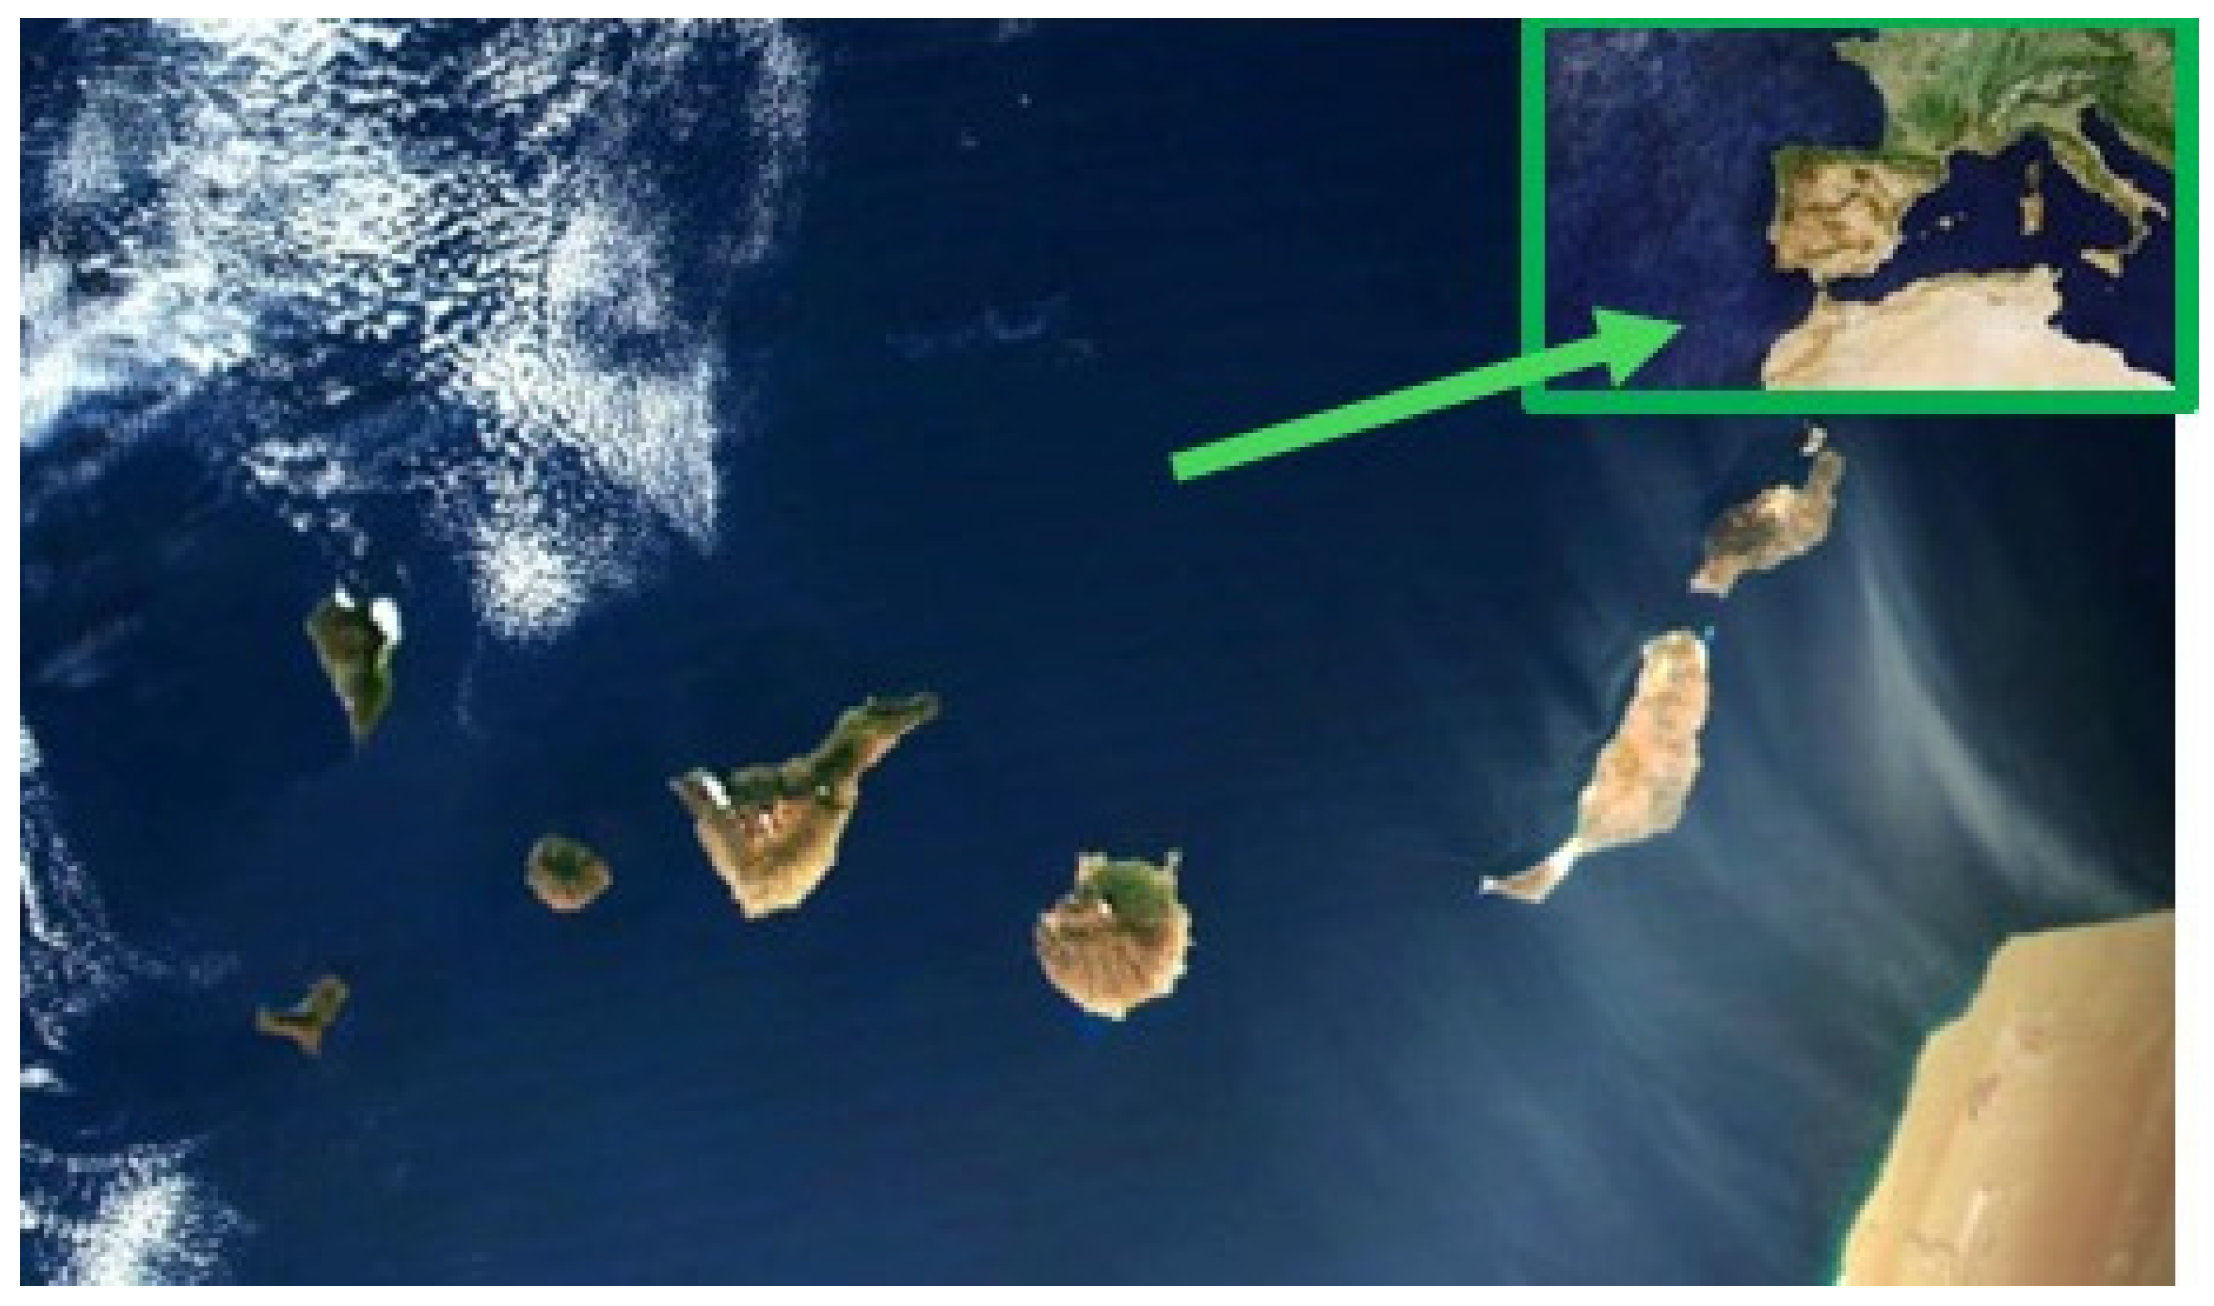
Countries in the Middle East and North Africa (MENA) region predominantly utilize seawater reverse osmosis (SWRO) technology for freshwater production [24]. This is exemplified in places like the Canary Islands, as shown in Figure 1, where the demand for desalination has exponentially increased due to the scarcity of rainfall and the development of the hotel industry [25].
However, seawater desalination is an energy-intensive process, with the theoretical minimum specific energy for seawater desalination, assuming a standard seawater concentration of 35,000 mg/L (total dissolved solids (TDS)), being 1.07 kWh/m3 when a 50% energy recovery system (ERS) is included in the production process [24,25,26,27]. It has been studied and simulated that the specific energy consumption (SEC) of the reverse osmosis process in a seawater plant is between 2.5 to 4.0 kWh/m3 [24], higher than its theoretical minimum. In real SWRO plants the SEC value is higher, reaching values of 3.5–4.5 kWh/m3; within these values, the pre-treatment and post-treatment processes of the production process have been included [28].
Currently, desalination faces several concurrent challenges. Foremost among these is the priority goal of reducing operational costs [26,27], achieved through decreased energy demand. Equally significant is the imperative to minimize emissions of polluting gases during the production process [28,29].
The desalination of seawater is a high-energy-consuming process. In simulations to calculate the theoretical minimum specific energy (SECth) for seawater desalination, assuming a standard seawater concentration of 35,000 mg/L (total dissolved solids (TDS)), SECth is estimated to be 1.07 kWh/m3. This theoretical calculation includes the incorporation of a 50% energy recovery system (ERS) [30,31,32,33].
It is crucial to find strategies that enable a reduction in current energy consumption. Therefore, it is necessary to comprehend and analyze energy usage in all stages of operation of current seawater reverse osmosis (SWRO) plants, identify equipment that consumes the most energy in the production process, and optimize factors contributing to SEC minimization [34]. This optimization includes introducing new materials in permeating membranes, selecting efficient pumping and energy recovery systems, and implementing effective preventive and predictive maintenance scheduling to reduce technical downtime. With these technological contributions to SWRO plants, SEC has exponentially decreased since its industrial-scale introduction.
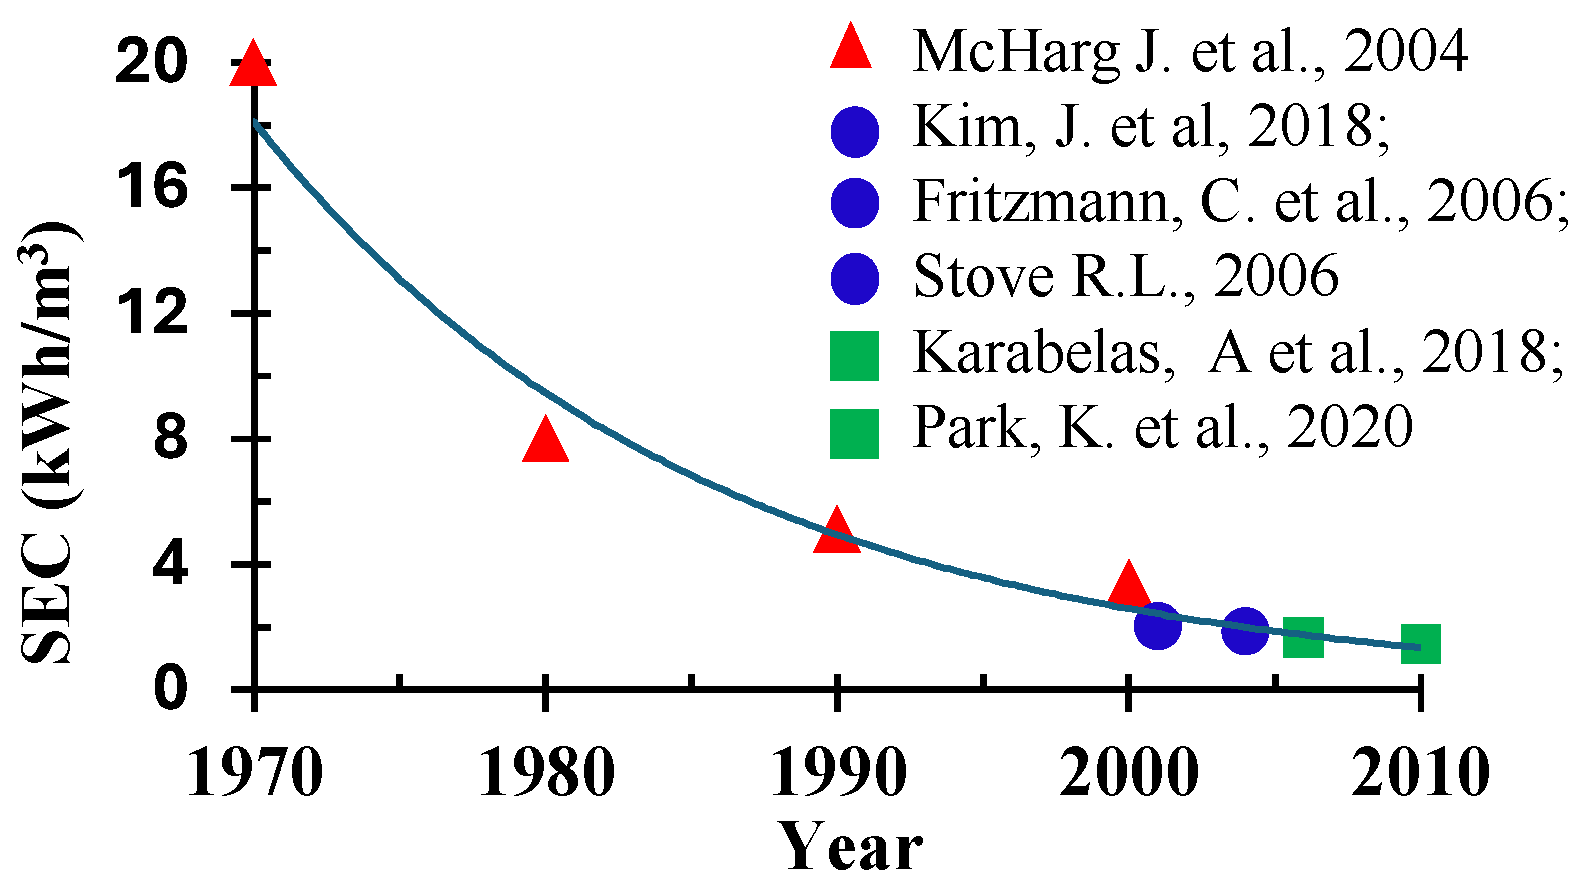
In the 1970s, the initial SWRO plants had energy consumption rates as high as 20 kWh/m3. With the implementation of improvements in the production process, energy consumption decreased to 8 kWh/m3 in the 1980s, and a further substantial improvement to 5 kWh/m3 was achieved in the following decade [35]. By the early 21st century, energy consumption had been further reduced to 3.8 kWh/m3. SWRO plants equipped with ERS and HEP typically exhibit specific energy consumption (SEC) values ranging from 3.5 to 6.0 kWh/m3, accounting for both pre-treatment and post-treatment processes [14,36,37,38]. Presently, it is technically feasible to achieve energy consumption values below 2.0 kWh/m3 [39,40], as illustrated in Figure 2.
In addition to technical advancements in materials and machinery, it is imperative to assess the potential application of promising future strategies aimed at minimizing fossil fuel energy consumption to mitigate the environmental impact associated with this energy source. This can be achieved through the utilization of renewable energies [41,42,43,44,45] or alternative and/or plant-based fuel sources such as green hydrogen [46,47], biomethane, ammonia (NH3) [48], bioethanol, and biodiesel [49], among others.
A substantial increase in global water demand is expected in the coming decades, directly linked to population growth and the rise in industrial, livestock, and agricultural production. According to the 2015 report by UNESCO’s World Water Assessment Programme (WWAP), the world population is projected to face a 40% water deficit by 2030 [50]. Research into novel systems aimed at reducing energy consumption, coupled with advancements in desalination technologies, represents key solutions to addressing this challenge and fostering a more sustainable future [51,52,53,54,55].
This paper aims to study and compare the production cost of three different seawater reverse osmosis desalination plants with a production of 22,000 to 33,000 m3/d located in the Canary Islands.
For each of the three cases, the results show how production costs can be reduced, the essential role of the incorporation of energy recovery systems, and the use of high performance pumps, as well as an analysis of all the economic costs associated with the plants studied.
2. Materials and Methods
2.1. Plant Descriptions
As the information is of a confidential nature, the locations of the three SWRO desalination plants cannot be disclosed. The plants will be referred to as A, B, and C. Table 1 shows the technical characteristics of the desalination plants analyzed in a study period spanning from 2015 to 2018.
The summarized data from Table 1 indicate that the lifespan of the plants ranges from 22 to 25 years. All plants employ beach wells as their primary water intake source. The configuration and type of intake have a notable influence on both the quantity and composition of contaminants present in the source water, as well as on the complexity of the pre-treatment system necessary for controlling fouling of the reverse osmosis membrane.
Membrane fouling can increase SEC, requiring higher feed pressure to maintain a given production rate within the same timeframe. The plants are equipped with sand and cartridge filters installed in the pre-treatment stage, each utilizing different anti-scaling chemicals (see Table 1).
The average conversion rate ranged from 40% to 45%, achieved in one or two stages, with an average operating temperature of 22 °C to 25 °C.
2.2. Data Collection
The data were collected daily “in situ” in each of the plants studied. Table 2 shows the average annual consumption (kWh) and the volume of water produced (m3) of each plant, and there is an increase in production in plant A of 51.9%, compared to 2015, while plants “B” and “C” maintain a stable production in all years.
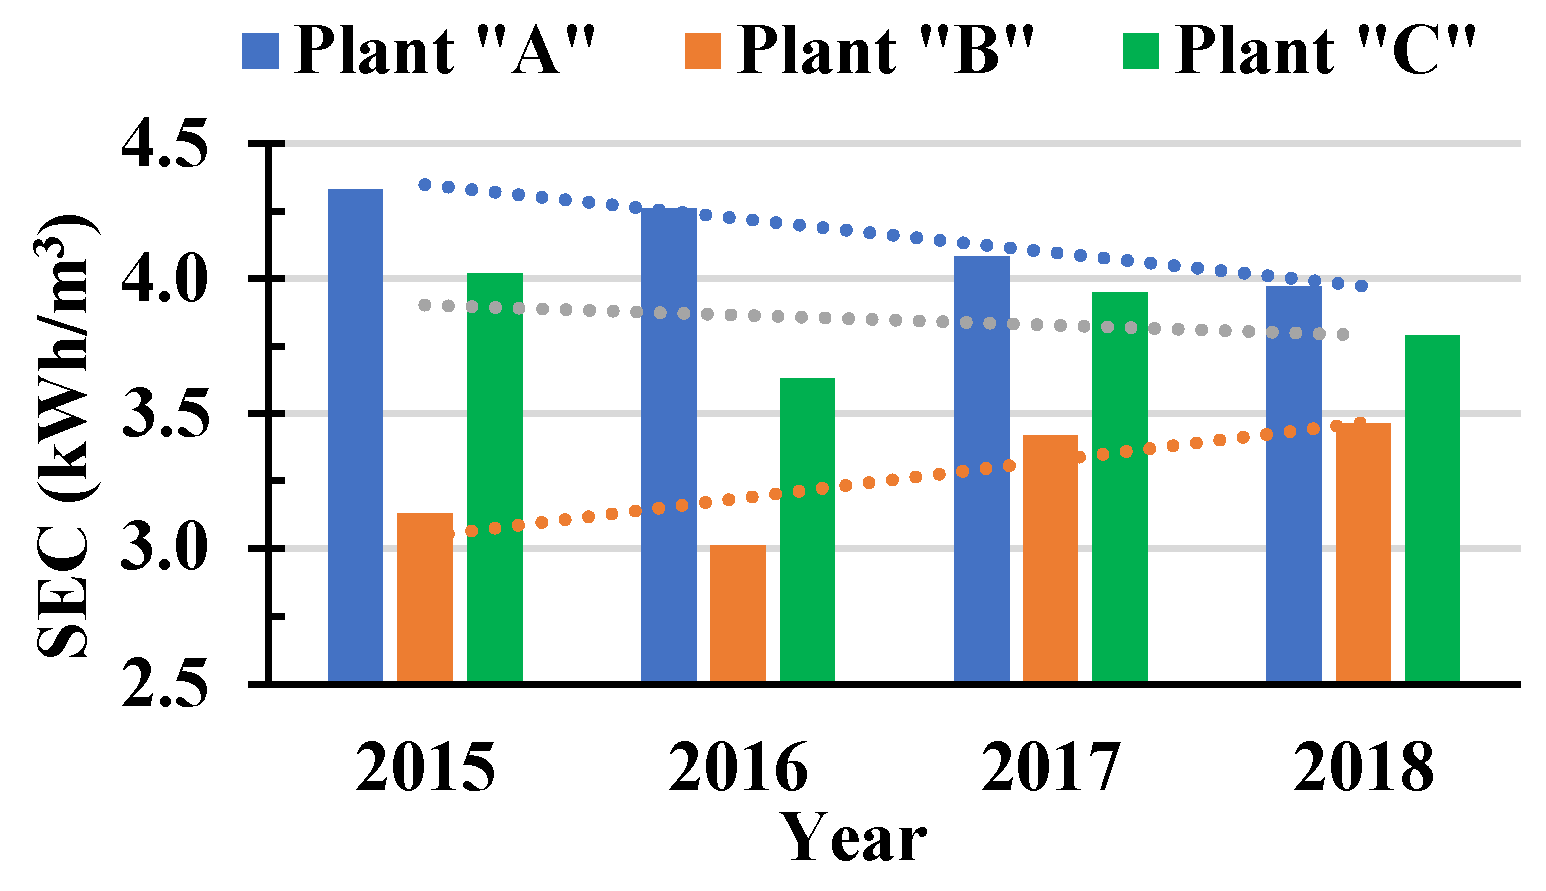
The average annual SEC was determined taking into account both the high-pressure pump and the booster pump. The results obtained are shown in Table 3 and are graphically represented in Figure 3.
Desalination plant “B” has seen a 15% increase in energy consumption over the 4 years studied, with an associated production increase of 8.7%. This disproportionate consumption increase relative to production may be attributed to optimization issues, membrane fouling, or operational parameter misalignments in the plant. In contrast, plants “A” and “C” have reduced their energy consumption by 8.3% and 5.7%, associated with a small increase in production in both plants. This is due to the fact that the membranes are in optimal condition, as well as good maintenance of all pumping equipment.
3. Results
All studied costs have been calculated based on the average annual consumption of each, factored against the production of desalinated water in cubic meters (m3). Using this foundation, the costs of energy, staff, maintenance, and reagents have all been established in monetary values (EUR/m3), with data provided by the operating companies of each plant. Table 4 presents a summary of all average values obtained during the period from 2015 to 2018.
3.1. Theorical SEC
To enable analysis and comparison among the desalination plants studied, the theoretical SEC was determined through simulations using the reverse osmosis system analysis (ROSA) software V.9.1, configDB n399339_282, which refers to the study and analysis of data from reverse osmosis desalination plants, and is a totally free and open-source software developed by the Dow Chemical Company. This program has been used to carry out the necessary simulations based on the data obtained “in situ” from the different plants studied.
In this software, the most important plant data are entered, such as feed water, type of well, individual specification of the percentages of chemical elements, balance between anions and cations, number of taps, water temperature range, stages, membranes per tube, number of tubes and total membranes, flow factor, recovery percentage, flow rate in m3/h, initially produced by the plant, and working pressures at certain points and type of membrane.
Based on the parameters entered in the software, the concentration in mg/L of the desalination process is obtained, as well as the theoretical SEC required in kWh/m3. From this value and with the exchange of the conversations held with the plant operators, a first comparison can be made, so that a starting point can be established on the operation of the plant, and the way it operates.
The results, depicted in Table 5, reflect SEC calculations for each plant based on the average inorganic composition, temperature, and pH of the feed water, as detailed in Table 1. This analysis considered an 80% pump efficiency and a flow factor of 0.85. In a first basic analysis, it can be seen that plant “B” is the one that best adapts to the optimum operating conditions, analyzed from the point of view of energy consumption per m3 of water produced.
In an initial basic analysis, it is observed that plant “B” exhibits the best performance and adapts to optimal operating conditions, as assessed from the perspective of energy consumption per m3 of water produced.
In a second analysis, the introduction of an energy recovery system is evaluated, according to a free and free application in Microsoft Excel software (Office 365, Excel 2022), carried out by the company PX Energy Recovery Device System Analysis, which designs, manufactures, and sells one of the best energy recovery systems for desalination plants. It analyzes how energy consumption varies in kwh/m3 of water produced, so that they can be installed and analyze the percentage of energy invested in the production process.
Further, the theoretical energy consumption for energy recovery using the ERI PX-ERS system has been studied, and the appropriate theoretical energy consumption for each of the desalination plants equipped with ERS has been determined. The summarized results are shown in Table 6.
The error margins associated with each plant indicate the percentage comparison between the data obtained on-site at each plant and the average theoretical SEC values calculated with the ERI PX-ERS software (SWRO Process Simulator, Version 1.2). The results are expressed as percentages and are shown in Table 6. The results obtained are presented in Table 7 according to Equation (1).
3.2. Statistical Analysis
Based on the previous results, a statistical analysis has been conducted to incorporate additional data and criteria, as shown in Table 8 and Table 9. This statistical study aims to establish a mathematical model that fits the operational conditions of the analyzed plants, with the objective of obtaining the total cost of such reverse osmosis desalination plants [56]. Furthermore, the distribution type representing each cost associated with the obtained mathematical model has been analyzed.
Table 8 presents the between-subject effect tests, showcasing fundamental results for model computation. In Table 9, the parameters derived from this model are provided, accompanied by a 95% confidence interval.
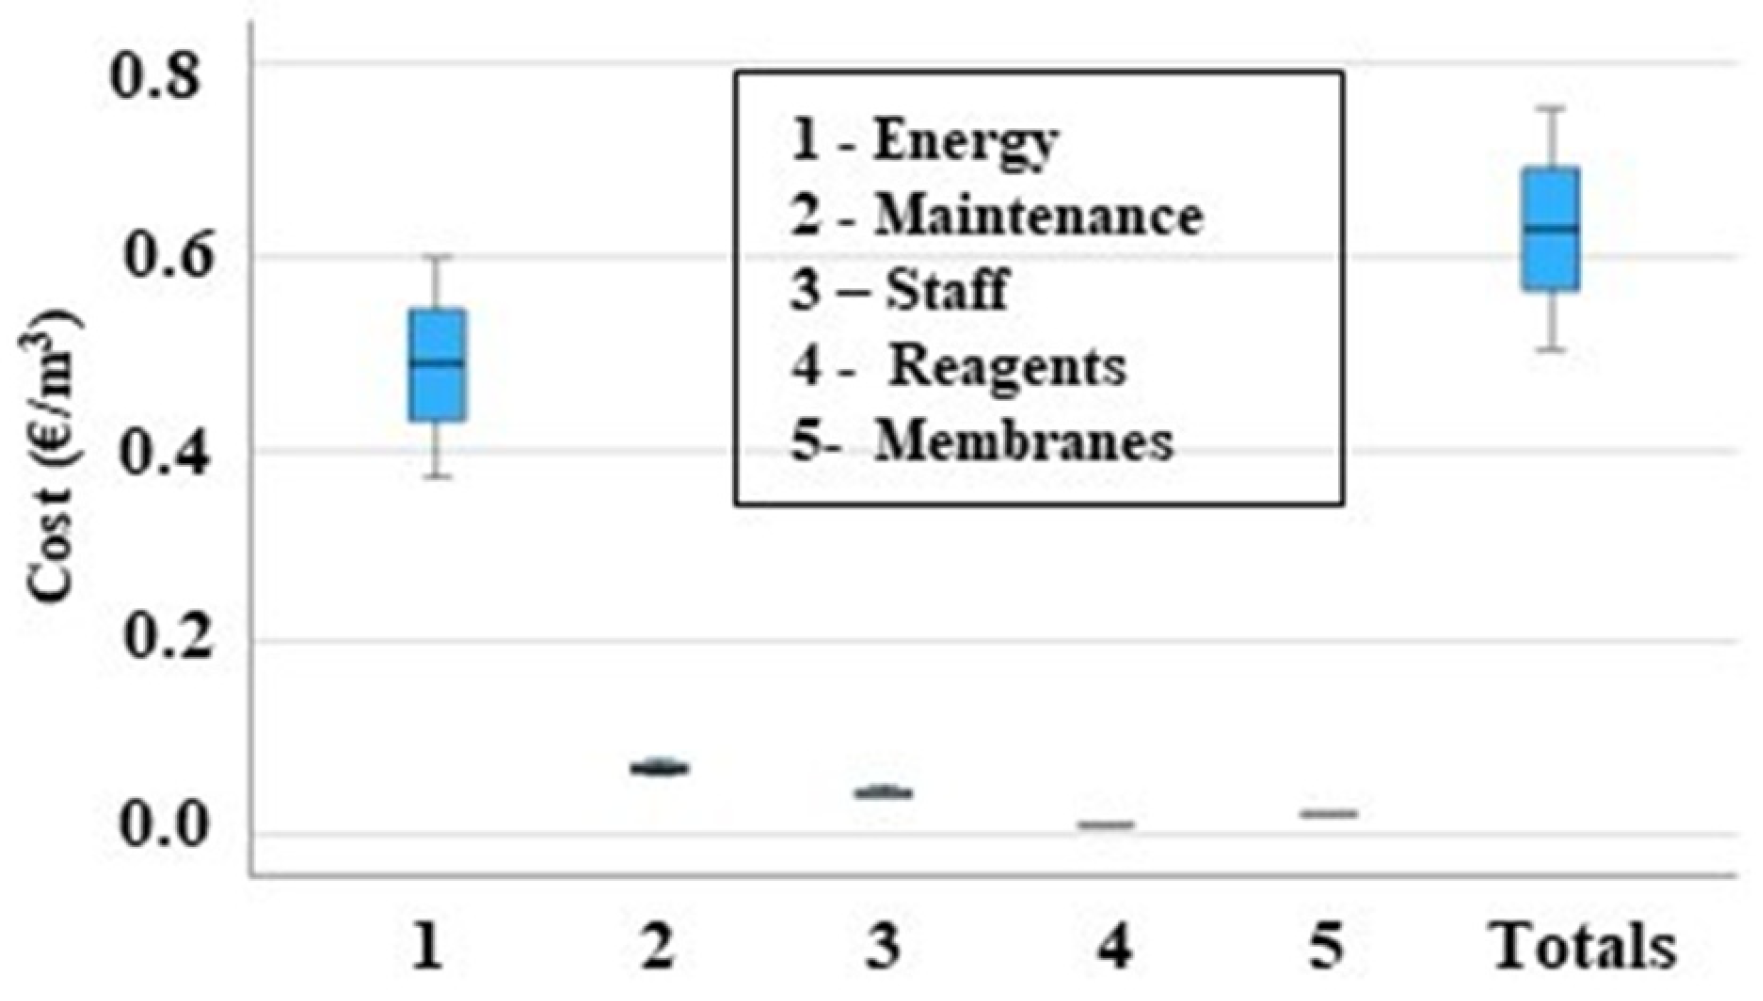
Figure 4 illustrates the box plot results for the three plants, demonstrating that maintenance and reagent costs can be considered constant due to their median falling within the upper and lower limits. This reaffirms that energy consumption behavior is the determinant factor in total installation costs.
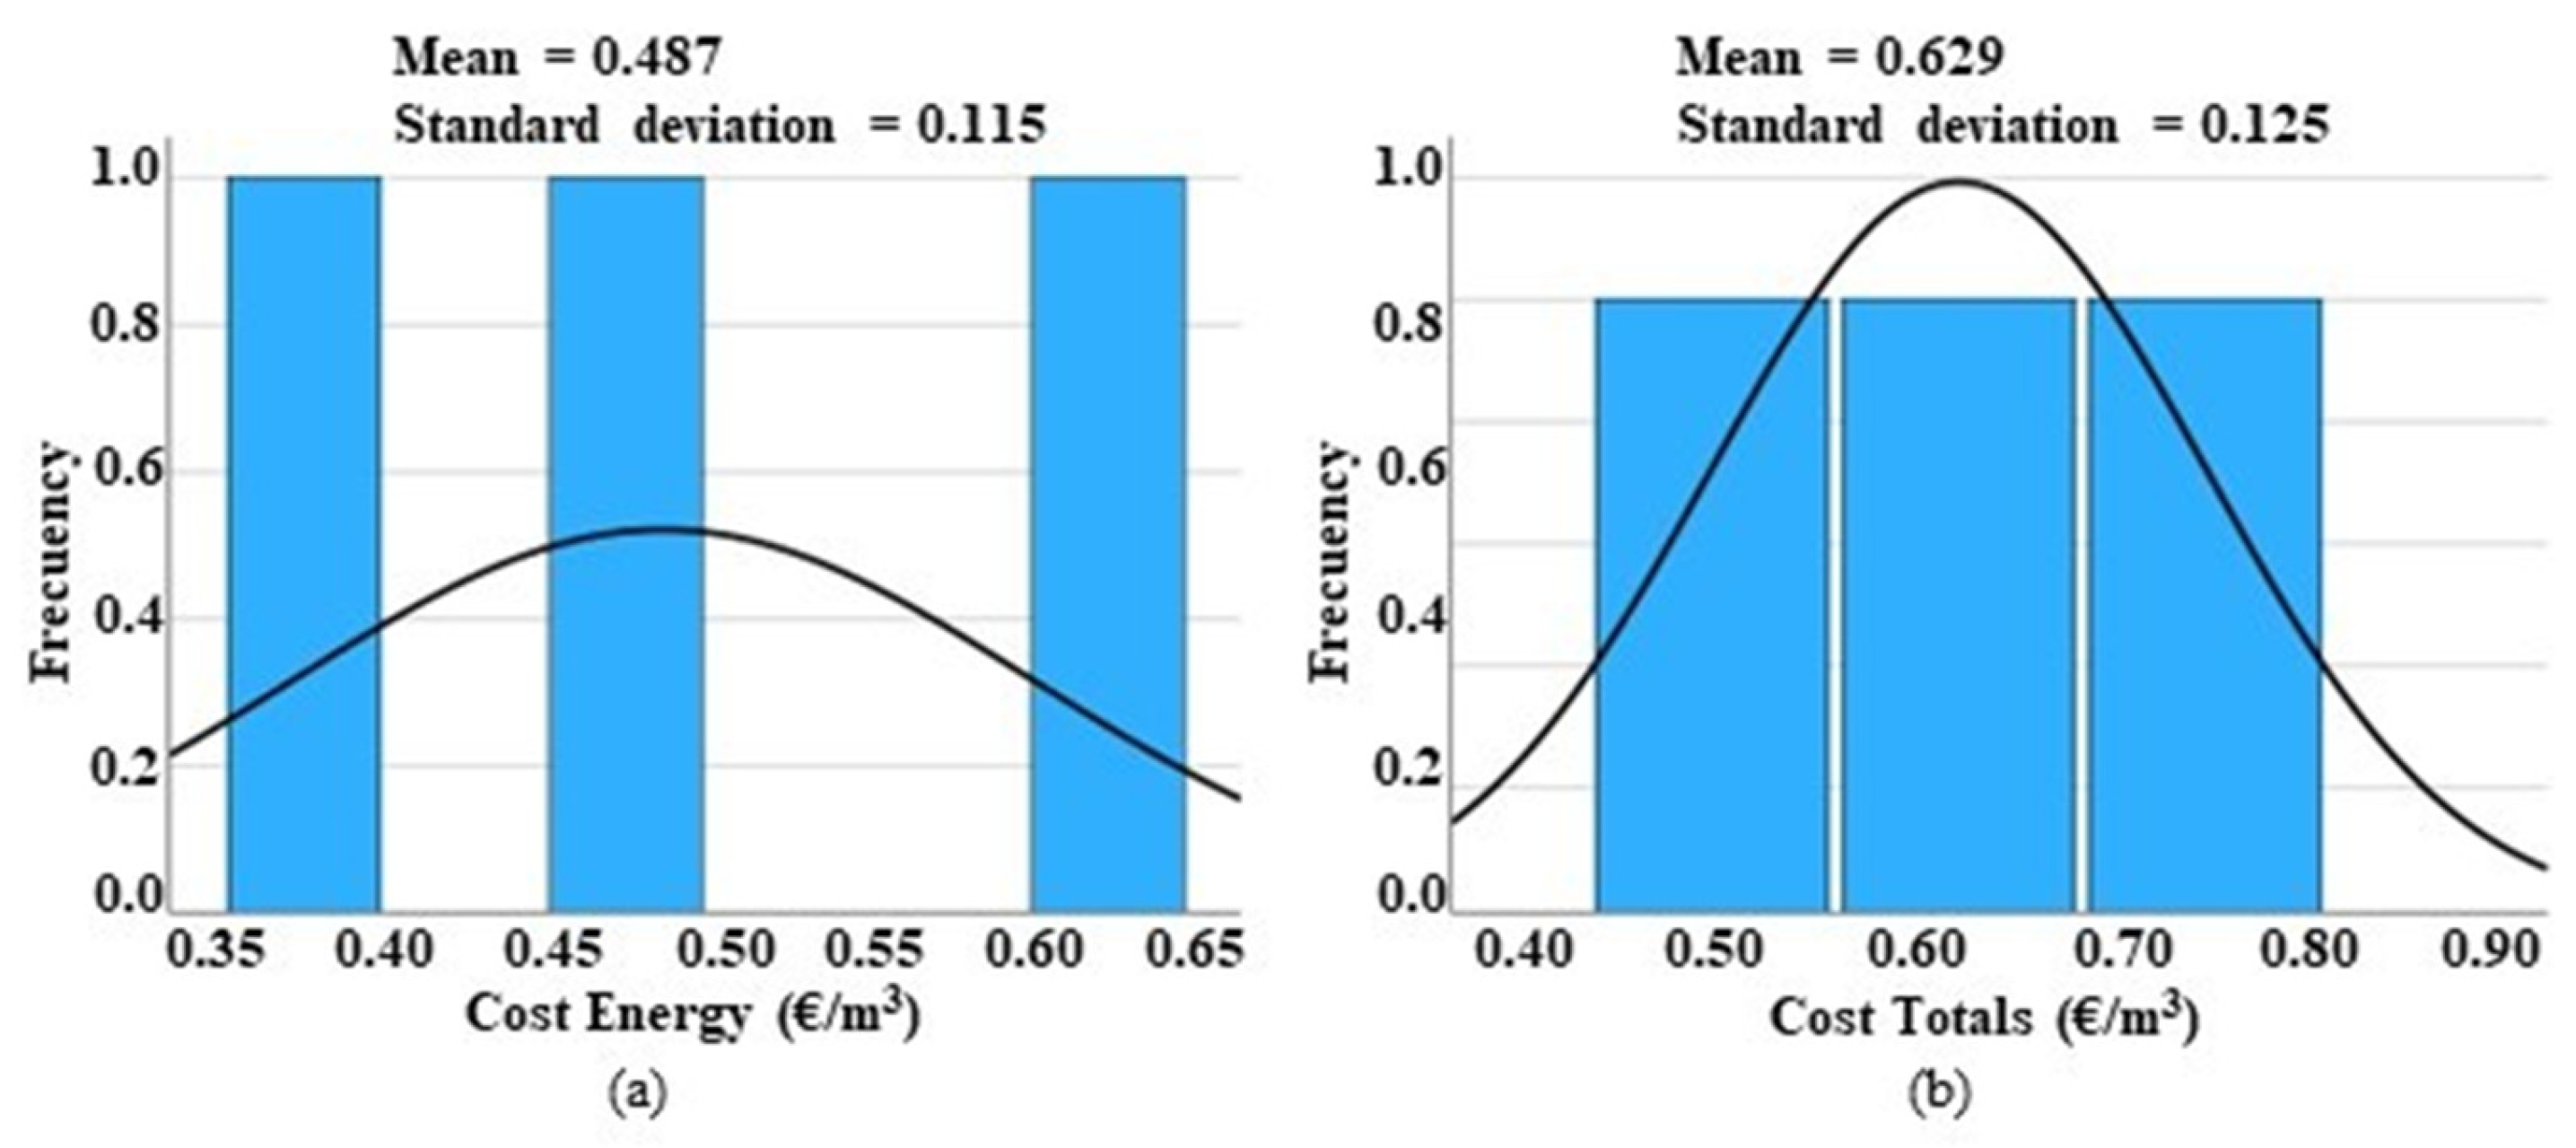
From the studied statistical parameters and distributions, it has been verified that the represented values adhere to a normal distribution, considering them as scattered. A similar study was conducted in a previous work [27], providing the expected normal value and standard deviation through the following graphs (Figure 5 and Figure 6).
The costs analyzed, previously defined as fundamental, underwent Kolmogorov–Smirnov and Shapiro–Wilk tests based on Huber M estimations, Tukey’s bimodal, Hampel M, and Andrews wave, revealing that the contrast distribution remains normal throughout the calculation process, as well as in the total predicted cost. Subsequently, a factorial analysis was carried out using Barlett’s and Kaiser–Meyer–Olkin tests.
With the results of the previous graphs, a study was carried out to obtain a mathematical model that adjusts to the operating conditions of the analyzed plants, in order to obtain the total cost of this type of reverse osmosis desalination plant [27].
In order to study possible values that could be anomalous for the mathematical model, in addition to the information obtained previously, control charts have been made for each cost, in order to eliminate values that do not influence the final model obtained.
To analyze potential mathematical models that best fit the studied plants, the statistical software SPSS Statistics 28 Win64 [57] was employed. Various suitable models were evaluated for the research, leading to the conclusion that the total cost is a singular variable dependent on five independent variables. The result of the mathematical model is expressed in Equation (2).
The coefficients (E, M, S, R, F) in the equation represent the values of energy, maintenance, staff, reagents, and membranes, respectively.
4. Discussion
Plant A is a 25-year-old desalination plant. The maintenance of this plant has not been adequate at all. The number of elements is adequate and the type of elements is of the latest generation, since a membrane replacement was performed. It does not have an energy recovery system, and has a real average SEC of 4.16 kW h/m3, lower than the theoretical one estimated by ROSA software of 5.28 kwh/m3, and higher than the one calculated with an ERS ERI-PX recovery system estimated at 2.82 kW h/m3. To optimize the operation of the plant, a more exhaustive preventive and predictive maintenance should be performed, and it would be advisable to introduce an ERI PX as an ERS to reduce and optimize the SEC of the plant, as this is able to reduce the consumption by up to 32%.
In plant “B”, the machinery has been replaced until reaching an acceptable SEC. The number of elements is low, a Pelton turbine recovery system has been installed, reaching a real average SEC of 3.3 kW h/m3; installing an ERI-PX recovery system means the theoretical value could reach 2.67 kWh/m3. The installation of an ERS ERI-PX is justified in this plant, reducing a maximum of 19.1% of the SEC.
Plant “C” is 24 years old, in optimal conditions of conservation and is medium–high maintenance; it does not have a built-in energy recovery system. As for the membrane elements, the type and number are adequate. The average SEC in the period studied was 3.85 kW h/m3, a lower value than that established by the ROSA software of 4.96 kwh/m3, which represents 22.3% less energy consumed with respect to the theoretical calculation, which suggests that the plant is functioning correctly. With the incorporation of an ERI-PX energy recovery system, a theoretical SEC of 2.75 kwh/m3 could be achieved, which would mean an energy saving of 28.6%.
Although energy consumption, and, therefore, the cost associated with production is the most important factor, there are also other study parameters that should be analyzed because of their influence, although minor, in the final result of the total cost, such as personnel, maintenance, reagents, and membranes [56,58]. Considering these costs as important, they are analyzed in this study below.
Plant “B” has a higher energy cost than the other two plants, 22.5% compared to plant “A” and 62.2% compared to plant “C”, and this over cost can be directly related to obsolete machinery or low energy efficiency, inadequate maintenance in the plant, fouling of the membranes due to poor pre-treatment of feed water, etc. Comparing these results with those obtained in the Ashkelon plant of 0.53 USD/m3, and a production of 275,000 m3/day [59] and the Tuas plant (Singapore) of 0.48 USD/m3 [39], operating data from 2003, plant “C” has a cost of 0.37 EUR/m3, the best result of the three plants studied.
Certainly, this is a crucial point for analysis, and an in-depth on-site study is required to identify the reasons behind the high energy consumption. One possible solution could involve the incorporation of energy recovery systems and the utilization of high-efficiency pumps to reduce this value [60].
The staff costs have been determined based on the number of employees at each plant, with plant B showing the poorest results, with an additional cost of 25% compared to the other two plants. These data are directly influenced by the lower water production, resulting in increased costs relative to the total production.
This value, relative to plant capacity, ranges from 0.027 to 0.036 EUR/m3 for plants with a production capacity between 20,000 to 30,000 m3/day [61]. However, the obtained cost falls between EUR 0.040 to EUR 0.050 per m3, suggesting an excess of personnel in the plants, thereby diminishing competitiveness.
The maintenance cost is influenced by various parameters, including the number of scheduled technical downtimes for predictive maintenance, programmed preventive maintenance, production breakdowns due to corrective maintenance, and membrane replacement due to production time or obsolescence. Plant “C” demonstrates the best performance in this regard, with a 9.7% improvement compared to plant “A” and a 24.2% improvement compared to plant “B”.
The observed values for this category range from 0.062 EUR/m3 for plant “C” to 0.077 EUR/m3 for plant “B”. These results exceed those established by Díaz-Caneja in their study [62], where the expected range was set between 0.022 to 0.025 EUR/m3. This suggests that the maintenance costs of all three plants are notably high and surpass typical expectations for such facilities.
The replacement of membranes is crucial as it is part of the desalination plant’s lifespan. Although these costs, along with the reagents, are not very high, it is essential to ensure that the membranes and filters are always in optimal condition to achieve maximum production of desalinated water with minimal energy consumption. This also extends the plant’s lifespan and directly depends on the reagents used in the pre-treatment of the feedwater, especially in small- to medium-sized plants. The cost of membrane replacement ranges from 0.019 to 0.021 EUR/m3, which is better than expected for this type of small- to medium-sized plants. Typically, such costs range from 0.04 to 0.13 EUR/m3 [63].
The total cost per m3 of water produced by plant “C” is approximately EUR 0.50 per m3, which is highly competitive for this type of plant. This result is achieved due to the optimization of the plant’s energy consumption. It is worth noting that plant “C” has installed an energy recovery system in the pumping process. In contrast, plant “B” shows the worst economic results, indicating that with lower production of desalinated water, there is a higher proportion of associated expenses.
From the study by Micale et al. [64], the results obtained in other desalination plants with similar production capacities are as follows: the estimated total cost for a plant located in Tautoni (USA), with an average production capacity of 18,925 m3/day, is 1.53 USD/m3, based on 2008 production data. For the plant installed in Cyprus, with operational data from 2007 and a capacity of 40,000 m3/day, the cost is 0.88 USD/m3. Similarly, the Palmchin plant in Israel, with data from 2008 and an average production of 83,270 m3/day, has a unit cost of 0.86 USD/m3.
From another study conducted by Karagianis et al. [65], the average total production of seawater reverse osmosis plants are summarized in Table 10, with values expressed in EUR/m3. As observed, all three plants fall within the normal ranges for production capacities of 15,000 to 60,000 m3/day, with the unit production cost ranging between 0.38 to 1.30 EUR/m3.
In general, water desalination costs have decreased in recent years due to technical improvements and advances in technology research. In conventional systems, the cost of desalinating seawater ranges from 0.35 to 2.7 EUR/m3 [66], placing all three plants within the range of total operating costs.
5. Conclusions
Energy efficiency plays a key role in reducing the operating costs of desalination plants, as demonstrated by the need to introduce energy recovery systems in plants A and C, and to achieve a maximum reduction of 32% and 29%, respectively.
Inadequate maintenance management can lead to a significant increase in operating costs, as has been observed in plant A, where poor maintenance practices have contributed to an increase in energy consumption to 4.26 kWh/m3 and overall production costs of 0.629 EUR/m3.
Optimization of human resources and the implementation of preventive maintenance strategies can lead to cost reductions, as demonstrated by plant C, which shows a 20% better performance in terms of maintenance costs compared to plants A and B.
Despite the high operating costs associated with maintenance and energy, the desalination plants in the Canary Islands are between 0.558 and 0.677 EUR/m3; these results show potential to improve their competitiveness and efficiency through the application of optimization measures and the adoption of advanced technologies.
A mathematical model is proposed that represents the total costs of desalination plants as the dependent variable as a function of five independent variables. This model provides a comprehensive tool for analyzing and predicting the costs associated with desalination, enabling optimization and strategic decision-making in the management of these plants. Its application can improve the efficiency and sustainability of the desalination industry, strengthening its competitiveness in the face of economic and environmental challenges.
Author Contributions
Conceptualization, N.R.F.-S. and A.P-A.; methodology, A.F.-B.; software, A.F.-B.; validation, J.F.-G. and A.F.-B.; formal analysis, A.P.-A.; investigation, J.F.-G. and N.R.F.-S.; resources, J.F.-G.; data curation, J.F.-G.; writing—original draft preparation, J.F.-G. and A.F.-B.; writing—review and editing, N.R.F.-S.; visualization, A.P.-A.; supervision, N.R.F.-S. All authors have read and agreed to the published version of the manuscript.
Funding
This research received no external funding.
Data Availability Statement
As the information provided by the operating companies is confidential, the location of the three SWRO desalination plants cannot be disclosed, as the plants are located in the Canary Islands.
Conflicts of Interest
The authors declare no conflicts of interest.
References
- Galvañ, P.V.; Arias, M.F.C.; Beneyto, M.S. Manipulación de Agua de Consumo Humano en Plantas de Ósmosis Inversa, Publicacions Universitat Alacant. 2011. Available online: https://books.google.es/books?id=THZ0RLlyt0sC (accessed on 15 December 2023).
- Edirisooriya, E.M.N.T.; Wang, H.; Banerjee, S.; Longley, K.; Wright, W.; Mizuno, W.; Xu, P. Economic feasibility of developing alternative water supplies for agricultural irrigation. Curr. Opin. Chem. Eng. 2024, 43, 100987. [Google Scholar] [CrossRef]
- Hadi, K. Current Status, Challenges, and Future Management Strategies for Water Resources of Kuwait BT. In Terrestrial Environment and Ecosystems of Kuwait: Assessment and Restoration; Suleiman, M.K., Shahid, S.A., Eds.; Springer Nature: Cham, Switzerland, 2023; pp. 141–169. [Google Scholar] [CrossRef]
- Bhoje, R.; Ghosh, A.K. Chapter 21—Overview of water treatment technologies for preparation of drinking water. In Sustainable Remediation Technologies for Emerging Pollutants in Aqueous Environment; Dehghani, M.H., Karri, R.R., Tyagi, I., Eds.; Elsevier: Amsterdam, The Netherlands, 2024; pp. 431–453. [Google Scholar] [CrossRef]
- Evangelisti, F. The Concept of Matter: A Journey from Antiquity to Quantum Physics; Springer Nature: Cham, Switzerland, 2023. [Google Scholar]
- Boselli, V.; Cristoforetti, S. The role of al-Bīrūnī in the history of hydrology. A modern vision 600 years in advance. In Abu Rayhon Beruniy Ilmiy Merosining Jahon Fani Rivojidagi O’rni [The Role of The Scientific Heritage of Abu Rayhan Beruniy in the Development of World Science]; Ma’naviyat: Tashkent, Uzbekistan, 2023; pp. 195–201. [Google Scholar]
- M.C.D. Adenwalla, C.I.E’, Bombay Gazette [Bombay Newspaper (India)]. Available online: https://www.granthsanjeevani.com/jspui/handle/123456789/26919?searchWord=&backquery (accessed on 1 March 2024).
- Birkett, J. The Origins of Today’s Desalination Technologies. In A Multidisciplinary Introduction to Desalination; River Publishers: Chicago, IL, USA, 2022; pp. 265–293. [Google Scholar]
- Reid, C.E.; Breton, E.J. Water and ion flow across cellulosic membranes. J. Appl. Polym. Sci. 1959, 1, 133–143. [Google Scholar] [CrossRef]
- Sherwood, T.K.; Brian, P.L.T.; Fisher, R.E.; Dresner, L. Salt Concentration at Phase Boundaries in Desalination by Reverse Osmosis. Ind. Eng. Chem. Fundam. 1965, 4, 113–118. [Google Scholar] [CrossRef]
- Khawaji, A.D.; Kutubkhanah, I.K.; Wie, J.-M. Advances in seawater desalination technologies. Desalination 2008, 221, 47–69. [Google Scholar] [CrossRef]
- Glater, J. The early history of reverse osmosis membrane development. Desalination 1998, 117, 297–309. [Google Scholar] [CrossRef]
- Chian, E.S.K.; Chen, J.P.; Sheng, P.-X.; Ting, Y.-P.; Wang, L.K. Reverse osmosis technology for desalination. In Advanced Physicochemical Treatment Technologies; Springer Nature: Cham, Switzerland, 2007; pp. 329–366. [Google Scholar]
- Kim, J.; Park, K.; Yang, D.R.; Hong, S. A comprehensive review of energy consumption of seawater reverse osmosis desalination plants. Appl. Energy 2019, 254, 113652. [Google Scholar] [CrossRef]
- Azinheira, G.; Segurado, R.; Costa, M. Chapter 4—Use of RES-powered desalination in water-stressed regions. A case study in Algarve, Portugal. In Energy Storage for Multigeneration; Gude, V.G., Ed.; Academic Press: Cambridge, MA, USA, 2023; pp. 93–124. [Google Scholar] [CrossRef]
- Clark, J.S.; Grimm, E.C.; Donovan, J.J.; Fritz, S.C.; Engstrom, D.R.; Almendinger, J.E. Drought cycles and landscape responses to past aridity on prairies of the northern great plains, USA. Ecology 2022, 83, 595–601. [Google Scholar] [CrossRef]
- Cancelliere, A.; Di Mauro, G.; Bonaccorso, B.; Rossi, G. Drought forecasting using the Standardized Precipitation Index. Water Resour. Manag. 2007, 21, 801–819. [Google Scholar] [CrossRef]
- Galitskaya, I.; Mohan, K.R.; Krishna, A.K.; Batrak, G.; Eremina, O.; Putilina, V.; Yuganova, T. Assessment of soil and Groundwater Contamination by Heavy Metals and Metalloids in Russian and Indian Megacities. Procedia Earth Planet. Sci. 2017, 17, 674–677. [Google Scholar] [CrossRef]
- Grondona, S.I.; Lima, M.L.; Massone, H.E.; Miglioranza, K.S.B. Pesticides in aquifers from Latin America and the Caribbean. Sci. Total Environ. 2023, 901, 165992. [Google Scholar] [CrossRef]
- Cellone, F.; Santucci, L.; Borzi, G.; Tanjal, C.; Di Lello, C.; Butler, L.; Córdoba, J.; Lamarche, L.; Galliari, J.; Melendi, E.; et al. Impact of dairy farms on groundwater quality in a productive basin in the northeast of the Pampean Plain, Argentina. Groundw. Sustain. Dev. 2023, 23, 100997. [Google Scholar] [CrossRef]
- Bondu, R.; Casiot, C.; Pistre, S.; Batiot-Guilhe, C. Impact of past mining activities on water quality in a karst area in the Cévennes region, Southern France. Sci. Total Environ. 2023, 873, 162274. [Google Scholar] [CrossRef]
- Raja, S.R.; Kanagaraj, B.; Eunice, S. Evaluating groundwater contamination: An examination of a municipal solid waste dump yard in southern India’s Manchester City. Resour. Conserv. Recycl. Adv. 2023, 20, 200196. [Google Scholar]
- Laonamsai, J.; Pawana, V.; Chipthamlong, P.; Chomcheawchan, P.; Kamdee, K.; Kimmany, B.; Julphunthong, P. Groundwater Quality Variations in Multiple Aquifers: A Comprehensive Evaluation for Public Health and Agricultural Use. Geosciences 2023, 13, 195. [Google Scholar] [CrossRef]
- Ghaffour, N. The challenge of capacity-building strategies and perspectives for desalination for sustainable water use in MENA. Desalin. Water Treat. 2009, 5, 48–53. [Google Scholar] [CrossRef]
- Martín, R.H.; González, J.M.V.; Bordón, P.S.T. Distribución y Concentración Del Alojamiento Turístico en Canarias. Plazas Hoteleras, en Apartamentos, Vivienda Vacacional y Población; Observatorio Turístico de Canaria: Santa Cruz, Spain, 2024. [Google Scholar]
- Stoughton, K.M.; Duan, X.; Wendel, E.M. Reverse Osmosis Optimization; PNNL: Richland, WA, USA, 2013.
- Feo, J.; Sadhwani, J.J.; Alvarez, L. More efficient production line with Desalination plants using reverse osmosis. Desalin. Water Treat. 2013, 51, 307–317. [Google Scholar] [CrossRef]
- Najjar, E.; Al-Hindi, M.; Massoud, M.; Saad, W. Life cycle assessment and cost of a seawater reverse osmosis plant operated with different energy sources. Energy Convers. Manag. 2022, 268, 115964. [Google Scholar] [CrossRef]
- Okampo, E.J.; Nwulu, N. Optimisation of renewable energy powered reverse osmosis desalination systems: A state-of-the-art review. Renew. Sustain. Energy Rev. 2021, 140, 110712. [Google Scholar] [CrossRef]
- Voutchkov, N. Energy use for membrane seawater desalination—Current status and trends. Desalination 2018, 431, 2–14. [Google Scholar] [CrossRef]
- McGovern, R.K.; Lienhard, V.J.H. On the potential of forward osmosis to energetically outperform reverse osmosis desalination. J. Membr. Sci. 2014, 469, 245–250. [Google Scholar] [CrossRef]
- Park, K.; Heo, H.; Kim, D.Y.; Yang, D.R. Feasibility study of a forward osmosis/crystallization/reverse osmosis hybrid process with high-temperature operation: Modeling, experiments, and energy consumption. J. Membr. Sci. 2018, 555, 206–219. [Google Scholar] [CrossRef]
- Shrivastava, A.; Rosenberg, S.; Peery, M. Energy efficiency breakdown of reverse osmosis and its implications on future innovation roadmap for desalination. Desalination 2015, 368, 181–192. [Google Scholar] [CrossRef]
- Schunke, A.J.; Hernandez-Herrera, G.A.; Padhye, L.; Berry, T.-A. Energy Recovery in SWRO Desalination: Current Status and New Possibilities. Front. Sustain. Cities 2020, 2, 9. [Google Scholar] [CrossRef]
- McHarg, J.; Truby, R. West Coast researchers seek to demonstrate SWRO affordability. Int. Desalin. Water Reuse Q. 2004, 14, 10–18. [Google Scholar]
- Kim, J.; Hong, S. A novel single-pass reverse osmosis configuration for high-purity water production and low energy consumption in seawater desalination. Desalination 2018, 429, 142–154. [Google Scholar] [CrossRef]
- Karabelas, A.; Koutsou, C.; Kostoglou, M.; Sioutopoulos, D. Analysis of specific energy consumption in reverse osmosis desalination processes. Desalination 2018, 431, 15–21. [Google Scholar] [CrossRef]
- Park, K.; Kim, J.; Yang, D.R.; Hong, S. Towards a low-energy seawater reverse osmosis desalination plant: A review and theoretical analysis for future directions. J. Membr. Sci. 2020, 595, 117607. [Google Scholar] [CrossRef]
- Fritzmann, C.; Löwenberg, J.; Wintgens, T.; Melin, T. State-of-the-art of reverse osmosis desalination. Desalination 2007, 216, 1–76. [Google Scholar] [CrossRef]
- Stover, R.L. Energy Recovery Devices for Seawater Reverse Osmosis. Everything about Water. 2006. Available online: https://www.eawater.com/ (accessed on 1 March 2024).
- Rybar, S.; Vodnar, M.; Vartolomei, F.L.; Méndez, R.L.; Ruano, J.B.L. Experience with renewable energy source and SWRO desalination in Gran Canaria. In Proceedings of the SP05-100 International Desalination Association World Congress, Singapore, 11–16 September 2005. [Google Scholar]
- Carta, J.A.; González, J.; Cabrera, P.; Subiela, V.J. Preliminary experimental analysis of a small-scale prototype SWRO desalination plant, designed for continuous adjustment of its energy consumption to the widely varying power generated by a stand-alone wind turbine. Appl. Energy 2015, 137, 222–239. [Google Scholar] [CrossRef]
- Delgado-Torres, A.M.; García-Rodríguez, L.; del Moral, M.J. Preliminary assessment of innovative seawater reverse osmosis (SWRO) desalination powered by a hybrid solar photovoltaic (PV)—Tidal range energy system. Desalination 2020, 477, 114247. [Google Scholar] [CrossRef]
- Ruiz-García, A.; Nuez, I.; Khayet, M. Performance assessment and modeling of an SWRO pilot plant with an energy recovery device under variable operating conditions. Desalination 2023, 555, 116523. [Google Scholar] [CrossRef]
- Cabrera, P.; Carta, J.A.; Matos, C.; Rosales-Asensio, E.; Lund, H. Reduced desalination carbon footprint on islands with weak electricity grids. The case of Gran Canaria. Appl. Energy 2024, 358, 122564. [Google Scholar] [CrossRef]
- Kumar, S.S.; Lim, H. An overview of water electrolysis technologies for green hydrogen production. Energy Rep. 2022, 8, 13793–13813. [Google Scholar] [CrossRef]
- Zainal, B.S.; Ker, P.J.; Mohamed, H.; Ong, H.C.; Fattah, I.; Rahman, S.A.; Nghiem, L.D.; Mahlia, T.M.I. Recent advancement and assessment of green hydrogen production technologies. Renew. Sustain. Energy Rev. 2024, 189, 113941. [Google Scholar] [CrossRef]
- Kobayashi, H.; Hayakawa, A.; Somarathne, K.K.A.; Okafor, E.C. Science and technology of ammonia combustion. Proc. Combust. Inst. 2019, 37, 109–133. [Google Scholar] [CrossRef]
- Castro-Martínez, C.; Beltrán-Arredondo, L.I.; Ortiz-Ojeda, J.C. Producción de biodiesel y bioetanol:¿ una alternativa sustentable a la crisis energética. Ra Ximhai 2012, 8, 93–100. [Google Scholar] [CrossRef]
- Connor, R. The United Nations World Water Development Report 2015: Water for a Sustainable World; UNESCO Publishing: Paris, France, 2015. [Google Scholar]
- Youssef, P.; Al-Dadah, R.; Mahmoud, S. Comparative Analysis of Desalination Technologies. Energy Procedia 2014, 61, 2604–2607. [Google Scholar] [CrossRef]
- Subramani, A.; Jacangelo, J.G. Emerging desalination technologies for water treatment: A critical review. Water Res. 2015, 75, 164–187. [Google Scholar] [CrossRef]
- Eke, J.; Yusuf, A.; Giwa, A.; Sodiq, A. The global status of desalination: An assessment of current desalination technologies, plants and capacity. Desalination 2020, 495, 114633. [Google Scholar] [CrossRef]
- Ahmed, F.E.; Khalil, A.; Hilal, N. Emerging desalination technologies: Current status, challenges and future trends. Desalination 2021, 517, 115183. [Google Scholar] [CrossRef]
- Curto, D.; Franzitta, V.; Guercio, A. A Review of the Water Desalination Technologies. Appl. Sci. 2021, 11, 670. [Google Scholar] [CrossRef]
- Feo, J.; Sadhwani, J.J.; Alvarez, L. Cost analysis in RO desalination plants production lines: Mathematical model and simulation. Desalin. Water Treat. 2013, 51, 4800–4805. [Google Scholar] [CrossRef]
- IBM Corporation. IBM SPSS Statistics for Windows; IBM Corporation: Armonk, NY, USA, 2021. [Google Scholar]
- Yangali-Quintanilla, V.; Olesen, L.; Lorenzen, J.; Rasmussen, C.; Laursen, H.; Vestergaard, E.; Keiding, K. Lowering desalination costs by alternative desalination and water reuse scenarios. Desalin. Water Treat. 2015, 55, 2437–2445. [Google Scholar] [CrossRef]
- Kronenberg, G. The largest SWRO plant in the world—Ashkelon 100 million m3/y BOT project. Desalination 2004, 166, 457–463. [Google Scholar] [CrossRef]
- Feo-García, J.; Ruiz-García, A.; Ruiz-Saavedra, E.; Melian-Martel, N. Cost assessment in SWRO desalination plants with a production of 600 m3/d in Canary Islands. Desalin. Water Treat. 2016, 57, 22887–22893. [Google Scholar] [CrossRef]
- Medina, J.A. Years evolution of desalination costs in Spain. In Proceedings of the International Conference on Desalination Costing, Limassol, Cyprus, 6–8 December 2004. [Google Scholar]
- Díaz-Caneja, J.; Fariñas, M.; Rubial, R. Cost estimation briefing for large seawater reverse osmosis facilities in Spain. In Proceedings of the International Conference on Desalination Costing, Limassol, Cyprus, 6–8 December 2004. [Google Scholar]
- Avlonitis, S.; Kouroumbas, K.; Vlachakis, N. Energy consumption and membrane replacement cost for seawater RO desalination plants. Desalination 2003, 157, 151–158. [Google Scholar] [CrossRef]
- Micale, G.; Rizzuti, L.; Cipollina, A. Seawater Desalination: Conventional and Renewable Energy Processes; Springer: Berlin/Heidelberg, Germany, 2009. [Google Scholar]
- Karagiannis, I.C.; Soldatos, P.G. Water desalination cost literature: Review and assessment. Desalination 2008, 223, 448–456. [Google Scholar] [CrossRef]
- Shatat, M.; Riffat, S.B. Water desalination technologies utilizing conventional and renewable energy sources. Int. J. Low-Carbon Technol. 2014, 9, 1–19. [Google Scholar] [CrossRef]
Figure 1.
Location: Canary Islands.


Figure 3.
Average SEC (kWh/m3) of the desalination plants.

Figure 4.
Box-and-whisker plot of SWRO analyzed (EUR/m2).

Figure 5.
QQ′ normal. Normal value expected: (a) cost energy, (b) cost totals.

Figure 6.
Histogram (EUR/m3) of the desalination plants: (a) cost energy, (b) cost totals.


Table 1.
Summary of plant characteristics.
| A | B | C | |
|---|---|---|---|
| Construction (year) | 1997 | 2001 | 1998 |
| Start-up (year) | 1998 | 2001 | 1998 |
| Nº membranes | 6/7 | 6 | 7 |
| Membrane type | IONICS | Aeronauti, LG | IOINICS |
| Membrane configuration | Spiral | Spiral | Spiral |
| Production (m3/day) | 30,000 | 23,000 | 33,000 |
| Production lines | 4 | 3 | 4 |
| Pressure vessels/line | 60 | 96 | 111 |
| Total membranes | 1680 | 1728 | 3108 |
| Intake | Beach well | Beach well | Beach well |
| Pre-treatment (chemicals) | NaOCl NaHSO3 | NaHSO3 | NaOCl NaHSO3 |
| Recovery | 40% | 45% | 42% |
| Configuration | 1 pass/1 stage | 1 pass/1 stage | 1 pass/2 stage |
| Energy recovery system | NO | Pelton turbine | NO |
| Maintenance | Medium–high | High | Medium–high |
| Feed temperature (°C) | 22 | 25 | 23 |
| Feed pH (average) | 7.2 | 6.5 | 7.1 |
Table 2.
Annual average of energy (kWh) and volume of water produced (m3).
| Plant | Year | Energy (kWh) | Production (m3) |
|---|---|---|---|
| A | 2015 | 23,380,191 | 5,399,582 |
| 2016 | 27,714,395 | 6,505,726 | |
| 2017 | 30,082,701 | 7,373,211 | |
| 2018 | 35,522,439 | 8,947,717 | |
| B | 2015 | 25,965,494 | 8,295,685 |
| 2016 | 23,768,636 | 7,890,029 | |
| 2017 | 28,989,245 | 8,480,957 | |
| 2018 | 29,726,744 | 8,580,675 | |
| C | 2015 | 39,705,138 | 9,876,900 |
| 2016 | 37,164,847 | 10,238,250 | |
| 2017 | 39,965,310 | 10,117,800 | |
| 2018 | 39,715,978 | 10,479,150 |
Table 3.
Average SEC (kWh/m3) of the desalination plants.
| Year/Plant | A | B | C |
|---|---|---|---|
| 2015 | 4.33 | 3.13 | 4.02 |
| 2016 | 4.26 | 3.03 | 3.63 |
| 2017 | 4.08 | 3.42 | 3.95 |
| 2018 | 3.97 | 3.49 | 3.79 |
Table 4.
Summary of all cost (EUR/m3).
| Plant | Energy | Staff | Maintenance | Reagents | Membranes | Totals |
|---|---|---|---|---|---|---|
| A | 0.490 | 0.040 | 0.068 | 0.021 | 0.010 | 0.629 |
| B | 0.600 | 0.050 | 0.077 | 0.019 | 0.009 | 0.755 |
| C | 0.370 | 0.040 | 0.062 | 0.022 | 0.010 | 0.504 |
Table 5.
Main data software ROSA.
| Plant | A | B | C |
|---|---|---|---|
| Feed press (bar) | 60.42 | 60.24 | 60.30 |
| Conc press (bar) | 58.04 | 59.42 | 58.64 |
| SEC (kW h/m3) | 5.28 | 4.67 | 4.96 |
| Feed TDS (mg/L) | 38,038 | 38,031 | 38,034 |
Table 6.
SEC based on the ERS ERI-PX.
| Plant | A | B | C |
|---|---|---|---|
| Feed press (bar) | 57.4 | 58.6 | 57.90 |
| Conc press (bar) | 60.4 | 60.2 | 60.30 |
| SEC (kW h/m3) | 2.82 | 2.67 | 2.75 |
| Feed TDS (mg/L) | 38,036 | 38,032 | 38,034 |
Table 7.
Margin of error plant.
| Plant | Margin of Error (%) |
|---|---|
| A | 47.1 |
| B | 24.0 |
| C | 34.5 |
Table 8.
Test of between-subject effects.
| Origin | Sum of Squares | gL | Mean Square | F | Sig. | Partial Eta Squared | Parameter Non-Centrality | Observed Power |
|---|---|---|---|---|---|---|---|---|
| Energy | 0.476 | 1 | 0.476 | 59.007 | 0.017 | 0.967 | 59.007 | 0.945 |
| Staff | 0.004 | 1 | 0.004 | 161.340 | 0.006 | 0.988 | 161.340 | 1.000 |
| Maintenance | 0.009 | 1 | 0.009 | 257.793 | 0.004 | 0.992 | 257.793 | 1.000 |
| Reagents | 0.001 | 1 | 0.001 | 529.385 | 0.002 | 0.967 | 529.385 | 1.000 |
| Membranes | 0.000 | 1 | 0.000 | 768.085 | 0.001 | 0.996 | 768.085 | 1.000 |
| Error | 0.016 | 2 | 0.008 | |||||
| Total | 0.462 | 3 | ||||||
| Total corrected | 0.016 | 2 |
Table 9.
Model parameters.
| Confidence Interval 95% | ||||||||
|---|---|---|---|---|---|---|---|---|
| Parameter | B | Error Tip. | T | Sig. | Lower Limit | Upper Limit | Parameter Non-Centrality | Observed Power |
| Energy | 0.502 | 1 | 7662 | 0.017 | 0.221 | 0.783 | 0.967 | 7662 |
| Staff | 0.044 | 1 | 12,702 | 0.006 | 0.029 | 0.056 | 0.986 | 12,702 |
| Maintenance | 0.070 | 1 | 16,056 | 0.004 | 0.051 | 0.088 | 0.992 | 16,056 |
| Reagents | 0.020 | 1 | 23,008 | 0.002 | 0.008 | 0.011 | 0.967 | 23,008 |
| Membranes | 0.010 | 1 | 27,714 | 0.001 | 0.047 | 0.024 | 0.996 | 27,714 |
Table 10.
Membrane (RO) cost of water desalination (per m3) [64].
Table 10.
Membrane (RO) cost of water desalination (per m3) [64].
| Size of Plant (m3/day) | Production Cost (EUR/m3) |
|---|---|
| <100 | 1.2–15.00 |
| 250–1000 | 1.00–3.14 |
| 1000–4800 | 0.56–1.38 |
| 15,000–60,000 | 0.38–1.30 |
| 100,000–320,000 | 0.36–0.53 |
Disclaimer/Publisher’s Note: The statements, opinions and data contained in all publications are solely those of the individual author(s) and contributor(s) and not of MDPI and/or the editor(s). MDPI and/or the editor(s) disclaim responsibility for any injury to people or property resulting from any ideas, methods, instructions or products referred to in the content. |
© 2024 by the authors. Licensee MDPI, Basel, Switzerland. This article is an open access article distributed under the terms and conditions of the Creative Commons Attribution (CC BY) license (https://creativecommons.org/licenses/by/4.0/).
Share and Cite
MDPI and ACS Style
Feo-García, J.; Pulido-Alonso, A.; Florido-Betancor, A.; Florido-Suárez, N.R. Cost Studies of Reverse Osmosis Desalination Plants in the Range of 23,000–33,000 m3/day. Water 2024, 16, 910. https://0-doi-org.brum.beds.ac.uk/10.3390/w16060910
AMA Style
Feo-García J, Pulido-Alonso A, Florido-Betancor A, Florido-Suárez NR. Cost Studies of Reverse Osmosis Desalination Plants in the Range of 23,000–33,000 m3/day. Water. 2024; 16(6):910. https://0-doi-org.brum.beds.ac.uk/10.3390/w16060910
Chicago/Turabian StyleFeo-García, J., A. Pulido-Alonso, A. Florido-Betancor, and N. R. Florido-Suárez. 2024. "Cost Studies of Reverse Osmosis Desalination Plants in the Range of 23,000–33,000 m3/day" Water 16, no. 6: 910. https://0-doi-org.brum.beds.ac.uk/10.3390/w16060910
Note that from the first issue of 2016, this journal uses article numbers instead of page numbers. See further details here.