
Using the Heavy Metal and Biotic Indices to Assess Ecological Quality in the Central Area of the East Sea, South Korea

1
Department of Life Science and Biotechnology, Soonchunhyang University, Asan 31538, Republic of Korea
2
Haerang Technology and Policy Research Institute, Suwon 16229, Republic of Korea
*
Author to whom correspondence should be addressed.
Water 2024, 16(9), 1230; https://0-doi-org.brum.beds.ac.uk/10.3390/w16091230
Submission received: 19 March 2024
/
Revised: 17 April 2024
/
Accepted: 23 April 2024
/
Published: 25 April 2024
(This article belongs to the Special Issue Marine Ecological Monitoring, Assessment and Protection)
Abstract
:With the rapid development of the South Korean economy, human activities have extensively affected Korea’s coastal environment. A precise ecological quality assessment remains paramount despite the relatively lower impact of human activities on the East Sea compared to the West and South Seas of South Korea. Accurate ecological quality assessments can provide valuable marine environmental protection and management references. In our study, we employed seven indices based on heavy metals and macrobenthos to comprehensively assess ecological quality. Our results indicated the final ecological quality in the central East Sea of South Korea was acceptable at most stations; however, the ecological quality in winter marginally falls short compared to that in spring. The concentration of heavy metals emerges as a significant determinant of the final ecological quality, underscoring the need for subsequent studies to investigate the origins of heavy metals in the central East Sea of South Korea and the influence of anthropogenic activities on heavy metal concentrations. Furthermore, employing a single biotic index proves challenging for accurately assessing ecological quality in the East Sea of South Korea.
1. Introduction
As a result of population growth and economic development, human activities have significantly affected the global coastal environment [1,2,3]. Numerous indices have been developed to assess the ecological health of coastal ecosystems and to evaluate the impact of human actions on coastal areas [4]. Among these, benthic indices based on the macrobenthic community stand out among the numerous indices and are considered the most effective in assessing marine ecosystems [5,6].
Benthic indices have been extensively applied to assess the ecological quality of coastal regions worldwide, effectively gauging the impact of human activities on coastal ecosystem quality in numerous investigations [7]. For example, the multivariate AMBI (M-AMBI) is an effective index for assessing the ecological quality of the Sea of Japan [8], and the BENTIX is an effective index for assessing the ecological quality of the Marmara Sea [9]. Indices based on macrobenthos are commonly employed to evaluate the ecological quality of coastal areas globally. Nonetheless, the complexity of marine environments poses significant challenges to the accurate assessment of ecological quality using a single biotic index [10,11,12]. In recent research, ecological quality has been evaluated through a comprehensive assessment using multiple indices [13,14,15,16]. However, only a subset of studies has considered combining abiotic and biotic indices to assess marine ecological quality [17].
Heavy metals occur naturally in marine ecosystems; however, in some regions, their concentrations may be elevated due to human activities. This increase poses a potential risk to marine biodiversity and the health of ecosystems and could impact human health [18,19,20]. For instance, during the 1950s in Japan, extensive mercury (Hg) discharges from chemical plants resulted in its accumulation in fish and shellfish. This contamination was subsequently transmitted through the food chain to the local populace, culminating in the outbreak of Minamata disease [21,22]. Heavy metal contamination has become a global concern [23,24]. Heavy metals are commonly concentrated in sediments, leading to the development of various heavy metal indices to assess the risk posed to the environment by the content of heavy metals in sediments [25]. Some heavy metal indices (i.e., the Nemerow pollution index, the pollution load index, and the potential ecological risk index) have been widely used to evaluate the ecological risk of marine sediments [26,27]. However, few studies employ both heavy metal and benthic indices for a comprehensive ecological quality assessment.
As South Korea’s economy has grown, human activities have extensively impacted its coastal environments. The use of benthic indices to assess the ecological quality of coastal areas in South Korea has been widely implemented. However, most of these studies have focused on the West and South Seas of South Korea [28,29,30,31]. Only a few studies have assessed the ecological quality of the southern East Sea in South Korea [32,33]. The impact of human activities on the East Sea of South Korea is significantly lower compared to the impacts observed in the West Sea and the South Sea of South Korea. The average depth of the East Sea far exceeds that of the West and South Seas in South Korea. Furthermore, the concentrations of nutrients in the seawater and the content of organic matter in the sediments of the East Sea are lower than those in the West Sea and South Sea in South Korea [34,35,36]. Although the East Sea of South Korea experiences lower levels of human impact, it is still crucial to evaluate its ecological quality precisely. Such accurate evaluations offer solid backing and references for future marine environmental conservation efforts and policy development.
In this study, our objectives were to (1) examine the content of heavy metals in the East Sea of South Korea and assess the potential ecological risks posed by heavy metals; (2) evaluate the effectiveness of biotic indices in assessing ecological quality; and (3) determine the final ecological quality through a holistic approach that integrates indices based on heavy metals and macrobenthos.
2. Materials and Methods
2.1. Study Area
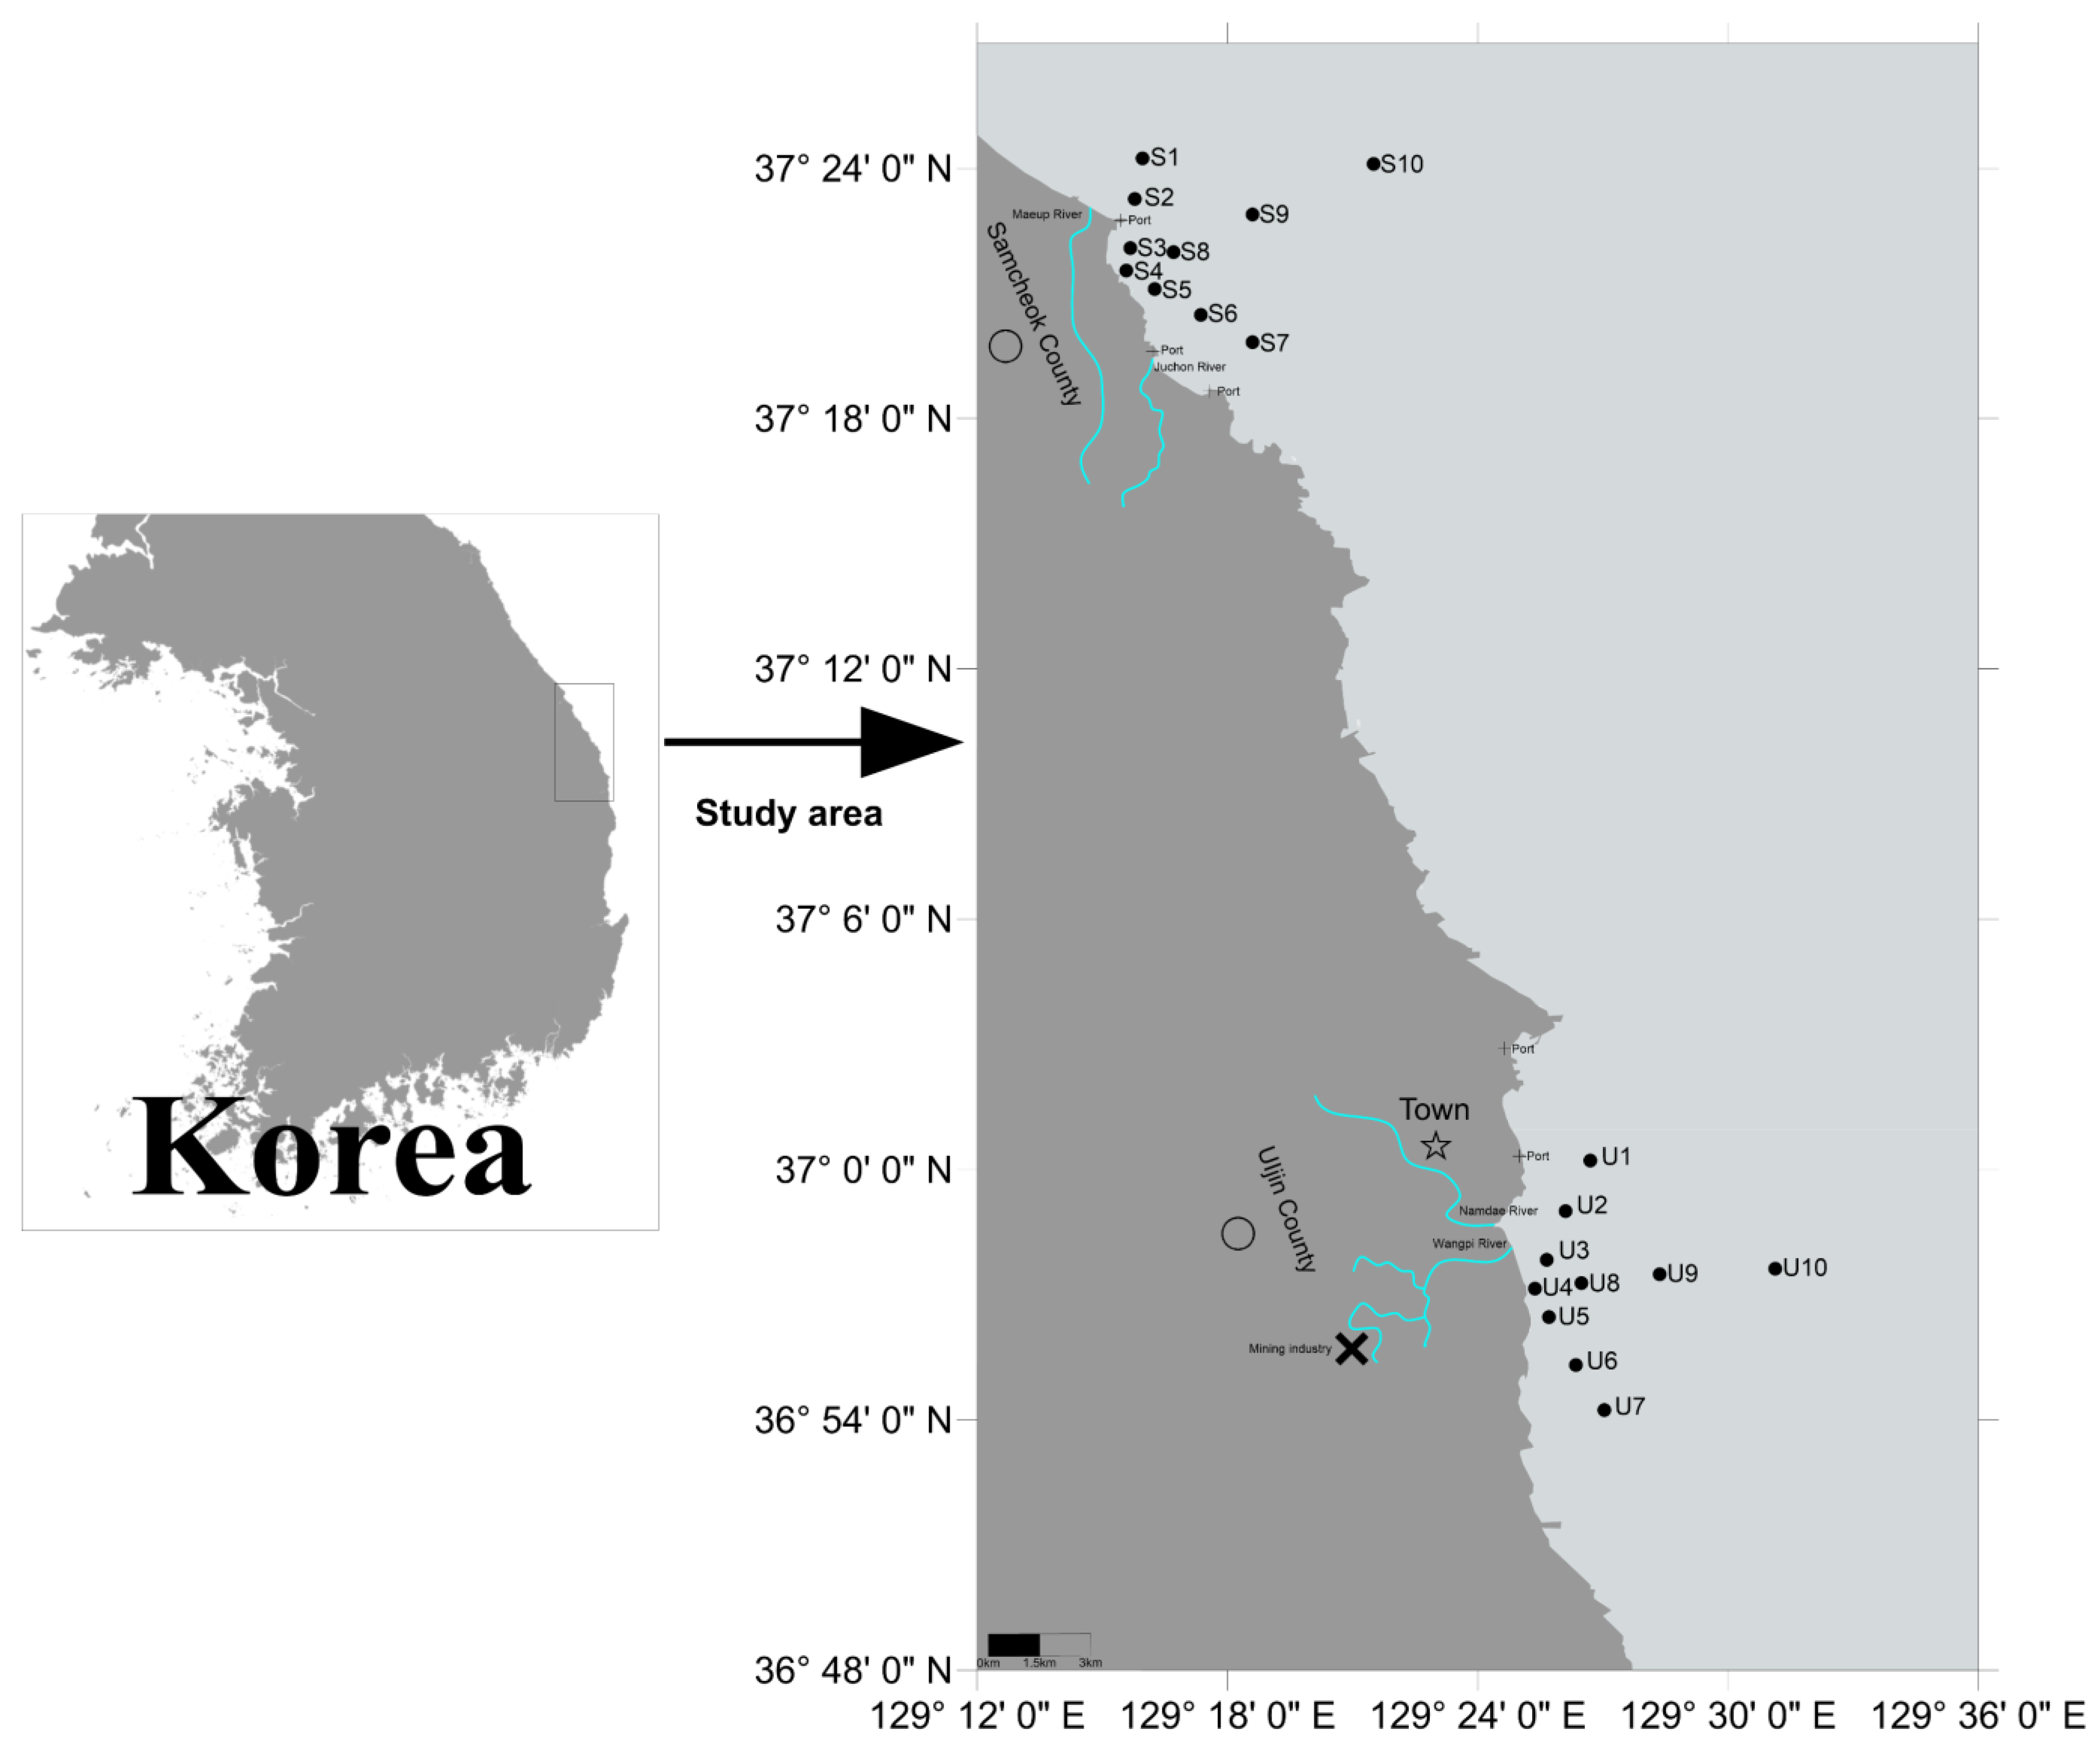
The study area is located on the coast of Samcheok County (37°24′14.13″–37°19′49.66″ N, 129°15′34.43″–129°21′29.99″ E) and Uljin County (37°00′13.42″–36°54′13.98″ N, 129°25′22.06″–129°27′22.75″ E) (Figure 1). Two study areas are situated in the East Sea of South Korea (Sea of Japan), which has a total area of 978,000 km2 and a maximum depth of 3742 m [37]. Stations 2 and 6 in Samcheok County are near the Maeup and Junchon Rivers. Stations 2 and 3 in Uljin County are near the Namdae and Wangpi Rivers. The study area in Uljin County is located near a town with an approximate population of 46,000. In February, the average coastal water temperature of Samcheok County is 3.91 ± 1.17 °C, while in May, it rises to 5.84 ± 1.74 °C. In contrast, the coastal water temperature of Uljin County in February averages 6.65 ± 2.38 °C, and in May, it slightly increases to 7.02 ± 2.18 °C [38]. The water depth of the study areas ranges from 11 m to 161 m, with an average depth of 56.5 m. The water depth exceeded 150 m at S10 and U10. The annual average precipitation of the study area is between 1000 mm and 1500 mm, with a water temperature range of 9.2 °C to 25.0 °C and salinity concentrations ranging from 30.3 to 34.1 psu [39]. This study marks a pioneering attempt to utilise heavy metals and macrobenthos to evaluate the ecological quality in the central East Sea of South Korea, thus filling a crucial gap in regional environmental research and establishing a baseline for subsequent investigations.
2.2. Sample Collection and Processing
Macrobenthos and bottom sediment samples were collected using a Smith–Mclntyre Grab Sampler (ChemLab Co., Ltd., Incheon, South Korea) (0.1 m2) once in February and again in May 2011. The sampling area for each sample station was 0.2 m2. Macrobenthos were collected on-site using a 1 mm sieve, rinsed with seawater, and preserved using a 10% neutral formalin solution (Samchun Co., Ltd., Seoul, South Korea). In the laboratory, macrobenthos were identified to the species level using a microscope (Olympus SZX-10, Olympus Co. Ltd., Tokyo, Japan). During the collection of macrobenthic organisms, approximately 400 g of bottom sediment was also collected using a plastic spoon. These samples were preserved in an ice box at −20 °C and transported to the laboratory.
For chemical oxygen demand (COD) analysis, a 10 g sediment sample was made alkaline using excess KMNO4 (Samchun Co., Ltd., Seoul, South Korea), which was added and heated to 150 °C. Then, KI (potassium iodide) (Samchun Co., Ltd., Seoul, South Korea) and H2SO4 (Samchun Co., Ltd., Seoul, South Korea) were added, and the amount of oxygen was determined from the amount of iodine liberated by the KMNO4.
To determine the organic matter content (IL), a 30 g sample of dry sediment was heated at 550 °C for 2 h in a muffle furnace (HY-800, Hwa Sueng Ind Co. Ltd., Busan, South Korea). For the concentration measurements of cadmium (Cd), chromium (Cr), copper (Cu), lead (Pb), and zinc (Zn), 10 g of sediment sample was pulverised and fully digested in a mixture of HNO3/HF (8:1 v/v) (Samchun Co., Ltd., Seoul, South Korea). The digested samples were analysed using inductively coupled plasma mass spectrometry (ICP-MS, Elan 6100, PerkinElmer Inc., Waltham, MA, USA). For the concentrations of mercury (Hg) and arsenic (As), 1 g of sediment was leached with 50 mL of 1 M hydrochloric acid (HCl, Samchun Co., Ltd., Seoul, Korea), then reduced using a reduction vapour generation device and captured in a collection system. The analysis for mercury and arsenic was conducted using an atomic absorption spectrophotometer (PSA 10.055 Millennium Excalibur Satellite, PS Analytical Co., Ltd., Orpington, UK).
2.3. Heavy Metal Indices
The geochemical background values were confirmed by a previous study (As: 7.5 mg/kg; Cd: 0.131 mg/kg; Cr: 46.5 mg/kg; Cu: 14.9 mg/kg; Hg: 0.0147 mg/kg; Pb: 25 mg/kg; Zn: 71.3 mg/kg) [40]. The potential ecological risk coefficient for each heavy metal was determined by referencing the study by Hakanson (1980) [41]. The potential ecological risk coefficients of As, Cd, Cr, Cu, Hg, Pb, and Zn are 10, 30, 2, 5, 40, 5, and 1, respectively. The pollutant load index (PLI), Nemerow pollution index (Pn), and potential ecological risk index (RI) are widely used to evaluate the degree of heavy metal contamination in sediments [17]. The formulas and threshold values for the three heavy metal indices are provided in Table 1.
2.4. Biotic Indices
Four biotic indices (AMBI, BENTIX, H’, and M-AMBI) were selected based on distinct principles to assess ecological quality. These four indices are widely used to evaluate ecological quality [42,43]. The AZTI’s marine biotic index (AMBI) and BENTIX are based on the tolerance of macrobenthos to organic matter, classifying them into five or three ecological groups [44,45]. The Shannon diversity index (H’) is based on the abundance of macrobenthos [46]. Finally, the multivariate AMBI (M-AMBI) is based on the AZTI’s marine biotic index (AMBI), species abundance, and Shannon diversity index [47]. The formulas and threshold values for the four biotic indices are provided in Table 2.
The AMBI software version 6.0 (June 2022) was utilised to calculate AMBI and M-AMBI. The PRIMER software version 7.0.23 (Quest Research Ltd., Albany, New Zealand) was deployed for computing H’. The ecological group assignments for macrobenthic organisms were based on the AMBI software database. For species not present in the database, assignments were made by referencing the ecological groups of congeneric or confamilial species [48]. The ecological group classification for BENTIX was referenced from the ecological groups of AMBI (Table S1).

Table 2.
Algorithmic approaches to biotic indices and categorisation of ecological quality status (EcoQs) for biotic indices.
Table 2.
Algorithmic approaches to biotic indices and categorisation of ecological quality status (EcoQs) for biotic indices.
| Indices | Algorithm | Index Values | EcoQs | Reference | Note |
|---|---|---|---|---|---|
| AMBI | 0.0–1.2 | High | [45] | EGI: disturbance-sensitive species; EGII: disturbance-indifferent species; EGIII: disturbance-tolerant species; EGIV: second-order opportunistic species; EGV: first-order opportunistic species. | |
| 1.2–3.3 | Good | ||||
| 3.3–5.0 | Moderate | ||||
| 5.0–6.0 | Poor | ||||
| >6.0 | Bad | ||||
| BENTIX | 6–4.5 | High | [46] | GI=EGI+EGII; GII=EGIII+EGIV; GIII= EGV. | |
| 4.5–3.5 | Good | ||||
| 3.5–2.5 | Moderate | ||||
| 2.5–2.0 | Poor | ||||
| 0.0 | Bad | ||||
| H’(log2) | >4 | High | [49] | Ni: Number of individuals belonging to the ith species; N: total number of individuals. | |
| 4–3 | Good | ||||
| 3–2 | Moderate | ||||
| 2–1 | Poor | ||||
| <1 | Bad | ||||
| M-AMBI | >0.77 | High | [48] | H’: Shannon diversity index; S: number of species | |
| 0.53–0.77 | Good | ||||
| 0.38–0.53 | Moderate | ||||
| 0.20–0.38 | Poor | ||||
| ≤0.2 | Bad |
2.5. Data Analysis
Principal component analysis (PCA) was used to evaluate the primary environmental factors. This involved transforming the environmental factors using a log(x + 1) conversion and normalisation. Spearman’s rank correlation analysis was used to determine the correlations among indices and between indices and environmental factors. Kappa analysis was utilised to evaluate the consistency of indices in assessing ecological quality. The level of agreement in the kappa analysis was referenced from a previous study [50] (Table S2). Data analysis was conducted using PRIMER software version 7.0.23 (Quest Research Ltd., Albany, New Zealand) and SPSS Statistics 29.0 (SPSS Inc., Armonk, NY, USA).
The values of the indices were classified into acceptable and unacceptable to facilitate ecological quality assessment based on previous research [17,49] (Table 3). When the ecological quality was deemed adequate according to five out of seven indices, the final ecological quality was classified as acceptable. When the ecological quality of an index was considered acceptable, it was assigned a value of 1; if unacceptable, it was assigned a value of 0. The ecological quality assessment results from seven indices were combined, and Surfer version 14 (Golden software Inc., Golden, CO, USA) was used to create a spatial distribution map of the values of final ecological quality.
3. Results
3.1. The Environmental Characteristics of Study Areas
Among all the elements analysed, zinc exhibited the greatest observed concentrations, while mercury showed the lowest. The concentrations of heavy metals varied, with arsenic (As) ranging from 1.91 to 6.14 mg/kg, cadmium (Cd) from 0.04 to 0.33 mg/kg, chromium (Cr) from 8.71 to 66.98 mg/kg, copper (Cu) from 1.83 to 32.56 mg/kg, mercury (Hg) from 0.01 to 0.06 mg/kg, lead (Pb) from 9.79 to 32.27 mg/kg, and zinc (Zn) from 11.27 to 109.31 mg/kg (Table 4). At some stations (e.g., S1, S9, S10 and U10), ignition loss (IL) and chemical oxygen demand (COD) concentrations were high. The values of environmental factors at the sampling stations are shown in Table S3.
In the principal component analysis, the PC1 axis and PC2 axis accounted for 78.8% of the overall variation (Figure 2). The PC1 showed a negative correlation with all environmental factors. The PC2 showed a positive correlation with ignition loss (IL), chemical oxygen demand (COD), Cd (cadmium), Hg (mercury), and As (arsenic). The PC2 showed a negative correlation with Cr (chromium), Cu (cuprum), Pb (lead), and Zn (zinc) (Table S4). The eigenvalue for PC1 was 5.42, and for PC2, it was 1.67. The station (U9S, U10S, S10W, U2W, U6W, U7W, U8W, and U9W) located in the upper-left corner indicates a higher concentration of heavy metals (Figure 2).
3.2. Macrobenthos Composition
A total of 206 species of macrobenthos were identified in the study area. The most prominent taxa were Annelida with 80 species (38.8%), followed by Mollusca with 59 species (28.6%), Arthropoda with 49 species (23.8%), Echinodermata with 13 species (6.3%), and 5 other species of animal (2.4%). The number of species in Samcheok County and Uljin County in winter and spring are shown in Figure 3.
3.3. Results of Heavy Metal Indices
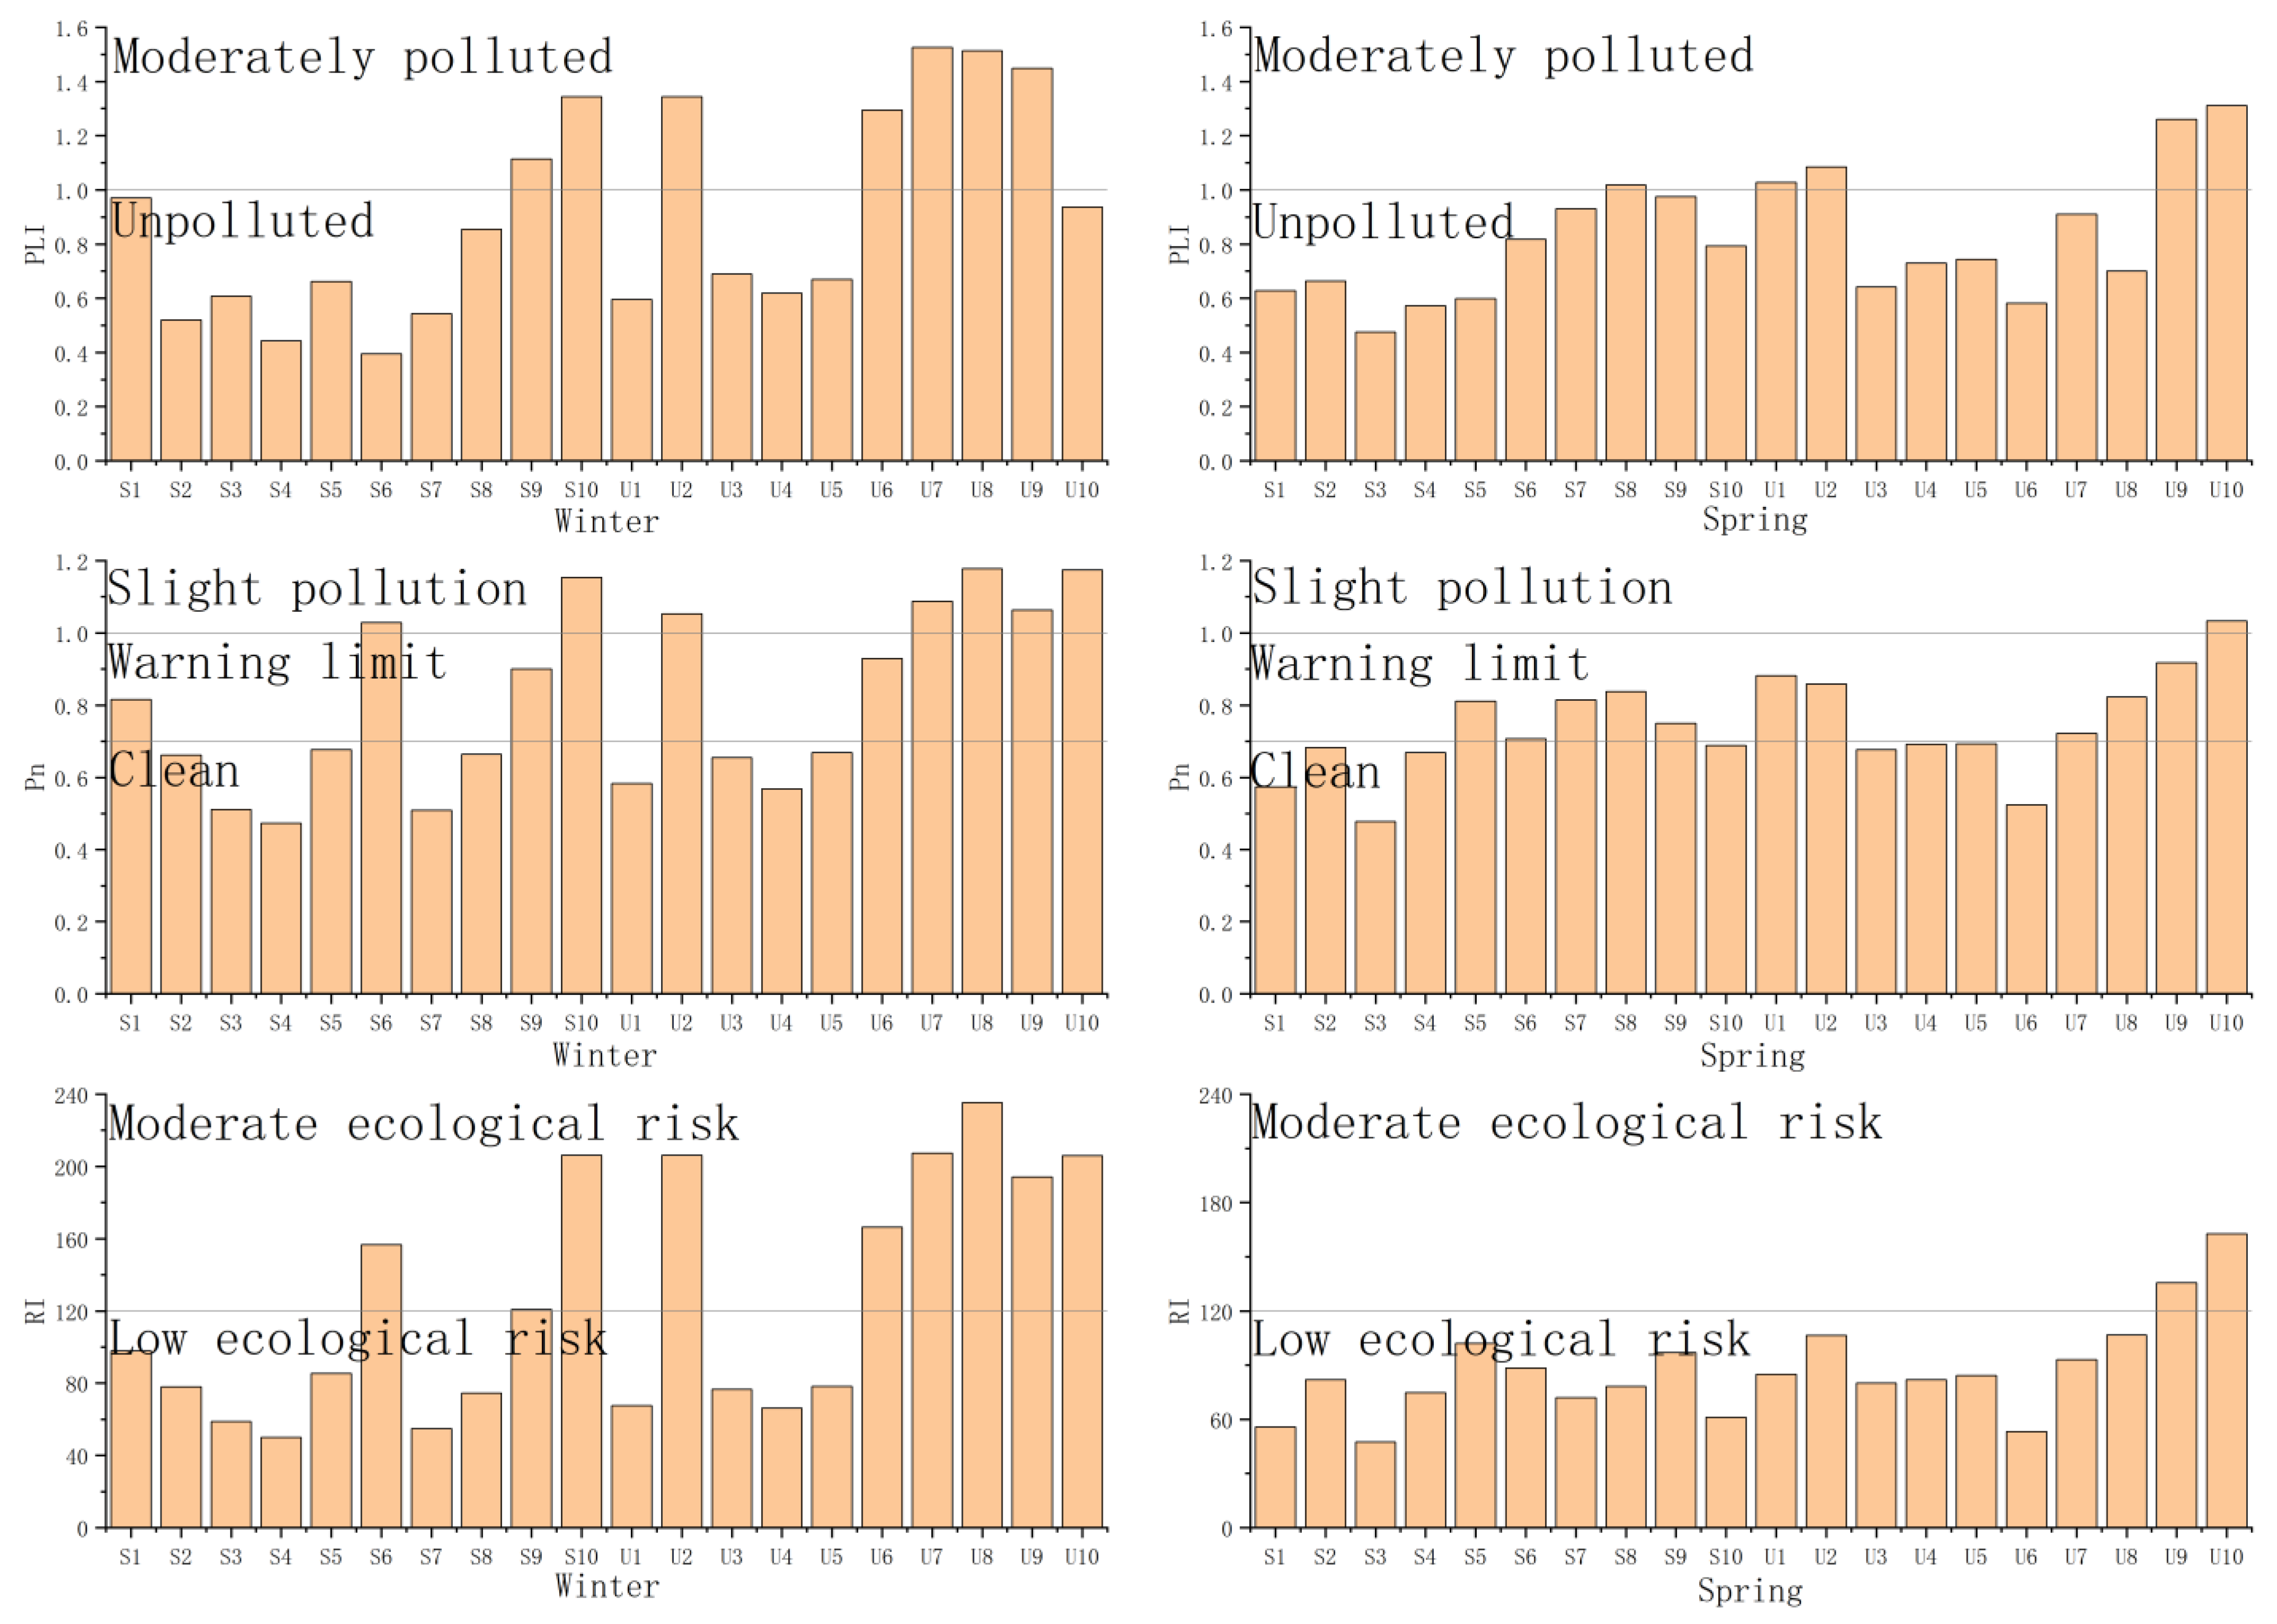
The pollutant load index (PLI) values ranged from 0.4 to 1.53, with an average value of 0.78 ± 0.32. Based on this range, the level of pollution at thirteen stations was categorised as unpolluted, and seven stations were moderately polluted in winter. The ecological quality was assessed as acceptable at thirteen stations and unacceptable at seven stations in winter. In spring, the level of pollution at fifteen stations was categorised as unpolluted and five stations as moderately polluted. The ecological quality was assessed as acceptable at fifteen stations and unacceptable at five stations in spring (Figure 4 and Figure 5).
The Nemerow pollution index (Pn) values ranged from 0.47 to 1.18, with an average value of 0.86 ± 0.2. Based on this range, ten stations were categorised as clean, seven stations as the warning limit, and three stations as slightly polluted in winter. The ecological quality was assessed as acceptable at seventeen stations and unacceptable at three stations in winter. In spring, nine stations were categorised as clean, ten stations as the warning limit, and one station as slightly polluted. The ecological quality was assessed as acceptable at nineteen stations and unacceptable at one station in spring (Figure 4 and Figure 5).
The potential ecological risk Index (RI) values ranged from 47.45 to 235.28, averaging 105.88 ± 52.45. Based on this range, eleven stations were categorised as low ecological risk and nine stations as moderate ecological risk in winter. The ecological quality was assessed as acceptable at eleven stations and unacceptable at nine stations in winter. In spring, nine stations were categorised as clean, eighteen stations as the warning limit, and two stations as slightly polluted. The ecological quality was assessed as acceptable at eighteen stations and unacceptable at two stations in spring (Figure 4 and Figure 5).
3.4. Results of Biotic Indices
The AZTI’s marine biotic index (AMBI) values ranged from 0.71 to 2.78, averaging 1.75 ± 0.49. Based on this range, the EcoQs at five stations was categorised as high and fifteen stations as good in winter. The ecological quality was assessed as acceptable at 20 stations in winter. In spring, the ecological quality status at one station was categorised as high, and nineteen stations were categorised as good. The ecological quality was assessed as acceptable at 20 stations in spring (Figure 5 and Figure 6).
The BENTIX values ranged from 3.12 to 5.87, with an average value of 4.7 ± 0.66. Based on this range, the EcoQs at thirteen stations was categorised as high, six stations as good, and one station as moderate in winter. The ecological quality was assessed as acceptable at nineteen stations and unacceptable at one station in winter. In spring, the ecological quality status at twelve stations was categorised as high, seven stations as good, and one station as moderate. The ecological quality was assessed as acceptable at nineteen stations and unacceptable at one station in spring (Figure 5 and Figure 6).
The Shannon diversity index (H’) values ranged from 2.19 to 4.66, averaging 3.56 ± 0.67. Based on this range, the EcoQs at three stations was categorised as high, eight stations as good, and nine stations as moderate in winter. The ecological quality was assessed as acceptable at eleven stations and unacceptable at nine stations in winter. In spring, the ecological quality status at seven stations was categorised as high, twelve stations as good, and one station as moderate. The ecological quality was assessed as acceptable at nineteen stations and unacceptable at one station in spring (Figure 5 and Figure 6).
The multivariate AMBI (M-AMBI) values ranged from 0.49 to 0.8, with an average value of 0.66 ± 0.07. Based on this range, the EcoQs at one station was categorised as high, seventeen stations as good, and two stations as moderate in winter. The ecological quality was assessed as acceptable at eighteen stations and unacceptable at two stations in winter. In spring, the ecological quality status at one station was categorised as high, and nineteen stations were categorised as good. The ecological quality was acceptable at 20 stations (Figure 5 and Figure 6).
3.5. Final Ecological Quality in the Central Area of the East Sea
The final ecological quality was calculated by combining the results of seven indices (PLI, Pn, RI, AMBI, BENTIX, H’, and M-AMBI). In Samcheok County, the final ecological quality was unacceptable only in winter at station 10; in spring, the final ecological quality was acceptable at each station. In Uljin County, the final ecological quality was unacceptable in winter at station 3, station 7, station 8, and station 9; in spring, the final ecological quality was unacceptable at station 10. Overall, the final ecological quality along the coast of Uljin County is the poorest during the winter, and Samcheok Count’s coastal ecological quality is the best during the spring (Figure 7).
3.6. Results of Correlation Analysis and Kappa Analysis
The indices H’ and M-AMBI demonstrated a positive correlation in Spearman’s correlation analysis. In contrast, AMBI showed a negative correlation with BENTIX. The pollution load index (PLI) was positively correlated with both Pn and RI. Additionally, a positive correlation was observed between Pn and RI. Concerning environmental factors, H’ exhibited positive correlations with the concentrations of chromium (Cr), zinc (Zn), and copper (Cu). M-AMBI also positively correlated with chromium (Cr) (Figure 8).
In the kappa analysis, Pn and RI showed the highest kappa value, 0.795, and the level of agreement was very good. However, RI and H’ showed the lowest kappa value, which was –0.097, and the level of agreement was very poor. Compared to biotic indices, the final ecological quality and heavy metal indices exhibited higher kappa values (Table S5).
4. Discussion
4.1. The Concentration of Heavy Metals
The concentrations of heavy metals measured in this study all fell below the effects range low (ERL) threshold [51] (Table S6). Compared to Woo et al.’s 2016 study, the concentrations of some heavy metals (As, Cd, Cr, Pb, and Zn) in the study area are lower than the average levels along the coast of South Korea [40]. Compared with the highly urbanised Shenzhen Bay, the average concentration of heavy metals in the study area is lower [52] (Table S6). Although the most of heavy metal concentrations in the study area are not high. Notably, the mercury concentrations at certain stations exceed the geochemical background values (Table S3). Mercury (Hg) is a worldwide contaminant impacting the health of humans and ecosystems [53]. Moreover, due to its persistence and bioaccumulation characteristics, mercury can accumulate and amplify through the food chain in aquatic ecosystems, presenting enduring risks to ecological and human health [54,55]. Consequently, future research should focus on pinpointing the sources of mercury contamination in the central East Sea of South Korea to mitigate these risks effectively.
4.2. The EcoQs of Heavy Metal and Biotic Indices
In winter, the percentages of unacceptable ecological quality for the three heavy metal indices (RI, PLI, and Pn) regarding ecological quality ranged between 35% and 45%. However, these percentages decreased significantly in the spring, from 5% to 20% (Figure 5). This suggests that the concentration of heavy metals in the study area decreases in spring compared to winter. Although the sources of heavy metals are diverse (e.g., atmospheric deposition, agricultural runoff, and wastewater effluents) [56,57,58], the majority of studies suggest that short-term variations in heavy metal concentrations are associated with human activities [59,60]. Future research should elucidate the relationship between metal concentrations and various human activities in the central East Sea of South Korea.
Geochemical background values play a pivotal role in the computation of three significant heavy metal indices, which are directly linked to the precision of assessment outcomes [61]. Creating a standardised database or a uniform methodology for determining these background values is critical. Such standardisation would bolster the credibility of the assessment results and facilitate improved consistency and comparability across diverse studies.
For the four biological indices (AMBI, BENTIX, H’, and M-AMBI) used to assess ecological quality, the percentage of unacceptable ratings varied from 0% to 40% during the winter. In spring, these percentages ranged between 0% and 5% (Figure 8). This tendency is analogous to the evaluation of ecological quality by heavy metal indices, indicating that the ecological quality in spring is superior to that in winter.
Compared to other biotic indices, H’ appeared to underestimate the ecological quality of the central East Sea in winter. For example, only H’ assessed the ecological quality as unacceptable at S7 in winter—the predominance of Aricidea spp., comprising over 50% of the total individuals, could be the reason for the underestimation of ecological quality by H’. We believe it is necessary to calibrate the thresholds before employing H’ [49]. Furthermore, in most stations, EG1 and EGII are the main components of the macrobenthic community. AMBI may overestimate the ecological quality of the East Sea in South Korea [62].
4.3. Statistical Analysis
Three heavy metal indices were significantly correlated in both correlation and kappa analyses and exhibited high kappa values (0.47–0.8). This suggests that using a single heavy metal index appears to be feasible in the central East Sea, South Korea. However, Dong et al. (2023) noted that employing any of the three heavy metal indices presented challenges when accurately assessing heavy metal contamination in Laoshan Bay [17]. The calculation methods and principles of these three indices differ [63], which leads to variations in their correlations and the consistency of evaluation results across different regions. For example, the Pn index considers the highest ratio of heavy metal content in sediments against geochemical background values. In contrast, the RI accounts for the potential ecological risk of heavy metals.
Among the four biotic indices studied, only AMBI and BENTIX and M-AMBI and demonstrated significant correlations, while kappa values for these indices were low, ranging from −0.053 to 0.405. This suggests that employing a single biological index poses challenges in accurately assessing the ecological quality of the central East Sea in South Korea. Consistent with this finding, additional research underscores the difficulty of precisely evaluating ecological quality using a single biotic index. Examples include studies conducted in the estuary on the southwest coast of India and the coastal waters of Sanshandao in Laizhou Bay, China [10,64].
The AMBI and BENTIX did not exhibit a significant correlation with environmental variables. BENTIX’s allocation of ecological groups is based on the ecological categories defined by AMBI, which were initially designed for the coastal waters of the European Union. However, the classification of the same species into ecological groups can differ across various geographic areas [65]. This may have led to AMBI and BENTIX not responding to environmental factors. In addition, the BENTIX was developed for the Mediterranean ecoregion, which is characterised by its highly diverse and evenly distributed benthic fauna, with no single species naturally dominating by more than 10% [66]. In our study, the abundance of Spiophanes bombyx individuals exceeds 10%. The BENTIX may not be suitable for assessing the ecological quality of the East Sea in South Korea.
H’ was significantly correlated with Cr, Cu, and Zn. In the study by Wu et al. in 2022, it also responded only to heavy metals [67]. M-AMBI was only significantly correlated with Cr. M-AMBI calculation requires setting reference conditions, and inappropriate settings can affect M-AMB’s accuracy [68]. In addition, the grouping of ecological communities also affects the accuracy of the M-AMBI.
In this study, the observed positive correlation between H’ and heavy metals was perplexing, as it is generally expected that higher concentrations of metals typically reduce macrobenthic community diversity [69]. Moreover, the mechanisms by which metal contaminants harm organisms often differ from those associated with organic pollution [70]. The effects of metal-induced mechanisms on organisms are usually only observable in the broader biological strata of populations or communities in subsequent generations or subpopulations of the affected species after extended periods of exposure [71]. In correlation analysis, all heavy metals (As, Cd, Cr, Cu, Hg, Pb, and Zn) showed a positive correlation with IL (ignition loss) and COD (chemical oxygen demand), suggesting that these heavy metals are present in sediments primarily bound to organic matter. In the study area, the forms of heavy metals may exist as either an “organically bound state” or “complexed form”. Metals’ toxicity towards organisms differs based on their form [72,73]. For example, copper’s ionic state (Cu2+) exhibits the strongest toxicity to organisms [74]. This raises the possibility that the correlation between H’ and heavy metals might be incidental, with areas of higher metal concentrations coincidentally showing more biodiversity. This highlights the need for long-term studies to further explore the impacts of heavy metals on the macrobenthic communities in the central East Sea of South Korea.
Overall, given the complexity of marine environments, it is necessary to thoroughly consider local ecological characteristics and the principles of the indices before using a biotic index. For example, for the AMBI, the accurate grouping of ecological groups is crucial for precisely assessing ecological quality; for M-AMBI, setting reference conditions is also vital.
4.4. Final Ecological Quality in the East Sea of South Korea
Our combined evaluation results from seven indices indicate that the final ecological quality in winter and spring is acceptable (75–100%). In kappa analysis, the final ecological quality exhibited a high level of agreement with the heavy metal indices (Good–Very Good). Moreover, the stations on the upper left predominantly show unacceptable final ecological quality. This indicated that the content of heavy metals primarily influences the stations with unacceptable final ecological quality.
In winter, the mercury (Hg) content in stations S10, U6, U7, U8, and U9 is several times higher than the geochemical background values. This is the primary reason for the unacceptable final ecological quality at these stations. Mining is one of the primary sources of heavy metal pollution in the environment, with a notably significant impact [75,76,77]. In the study area, mining activities upstream of the Wangpi River are likely the main reason for the elevated mercury (Hg) concentrations observed on the Uljin coast. The mining processes, including ore extraction and processing, reveal heavy-metal-laden dust and wastewater, which are transported by water flows and ultimately deposited in marine sediments. Urban areas are also significant sources of mercury (Hg) pollution [78,79]. Future research is essential to pinpoint the specific sources of mercury in the Central Area of the East Sea, South Korea, and assess the impact of human activities on its environmental levels.
5. Conclusions
Human activities have extensively impacted South Korea’s coast. Notably, compared to the West and South Seas, the ecological quality of the central East Sea in South Korea remains relatively understudied. Given this context, conducting a comprehensive exploration of the ecological quality in the central East Sea of South Korea is imperative. We assessed the heavy metal content in the central East Sea of South Korea and evaluated the ecological quality using three heavy metal indices and four biotic indices. Based on our analysis, we reached the following conclusions:
- (1)
- The heavy metal concentrations in the study area were all below the effects range low (ERL) thresholds. However, some sampling stations’ mercury (Hg) levels were several times higher than the geochemical background values.
- (2)
- The results from the three heavy metal indices suggest that the ecological threat posed by heavy metals in the study area is higher in winter than in summer. Additionally, correlation and kappa analyses supported the feasibility of using a single heavy metal index to assess the ecological status of the central East Sea region.
- (3)
- Although the AMBI, BENTIX, and M-AMBI indicated that the ecological quality at most sampling stations was acceptable, their responses to environmental factors were weak. Further analysis using correlation and kappa tests revealed that a single biotic index does not suffice for an accurate ecological assessment of the East Sea. Specifically, the BENTIX may not be suitable for this region.
- (4)
- The comprehensive assessment using seven indices indicates that the final ecological quality at most sampling stations within the study area is acceptable. Principal component analysis supports the finding that stations with unacceptable final ecological quality are associated with high heavy metal content. Consequently, future research must investigate the sources of heavy metals and the impact of human activities on the concentration of heavy metals in the central East Sea of South Korea.
Supplementary Materials
The following supporting information can be downloaded at: https://0-www-mdpi-com.brum.beds.ac.uk/article/10.3390/w16091230/s1. Table S1: Categorisation of macrobenthos into ecological groups using the AMBI and BENTIX; Table S2: The threshold for kappa value; Table S3: The values of environmental factors at the sampling stations; Table S4: The eigenvectors of environmental factors with PC1 and PC2; Table S5: The results of kappa analysis; Table S6: The concentrations of heavy metals along the South Korean coast, Shenzhen Bay, and effects range low (ERL) values.
Author Contributions
Conceptualisation, J.L.; methodology, J.L.; software, J.L.; validation, J.L.; formal analysis, J.L.; investigation, D.-S.S.; resources, C.-W.M.; data curation, D.-S.S.; writing—original draft preparation, J.L.; writing—review and editing, C.-W.M.; visualisation, J.L.; supervision, C.-W.M.; project administration, C.-W.M.; funding acquisition, C.-W.M. All authors have read and agreed to the published version of the manuscript.
Funding
This work was supported by the Soonchunhyang University Research Fund.
Data Availability Statement
Data will be made available on request.
Conflicts of Interest
Dae-Sun Son was employed by the Haerang Technology and Policy Research Institute. The remaining authors declare that the research was conducted in the absence of any commercial or financial relationships that could be construed as a potential conflict of interest.
References
- Crain, C.M.; Halpern, B.S.; Beck, M.W.; Kappel, C.V. Understanding and Managing Human Threats to the Coastal Marine Environment. Ann. N. Y. Acad. Sci. 2009, 1162, 39–62. [Google Scholar] [CrossRef] [PubMed]
- Martínez, M.L.; Intralawan, A.; Vázquez, G.; Pérez-Maqueo, O.; Sutton, P.; Landgrave, R. The Coasts of Our World: Ecological, Economic and Social Importance. Ecol. Econ. 2007, 63, 254–272. [Google Scholar] [CrossRef]
- Zhai, T.; Wang, J.; Fang, Y.; Qin, Y.; Huang, L.; Chen, Y. Assessing Ecological Risks Caused by Human Activities in Rapid Urbanization Coastal Areas: Towards an Integrated Approach to Determining Key Areas of Terrestrial-Oceanic Ecosystems Preservation and Restoration. Sci. Total Environ. 2020, 708, 135153. [Google Scholar] [CrossRef] [PubMed]
- Borja, A.; Bricker, S.B.; Dauer, D.M.; Demetriades, N.T.; Ferreira, J.G.; Forbes, A.T.; Hutchings, P.; Jia, X.; Kenchington, R.; Marques, J.C.; et al. Overview of Integrative Tools and Methods in Assessing Ecological Integrity in Estuarine and Coastal Systems Worldwide. Mar. Pollut. Bull. 2008, 56, 1519–1537. [Google Scholar] [CrossRef] [PubMed]
- Borja, A.; Dauer, D.M. Assessing the Environmental Quality Status in Estuarine and Coastal Systems: Comparing Methodologies and Indices. Ecol. Indic. 2008, 8, 331–337. [Google Scholar] [CrossRef]
- Pinto, R.; Patrício, J.; Baeta, A.; Fath, B.D.; Neto, J.M.; Marques, J.C. Review and Evaluation of Estuarine Biotic Indices to Assess Benthic Condition. Ecol. Indic. 2009, 9, 1–25. [Google Scholar] [CrossRef]
- Borja, Á.; Marín, S.L.; Muxika, I.; Pino, L.; Rodríguez, J.G. Is There a Possibility of Ranking Benthic Quality Assessment Indices to Select the Most Responsive to Different Human Pressures? Mar. Pollut. Bull. 2015, 97, 85–94. [Google Scholar] [CrossRef] [PubMed]
- Asl, A.G.; Nabavi, S.M.B.; Rouzbahani, M.M.; Alipour, S.S.; Monavari, S.M. Ecological Quality Status of Stressed Coastal Benthic Ecosystems in Nayband Bay from the Northern Persian Gulf, Iran Using AMBI, M-AMBI, Bentix, and H’ Indices. J. Wildl. Biodivers. 2022, 8, 279–297. [Google Scholar] [CrossRef]
- Caglar, S.; Albayrak, S. Assessment of Ecological Quality Status of Küçükçekmece Bay (Marmara Sea) by Applying BENTIX, AMBI, BOPA and BO2A Biotic Indexes. Medit. Mar. Sci. 2012, 13, 198. [Google Scholar] [CrossRef]
- Dong, J.-Y.; Sun, X.; Zhang, Y.; Zhan, Q.; Zhang, X. Assessing Benthic Habitat Ecological Quality Using Four Benthic Indices in the Coastal Waters of Sanshandao, Laizhou Bay, China. Ecol. Indic. 2021, 129, 107980. [Google Scholar] [CrossRef]
- Magni, P.; Vesal, S.E.; Giampaoletti, J.; Como, S.; Gravina, M.F. Joint Use of Biological Traits, Diversity and Biotic Indices to Assess the Ecological Quality Status of a Mediterranean Transitional System. Ecol. Indic. 2023, 147, 109939. [Google Scholar] [CrossRef]
- Wang, L.; Luo, X.; Yang, J.; Zhang, J.; Fan, Y.; Shen, J. Assessing Benthic Habitat Quality Using Biotic Indices in the Laizhou Bay, China. Acta Oceanol. Sin. 2020, 39, 49–58. [Google Scholar] [CrossRef]
- Sule, A.Y.; Yakub, A.S.; Nubi, A.O.; Bassey, B.O.; Mahu, E.; Igbo, J.K.; Bello, B.O.; Sohou, Z.; Abiodun, O.A.; Olapoju, O.A.; et al. Assessment of Ecological Quality Status of Western Nigeria Offshore Waters (Gulf of Guinea) Using Macrobenthic Assemblage. Thalass. Int. J. Mar. Sci. 2024, 40, 639–651. [Google Scholar] [CrossRef]
- Yan, J.; Sui, J.; Xu, Y.; Li, X.; Wang, H.; Zhang, B. Assessment of the Benthic Ecological Status in Adjacent Areas of the Yangtze River Estuary, China, Using AMBI, M-AMBI and BOPA Biotic Indices. Mar. Pollut. Bull. 2020, 153, 111020. [Google Scholar] [CrossRef]
- Lu, X.; Xu, J.; Xu, Z.; Liu, X. Assessment of Benthic Ecological Quality Status Using Multi-Biotic Indices Based on Macrofaunal Assemblages in a Semi-Enclosed Bay. Front. Mar. Sci. 2021, 8, 734710. [Google Scholar] [CrossRef]
- Mulik, J.; Sukumaran, S.; Dias, H.Q. Can the Ecological Status of Three Differentially Impacted Monsoonal Tropical Estuaries in NW India, Be Adequately Assessed by a Common Estuarine Benthic Index? Ecol. Indic. 2020, 119, 106807. [Google Scholar] [CrossRef]
- Dong, J.-Y.; Wang, X.; Zhang, X.; Bidegain, G.; Zhao, L. Integrating Multiple Indices Based on Heavy Metals and Macrobenthos to Evaluate the Benthic Ecological Quality Status of Laoshan Bay, Shandong Peninsula, China. Ecol. Indic. 2023, 153, 110367. [Google Scholar] [CrossRef]
- Zaib, M.; Zeeshan, A.; Hameed, S.; Wakeel, A.; Qasim, S.; Aslam, S. Soil Contamination and Human Health: Exploring the Heavy Metal Landscape: A Comprehensive Review. J. Health Rehabil. 2023, 3, 351–356. [Google Scholar] [CrossRef]
- Sharifuzzaman, S.M.; Rahman, H.; Ashekuzzaman, S.M.; Islam, M.M.; Chowdhury, S.R.; Hossain, M.S. Heavy Metals Accumulation in Coastal Sediments. In Environmental Remediation Technologies for Metal-Contaminated Soils; Hasegawa, H., Rahman, I.M.M., Rahman, M.A., Eds.; Springer: Tokyo, Japan, 2016; pp. 21–42. ISBN 978-4-431-55758-6. [Google Scholar]
- Zaynab, M.; Al-Yahyai, R.; Ameen, A.; Sharif, Y.; Ali, L.; Fatima, M.; Khan, K.A.; Li, S. Health and Environmental Effects of Heavy Metals. J. King Saud. Univ. Sci. 2022, 34, 101653. [Google Scholar] [CrossRef]
- Eto, K. Minamata Disease. Neuropathology. 2000, 20, 14–19. [Google Scholar] [CrossRef]
- Funabashi, H. Minamata Disease and Environmental Governance. Int. J. Jpn. Sociol. 2006, 15, 7–25. [Google Scholar] [CrossRef]
- Li, C.; Wang, H.; Liao, X.; Xiao, R.; Liu, K.; Bai, J.; Li, B.; He, Q. Heavy Metal Pollution in Coastal Wetlands: A Systematic Review of Studies Globally over the Past Three Decades. J. Hazard. Mater. 2022, 424, 127312. [Google Scholar] [CrossRef]
- Häder, D.-P.; Banaszak, A.T.; Villafañe, V.E.; Narvarte, M.A.; González, R.A.; Helbling, E.W. Anthropogenic Pollution of Aquatic Ecosystems: Emerging Problems with Global Implications. Sci. Total Environ. 2020, 713, 136586. [Google Scholar] [CrossRef]
- Kowalska, J.B.; Mazurek, R.; Gąsiorek, M.; Zaleski, T. Pollution Indices as Useful Tools for the Comprehensive Evaluation of the Degree of Soil Contamination–A Review. Environ. Geochem. Health. 2018, 40, 2395–2420. [Google Scholar] [CrossRef]
- Zhao, L.; Wang, Z.; Kong, L.; Zhao, Z.; Geng, B.; Gu, S.; Li, Y.; Han, X.; Liu, S.; Li, B.; et al. Risk Assessment of Soil Heavy Metals in Mining Activity Areas: A Case Study in Eastern Shandong Province, China. Environ. Earth. Sci. 2023, 82, 513. [Google Scholar] [CrossRef]
- Jannat, J.N.; Mia, M.Y.; Jion, M.M.; Islam, M.S.; Ali, M.M.; Siddique, M.A.; Rakib, M.R.; Ibrahim, S.M.; Pal, S.C.; Costache, R.; et al. Pollution Trends and Ecological Risks of Heavy Metal(Loid)s in Coastal Zones of Bangladesh: A Chemometric Review. Mar. Pollut. Bull. 2023, 191, 114960. [Google Scholar] [CrossRef]
- Kim, K.-B.; Jung, Y.-J.; Oh, J.-K.; Kang, H.; Son, D.-S.; Ma, C.-W. Macrobenthic Community and Benthic Health Assessment of Central Area in Asan Bay. J. Korean Soc. Fish. Mar. Edu. 2021, 33, 903–917. [Google Scholar] [CrossRef]
- Marine Environment Research Division, National Institute of Fisheries Science; Jung, R.H.; Seo, I.-S.; Choi, B.-M.; Choi, M.; Yoon, S.-P.; Park, S.R.; Na, J.H.; Yun, J.S. Community Structure and Health Assessment of Macrobenthic Assemblages at Spring and Summer in Geoje-Hansan Bay, Southern Coast of Korea. J. Korean Soc. Mar. Environ. Saf. 2016, 22, 27–41. [Google Scholar] [CrossRef]
- Oh, S.H.; Choi, J.H.; Son, D.S.; Ma, C.W. Macrobenthos Community on the Intertidal at Garolim Bay in Summer. J. Environ. Biol. 2019, 40, 896–907. [Google Scholar] [CrossRef]
- Youn, S.H.; Lee, J.W.; Oh, C.W.; Choi, B.M.; Yoon, K.T.; Na, J.H.; Seo, I.S. Community Structure and Health Status of Macrobenthic Animals in the Nakdong River Estuary, Busan, Korea. Ocean Polar Res. 2021, 43, 73–88. [Google Scholar] [CrossRef]
- Park, S.W.; Shin, H.C. Community Structure of Macrobenthic Polychaetes and Its Health Assessment in Ulsan Coastal Area of Korea During 2010s. J. Korean Soc. Mar. Environ. Energy 2022, 25, 41–52. [Google Scholar] [CrossRef]
- Ryu, J.; Hong, S.; Chang, W.K.; Khim, J.S. Performance Evaluation and Validation of Ecological Indices toward Site-Specific Application for Varying Benthic Conditions in Korean Coasts. Sci. Total Environ. 2016, 541, 1161–1171. [Google Scholar] [CrossRef] [PubMed]
- Park, S.; Kim, G.; Kwon, H.K.; Han, I.-S. Long-Term Changes in the Concentrations of Nutrients in the Marginal Seas (Yellow Sea, East China Sea, and East/Japan Sea) Neighboring the Korean Peninsula. Mar. Pollut. Bull. 2023, 192, 115012. [Google Scholar] [CrossRef] [PubMed]
- Lee, J.; Kim, B.; Noh, J.; Lee, C.; Kwon, I.; Kwon, B.-O.; Ryu, J.; Park, J.; Hong, S.; Lee, S.; et al. The First National Scale Evaluation of Organic Carbon Stocks and Sequestration Rates of Coastal Sediments along the West Sea, South Sea, and East Sea of South Korea. Sci. Total Environ. 2021, 793, 148568. [Google Scholar] [CrossRef] [PubMed]
- Seong Khim, J.; Lee, C.; Joon Song, S.; Bae, H.; Noh, J.; Lee, J.; Kim, H.-G.; Choi, J.-W. Marine Biodiversity in Korea: A Review of Macrozoobenthic Assemblages, Their Distributions, and Long-Term Community Changes from Human Impacts. In Oceanography and Marine Biology; CRC Press: Boca Raton, FL, USA, 2021; pp. 483–532. ISBN 978-1-00-313884-6. [Google Scholar]
- Barale, V. The Asian Marginal and Enclosed Seas: An Overview. In Remote Sensing of the Asian Seas; Barale, V., Gade, M., Eds.; Springer International Publishing: Cham, Switzerland, 2019; pp. 3–38. ISBN 978-3-319-94065-6. [Google Scholar]
- Bok, Y.-W. Community Structure of a Macrobenthos in the Central Area of the East Sea, South Korea. Master’s Thesis, Soonchunhyang University, Asan, Republic of Korea, 2017. [Google Scholar]
- KORDI (Korea Ocean Research and Development Institute). Feasibility Studieson Yhemarrineranching Program of East, West and Costal Areas in Korea; KORDI: Ansan, Republic of Korea, 2003. [Google Scholar]
- Woo, J.; Lee, H.; Park, J.; Park, K.; Cho, D.; Jang, D.; Park, S.; Choi, M.; Yoo, J. Background Concentration and Contamination Assessment of Heavy Metals in Korean Coastal Sediments. Sea J. Korean Soc. Oceanogr. 2019, 24, 64–78. [Google Scholar] [CrossRef]
- Hakanson, L. An Ecological Risk Index for Aquatic Pollution Control.a Sedimentological Approach. Water Res. 1980, 14, 975–1001. [Google Scholar] [CrossRef]
- Simonini, R.; Grandi, V.; Massamba-N’Siala, G.; Iotti, M.; Montanari, G.; Prevedelli, D. Assessing the Ecological Status of the North-western Adriatic Sea within the European Water Framework Directive: A Comparison of Bentix, AMBI and M-AMBI Methods. Mar. Ecol. 2009, 30, 241–254. [Google Scholar] [CrossRef]
- Song, C.; Yan, R.; Jiang, M.; Peng, R.; Han, Q. Testing the Applicability of Marine Biotic Indices for Ecological Quality in the Northern East China Sea. J. Sea Res. 2023, 195, 102441. [Google Scholar] [CrossRef]
- Borja, A.; Franco, J.; Pérez, V. A Marine Biotic Index to Establish the Ecological Quality of Soft-Bottom Benthos within European Estuarine and Coastal Environments. Mar. Pollut. Bull. 2000, 40, 1100–1114. [Google Scholar] [CrossRef]
- Simboura, N.; Zenetos, A. Benthic Indicators to Use in Ecological Quality Classification of Mediterranean Soft Bottom Marine Ecosystems, Including a New Biotic Index. Medit. Mar. Sci. 2002, 3, 77. [Google Scholar] [CrossRef]
- Shannon, C.E.; Weaver, W. The Mathematical Theory of Communication, 1st ed.; The University of Illinois Press: Urbana, IL, USA, 1964; pp. 1–131. [Google Scholar]
- Muxika, I.; Borja, Á.; Bald, J. Using Historical Data, Expert Judgement and Multivariate Analysis in Assessing Reference Conditions and Benthic Ecological Status, According to the European Water Framework Directive. Mar. Pollut. Bull. 2007, 55, 16–29. [Google Scholar] [CrossRef]
- Borja, A.; Tunberg, B.G. Assessing Benthic Health in Stressed Subtropical Estuaries, Eastern Florida, USA Using AMBI and M-AMBI. Ecol. Indic. 2011, 11, 295–303. [Google Scholar] [CrossRef]
- Liang, J.; Ma, C.-W.; Kim, S.-K.; Park, S.-H. Assessing the Benthic Ecological Quality in the Intertidal Zone of Cheonsu Bay, Korea, Using Multiple Biotic Indices. Water 2024, 16, 272. [Google Scholar] [CrossRef]
- Monserud, R.A.; Leemans, R. Comparing Global Vegetation Maps with the Kappa Statistic. Ecol. Model. 1992, 62, 275–293. [Google Scholar] [CrossRef]
- Buchman, M.F. (Ed.) NOAA Screening Quick Reference Tables; NOAA: Washington, DC, USA, 2008. Available online: https://repository.library.noaa.gov/view/noaa/9327 (accessed on 1 January 2024).
- Huang, F.; Xu, Y.; Tan, Z.; Wu, Z.; Xu, H.; Shen, L.; Xu, X.; Han, Q.; Guo, H.; Hu, Z. Assessment of Pollutions and Identification of Sources of Heavy Metals in Sediments from West Coast of Shenzhen, China. Environ. Sci. Pollut. Res. 2018, 25, 3647–3656. [Google Scholar] [CrossRef]
- Ha, E.; Basu, N.; Bose-O’Reilly, S.; Dórea, J.G.; McSorley, E.; Sakamoto, M.; Chan, H.M. Current Progress on Understanding the Impact of Mercury on Human Health. Environ. Res. 2017, 152, 419–433. [Google Scholar] [CrossRef] [PubMed]
- Mishra, R.K.; Sharma, V. Biotic Strategies for Toxic Heavy Metal Decontamination. Recent Pat. Biotechnol. 2017, 11, 218–228. [Google Scholar] [CrossRef] [PubMed]
- Methylmercury; Programme International sur la Sécurité des Substances Chimiques (Eds.) Environmental Health Criteria; World Health Organization: Geneva, Switzerland, 1990; ISBN 978-92-4-157101-2. [Google Scholar]
- Wong, C.S.C.; Li, X.D.; Zhang, G.; Qi, S.H.; Peng, X.Z. Atmospheric Deposition of Heavy Metals in the Pearl River Delta, China. Atmos. Environ. 2003, 37, 767–776. [Google Scholar] [CrossRef]
- Elrashidi, M.A.; Hammer, D.; Fares, A.; Seybold, C.A.; Ferguson, R.; Peaslee, S.D. Loss of Heavy Metals by Runoff from Agricultural Watersheds. Soil Sci. 2007, 172, 876–894. [Google Scholar] [CrossRef]
- Akpor, O.B. Heavy Metal Pollutants in Wastewater Effluents: Sources, Effects and Remediation. Adv. Biosci. Bioeng. 2014, 2, 37. [Google Scholar] [CrossRef]
- Tian, X.; Xie, Q.; Fan, M.; Chai, G.; Li, G. Identification of Heavy Metal Pollutants and Their Sources in Farmland: An Integrated Approach of Risk Assessment and X-Ray Fluorescence Spectrometry. Sci. Rep. 2022, 12, 12196. [Google Scholar] [CrossRef] [PubMed]
- Wang, S.; Cai, L.-M.; Wen, H.-H.; Luo, J.; Wang, Q.-S.; Liu, X. Spatial Distribution and Source Apportionment of Heavy Metals in Soil from a Typical County-Level City of Guangdong Province, China. Sci. Total Environ. 2019, 655, 92–101. [Google Scholar] [CrossRef] [PubMed]
- Liang, J.; Huang, H.-R.; Ma, C.-W.; Son, D.-S.; Kim, S.-K. Using the Heavy Metal Indices and Benthic Indices to Assess the Ecological Quality in the Tidal Flats of Garolim Bay, South Korea. Water 2024, 16, 736. [Google Scholar] [CrossRef]
- Liang, J.; Shu, M.; Huang, H.-R.; Ma, C.-W.; Kim, S.-K. Using Benthic Indices to Assess the Ecological Quality of Sandy Beaches and the Impact of Urbanisation on Sandy Beach Ecosystems. J. Mar. Sci. Eng. 2024, 12, 487. [Google Scholar] [CrossRef]
- Jayachandran, P.R.; Jima, M.; Philomina, J.; Bijoy Nandan, S. Assessment of Benthic Macroinvertebrate Response to Anthropogenic and Natural Disturbances in the Kodungallur-Azhikode Estuary, Southwest Coast of India. Environ. Monit. Assess. 2020, 192, 626. [Google Scholar] [CrossRef] [PubMed]
- Zhao, Z.; Liu, Q.; Liao, Y.; Yu, P.; Tang, Y.; Liu, Q.; Shi, X.; Shou, L.; Zeng, J.; Chen, Q.; et al. Ecological Risk Assessment of Trace Metals in Sediments and Their Effect on Benthic Organisms from the South Coast of Zhejiang Province, China. Mar. Pollut. Bull. 2023, 187, 114529. [Google Scholar] [CrossRef] [PubMed]
- Gillett, D.J.; Weisberg, S.B.; Grayson, T.; Hamilton, A.; Hansen, V.; Leppo, E.W.; Pelletier, M.C.; Borja, A.; Cadien, D.; Dauer, D.; et al. Effect of Ecological Group Classification Schemes on Performance of the AMBI Benthic Index in US Coastal Waters. Ecol. Indic. 2015, 50, 99–107. [Google Scholar] [CrossRef]
- Sun, Y.; Chen, B.; Wu, H.; Huang, H.; Ma, Z.; Tang, K. Assessing Benthic Ecological Status in Subtropical Islands, China Using AMBI and Bentix Indices. Estuar. Coast. Shelf Sci. 2018, 207, 345–350. [Google Scholar] [CrossRef]
- Wu, H.-Y.; Fu, S.-F.; Hu, W.-J.; Chen, F.-G.; Cai, X.-Q.; Chen, Q.-H.; Wu, Y.-B. Response of Different Benthic Biotic Indices to Eutrophication and Sediment Heavy Metal Pollution, in Fujian Coastal Water, East China Sea. Chemosphere 2022, 307, 135653. [Google Scholar] [CrossRef]
- Sivaraj, S.; Murugesan, P.; Muthuvelu, S.; Vivekanandan, K.E.; Vijayalakshmi, S. AMBI and M-AMBI Indices as a Robust Tool for Assessing the Effluent Stressed Ecosystem in Nandgaon Coastal Waters, Maharashtra, India. Estuar. Coast. Shelf Sci. 2014, 146, 60–67. [Google Scholar] [CrossRef]
- Zhang, Y.; Lv, Z.; Guan, B.; Liu, Y.; Li, F.; Li, S.; Ma, Y.; Yu, J.; Li, Y. Status of Macrobenthic Community and Its Relationships to Trace Metals and Natural Sediment Characteristics. CLEAN-Soil Air Water 2013, 41, 1027–1034. [Google Scholar] [CrossRef]
- Souza, F.M.; Gilbert, E.R.; Brauko, K.M.; Lorenzi, L.; Machado, E.; Camargo, M.G. Macrobenthic Community Responses to Multiple Environmental Stressors in a Subtropical Estuary. PeerJ 2021, 9, e12427. [Google Scholar] [CrossRef] [PubMed]
- Morgan, A.J.; Kille, P.; Stürzenbaum, S.R. Microevolution and Ecotoxicology of Metals in Invertebrates. Environ. Sci. Technol. 2007, 41, 1085–1096. [Google Scholar] [CrossRef] [PubMed]
- Egorova, K.S.; Ananikov, V.P. Toxicity of Metal Compounds: Knowledge and Myths. Organometallics 2017, 36, 4071–4090. [Google Scholar] [CrossRef]
- Wang, W.-X. Prediction of Metal Toxicity in Aquatic Organisms. Chin. Sci. Bull. 2013, 58, 194–202. [Google Scholar] [CrossRef]
- Keller, A.A.; Adeleye, A.S.; Conway, J.R.; Garner, K.L.; Zhao, L.; Cherr, G.N.; Hong, J.; Gardea-Torresdey, J.L.; Godwin, H.A.; Hanna, S.; et al. Comparative Environmental Fate and Toxicity of Copper Nanomaterials. NanoImpact 2017, 7, 28–40. [Google Scholar] [CrossRef]
- Vareda, J.P.; Valente, A.J.M.; Durães, L. Assessment of Heavy Metal Pollution from Anthropogenic Activities and Remediation Strategies: A Review. J. Environ. Manag. 2019, 246, 101–118. [Google Scholar] [CrossRef] [PubMed]
- Zhou, H.; Yue, X.; Chen, Y.; Liu, Y. Source-Specific Probabilistic Contamination Risk and Health Risk Assessment of Soil Heavy Metals in a Typical Ancient Mining Area. Sci. Total Environ. 2024, 906, 167772. [Google Scholar] [CrossRef]
- Hadzi, G.Y.; Essumang, D.K.; Ayoko, G.A. Assessment of Contamination and Potential Ecological Risks of Heavy Metals in Riverine Sediments from Gold Mining and Pristine Areas in Ghana. J. Trace Elem. Miner. 2024, 7, 100109. [Google Scholar] [CrossRef]
- Zhang, L.; Wong, M.H. Environmental Mercury Contamination in China: Sources and Impacts. Environ. Int. 2007, 33, 108–121. [Google Scholar] [CrossRef]
- Fang, F.; Wang, Q.; Li, J. Urban Environmental Mercury in Changchun, a Metropolitan City in Northeastern China: Source, Cycle, and Fate. Sci. Total Environ. 2004, 330, 159–170. [Google Scholar] [CrossRef]
Figure 1.
Study area and locations of 20 sampling stations in the central area of the East Sea.

Figure 2.
The principal components of the analysis of environmental factors in Samcheok County and Uljin County in winter and spring.
Figure 2.
The principal components of the analysis of environmental factors in Samcheok County and Uljin County in winter and spring.

Figure 3.
The number of macrobenthic species in Samcheok County and Uljin County in winter and spring.
Figure 3.
The number of macrobenthic species in Samcheok County and Uljin County in winter and spring.

Figure 4.
The values of heavy metal indices and ecological risk in Samcheok County and Uljin County in winter (left) and spring (right).
Figure 4.
The values of heavy metal indices and ecological risk in Samcheok County and Uljin County in winter (left) and spring (right).

Figure 5.
The ecological quality of heavy metal concentrations and biotic indices by acceptable and unacceptable percentages in winter and spring.
Figure 5.
The ecological quality of heavy metal concentrations and biotic indices by acceptable and unacceptable percentages in winter and spring.

Figure 6.
The values of biotic indices and EcoQs in Samcheok County and Uljin County in winter (left) and spring (right).
Figure 6.
The values of biotic indices and EcoQs in Samcheok County and Uljin County in winter (left) and spring (right).

Figure 7.
The final ecological quality values map of Samcheok County and Uljin County in winter and spring. Note: Values exceeding four are considered acceptable for the final ecological quality.
Figure 7.
The final ecological quality values map of Samcheok County and Uljin County in winter and spring. Note: Values exceeding four are considered acceptable for the final ecological quality.

Figure 8.
The correlation analysis for heavy metal indices, biotic indices, and environmental factors.
Figure 8.
The correlation analysis for heavy metal indices, biotic indices, and environmental factors.

Table 1.
Algorithmic approaches to heavy metals and categorisation of levels of ecological risk for heavy metal indices.
Table 1.
Algorithmic approaches to heavy metals and categorisation of levels of ecological risk for heavy metal indices.
| Indices | Algorithm | Index Values | Level of Risk | Reference | Note |
|---|---|---|---|---|---|
| PLI | <1 | Unpolluted | [17] | PI is the ratio of heavy metal content in sediments to the geochemical background values. | |
| 1–2 | Moderately polluted | ||||
| 2–3 | Heavily polluted | ||||
| >3 | Extremely polluted | ||||
| Pn | ≤0.7 | Clean | [17] | PI is the ratio of heavy metal content in sediments to the geochemical background values. | |
| 0.7–1 | Warning limit | ||||
| 1–2 | Slight pollution | ||||
| 2–3 | Moderate pollution | ||||
| ≥3 | Heavy pollution | ||||
| RI | <120 | Low ecological risk | [17] | Tr is the potential ecological risk coefficient for heavy metal; PI is the ratio of heavy metal content in sediments to the geochemical background values. | |
| 120–240 | Moderate ecological risk | ||||
| 240–480 | Considerable ecological risk | ||||
| >480 | Very high ecological risk |
Table 3.
Standards for categorising index values as acceptable or unacceptable when assessing ecological quality.
Table 3.
Standards for categorising index values as acceptable or unacceptable when assessing ecological quality.
| Indices | Thresholds | Acceptable/Unacceptable |
|---|---|---|
| PLI | <1 | Acceptable |
| ≥1 | Unacceptable | |
| Pn | <1 | Acceptable |
| ≥1 | Unacceptable | |
| RI | <120 | Acceptable |
| ≥120 | Unacceptable | |
| AMBI | ≤3.3 | Acceptable |
| >3.3 | Unacceptable | |
| BENTIX | >3.5 | Acceptable |
| ≤3.5 | Unacceptable | |
| H’ | ≥3 | Acceptable |
| <3 | Unacceptable | |
| M-AMBI | >0.53 | Acceptable |
| ≤0.53 | Unacceptable |
Table 4.
The environmental characteristics of Samcheok County and Uljin County in winter and spring.
Table 4.
The environmental characteristics of Samcheok County and Uljin County in winter and spring.
| Environmental Factors | Range (Min–Max) | Mean ± SD |
|---|---|---|
| IL, % | 1–10 | 4.76 ± 3.13 |
| COD, mg/g | 0.2–30 | 10.4 ± 10.67 |
| As, mg/kg | 1.91–6.14 | 3.35 ± 1.1 |
| Cd, mg/kg | 0.04–0.33 | 0.124 ± 0.08 |
| Cr, mg/kg | 8.71–66.98 | 43.7 ± 13.93 |
| Cu, mg/kg | 1.83–32.56 | 16.6 ± 9.39 |
| Hg, mg/kg | 0.01–0.06 | 0.022 ± 0.01 |
| Pb, mg/kg | 9.79–32.27 | 20.48 ± 6.11 |
| Zn, mg/kg | 11.27–109.31 | 65.9 ± 25.53 |
Note: IL, ignition loss; COD, chemical oxygen demand.
Disclaimer/Publisher’s Note: The statements, opinions and data contained in all publications are solely those of the individual author(s) and contributor(s) and not of MDPI and/or the editor(s). MDPI and/or the editor(s) disclaim responsibility for any injury to people or property resulting from any ideas, methods, instructions or products referred to in the content. |
© 2024 by the authors. Licensee MDPI, Basel, Switzerland. This article is an open access article distributed under the terms and conditions of the Creative Commons Attribution (CC BY) license (https://creativecommons.org/licenses/by/4.0/).
Share and Cite
MDPI and ACS Style
Liang, J.; Ma, C.-W.; Son, D.-S. Using the Heavy Metal and Biotic Indices to Assess Ecological Quality in the Central Area of the East Sea, South Korea. Water 2024, 16, 1230. https://0-doi-org.brum.beds.ac.uk/10.3390/w16091230
AMA Style
Liang J, Ma C-W, Son D-S. Using the Heavy Metal and Biotic Indices to Assess Ecological Quality in the Central Area of the East Sea, South Korea. Water. 2024; 16(9):1230. https://0-doi-org.brum.beds.ac.uk/10.3390/w16091230
Chicago/Turabian StyleLiang, Jian, Chae-Woo Ma, and Dae-Sun Son. 2024. "Using the Heavy Metal and Biotic Indices to Assess Ecological Quality in the Central Area of the East Sea, South Korea" Water 16, no. 9: 1230. https://0-doi-org.brum.beds.ac.uk/10.3390/w16091230
Note that from the first issue of 2016, this journal uses article numbers instead of page numbers. See further details here.